
Wind Environment Simulation and Optimisation Strategies for Block Spatial Forms in Cold Low Mountainous Areas—A Case Study of Changchun, China

Abstract
:1. Introduction
2. Data and Methods
2.1. Research Data
2.1.1. Meteorological Data
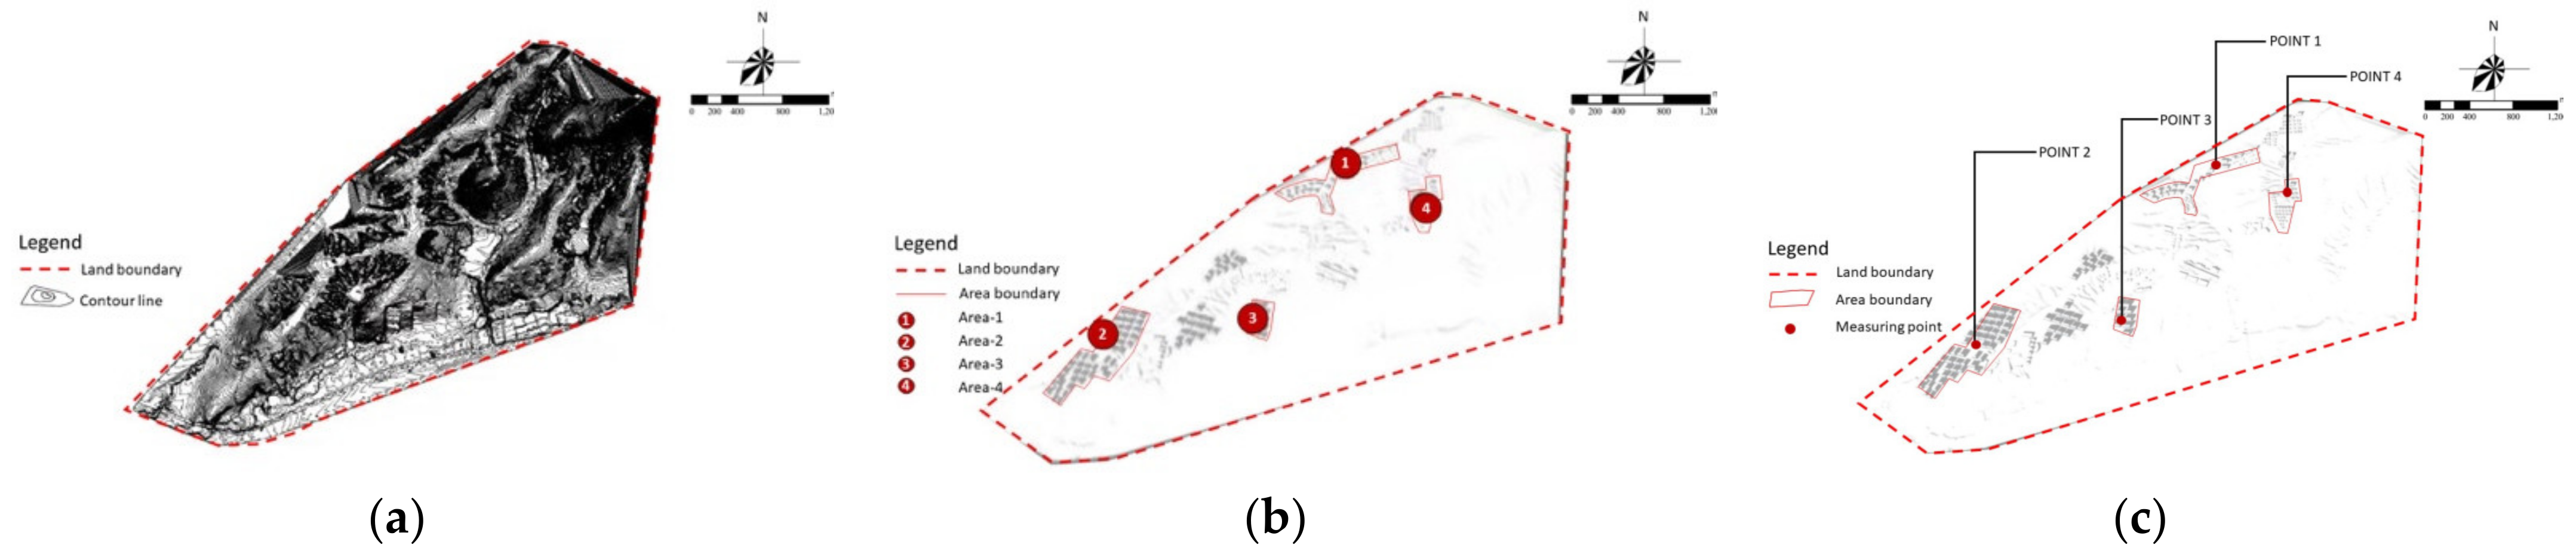
2.1.2. Geographic Information Data
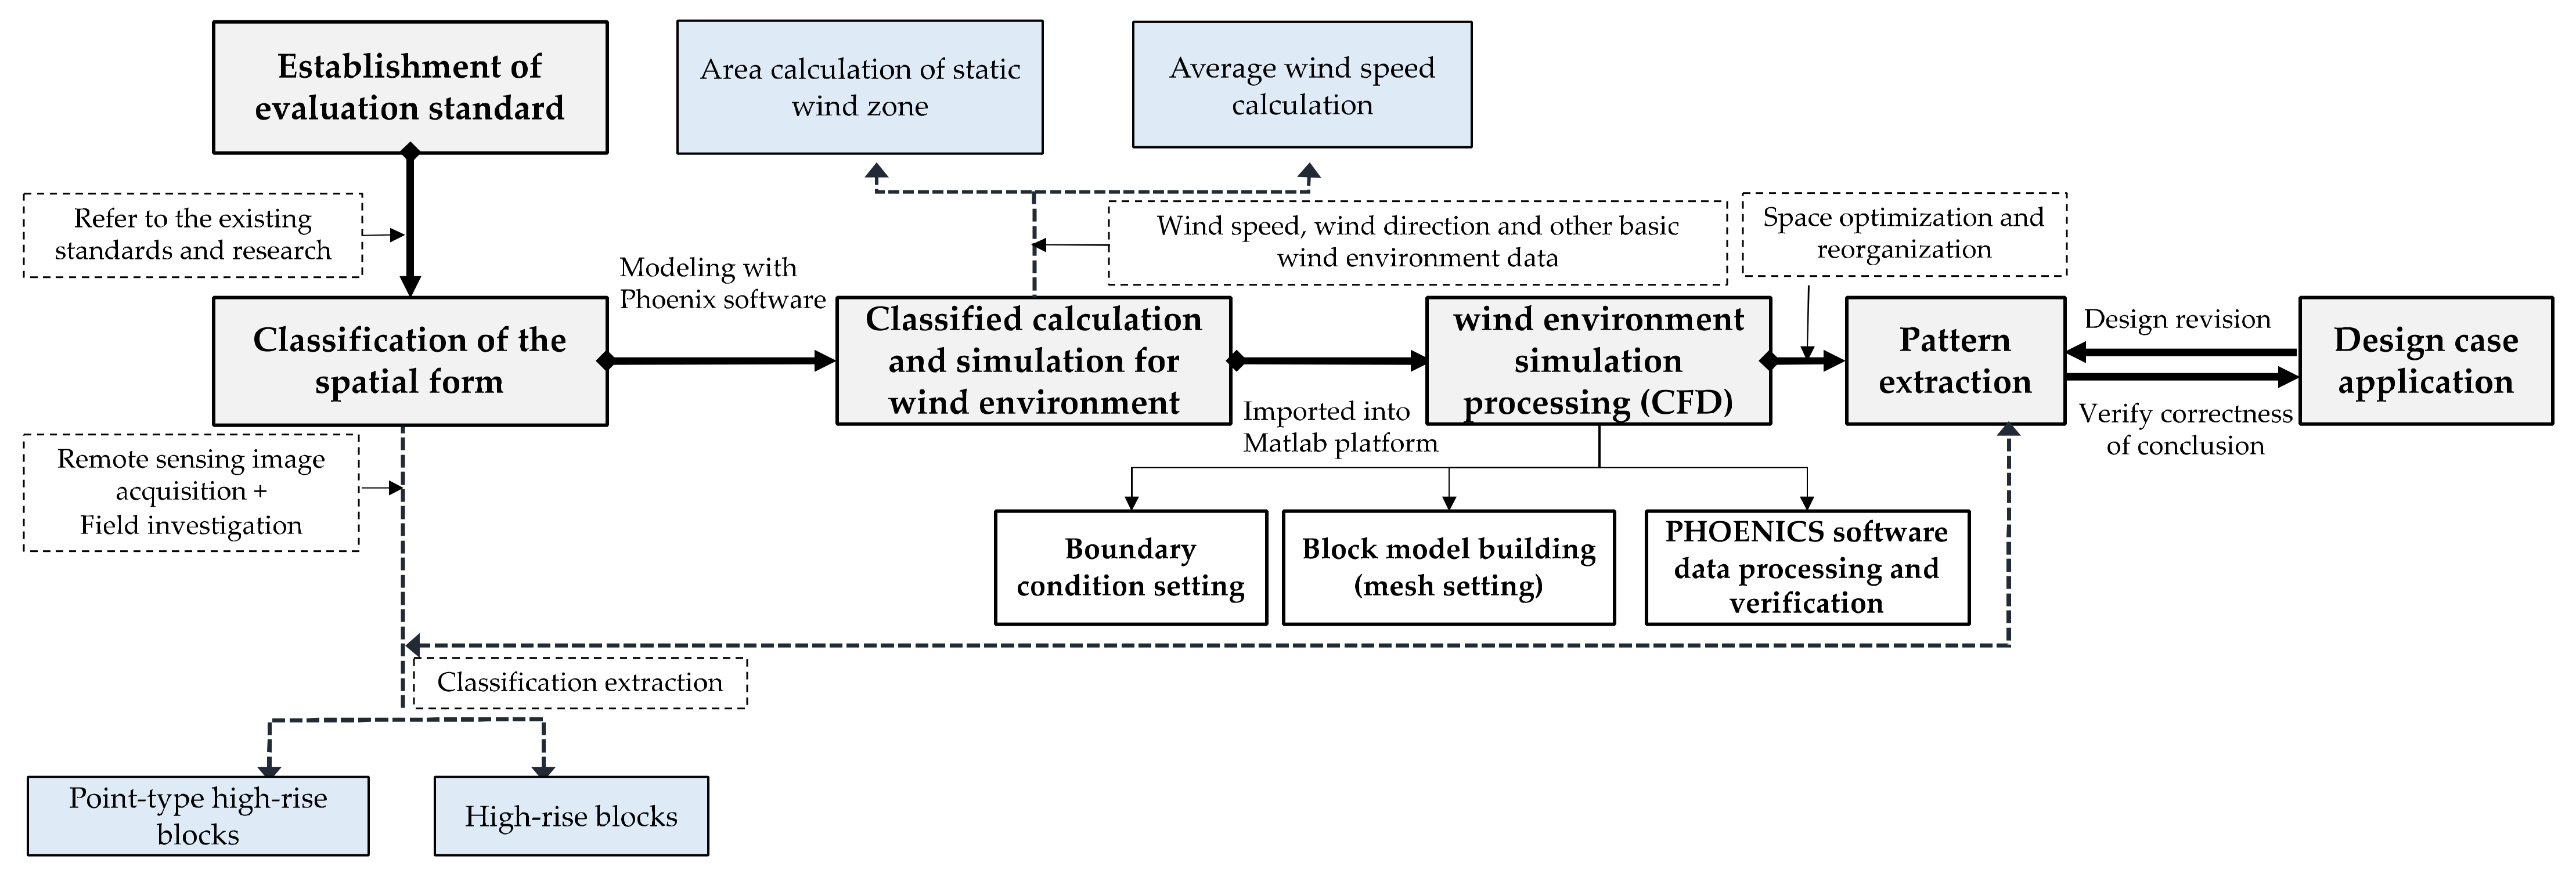
2.2. Research Method
2.2.1. Research Outline
2.2.2. Classification of the Spatial Form
2.2.3. Methods of Evaluation and Calculation
3. Results and Discussion
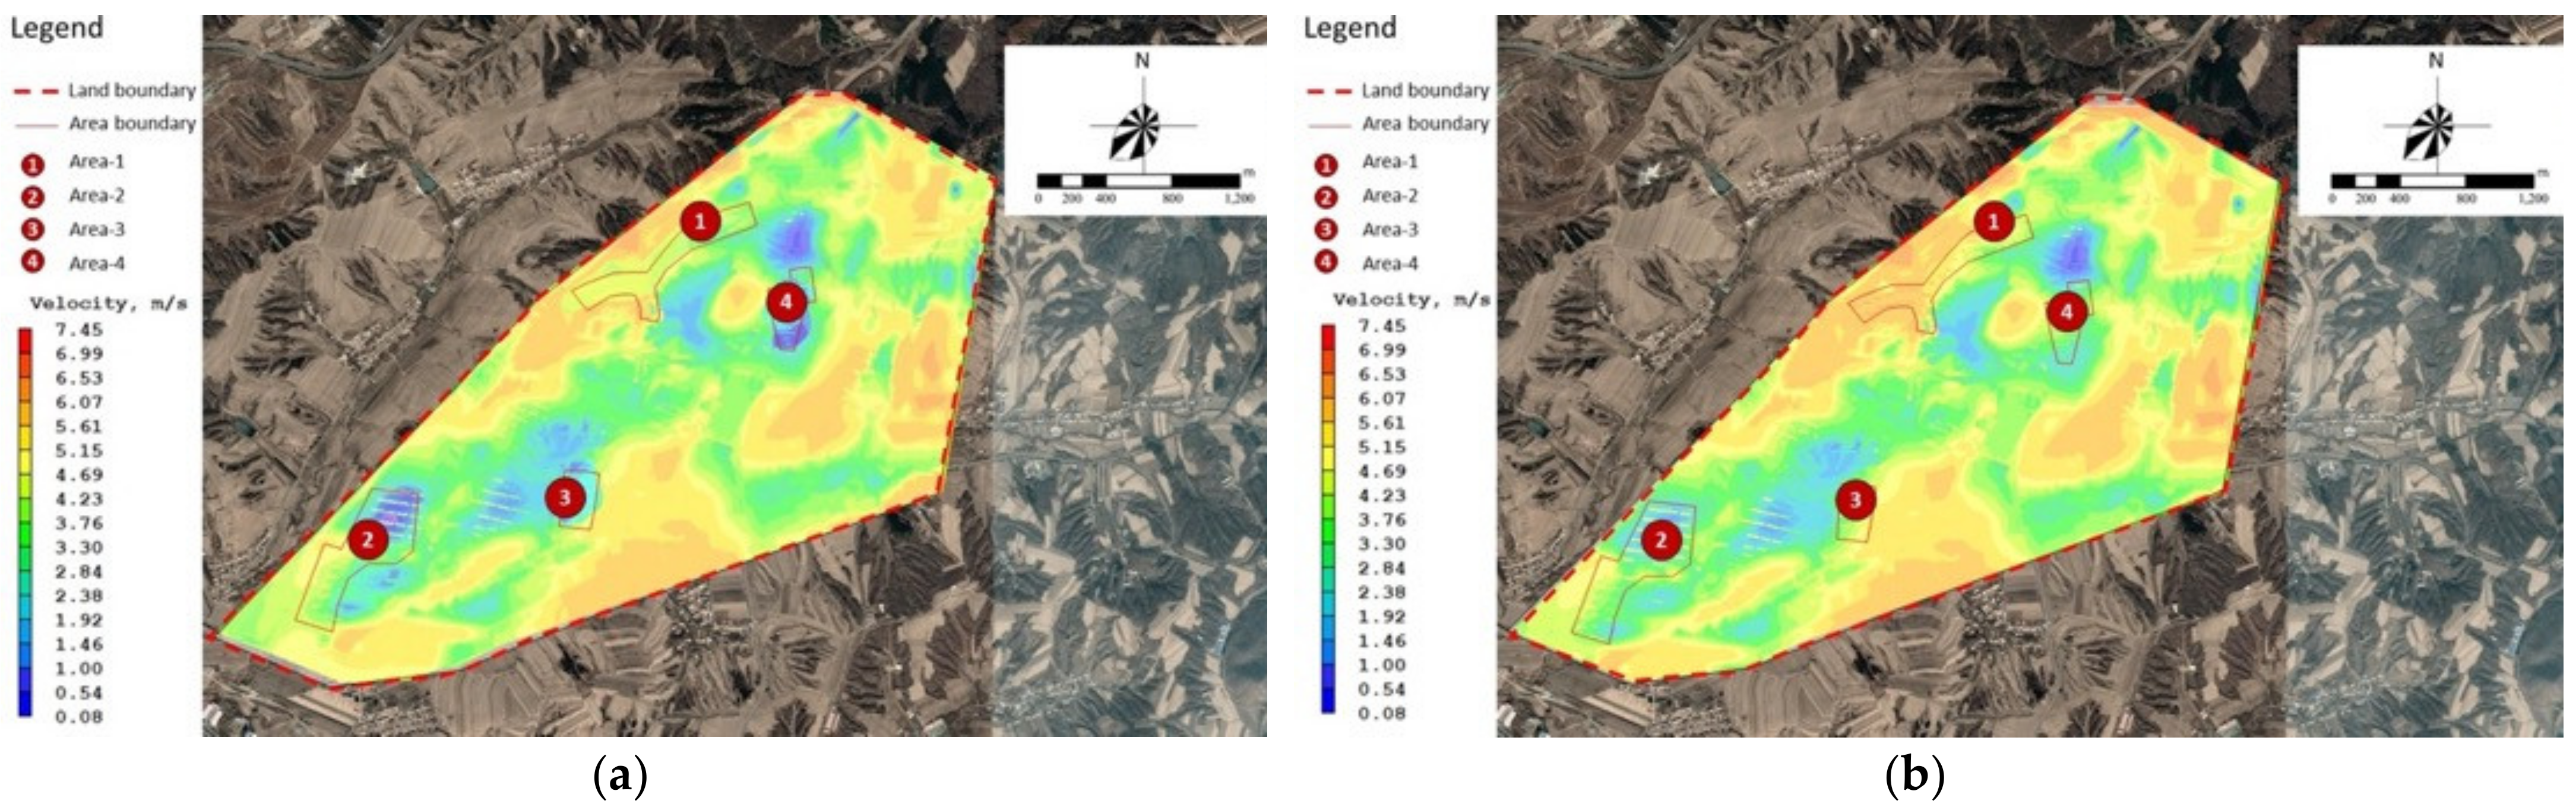
3.1. Wind Environment Simulation Results
3.2. Analysis of Simulation Results
3.2.1. General Relationship between Wind Environment and Block Spatial Form
3.2.2. Optimisation Strategy
3.3. Application of Strategy in Urban Space Planning and Design
4. Conclusions
Author Contributions
Funding
Institutional Review Board Statement
Informed Consent Statement
Data Availability Statement
Conflicts of Interest
Appendix A

| RHD | 1.5 m | 10 m | 20 m |
|---|---|---|---|
| 1:4 |  | ||
| WAS: 2.84 m/s SCA: 19.6% | WAS: 2.97 m/s SCA: 18.9% | WAS: 3.46 m/s SCA: 17.3% | |
| 1:3 |  | ||
| WAS: 2.89 m/s SCA: 20.2% | WAS: 3.12 m/s SCA: 19.4% | WAS: 3.51 m/s SCA: 17.8% | |
| 1:2 | 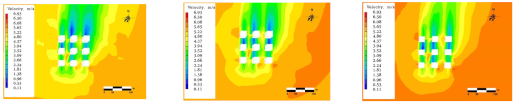 | ||
| WAS: 2.94 m/s SCA: 19.3% | WAS: 3.45 m/s SCA: 18.7% | WAS: 3.71 m/s SCA: 16.0% | |
| 1:1 |  | ||
| WAS: 3.01 m/s SCA: 20.4% | WAS: 3.51 m/s SCA: 19.8% | WAS: 3.80 m/s SCA: 17.1% | |
| RHD | 1.5 m | 10 m | 20 m |
|---|---|---|---|
| 1:4 | 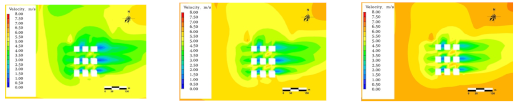 | ||
| WAS: 2.61 m/s SCA: 27.3% | WAS: 2.85 m/s SCA: 24.9% | WAS: 2.91 m/s SCA: 20.0% | |
| 1:3 | 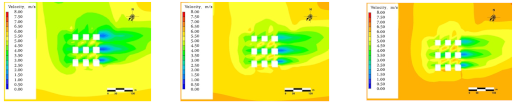 | ||
| WAS: 2.70 m/s SCA: 27.7% | WAS: 2.87 m/s SCA: 25.4% | WAS: 2.97 m/s SCA: 22.5% | |
| 1:2 | 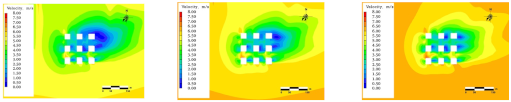 | ||
| WAS: 2.74 m/s SCA: 29.3% | WAS: 2.87 m/s SCA: 28.9% | WAS: 3.00 m/s SCA: 23.1% | |
| 1:1 |  | ||
| WAS: 3.01 m/s SCA: 30.4% | WAS: 3.13 m/s SCA: 29.8% | WAS: 3.22 m/s SCA: 27.1% | |
| RHD | 1.5 m | 10 m | 20 m |
|---|---|---|---|
| 1:4 |  | ||
| WAS: 2.63 m/s SCA: 20.3% | WAS: 2.77 m/s SCA: 19.9% | WAS: 2.86 m/s SCA: 17.1% | |
| 1:3 |  | ||
| WAS: 2.79 m/s SCA: 23.7% | WAS: 2.92 m/s SCA: 20.4% | WAS: 3.11 m/s SCA: 20.0% | |
| 1:2 | 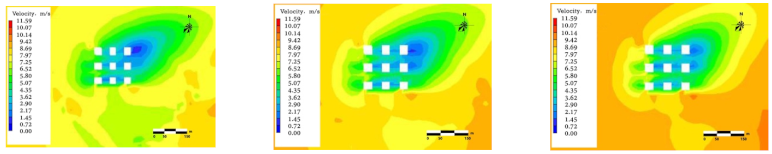 | ||
| WAS: 2.84 m/s SCA: 25.3% | WAS: 2.99 m/s SCA: 22.9% | WAS: 3.22 m/s SCA: 21.0% | |
| 1:1 | 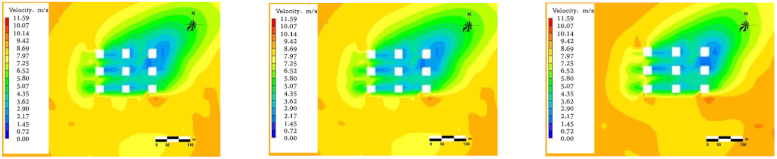 | ||
| WAS: 3.01 m/s SCA: 26.4% | WAS: 3.21 m/s SCA: 25.8% | WAS: 3.30 m/s SCA: 24.1% | |
| RHD | 1.5 m | 10 m | 20 m |
|---|---|---|---|
| 1:4 | 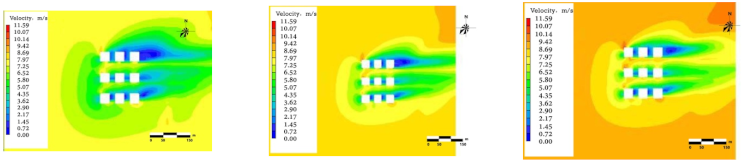 | ||
| WAS: 2.54 m/s SCA: 25.3% | WAS: 2.77 m/s SCA: 23.9% | WAS: 2.96 m/s SCA: 17.0% | |
| 1:3 | 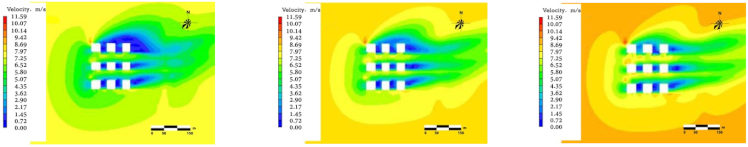 | ||
| WAS: 2.69 m/s SCA: 27.7% | WAS: 2.72 m/s SCA: 25.4% | WAS: 3.01 m/s SCA: 20.0% | |
| 1:2 |  | ||
| WAS: 2.84 m/s SCA: 26.3% | WAS: 2.97 m/s SCA: 24.9% | WAS: 3.01 m/s SCA: 22.0% | |
| 1:1 | 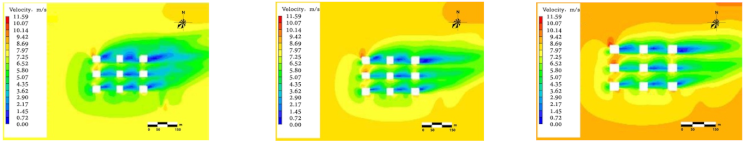 | ||
| WAS: 2.97 m/s SCA: 27.4% | WAS: 3.11 m/s SCA: 24.8% | WAS: 3.20 m/s SCA: 23.1% | |
| Building Height | 1.5 m | 10 m | 20 m |
|---|---|---|---|
| 20 m |  | ||
| WAS: 2.84 m/s SCA: 24.3% | WAS: 2.97 m/s SCA: 23.9% | WAS: 3.06 m/s SCA: 18.2% | |
| 40 m | 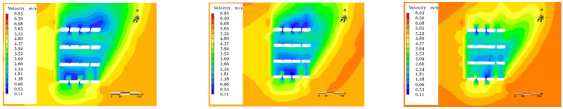 | ||
| WAS: 2.89 m/s SCA: 23.7% | WAS: 3.11 m/s SCA: 22.4% | WAS: 3.19 m/s SCA: 17.6% | |
| 80 m | 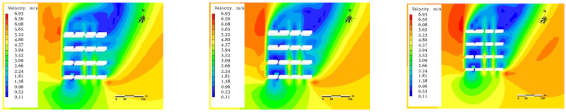 | ||
| WAS: 2.94 m/s SCA: 21.3% | WAS: 3.18 m/s SCA: 20.7% | WAS: 3.24 m/s SCA: 16.5% | |
| Building Height | 1.5 m | 10 m | 20 m |
|---|---|---|---|
| 20 m |  | ||
| WAS: 2.54 m/s SCA: 27.1% | WAS: 2.77 m/s SCA: 25.9% | WAS: 2.86 m/s SCA: 23.7% | |
| 40 m | 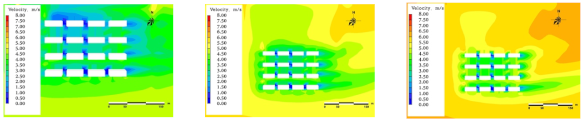 | ||
| WAS: 2.59 m/s SCA: 25.7% | WAS: 2.92 m/s SCA: 23.4% | WAS: 3.11 m/s SCA: 22.0% | |
| 80 m |  | ||
| WAS: 2.54 m/s SCA: 24.3% | WAS: 2.77 m/s SCA: 22.9% | WAS: 2.86 m/s SCA: 20.1% | |
| Building Height | 1.5 m | 10 m | 20 m |
|---|---|---|---|
| 20 m | 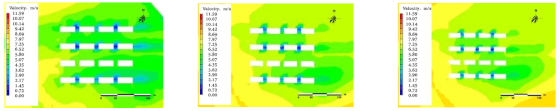 | ||
| WAS: 2.74 m/s SCA: 25.2% | WAS: 2.87 m/s SCA: 24.1% | WAS: 2.96 m/s SCA: 21.0% | |
| 40 m | 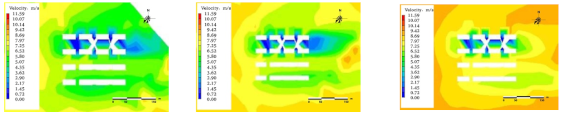 | ||
| WAS: 2.89 m/s SCA: 22.7% | WAS: 2.92 m/s SCA: 21.4% | WAS: 3.11 m/s SCA: 19.7% | |
| 80 m |  | ||
| WAS: 2.99 m/s SCA: 20.3% | WAS: 3.17 m/s SCA: 19.7% | WAS: 3.27 m/s SCA: 18.0% | |
| Building Height | 1.5 m Height | 10 m Height | 20 m Height |
|---|---|---|---|
| 20 m | 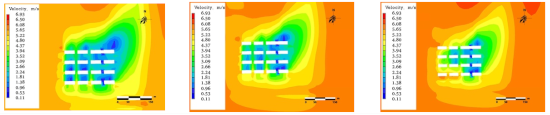 | ||
| WAS: 2.78 m/s SCA: 13.3% | WAS: 2.95 m/s SCA: 11.5%% | WAS: 3.04 m/s SCA: 14.2% | |
| 40 m |  | ||
| WAS: 2.61 m/s SCA: 11.5% | WAS: 2.71 m/s SCA: 10.5% | WAS: 2.95 m/s SCA: 9.3% | |
| 80 m | 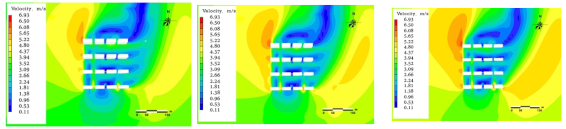 | ||
| WAS: 2.66 m/s SCA: 1.4% | WAS: 2.84 m/s SCA: 1.3% | WAS: 3.01 m/s SCA: 1.0% | |
References
- Yu, K.; Yuan, H.; Li, D.; Wang, S.; Qiao, Q. Difficulties and solutions of sustainable land use in shallow hilly area of Beijing. China Land Sci. 2009, 23, 3–8, 20. [Google Scholar]
- Bai, L.; Xiu, C.; Feng, X.; Liu, D. Influence of urbanization on regional habitat quality: A case study of Changchun City. Habitat Int. 2019, 93, 102042. [Google Scholar] [CrossRef]
- Li, G.; Jiang, C.; Du, J.; Jia, Y.; Bai, J. Spatial differentiation characteristics of internal ecological land structure in rural settlements and its response to natural and socio-economic conditions in the Central Plains, China. Sci. Total Environ. 2020, 709, 135932. [Google Scholar] [CrossRef]
- Kaur, H.; Garg, P. City profile: New Tehri. Cities 2020, 102, 102718. [Google Scholar] [CrossRef]
- Wang, F.; Wang, Y. Potential role of local contributions to record-breaking high-temperature event in Xiamen, China. Weather Clim. Extrem. 2021, 33, 100338. [Google Scholar] [CrossRef]
- Chen, Z.; Liu, Y.; Feng, W.; Li, Y.; Li, L. Study on spatial tropism distribution of rural settlements in the Loess Hilly and Gully Region based on natural factors and traffic accessibility. J. Rural Stud. 2019, 2, 14. [Google Scholar] [CrossRef]
- Liu, J.; Niu, J. CFD simulation of the wind environment around an isolated high-rise building: An evaluation of SRANS, LES and DES models. Build. Environ. 2016, 96, 91–106. [Google Scholar] [CrossRef]
- Kikumoto, H.; Choi, W.; Ooka, R. Development of probabilistic assessment framework for pedestrian wind environment using Bayesian technique. Build. Environ. 2021, 187, 107419. [Google Scholar] [CrossRef]
- Weerasuriya, A.U.; Hu, Z.Z.; Zhang, X.L.; Tse, K.T.; Li, S.; Chan, P.W. New inflow boundary conditions for modeling twisted wind profiles in CFD simulation for evaluating the pedestrian-level wind field near an isolated building. Build. Environ. 2018, 132, 303–318. [Google Scholar] [CrossRef]
- Zhang, S.; Kwok, K.C.S.; Liu, H.; Jiang, Y.; Dong, K.; Wang, B. A CFD study of wind assessment in urban topology with complex wind flow. Sustain. Cities Soc. 2021, 71, 103006. [Google Scholar] [CrossRef]
- Buccolieri, R.; Sandberg, M.; Di Sabatino, S. City breathability and its link to pollutant concentration distribution within urban-like geometries. Atmos. Environ. 2010, 44, 1894–1903. [Google Scholar] [CrossRef]
- Hang, J.; Wang, Q.; Chen, X.; Sandberg, M.; Zhu, W.; Buccolieri, R.; Di Sabatino, S. City breathability in medium density urban-like geometries evaluated through the pollutant transport rate and the net escape velocity. Build. Environ. 2015, 94, 166–182. [Google Scholar] [CrossRef]
- Hågbo, T.; Giljarhus, K.E.T.; Hjertager, B.H. Influence of geometry acquisition method on pedestrian wind simulations. J. Wind Eng. Ind. Aerodyn. 2021, 215, 104665. [Google Scholar] [CrossRef]
- Du, Y.; Mak, C.M.; Kwok, K.; Tse, K.T.; Lee, T.; Ai, Z.; Liu, J.; Niu, J. New criteria for assessing low wind environment at pedestrian level in Hong Kong. Build. Environ. 2017, 123, 23–36. [Google Scholar] [CrossRef] [Green Version]
- Acero, J.A.; Arrizabalaga, J.; Kupski, S.; Katzschner, L. Deriving an Urban Climate Map in Coastal Areas with Complex Terrain in the Basque Country (Spain). Urban Clim. 2013, 4, 35–60. [Google Scholar] [CrossRef]
- Hassan, A.M.; Megahed, N.A. COVID-19 and urban spaces: A new integrated CFD approach for public health opportunities. Build. Environ. 2021, 204, 108131. [Google Scholar] [CrossRef]
- Jing, Y.; Zhong, H.; Wang, W.; He, Y.; Zhao, F.; Li, Y. Quantitative city ventilation evaluation for urban canopy under heat island circulation without geostrophic winds: Multi-scale CFD model and parametric investigations. Build. Environ. 2021, 196, 107793. [Google Scholar] [CrossRef]
- Yuan, C.; Adelia, A.S.; Mei, S.; He, W.; Li, X.; Norford, L. Mitigating intensity of urban heat island by better understanding on urban morphology and anthropogenic heat dispersion. Build. Environ. 2020, 176, 106876. [Google Scholar] [CrossRef]
- Kubota, T.; Miura, M.; Tominaga, Y.; Mochida, A. Wind tunnel tests on the relationship between building density and pedestrian-level wind velocity: Development of guidelines for realizing acceptable wind environment in residential neighborhoods. Build. Environ. 2008, 43, 1699–1708. [Google Scholar] [CrossRef]
- Li, Z.; Luo, D.; Shi, W.; Li, Z.; Liang, X. Field measurement of wind-induced stress on glass facade of a coastal high-rise building. Sci. China Technol. 2011, 54, 2587. [Google Scholar] [CrossRef]
- Jia, S.; Wang, Y. Effect of heat mitigation strategies on thermal environment, thermal comfort, and walkability: A case study in Hong Kong. Build. Environ. 2021, 201, 107988. [Google Scholar] [CrossRef]
- Aflaki, A.; Mirnezhad, M.; Ghaffarianhoseini, A.; Ghaffarianhoseini, A.; Omrany, H.; Wang, Z.; Akbari, H. Urban heat island mitigation strategies: A state-of-the-art review on Kuala Lumpur, Singapore and Hong Kong. Cities 2017, 62, 131–145. [Google Scholar] [CrossRef] [Green Version]
- Yoshie, R.; Mochida, A.; Tominaga, Y.; Kataoka, H.; Harimoto, K.; Nozu, T.; Shirasawa, T. Cooperative project for CFD prediction of pedestrian wind environment in the Architectural Institute of Japan. J. Wind Eng. Ind. Aerodyn. 2007, 95, 1551–1578. [Google Scholar] [CrossRef]
- Huang, S.; Li, Q.S.; Xu, S. Numerical evaluation of wind effects on a tall steel building by CFD. J. Constr. Steel Res. 2007, 63, 612–627. [Google Scholar] [CrossRef]
- Krastev, V.; Silvestri, L.; Bella, G. Effects of Turbulence Modeling and Grid Quality on the Zonal URANS/LES Simulation of Static and Reciprocating Engine-Like Geometries. SAE Int. J. Engines 2018, 11, 669–686. [Google Scholar] [CrossRef]
- Stefan, H. A review of hybrid RANS-LES methods for turbulent flows: Concepts and applications. Prog. Aerosp. Sci. 2020, 114, 100697. [Google Scholar]
- Mei, S.; Luo, Z.; Zhao, F.; Wang, H. Street canyon ventilation and airborne pollutant dispersion: 2-D versus 3-D CFD simulations. Sustain. Cities Soc. 2019, 50, 101700. [Google Scholar] [CrossRef]
- Peng, Y.; Gao, Z.; Buccolieri, R.; Shen, J.; Ding, W. Urban ventilation of typical residential streets and impact of building form variation. Sustain. Cities Soc. 2021, 67, 102735. [Google Scholar] [CrossRef]
- Hadavi, M.; Pasdarshahri, H. Quantifying impacts of wind speed and urban neighborhood layout on the infiltration rate of residential buildings. Sustain. Cities Soc. 2020, 53, 101887. [Google Scholar] [CrossRef]
- Ramponi, R.; Blocken, B.; De Coo, L.B.; Janssen, W.D. CFD simulation of outdoor ventilation of generic urban configurations with different urban densities and equal and unequal street widths. Build. Environ. 2015, 92, 152–166. [Google Scholar] [CrossRef] [Green Version]
- Ma, T.; Chen, T. Classification and pedestrian-level wind environment assessment among Tianjin’s residential area based on numerical simulation. Urban. Clim. 2020, 34, 100702. [Google Scholar] [CrossRef]
- Johansson, E.; Emmanuel, R. The influence of urban design on outdoor thermal comfort in the hot, humid city of Colombo, Sri Lanka. Int. J. Biometeorol. 2006, 51, 119–133. [Google Scholar] [CrossRef]
- Xu, M.; Hong, B.; Mi, J.; Yan, S. Outdoor thermal comfort in an urban park during winter in cold regions of China. Sustain. Cities Soc. 2018, 43, 208–220. [Google Scholar] [CrossRef]
- Guo, F.; Zhu, P.; Wang, S.; Duan, D.; Jin, Y. Improving Natural Ventilation Performance in a High-Density Urban District: A Building Morphology Method. Procedia Eng. 2017, 205, 952–958. [Google Scholar] [CrossRef]
- Gamero-Salinas, J.; Kishnani, N.; Monge-Barrio, A.; López-Fidalgo, J.; Sánchez-Ostiz, A. The influence of building form variables on the environmental performance of semi-outdoor spaces. A study in mid-rise and high-rise buildings of Singapore. Energy Build. 2021, 230, 110544. [Google Scholar] [CrossRef]
- Liu, J.; Niu, J.; Du, Y.; Mak, C.; Zhang, Y. LES for pedestrian level wind around an idealized building array—Assessment of sensitivity to influencing parameters. Sustain. Cities Soc. 2019, 44, 406–415. [Google Scholar] [CrossRef]
- Cao, Q.; Luan, Q.; Liu, Y.; Wang, R. The effects of 2D and 3D building morphology on urban environments: A multi-scale analysis in the Beijing metropolitan region. Build. Environ. 2021, 192, 107635. [Google Scholar] [CrossRef]
- Ping, Z.S. Optimization and CFD Analysis of Urban Wind Environment Based on “Source Flow Sink” Theory; Tianjin University: Tianjin, China, 2016. [Google Scholar]
- Yangyang, Q. Numerical Simulation of the Influence of Underlying Surface Obstacles on Observation Environment; Nanjing University of Information Engineering: Nanjing, China, 2013. [Google Scholar]
- Yuhang, D. Research on Wind Environment of Courtyards with Different Enclosure; Guangzhou University: Guangzhou, China, 2019. [Google Scholar]
- Liu, Q.; Liu, B.; Wang, X.; Wang, F.; Wang, C.; Bureau, C. Application of WRF-ARW model in simulation of urban heat island in Beijing. Sci. Technol. Eng. 2014, 14, 146–151, 164. [Google Scholar]
- Richards, P.J.; Hoxey, R.P. Appropriate boundary conditions for computational wind engineering models using the k-ε turbulence model. J. Wind. Eng. Ind. Aerodyn. 1993, 46, 145–153. [Google Scholar] [CrossRef]
- Michael, D.G.; Everett, J.; John, D.A. A computational fluid dynamic technique valid at the centerline for non-axisymmetric problems in cylindrical coordinates. J. Comput. Phys. 1979, 30, 352–360. [Google Scholar]
- Yaxin, W.; Jing, Z. Discussion on the Demonstration Method of Height Adjustment Based on Wind Environment Optimization-Taking the Demonstration of Height Adjustment of Fudi Yuxiang Mountainous in Tianfu New Area of Sichuan Province as an Example; Chinese Society of Urban Planning: Beijing, China, 2016; p. 15. [Google Scholar]
- Jin, H.; Liu, S.; Kang, J. Gender differences in thermal comfort on pedestrian streets in cold and transitional seasons in severe cold regions in China. Build. Environ. 2020, 168, 106488. [Google Scholar] [CrossRef]


| Wind Speed (m/s) | Human Feeling |
|---|---|
| 1 < V < 5 | Comfortable |
| 5 < V < 10 | Uncomfortable, movement affected |
| 10 < V < 15 | Very uncomfortable, movement is severely affected |
| 15 < V < 20 | Cannot stand |
| V > 20 | Danger |
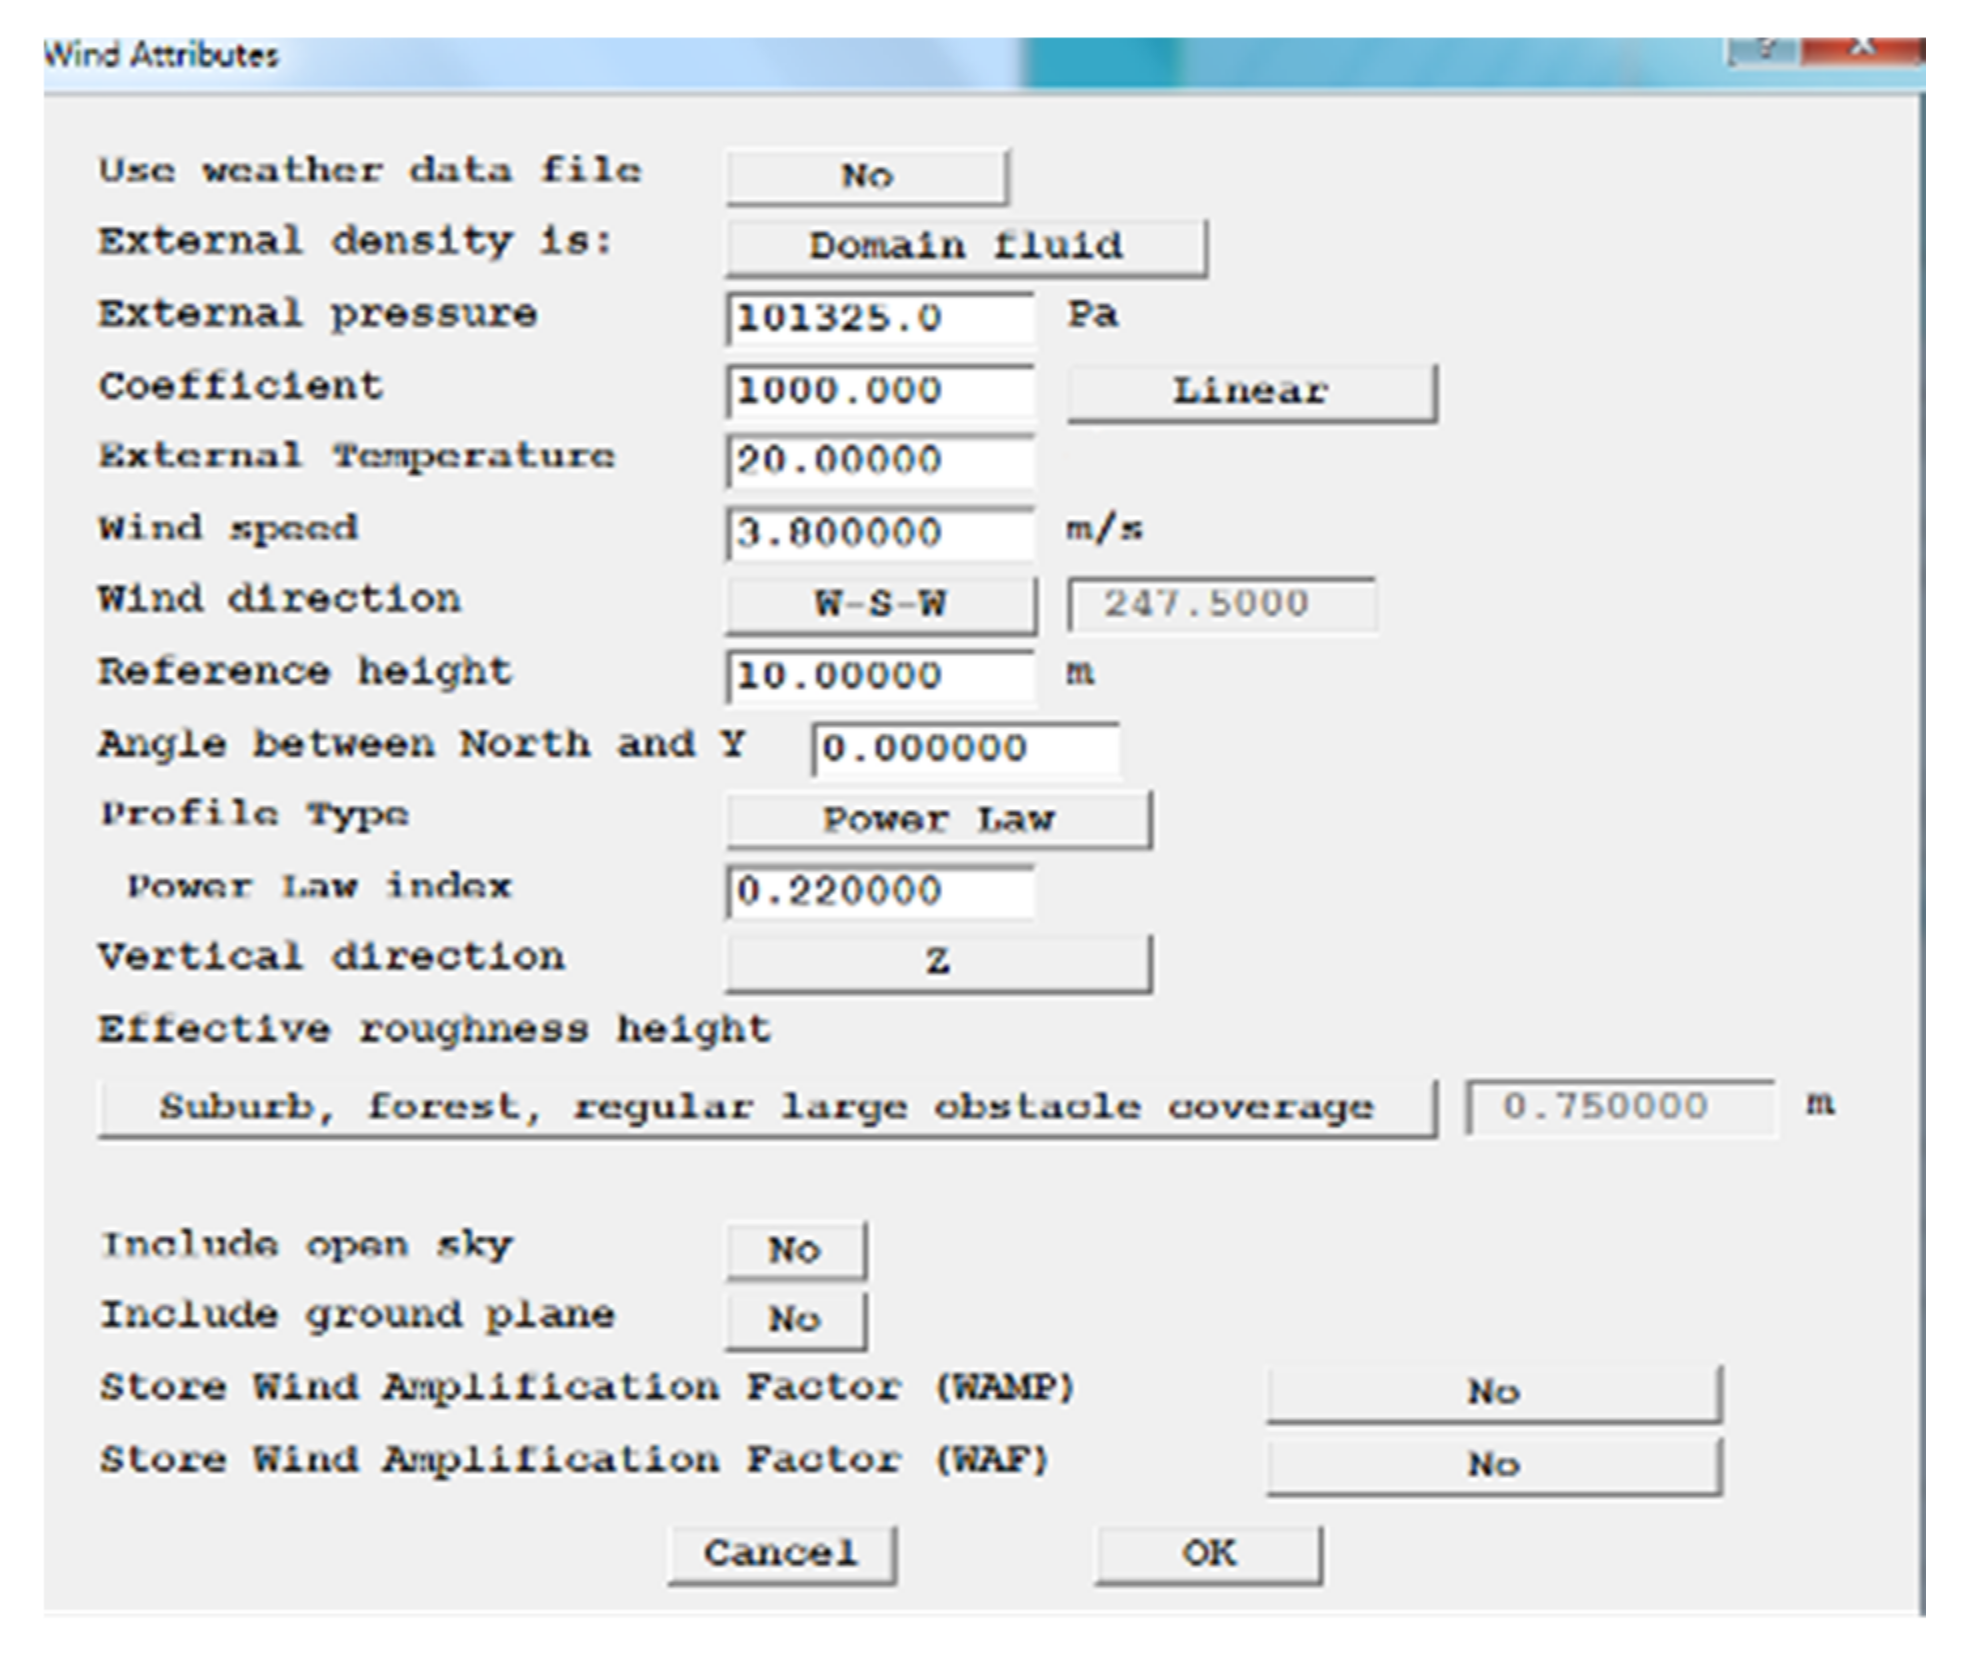
| Classification | Area Type | α Value |
|---|---|---|
| A | Coastal areas, islands, lakeshore, or desert areas | 0.12 |
| B | Fields, villages or small and medium-sized cities with sparse houses and suburbs of large cities | 0.16 |
| C | Urban area with dense buildings | 0.22 |
| D | Urban area with extremely dense and high buildings | 0.30 |
| Slope Type | RHD | At a Height of 1.5 m | At a Height of 10 m | At a Height of 20 m | |||
|---|---|---|---|---|---|---|---|
| WAS (m/s) | SCA % | WAS (m/s) | SCA % | WAS (m/s) | SCA % | ||
| Southeast aspect | 1:4 | 2.84 | 19.6 | 2.97 | 18.9 | 3.46 | 17.3 |
| 1:3 | 2.89 | 20.2 | 3.12 | 19.4 | 3.51 | 17.8 | |
| 1:2 | 2.94 | 19.3 | 3.45 | 18.7 | 3.71 | 16.0 | |
| 1:1 | 3.01 | 20.4 | 3.51 | 19.8 | 3.80 | 17.1 | |
| South aspect | 1:4 | 2.61 | 27.3 | 2.85 | 24.9 | 2.91 | 20.0 |
| 1:3 | 2.70 | 27.7 | 2.87 | 25.4 | 2.97 | 22.5 | |
| 1:2 | 2.74 | 29.3 | 2.87 | 28.9 | 3.00 | 23.1 | |
| 1:1 | 3.01 | 30.4 | 3.13 | 29.8 | 3.22 | 27.1 | |
| Southwest aspect | 1:4 | 2.63 | 20.3 | 2.77 | 19.9 | 2.86 | 17.1 |
| 1:3 | 2.79 | 23.7 | 2.92 | 20.4 | 3.11 | 20.0 | |
| 1:2 | 2.84 | 25.3 | 2.99 | 22.9 | 3.22 | 21.0 | |
| 1:1 | 3.01 | 26.4 | 3.21 | 25.8 | 3.30 | 24.1 | |
| West aspect | 1:4 | 2.54 | 25.3 | 2.77 | 23.9 | 2.96 | 17.0 |
| 1:3 | 2.69 | 27.7 | 2.72 | 25.4 | 3.01 | 20.0 | |
| 1:2 | 2.84 | 26.3 | 2.97 | 24.9 | 3.01 | 22.0 | |
| 1:1 | 2.97 | 27.4 | 3.11 | 24.8 | 3.20 | 23.1 | |
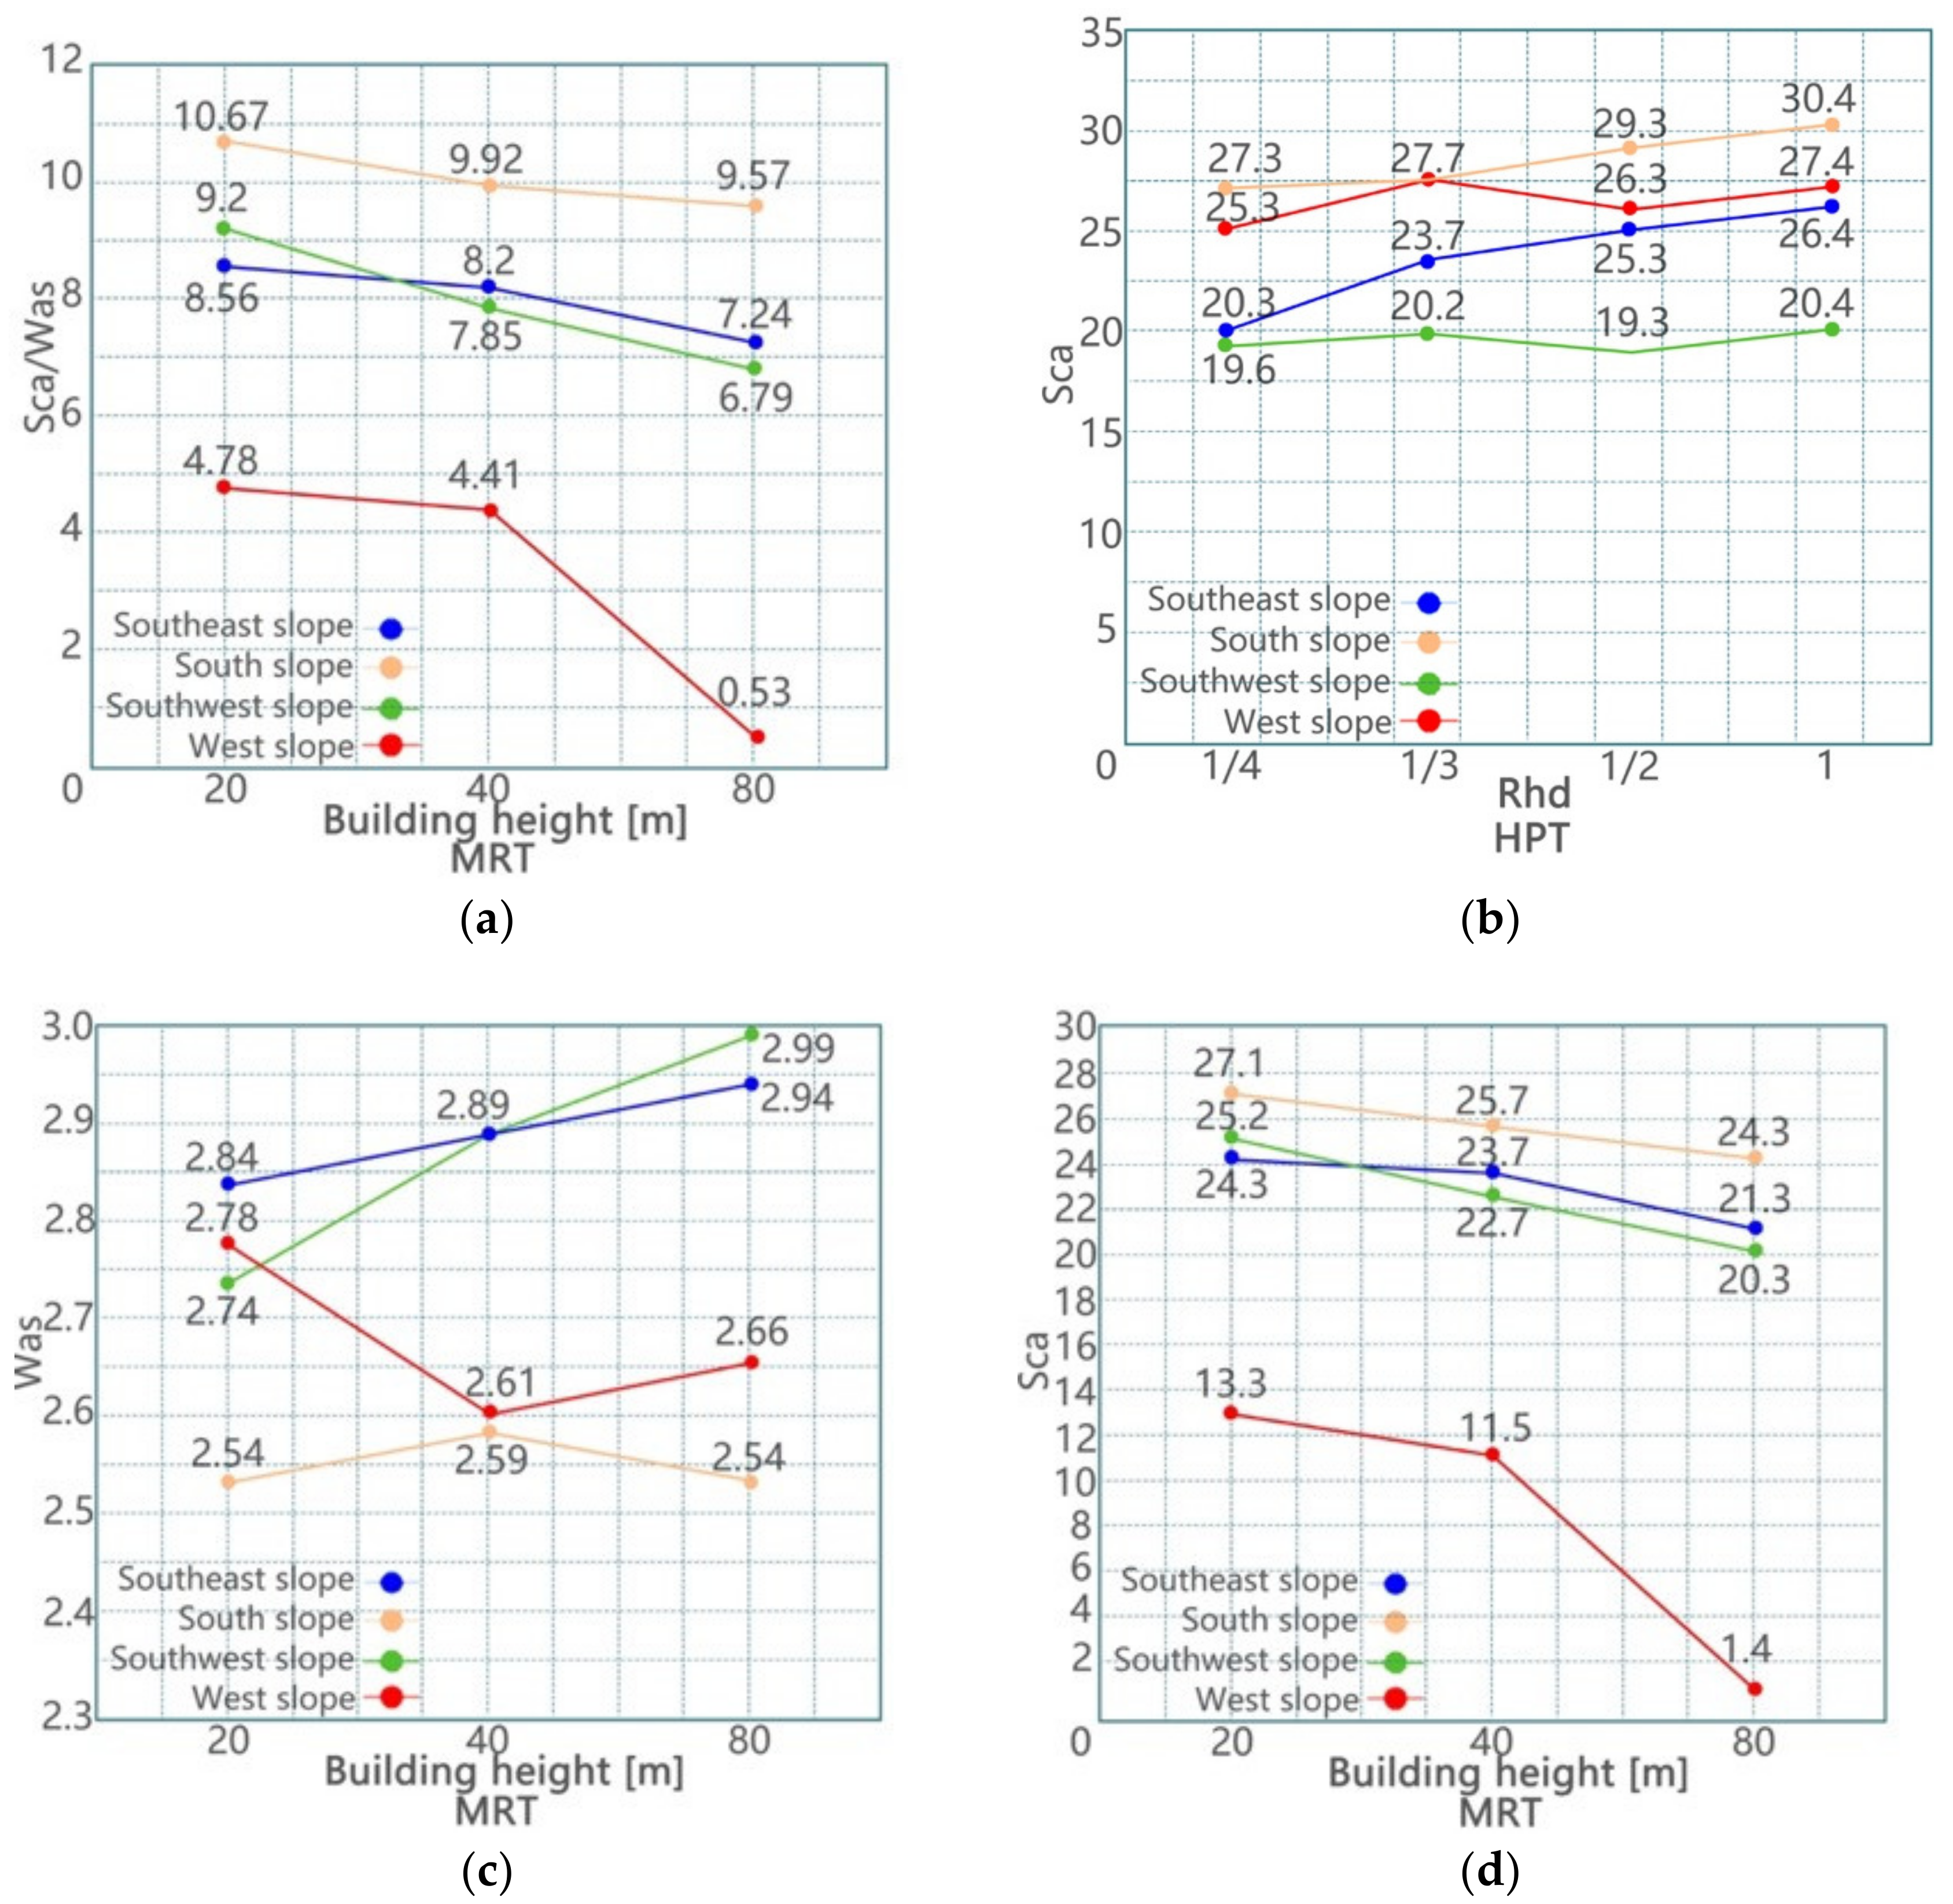
| Slope Type | Building Height (m) | At a Height of 1.5 m | At a Height of 10 m | At a Height of 20 m | |||
|---|---|---|---|---|---|---|---|
| WAS (m/s) | SCA % | WAS (m/s) | SCA % | WAS (m/s) | SCA % | ||
| Southeast aspect | 20 | 2.84 | 24.3 | 2.97 | 23.9 | 3.06 | 18.2 |
| 40 | 2.89 | 23.7 | 3.11 | 22.4 | 3.19 | 17.6 | |
| 80 | 2.94 | 21.3 | 3.18 | 20.7 | 3.24 | 16.5 | |
| South aspect | 20 | 2.54 | 27.1 | 2.77 | 25.9 | 2.86 | 23.7 |
| 40 | 2.59 | 25.7 | 2.92 | 23.4 | 3.11 | 22.0 | |
| 80 | 2.54 | 24.3 | 2.77 | 22.9 | 2.86 | 20.1 | |
| Southwest aspect | 20 | 2.74 | 25.2 | 2.87 | 24.1 | 2.96 | 21.0 |
| 40 | 2.89 | 22.7 | 2.92 | 21.4 | 3.11 | 19.7 | |
| 80 | 2.99 | 20.3 | 3.17 | 19.7 | 3.27 | 18.0 | |
| West aspect | 20 | 2.78 | 13.3 | 2.95 | 11.5 | 3.04 | 14.2 |
| 40 | 2.61 | 11.5 | 2.71 | 10.5 | 2.95 | 9.3 | |
| 80 | 2.66 | 1.4 | 2.84 | 1.3 | 3.01 | 1.0 | |
| Mode | Physical Measurement (WAS) | Simulation Measure (WAS) | |
|---|---|---|---|
| POINT | |||
| POINT 1 | 4.19 m/s | 4.21 m/s | |
| POINT 2 | 3.92 m/s | 3.92 m/s | |
| POINT 3 | 3.61 m/s | 3.63 m/s | |
| POINT 4 | 3.33 m/s | 3.38 m/s | |
| Area | WAS | SCA | ||||
|---|---|---|---|---|---|---|
| Before Correction | After Correction | Decrease | Before Correction | After Correction | Increase | |
| Area 1 | 4.2 m/s | 3.8 m/s | 9% | 17.1% | 21.3% | 24% |
| Area 2 | 3.9 m/s | 3.5 m/s | 10% | 18.5% | 24.1% | 30% |
| Area 3 | 3.6 m/s | 3.3 m/s | 8% | 19.3% | 20.5% | 21% |
| Area 4 | 3.4 m/s | 3.2 m/s | 6% | 18.2% | 22.4% | 23% |
Publisher’s Note: MDPI stays neutral with regard to jurisdictional claims in published maps and institutional affiliations. |
© 2022 by the authors. Licensee MDPI, Basel, Switzerland. This article is an open access article distributed under the terms and conditions of the Creative Commons Attribution (CC BY) license (https://creativecommons.org/licenses/by/4.0/).
Share and Cite
Zhao, H.; Jiang, X.; Cao, Y.; Zhang, H.; Zhen, S.; Jia, R.; Zhang, S. Wind Environment Simulation and Optimisation Strategies for Block Spatial Forms in Cold Low Mountainous Areas—A Case Study of Changchun, China. Sustainability 2022, 14, 6643. https://doi.org/10.3390/su14116643
Zhao H, Jiang X, Cao Y, Zhang H, Zhen S, Jia R, Zhang S. Wind Environment Simulation and Optimisation Strategies for Block Spatial Forms in Cold Low Mountainous Areas—A Case Study of Changchun, China. Sustainability. 2022; 14(11):6643. https://doi.org/10.3390/su14116643
Chicago/Turabian StyleZhao, Hongyu, Xue Jiang, Yujie Cao, Haina Zhang, Shinan Zhen, Runze Jia, and Shichao Zhang. 2022. "Wind Environment Simulation and Optimisation Strategies for Block Spatial Forms in Cold Low Mountainous Areas—A Case Study of Changchun, China" Sustainability 14, no. 11: 6643. https://doi.org/10.3390/su14116643
APA StyleZhao, H., Jiang, X., Cao, Y., Zhang, H., Zhen, S., Jia, R., & Zhang, S. (2022). Wind Environment Simulation and Optimisation Strategies for Block Spatial Forms in Cold Low Mountainous Areas—A Case Study of Changchun, China. Sustainability, 14(11), 6643. https://doi.org/10.3390/su14116643