Article

The Potential of GIS Tools for Diagnosing the SFS of Multi-Family Housing towards Friendly Cities—A Case Study of the EU Member State of Poland

by
Agnieszka Dawidowicz
* and
Małgorzata Dudzińska
Department of Land Management and Geographic Information Systems, Institute of Spatial Management and Geography, Faculty of Geoengineering, University of Warmia and Mazury in Olsztyn, 10-719 Olsztyn, Poland
*
Author to whom correspondence should be addressed.
Sustainability 2022, 14(11), 6642; https://doi.org/10.3390/su14116642
Submission received: 26 April 2022 / Revised: 21 May 2022 / Accepted: 25 May 2022 / Published: 29 May 2022

Abstract

:
Motives: The need for sustainable urban development, including an improvement in residents’ quality of life, requires ongoing urban diagnostics. Assessments of multi-family housing estates play a very important role in this process. Population growth influences the expansion of housing estates in limited urban space. The extent to which spatial and functional structures (SFS) in housing developments meet the residents’ current needs should be evaluated. These needs undergo dynamic change and are influenced by economic, socio-cultural, sanitary, and ecological factors. Aim: The main objective of this study was to develop a methodology for assessing SFS solutions in open spaces in multi-family residential estates (MFREs) based on a complete list of SFS indicators, and to determine the potential of GIS tools and selected open data sources for automating this process. GIS was used to represent data. The intermediate goal was to determine differences in the SFS solutions of two MFREs that were built with different technologies and urban layouts in the last 70 years in the city of Olsztyn (Poland). Methods: An empirical study was conducted with the use of qualitative and quantitative methods based on a review of the literature, the results of a resident survey, and an analysis of spatial data in ArcGIS and QGIS software. Results: The residents’ needs for SFS in MFREs were identified. A list of 26 SFS indicators and their values (on a 3-point scale) was developed to assess multi-family housing. The applicability of GIS software and spatial data from the national spatial data infrastructure (NSDI) and other sources was assessed in the process. The research method was tested to reveal differences in SFS solutions in the compared MFREs.

1. Introduction

Assessments of sustainable urban development and the quality of life in cities play an increasingly important role in the light of Sustainable Development Goals (SDG) [1], including goal 11 (Sustainable cities and human settlements), and ISO 37,120 (Sustainable cities and communities—Indicators for city services and quality of life) (ISO, 2014/2018), to identify areas that require revitalization. The indicators for evaluating the quality of life and comparing urban development levels have been formulated in a generalized manner to enable assessments of all cities around the world. At the same time, detailed methods are being developed to determine the extent to which cities are friendly for different social groups, such as age-friendly cities [1,2]. These assessments should focus primarily on residential areas, i.e., housing estates, that account for the largest percentage of urban space [3]. Special emphasis should be placed on multi-family residential estates (MFREs) whose number continues to increase in limited urban space due to population growth. In Europe, in particular in Euro Area countries (19 countries), a slow but steady increase in the percentage of the urban population residing in apartment blocks (more than 55%) has been noted in recent years due to declining incomes [4]. Residential estates are inhabited by millions of urban dwellers; they play a key role in the urban structure and foster social integration [5]. Chmielewski [6] defined housing estates as relatively large urban complexes with an ordered spatial structure, which are composed of residential buildings and feature public services (PS) that cater to the residents’ needs. Faron [7] accentuated the complexity of residential estates and described them as systems of interlinked structures that are functionally and spatially integrated. These definitions emphasize the fact that the spatial layout and functionality of housing estates play a key role in catering to the residents’ needs. In assessments of MFREs, these attributes should be evaluated to determine the extent to which the existing spatial and functional structures (SFS) meet the residents’ current needs. These needs are influenced by dynamic changes in technological [8,9], economic (rising incomes, ownership of more than one car) [10], and social factors (sense of security) [11]. Modern housing estates are designed as autonomous spatial units that should fulfill most of the inhabitants’ functional and spatial needs [12]. However, the question that remains to be answered is whether the residents’ needs are met by large prefabricated housing estates (LPHEs) built in the socialist era (1960–1990).
Numerous research studies have been undertaken to develop methods for evaluating MFREs in a broad or a highly specific, narrow approach. Broad-reach assessments include evaluations of the sustainable development of MFREs [13], spatial order in the context of the residents’ needs [14], and multidimensional evaluations of the quality of life in MFREs [15]. These methods rely on various types of indicators, including spatial, ecological, social, functional, socioeconomic, environmental, cultural, or esthetic. In turn, assessments deploying a highly specific, narrow approach evaluate the potential of specific functions in MFREs, including environmental and ecological functions [16], recreational functions [17,18], public open spaces [19] and esthetic functions [20,21]. These approaches and the adopted evaluation criteria will be discussed in greater detail in the literature review section. A preliminary analysis of the literature demonstrated that although MFREs are evaluated in the context of spatial, social, and environmental characteristics, these attributes are always analyzed in reference to the initially identified functional and spatial features, which underlines the importance of SFS indicators. To date, MFREs have never been assessed solely in the context of SFS. Different approaches relying on various SFS indicators have been proposed in the literature for reference purposes (see Section 2.2). Therefore, the detailed goal of the present study was to develop a cohesive list of the most important SFS indicators for diagnosing MFREs. The existing approaches to MFRE assessment relied on the direct inventory approach to collect spatial data and photographic materials, and develop sketches and descriptions based on cartographic materials as well as planning and architectural documents. These sources of data are detailed and reliable, but local inspections, and generation of descriptive documents, photographic materials, and their digitization are labor-intensive and time-consuming processes. The proposed approach relies on analytic process automation technology [22] to evaluate the applicability of Geographic Information System (GIS) tools for processing the existing spatial data and its visualization. An analysis of the literature based on the keywords “GIS for multi-family housing analysis/diagnosis/assessment” revealed that the potential of GIS tools for identifying SFS parameters has never been tested based on the available sources of data. Multidimensional studies investigating the applicability of GIS tools in various fields of science indicate that the processing of spatial data, in particular data from reliable open data sources in GIS, significantly facilitates and automates the process of assessing various spatial phenomena, including for the needs of real estate management [23].
Therefore, the main aim of this study was to develop a methodology for evaluating SFS in multi-family housing based on a complete list of SFS indicators for open spaces and to determine the applicability of GIS tools and selected open data sources for automating this process. GIS was used for representation of data. Spatial and functional structures were evaluated only in open spaces because the information for indoor areas is not publicly available. The intermediate goal was to determine differences in SFS solutions in two MFREs that had been built with various technologies and urban layouts in the last 70 years. The first estate was built in the socialist era and comprises apartment buildings made of precast concrete slabs, whereas the second estate was developed with the use of more advanced construction technologies in the last 30 years. A list of user-friendly SFS indicators was developed for open spaces in the analyzed MFREs with the use of selected data sources and GIS tools. According to research, residential needs should be identified locally [24]; therefore, SFS indicators were developed based on a survey of local inhabitants’ needs. The proposed method was tested in MFREs in the city of Olsztyn in north-eastern Poland.
The following research hypothesis was formulated based on a preliminary review of the literature and the authors’ familiarity with the study area; even though LPHEs are often dilapidated, older estates are characterized by more user-friendly SFS solutions than the more recent residential developments.
In the proposed approach, the diagnosis of the main features (functional and spatial) of MFREs was automated for the needs of the assessment process. This approach can be applied at the beginning of the diagnostic process in MFREs because it supports a comprehensive analysis of SFS. The results of the evaluation can be used to identify housing estates where public open spaces need to be revitalized and where the existing SFS solutions should be adapted to the resident’s current needs. Public open spaces are an integral part of all MFREs around the world. Their SFS features, regardless of the political, economic, and cultural past in a given country, evolve subject to transformation according to the needs of the residents. The creation of a universal list of SFS indicators to assess MFREs based on the international literature extends its applicability not only to European Eastern bloc countries but also is dedicated to urban planning and property management experts of any highly urbanized cities in the world whose architecture is varied, and it does not derive from socialist ideology. Due to the presented usefulness of national Spatial Data Infrastructure (SDI) under the INSPIRE Directive [25], this approach is particularly dedicated to all EU Member States and other countries that have similar SDIs to EU countries.

2. Literature Review

2.1. Origin and Architectural Features of Multi-Family Residential Estates in Poland and Other Former Socialist Countries

A review of the literature based on the keywords “architectural styles/construction technology of multi-family homes/urban layout” revealed that MFREs were built in different periods and are characterized by various construction technologies and urban planning solutions. Cities in Central–Eastern Europe abound in LPHEs that were developed in the socialist era. These estates account for 20–40% of the housing stock in Central–Eastern Europe [26]. In Western Europe, prefabricated apartment buildings have a bad reputation and are often regarded as problem areas, whereas many MFREs in the former Eastern bloc countries have been successfully revitalized. These differences in perception can be explained by the fact that most apartments in MFREs in Central–Eastern Europe were privatized after 1990 [27], and their present inhabitants belong to different social groups than do municipal housing tenants. In Western Europe, apartment blocks are inhabited mainly by blue-collar workers and immigrants, whereas in socialist countries, MFREs were middle-class enclaves [28]. The urban layout of LPHEs had numerous advantages. These estates were attractively located, had good access to downtown areas, and were equipped with the necessary residential infrastructure. Prefabricated housing estates were developed together with the accompanying services, and apartment buildings were not designed individually [29]. Apartment blocks were separated by large open spaces, had ample sun exposure, and were well aerated, but according to research [29], this urban layout does not contribute to the formation of strong social bonds. Housing estates with various layouts (grid, cluster, block) featured open spaces because precast concrete slabs had to be moved by heavy-duty equipment that required considerable operating space. These residential estates were not separated from public spaces. They were freely open to the surrounding areas, which prevented the inhabitants from developing a strong sense of place identity. Open spaces in socialist housing estates were fully accessible to outsiders, including undesirable guests, and the residents were deprived of a sense of privacy and community.
The refurbishment of LPHEs is a topic that has stirred considerable scientific, political, and social debate [30,31,32,33]. Many researchers have argued that LPHEs can be successfully revitalized and that the accompanying spatial structures can be adapted to the residents’ needs [30,34]. Vasilevska [27,35] described three trajectories of LPHE development: (1) complete degradation of buildings and/or public open spaces resulting from the absence of planning regulations, lack of funds to cover maintenance costs [36], or the residents’ reluctance to take on additional responsibilities [26]; (2) uncontrolled and uncoordinated development and renovation on a “do-it-yourself” basis, as demonstrated by buildings where additional stories and balconies were built at the residents’ request [37], or where ground floor apartments were converted to non-residential functions [38]; and (3) comprehensive revitalization projects aiming to increase the appeal of large residential estates for inhabitants belonging to specific socioeconomic groups, as was the case in Poland, Slovakia, Hungary, Czechia, and Romania [30,39].
Technological progress and residential needs have evolved considerably in the last 30 years. The esthetic appeal of not only individual buildings but entire MFREs has been enhanced. Precast concrete slabs were replaced with advanced construction materials, including ceramics (Figure 1).
Modern buildings are better equipped, more energy-efficient, have better sound insulation, and offer a higher standard of living [40]. Housing estates composed of precast concrete buildings and modern buildings differ not only in architectural details and the applied construction materials and tools but also in their spatial and functional layouts. Above all, modern MFREs place greater emphasis on the human factor. The layout, location, architectural features, and functionality of modern estates are designed to maximize user comfort [41]. Public open spaces in large housing estates have been also transformed, and distinct community areas and recreational sites have been built [42]. However, the growing prices of urban land exert strong pressures on housing developers. Multi-story buildings are often incorporated into the existing residential fabric, which decreases the distance between buildings in new estates. New buildings may offer a much higher standard of living (larger apartments, improved residential utilities), but residential densification minimizes user comfort by decreasing the availability of public open spaces [43].
A review of the literature [44,45,46,47] revealed that not all new housing estates in Poland are designed in a planned and rational manner. Many MFREs, in particular in suburban areas, are characterized by chaotic development. In areas that are not covered by local zoning plans, the shape of a housing estate is determined mainly by the type of land plots that are accessible to developers. Housing estates do not have a functional layout, and networks of convenient footpaths are often cut by fencing. Many estates are cramped and dark because every part of the land plot is built up, sometimes in violation of legal regulations. The size of green areas, playgrounds, and parking spaces meet the legal minimum. Residential infrastructure is often incomplete, and some estates do not have convenient access to the public road network. For this reason, user-friendly SFS should be assessed in MFREs to adapt them to the residents’ current needs.

2.2. Core Approaches to Assessments of Multi-Family Housing

The core approaches to assessments of multi-family housing were analyzed based on a review of the international literature to propose indicators describing SFS in MFREs. The results are presented in Table 1. The selected key case studies are mainly from Europe, but there is also an example from Asia. This broad approach to identifying SFS factors aims to create a list of universal indicators on a global scale.
As demonstrated in Table 1, the selection of indicators in each approach to MFRE assessment was determined by the objective subject matter, scope of the evaluation, and the availability of various sources of data. Mixed data sources were used in all approaches. Spatial data from the available cartographic materials had to be analyzed, and local inventories were also performed. The broader the approach, the more data that had to be used in the process of developing the evaluation model. However, in all approaches, SFS were identified at different levels of detail as the reference indicators for evaluating MFREs. All SFS indicators whose data are publicly available in the national SDI were adopted for the developed method.

3. Materials and Methods

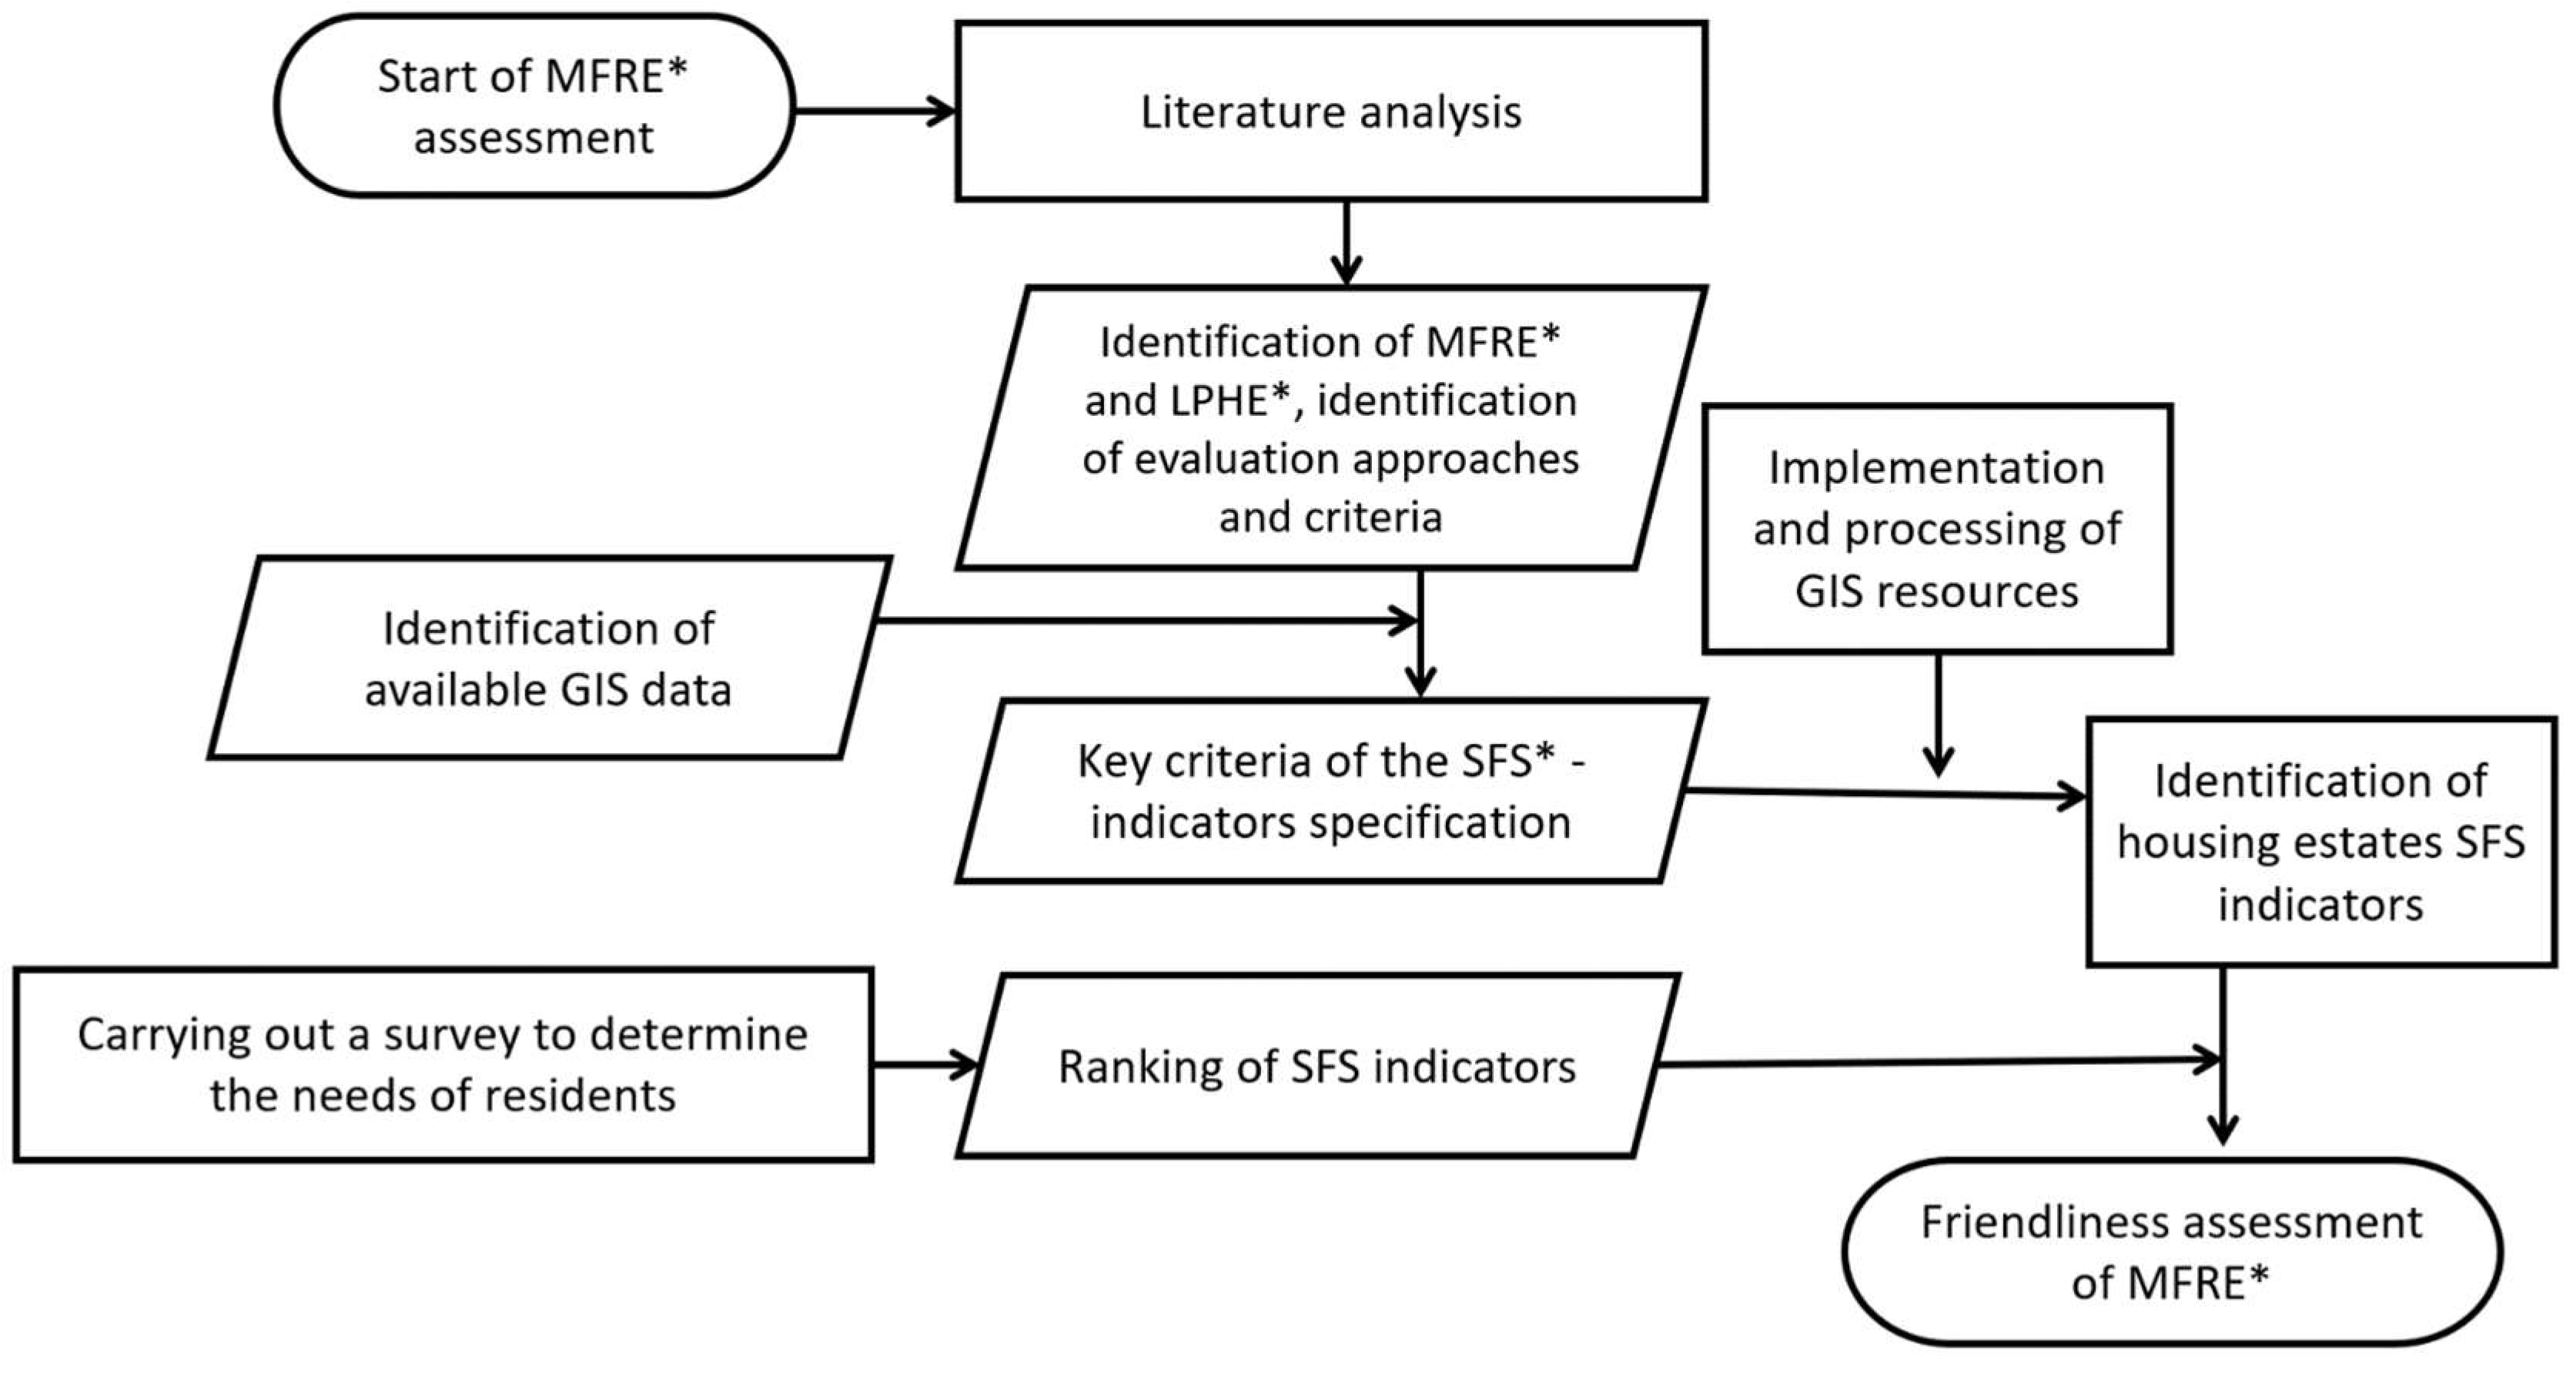
An empirical study was conducted with the use of qualitative (list of elements and parameters for evaluating SFS in MFREs) and quantitative methods (assigning weights to indicators of user-friendly SFS solutions) to achieve the following research objectives: (1) propose a method for automating the assessment of SFS in MFREs based on a survey of the residents’ needs and a list of SFS indicators; (2) determine the applicability of GIS tools with the use of the available databases; and (3) verify the research hypothesis. The first stage of the study involved an in-depth analysis of domestic and international literature to identify various approaches to LPHE management, new construction technologies in Poland and the world, as well as various approaches to MFRE assessment and the relevant criteria. The key SFS criteria for MFRE assessment were identified, and their parameters were described. The availability of spatial data from reliable sources, in particular the NSDI developed under the INSPIRE Directive [25], was the main criterion for including each indicator in the analysis. These parameters were ranked with the use of a three-point scale for surveying the residents’ needs. Figure 2 shows the algorithm of the MFRE evaluation process.
The proposed method was tested in two housing estates that had been built during different periods in Olsztyn. For the older of the two estates to be included in the study, it had to be refurbished to ensure that the validation test was not affected by factors such as neglect and dilapidation. For concept testing purposes, the residents of Olsztyn (large city, regional capital) were invited to participate in an online survey at the turn of July and August 2021. The snowball sampling method was used in the survey [54], and the participants were asked to recruit subjects residing in the same residential estate. Initially, 30 persons residing in the evaluated estates were invited by email to participate in the study. They were asked to forward the questionnaire to as many neighbors as possible. This approach was used to ensure the researchers’ and participants’ safety during the COVID-19 pandemic. A total of 112 questionnaires was returned. In the last stage of the study, the proposed method was validated with the use of GIS tools in ArcGIS Pro commercial software (version 2.9.2) and QGIS open-source software (version 3.22.1). Geographic data from the NSDI as well as commercial and crowdsourced databases, such as OpenStreetMap, were verified and selected before the study.

3.1. Study Area

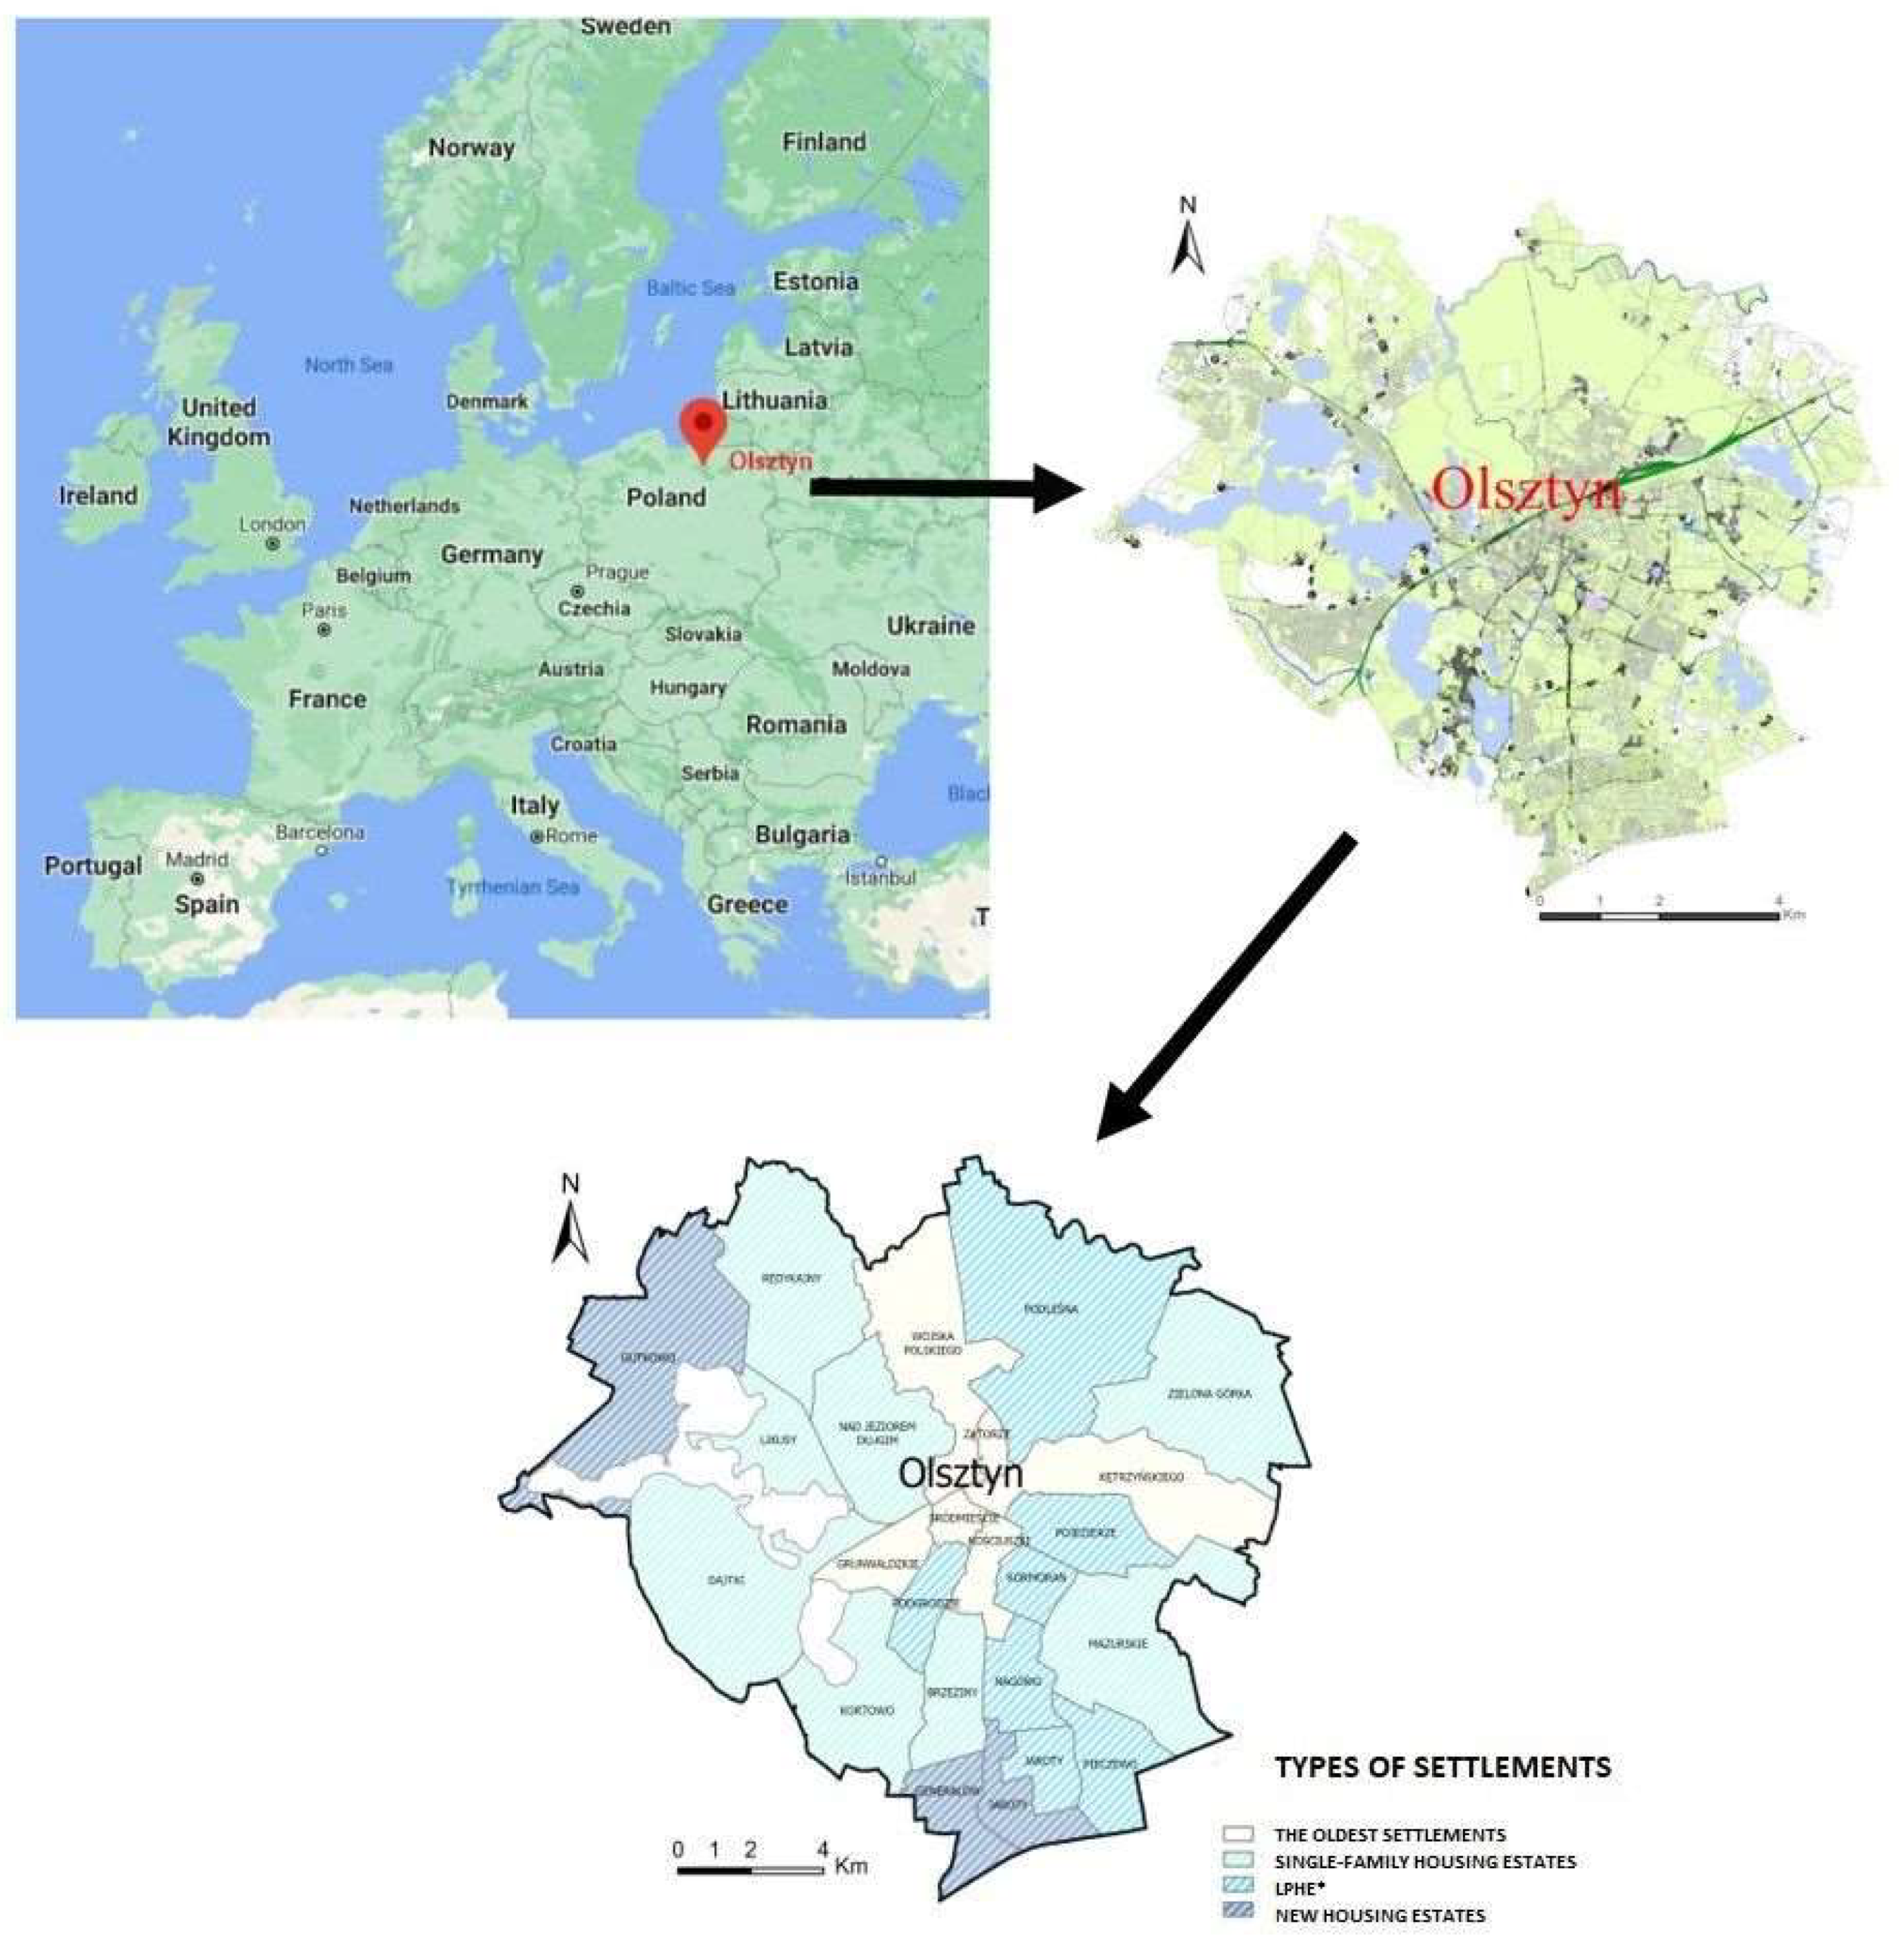
The applicability of the proposed method was validated in a test. The results were used to determine differences in user-friendly SFS solutions between two MFREs in Olsztyn. Olsztyn was selected for the study because it is characterized by different types of urban architecture, and it fulfills the definition of a large city in the OECD classification [55]. Olsztyn is the capital city of the Region of Warmia and Mazury. It has an area of 88 km2, a population of more than 172,000, and a population density of more than 1954 persons/km2 [56]. The city is divided into 23 residential estates (Figure 3), which, under the provisions of Article 6 of the Act of 8 March 1980 of the Municipal Government, constitute auxiliary units of Olsztyn municipality. Auxiliary units represent the lowest tier of public administration in Poland. Olsztyn’s estates differ in architectural style and urban layout. For the needs of this study, they were divided into the following groups based on the predominant types of residential architecture:
(1)
multi-family residential estates (MFREs) developed before the introduction of precast construction technology (oldest buildings),
(2)
large prefabricated housing estates (LPHEs),
(3)
residential estates comprising single-family homes,
(4)
MFREs and single-family homes developed in the last 15 years.
The largest number of estates (8) is composed of single-family homes, but they are inhabited by only 16% of Olsztyn’s total population. Downtown Olsztyn is the oldest part of the city with a predominance of multi-family buildings with massive load-bearing walls made mainly of brick. The majority of new housing projects was developed in the southern and western parts of Olsztyn. New apartment blocks were also incorporated into older housing estates to make maximum use of the existing space. Apartment buildings made of precast concrete slabs were found in seven housing estates. Podleśne is the oldest estate to have been developed using precast slab technology (in the 1970s) in Olsztyn. Younger estates include northern Jaroty (1980s) and Pieczewo (1985).
The residential estates of Pieczewo (LPHEs) and Generałów (new construction technology) were selected for a comparative analysis of user-friendly SFS solutions. This choice was not accidental. The selected estates are situated in the same part of Olsztyn (south), but they were built during different time periods. They are highly similar in terms of population and area (Table 2), but they differ completely in urban layout and construction technology.
The housing estate of Pieczewo features apartment buildings made of precast concrete slabs, whereas the majority of apartment buildings in the Generałów estate were built with ceramic bricks in the last 20 years. These estates were selected for the study based on the residents’ opinions regarding the attractiveness of residential estates in Olsztyn. The surveyed subjects were presented with two lists of housing estates (new and old) and were asked to select one estate with the optimal functional and spatial characteristics from each list. A total of 112 residents participated in the survey.
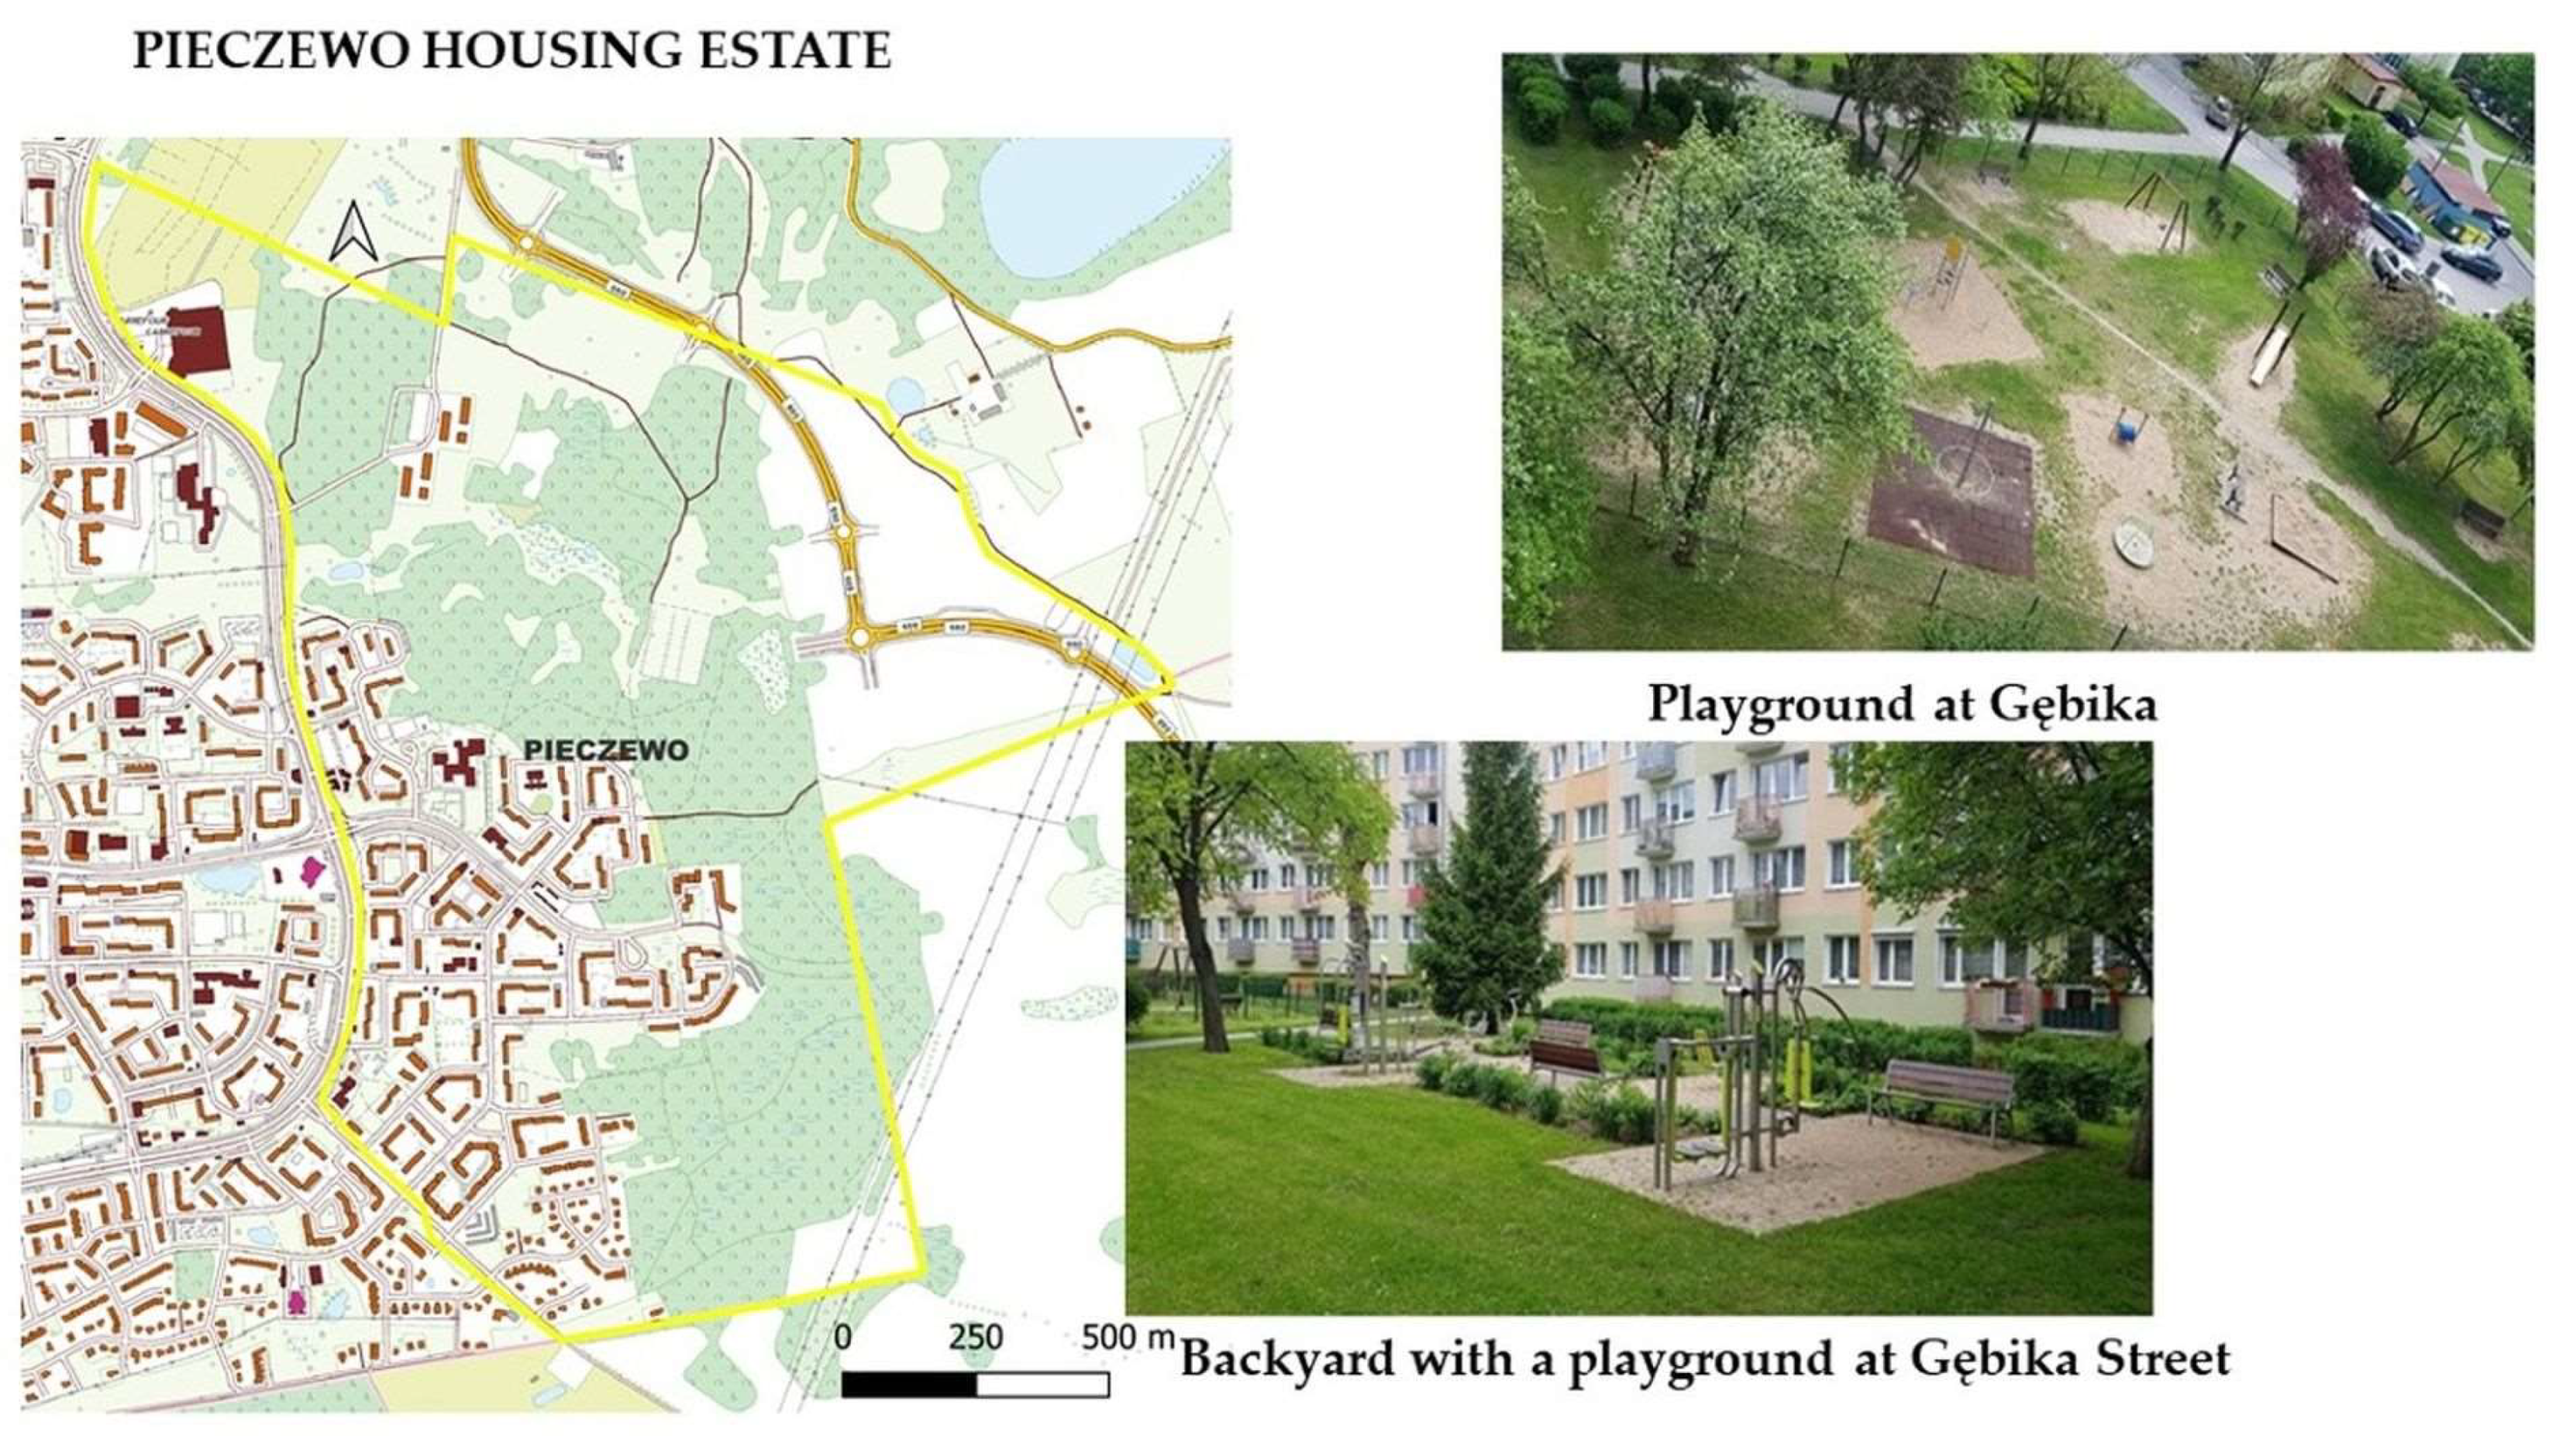
The majority of buildings in Pieczewo (Figure 4) is made of prefabricated concrete slabs, but the southern part of the estate also features newer buildings. Most buildings have 4–5 stories, and only three buildings have 10 stories. The estate also features PS, storage, and industrial buildings. Pieczewo abounds in playgrounds, sports fields, recreational sites, and parking lots. Most residential buildings are precast concrete structures erected in the 1970s and 1980s. The estate has a linear urban layout with long buildings and clusters of buildings arranged in straight or broken lines. The vast majority of apartment buildings has several stairwells. The buildings have a monotonous architectural design, but the facades have different colors and are esthetically appealing. The buildings are regularly inspected and maintained in good condition to ensure the residents’ safety. The estate features a large and modern playground and many rest areas with benches and diverse greenery.
Pieczewo estate is managed by the housing cooperative of Jaroty, which is responsible for providing housing services and maintaining and refurbishing apartment buildings. The revitalization process in Pieczewo was initially chaotic and involved mainly insulation of building facades, installation of PVC windows in common areas (stairwells), insulation of roof slabs, and construction of new entrance canopies. These operations were performed in buildings where sufficient funds for revitalization projects had been accumulated from owner contributions. In addition to building upgrades, the housing cooperative has also implemented a series of planned measures to improve the quality of outdoor living space. Playgrounds and residential greenery were regenerated, new active recreation sites were built (including an ice skating rink and an outdoor gym), paved walkways were modernized, and new parking areas were built. New street furniture was added, and communal waste storage areas were rebuilt. The quality of outdoor living space in Pieczewo continues to improve.
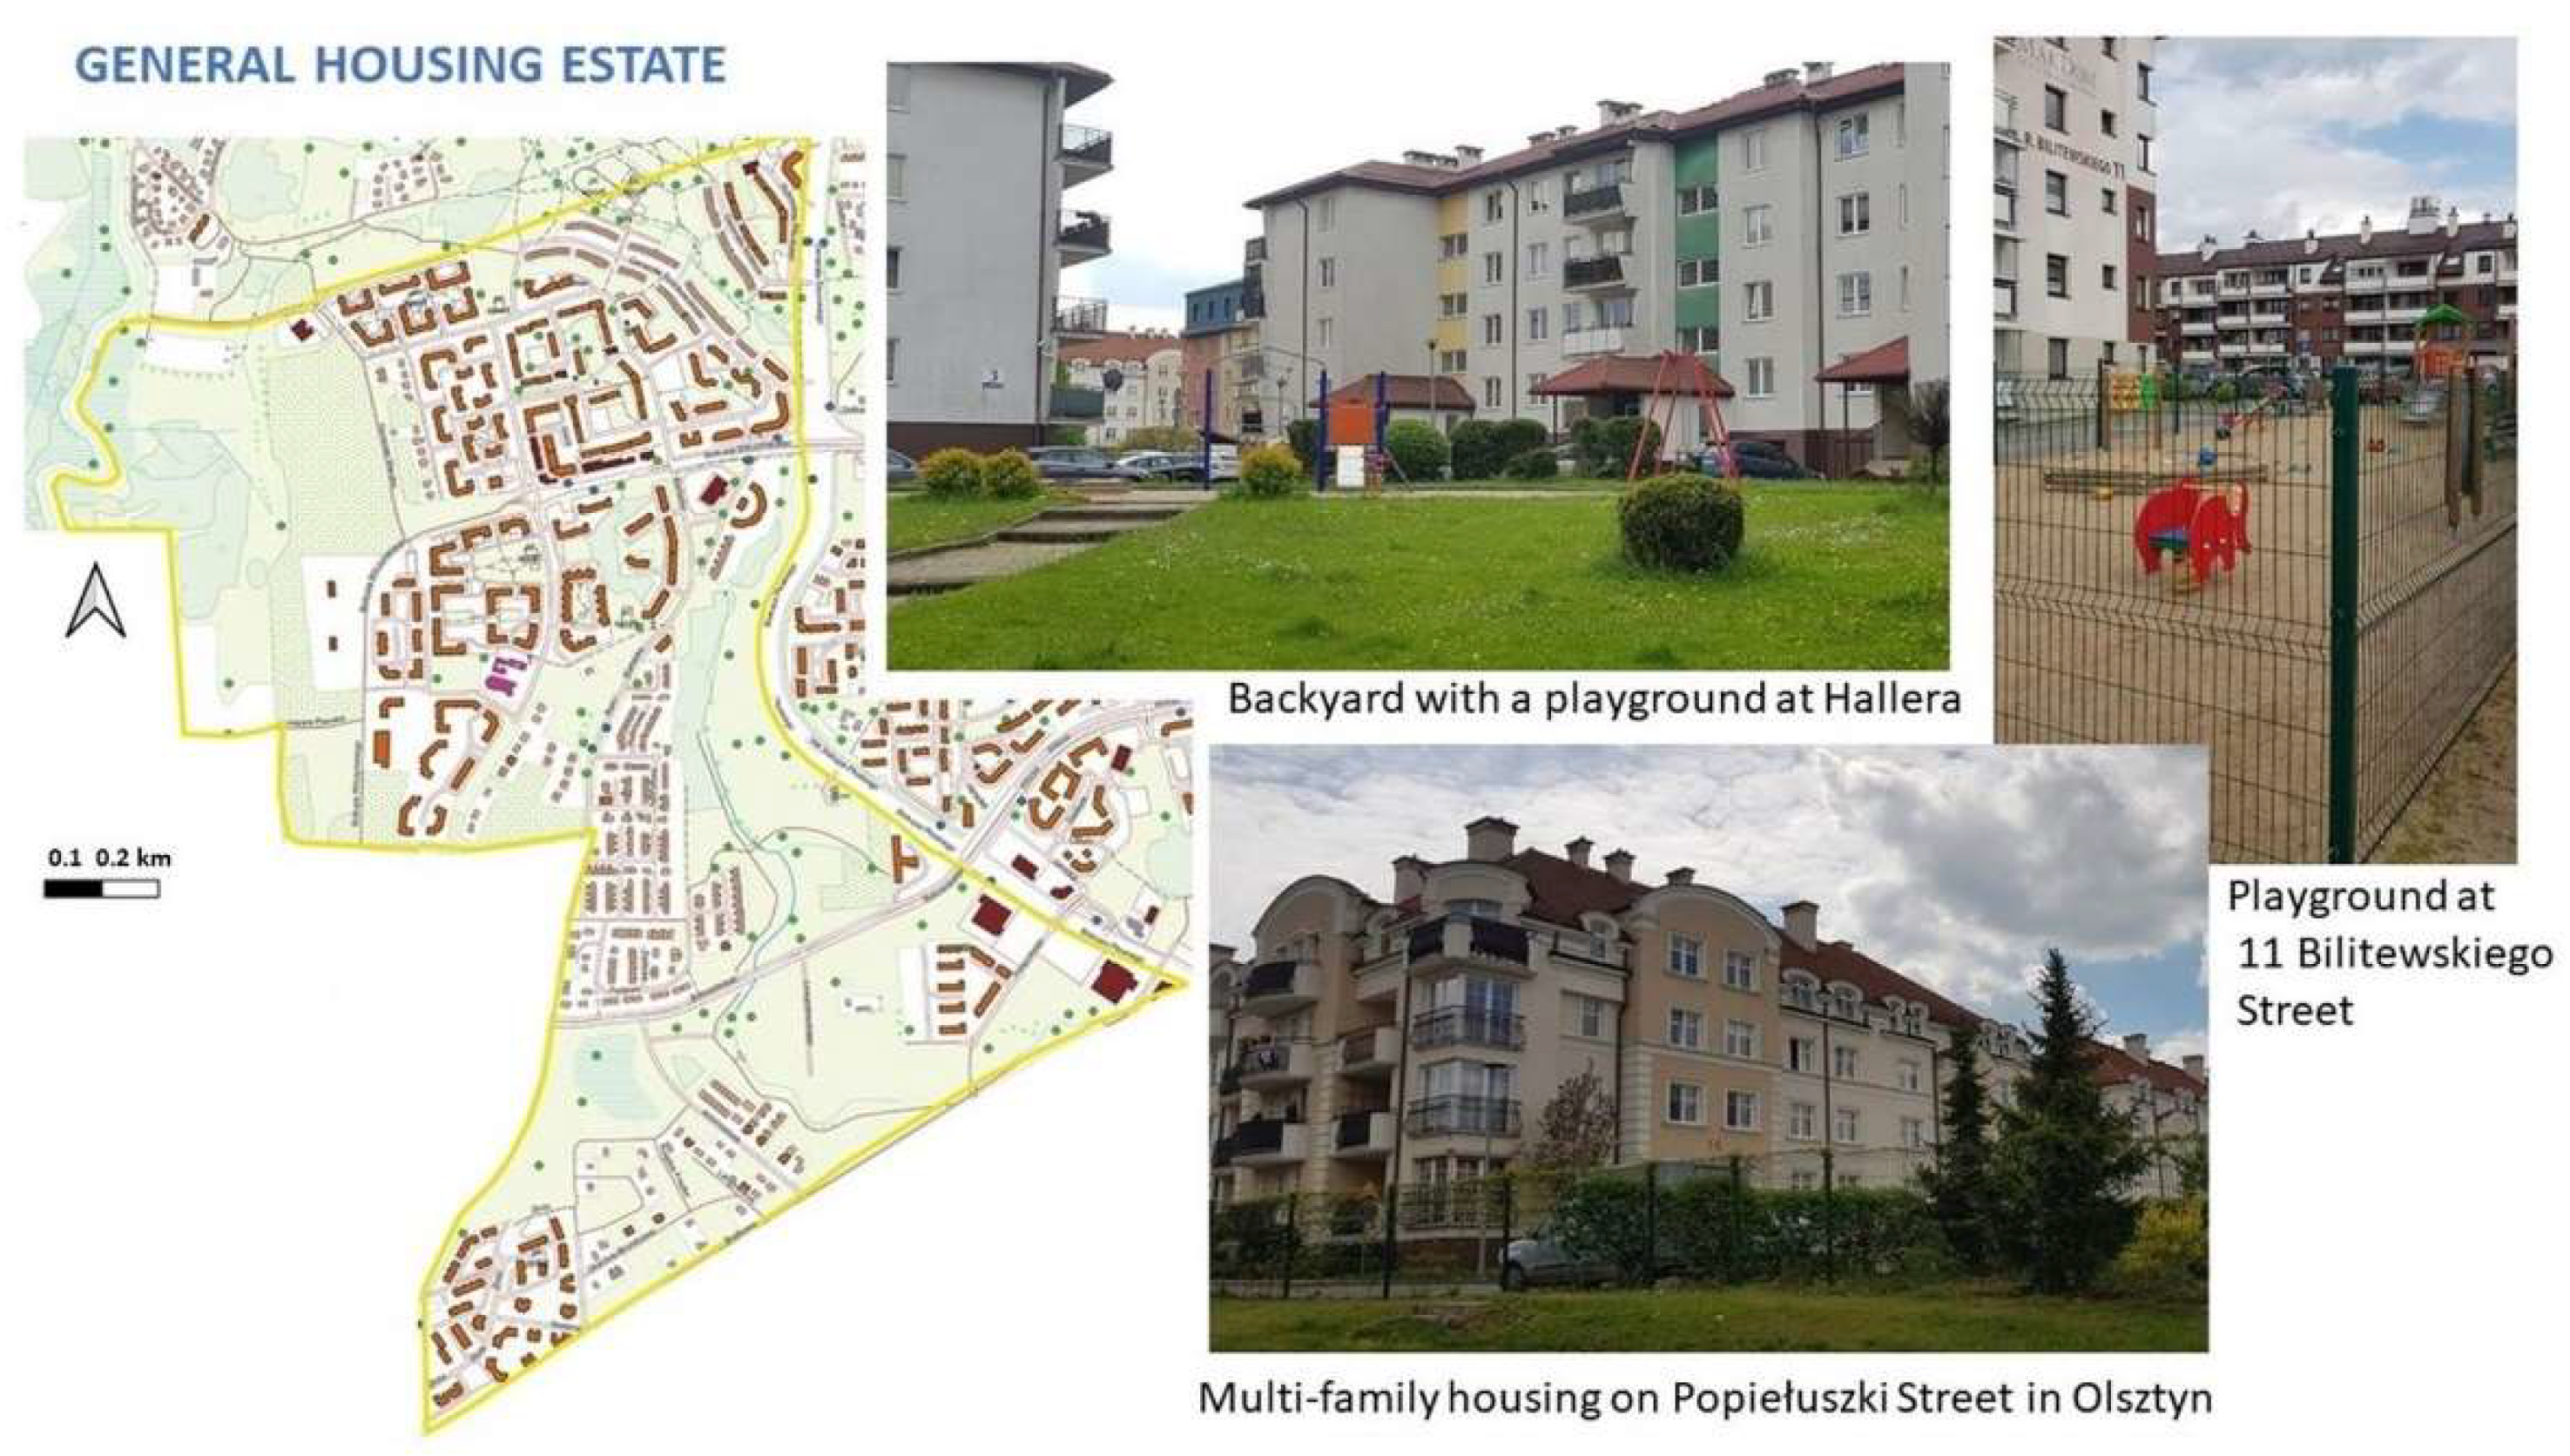
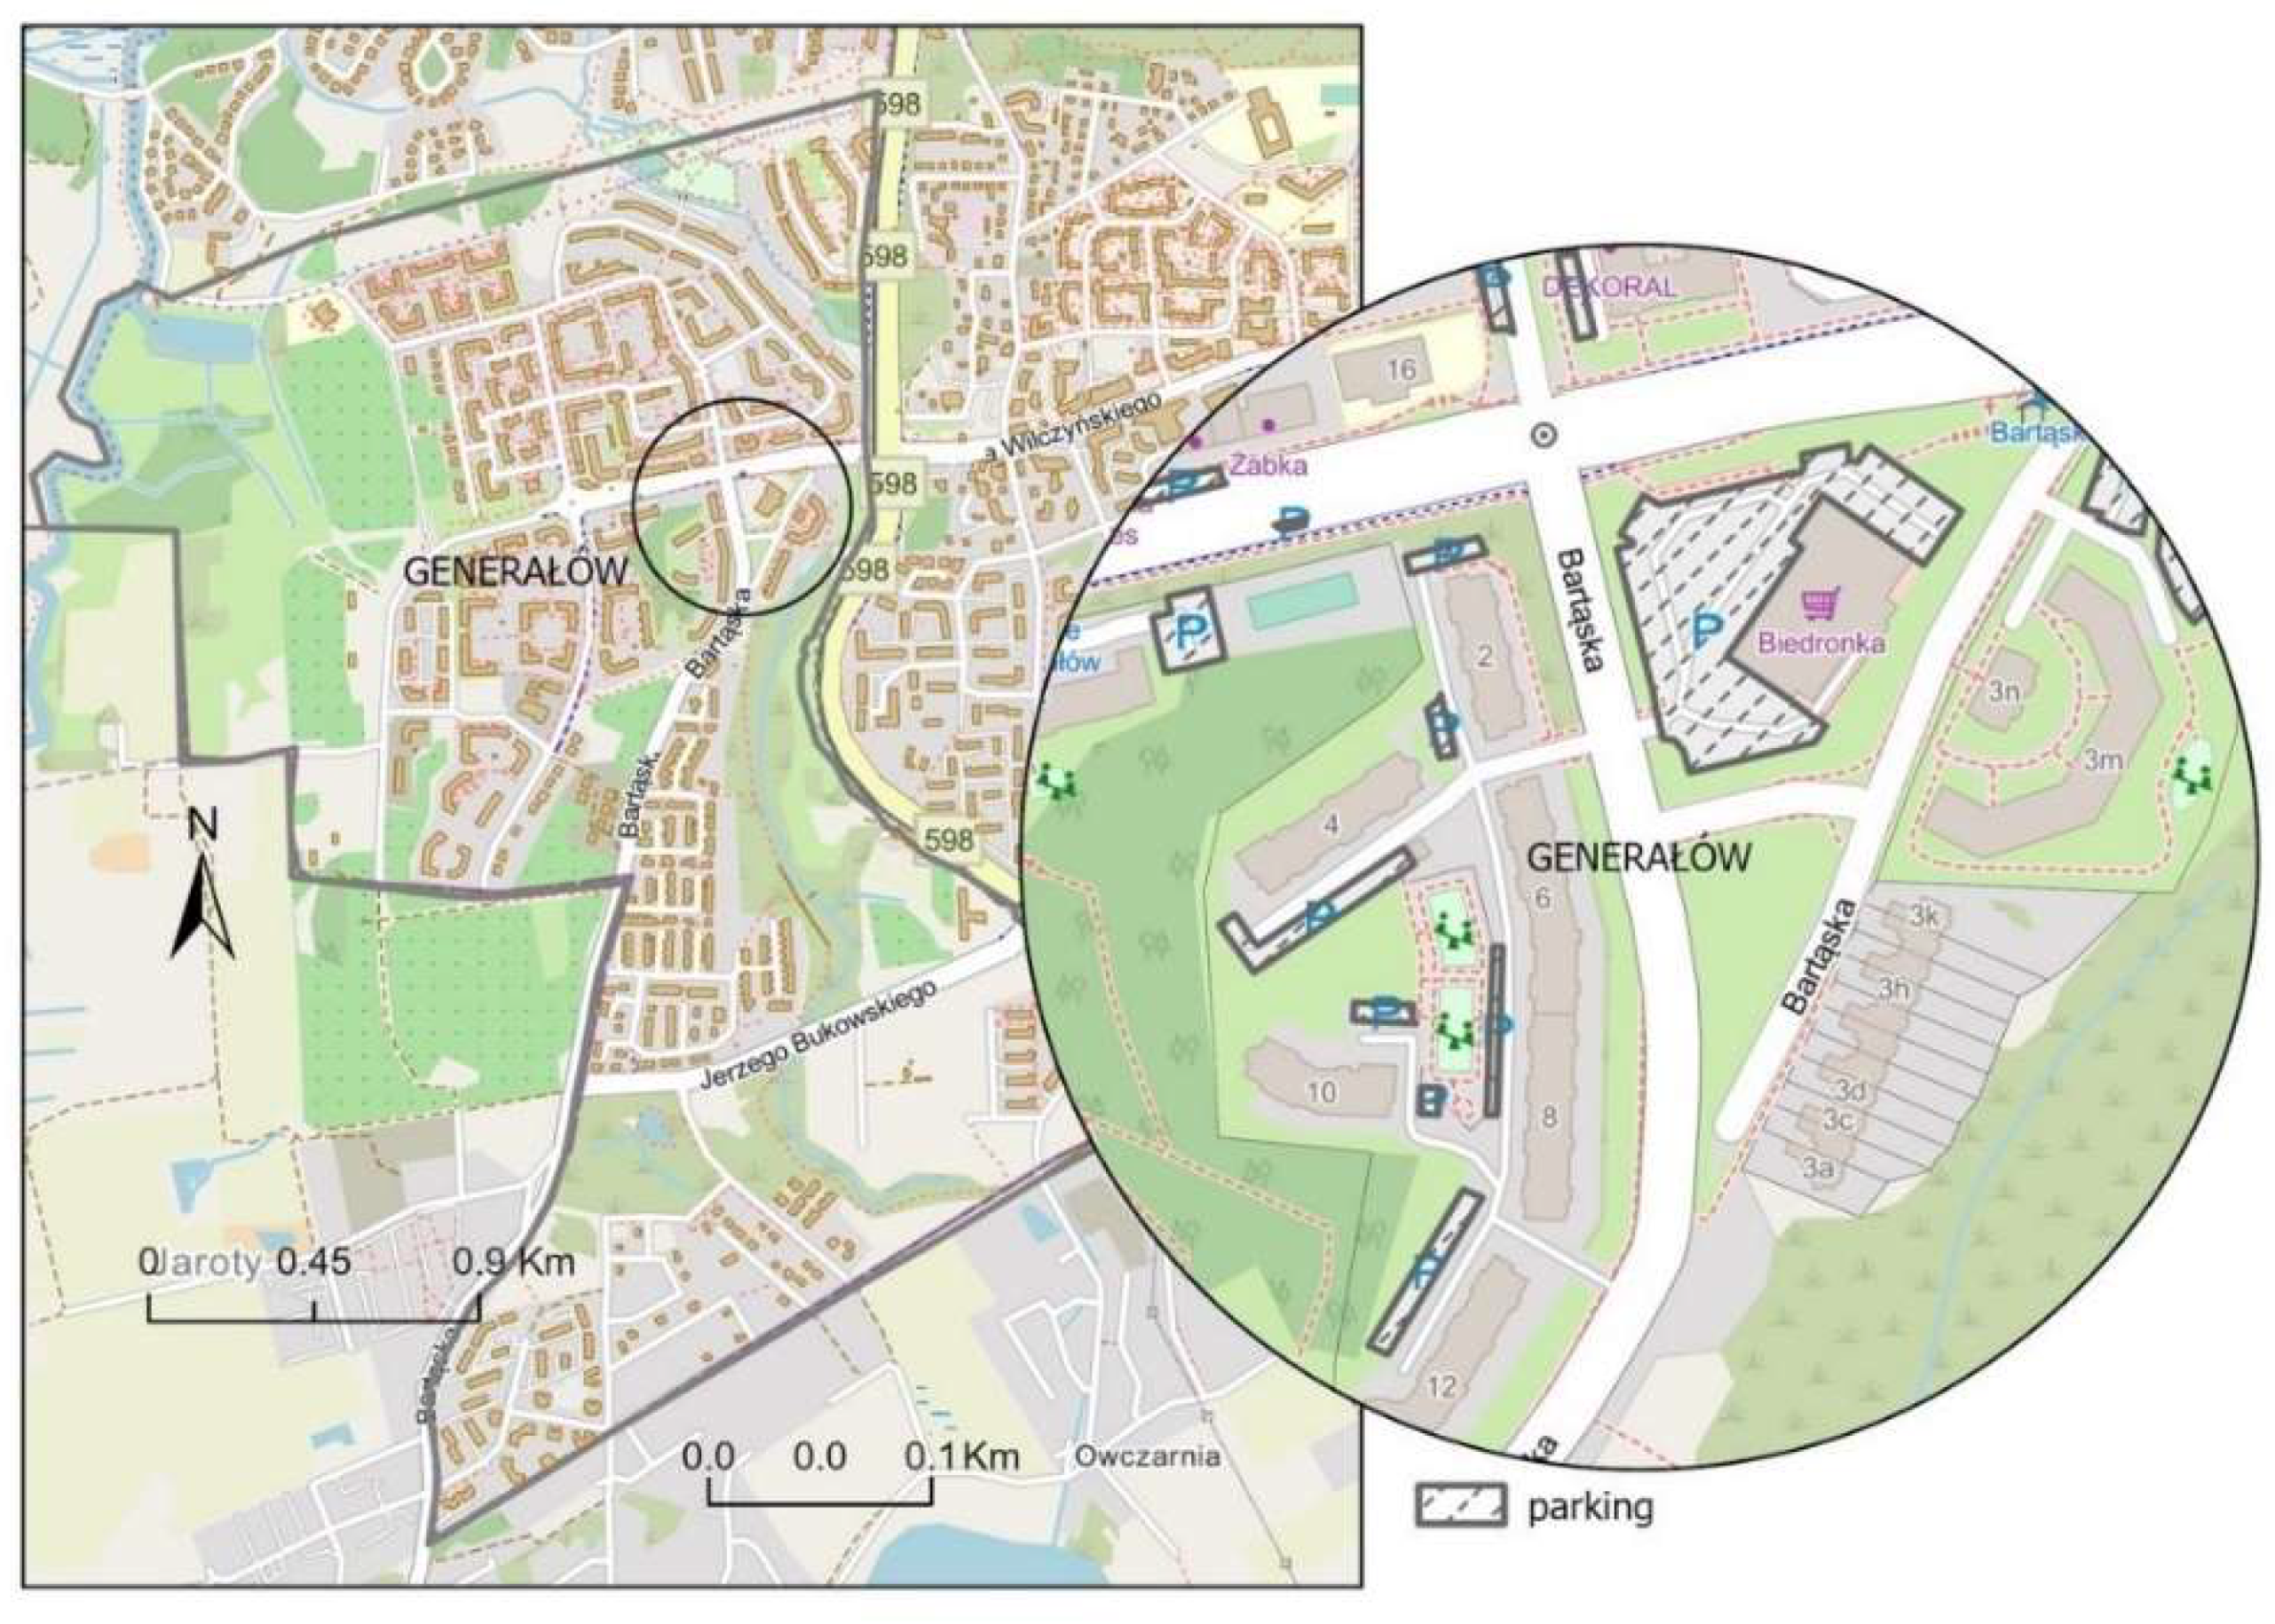
Generałów residential estate (Figure 5) was developed in the last 25 years. Most buildings in the northern part of the estate have 4–5 stories and were erected in the late 1990s. The southern part of the estate features multi-family buildings developed between 2003 and 2018, including several buildings with 6–7 stories.
The estate has a cluster layout, where buildings are arranged in the shape of the letter “C”. Recreational areas and internal roads are enclosed by buildings. The estate features several playgrounds and parking areas. The layout of the Generałów estate differs considerably from that of Pieczewo. Similarly to Pieczewo, the majority of apartment buildings in the Generałów estate is divided into stairwells. Generałów estate features retail and service outlets as well as educational facilities, most of which are situated on the ground floor of apartment buildings.
The compared housing estates differ considerably in the quality of outdoor living space. In Generałów estate, the space between apartment buildings features shrubs, trees, and small lawns, but residential greenery is not diverse or carefully designed. There is a large sports field and several small recreational areas in various parts of the estate. However, the size and quality of playgrounds are unsatisfactory. Most playgrounds are not fenced off and have an area of less than 400 sq. m. (Figure 5). In this respect, Generałów estate differs considerably from Pieczewo.

3.2. Preparation of the Survey Questionnaire

The questionnaire for surveying residential needs in the context of SFS in MFREs was developed based on a list of SFS indicators. These indicators were identified based on a review of the domestic and international literature (Section 2.2), urban planning and land management regulations [58], and Polish construction law [59]. The identified SFS indicators were divided into two main categories describing spatial functions and the organization of space in the analyzed housing estates and the neighboring areas. A total of nine criteria was identified in both categories of SFS indicators: distance from PS; availability of SFS in the neighborhood (land-use types in the neighboring areas); planning parameters; parking areas; roads; biologically active areas; green spaces; recreation; education; and retail and service outlets. Specific indicators were assigned to each criterion. The developed questionnaire could be used in surveys of variously sized cities and different social groups. The questionnaire comprised 13 questions, mostly closed-ended and single-choice questions. In the first two questions, the respondents were asked to indicate their gender and age by selecting the appropriate age group: 18–44, 45–64, and 65+. These age groups were adopted based on the age categories in Polish statistical databases [60]. The survey was addressed to adults. According to Bardecki [61], the SFS requirements of minors are taken into consideration by parents and adult caretakers when selecting a place of residence. In the third question, the respondents provided the name of their residential estate. In the fourth question, the surveyed subjects were asked to indicate whether the number of retail and service outlets in their housing estate was sufficient to meet local needs. Question five concerned the optimal and unacceptable distance to the city center and selected PS, including city/municipal offices, railway and bus stations, recreational sites (parks, municipal forests, water bodies), educational facilities (secondary schools and universities), healthcare facilities (hospitals, specialist healthcare centers), and culture sites (theaters, philharmonics, opera houses, museums) in the following intervals: up to 500 m, 501–1500 m, 1501–3000 m, 3001–5000 m, and above 5000 m. These intervals were adopted based on the methodology proposed by [62], where the minimal adopted distance of 500 m was regarded as the average walking distance that is acceptable for residents aged 60+. In the sixth question, the respondents were asked to indicate the optimal and unacceptable distance to locations that are visited on a daily basis, such as grocery stores, service outlets, restaurants, primary schools, kindergartens, public transport stops, parks, playgrounds, and sports fields. In this question, the proposed intervals were referenced to the boundaries of the residential estate or minimally beyond these boundaries. The respondents’ needs were surveyed in the following distance intervals: up to 200 m, 201–500 m, 105–1000 m, 1001–1500 m, and above 1500 m. According to a survey conducted by the Praga Food Commodity Market [63] during the second campaign entitled “Living Locally, Shopping Locally”, Polish consumers prefer to shop locally (within a distance of up to 200 from their homes). Location, time-savings, and fresh produce were the three main reasons why the surveyed consumers opted for local grocery stores. Walaszek (2018) demonstrated that primary and secondary schools were also selected mainly based on distance from the place of residence. In the present study, the proposed distance intervals were referenced to the average radius of the analyzed housing estates, which was determined at 640 m for Pieczewo and 720 m for Generałów. The seventh question explored the respondents’ preferred modes of transport for reaching various destinations within and outside their housing estates, including private car, taxi, public transport (bus, tram, train), bicycle, and scooter/motorbike. The respondents were also asked to indicate the frequency of using selected transport modes (daily, several times a week, several times a month, several times a year). The mode of transport justified the respondents’ needs regarding user-friendly distances to the selected PS. The eighth question concerned the optimal number of active recreation sites (1, 2, 3, or more) and the optimal size of playgrounds (up to 100 m2, 101–200 m2, 201–300 m2, 301–400 m2, 400 m2 and larger). These intervals were adopted based on an analysis of playgrounds in Olsztyn’s residential estates. The optimal number of access roads to housing estates was surveyed in the ninth question (1, 2, 3–4, 5 and more) based on a study of residential safety indicators [27]. The tenth question addressed the availability of separate bike lanes reaching estate boundaries. Question eleven was a multiple-choice question concerning the legibility of local traffic and pedestrian routes, including clearly marked traffic lanes for four-wheeled and two-wheeled vehicles, as well as pedestrian routes. Question twelve surveyed the demand for parking space in housing estates (1, 1.5, 2, 3, and more parking spaces per apartment) based on a preliminary survey of residential estates and an analysis of legal regulations. In question thirteen (semi-open), the respondents were asked to rate their satisfaction with the housing estate and describe any functional and spatial problems that should be resolved to increase the quality of local life.
The above survey is composed of largely universal questions, but the results should be generated and averaged locally because every residential community has unique needs that are influenced by location (availability of SFS, residential services, local policies).

4. Results and Discussion

4.1. Generation of a List of SFS Indicators in Multi-Family Residential Estates

Two categories of indicators describing the availability of SFS inside and outside the examined MFREs were identified. A residential estate’s location is associated with the availability of SFS in the neighborhood and the distance to the selected PS. These criteria often play a key role in decisions concerning the choice of a housing estate. Previous research has shown that location and easy access to PS affect real estate prices [64,65]. An estate’s location relative to specific land-use functions in the neighborhood is also an important diagnostic factor that influences the assessment of MFREs [66]. Positive functions, neutral functions, and negative functions that affect a housing estate’s appeal for residents were identified based on a review of the literature [67] and are presented in Table 3.
In addition to the SFS given in the literature (such as built-up area, unobstructed view, and legible network of internal roads), parameters that play an important role in Polish urban planning regulations, such as density of development, were also considered in the study. Under article 15, Section 2 of the Act on Spatial Planning and Development (Act, 2003), the maximum and minimum density of development should be indicated in the local zoning plan. Development density is defined as the ratio of total built-up area to the area of the land plot. The total-up area is the combined area of all stories in a building [68]. This parameter combines information about building height and total building area, and it can be used to determine population density and biologically active areas per unit of a residential area. According to Faron [69], development density influences the demand for public transport. Based on a review of the literature (Table 1), residential needs and the accompanying SFS were divided into the following categories:
  • Residential safety:
    (a)
    legible network of local roads and pedestrian routes,
    (b)
    parking spaces that meet local needs,
    (c)
    access to primary healthcare providers.
  • Recreation and esthetics:
    (a)
    well-designed residential greenery,
    (b)
    playgrounds and active recreation sites.
  • Daily needs:
    (a)
    proximity of grocery stores, fruit and vegetable stores, bakeries,
    (b)
    proximity to pharmacies.
  • Education and child care:
    (a)
    proximity of kindergartens,
    (b)
    proximity of primary schools.
The above parameters relating to the functionality of housing estates were incorporated into the SFS model.
The SFS indicators were also selected based on the availability of spatial data which, together with GIS tools, determine the reliability of the results. In the literature to date, residential neighborhoods are evaluated using GIS only for selected indicators, not comprehensively, e.g., Urban Green Space Based [70], noise [71], transport accessibility [72], distance to health services [73], and real estate prices [74]. The selection of accurate and comprehensive sources of data is an important consideration that affects the reliability of research. Spatial data for the study were obtained from the NSDI via the Geoportal website. The NSDI is a reliable and comprehensive repository of data that are available to the public under the EU INSPIRE Directive [25]. In Poland, more than 65% of the data specified in three annexes to the INSPIRE Directive have been implemented in the Geoportal to date [75]. However, the available resources do not include highly detailed data, such as urban greenery components, playgrounds and recreational infrastructure, and the location of pedestrian routes, bike paths, or public transport stops, which are essential for evaluating the availability of SFS in housing estates. The Geoportal does not contain information about building functions, including PS, retail outlets, hospitals, public administration offices, cultural sites, and schools. Therefore, other reliable, detailed, and valid sources of data were used in the study, including local spatial information systems referenced to cadastral data [76] and OpenStreetMap resources [77]. A detailed list of data sources referenced to SFS criteria is presented in Table 3.

4.2. Survey of Residents’ Needs Regarding SFS

The SFS indicators were selected based on a statistical analysis of survey results as well as a review of the literature and legal regulations. A total of 112 adults residing in the evaluated housing estates (Generałów and Pieczewo) participated in the survey. The results were similar in all age categories, which is why this group was regarded as representative of the studied population.
In the studied group, 56% of the respondents were female and 44% were male. The majority of the respondents was aged 18–44 (41 persons, 37%). The remaining age groups had the following share of the studied population: 65+ (37 persons, 33%), and 45–64 (34 persons, 30%). In the surveyed group, 47% of the respondents resided in the Pieczewo estate, and 53% resided in the Generałów estate. In the fourth question, the surveyed subjects were asked to rate the availability of retail and service outlets in their housing estates. According to 89 respondents (79%), the number of daily-needs stores (grocery stores, fruit and vegetable stores, bakeries, pharmacies, healthcare facilities, and primary schools) was sufficient in the evaluated estates. Some respondents, mainly women (32%), were of the opinion that the availability of clothing stores could be improved.
The fifth question concerned the optimal distance to PS, and the results were used to assess the estate’s spatial and functional appeal based on its location in Olsztyn. The vast majority of the respondents indicated that 1500–5000 m was the optimal distance to train/bus stations, specialist healthcare facilities (such as hospitals), and cultural sites (theaters, cinemas, philharmonics). These facilities generate noise and traffic, which is why they should not be situated in close proximity to residential estates. The majority of the surveyed subjects were of the opinion that a housing estate should be separated by a distance of more than 1500 m from a train/bus station (84%) and cultural sites (91 respondents, 81%). According to 23% of respondents aged 18–44, 15% respondents aged 45–65, and 26% of respondents older than 65, the distance to specialist healthcare facilities and hospitals should not exceed 1500 m. The interval of 500–1000 m was indicated as the optimal distance to the city center (76 respondents, 67%), educational facilities, and public administration offices (76%). These facilities are probably less arduous and more frequently visited by local community members, which is why the indicated distance was shorter. Contrary results were noted regarding the accessibility of recreational sites and the accompanying infrastructure (parks, water bodies, forests). The presence of recreational sites in the proximity of housing estates (up to 500 m) was regarded as most desirable. According to most respondents, primary schools should also be located within a distance of up to 500 m. The housing estate should be separated by the shortest distance (up to 200 m) from primary healthcare providers (89%), kindergartens, and retail and service outlets (72 respondents, 65%). According to 69 respondents (77%), public transport stops should be located within a distance of 201–500 m. In this respect, the residents’ needs were fairly similar across age and gender groups.
The sixth question concerned the preferred modes of transport for reaching various destinations within and outside the examined housing estates. Walking was the preferred mode of transport for 75% of respondents aged 65+. A private car was the main choice in 45–65 (73%) and 18–44 (53%) age groups. Two-wheeled vehicles such as electric scooters or motorized scooters were indicated by 16% of the respondents aged 18–44. Public transport was used by all age groups, most frequently in the 18–44 group (23%). In the following question, the surveyed residents were asked to indicate the optimal number of active recreation sites (sports fields, outdoor gyms, ice skating rinks) in their housing estates. According to 58% of the respondents, a housing estate should feature 2–3 recreational sites, each larger than 400 m2. In the question concerning the number of access roads to the housing estate, 84 respondents (75%) had a preference for 2–3 access roads. As regards the legibility of vehicular and pedestrian routes, the majority of the surveyed residents were of the opinion that traffic lanes for four-wheeled vehicles and footpaths were clearly marked; however, 104 respondents (93%) were of the opinion that the number of separate bike paths was insufficient. In question 12, nearly all respondents indicated that two parking spaces per apartment was the most user-friendly SFS solution. These observations are consistent with the statistical data of the European Automobile Manufacturers’ Association (ACEA). Poland ranks second in the European Union with regard to the number of passenger cars per 1000 inhabitants, with 662 registered vehicles per 1000 dwellers [78]. Statistical data on the size of the adult population [60] indicate that every Polish family owns two cars on average.
The optimal distance to the analyzed PS was similar in most cases, and only minor differences were noted across age groups. According to younger respondents (18–44), housing estates should be located in close proximity to schools, kindergartens, administration offices, PS, culture sites, and entertainment facilities. In turn, seniors focused on the accessibility of daily-needs stores and primary healthcare providers. The results of the questionnaire were processed statistically in the next stage of the study.

4.3. SFS Indicators

The SFS indicators were ranked on a three-point scale. To identify the optimal and the weakest SFS solutions, unfavorable indicators received 0 points, moderate indicators received 1 point, and favorable indicators received 2 points. Some of the ranks were calculated with the use of a weighted median for the cumulative sum of values. The median is least sensitive to outliers, and in this case, it supported reliable predictions of the weak spatial solutions or those particularly desired by residents. The intermediate values fell into the middle ranks. The results of the statistical analysis are presented in Table 4.
In the analyzed estates, the availability of SFS outside the housing estates was evaluated based on the respondents’ preferences regarding the optimal distance to PS as well as the results of a research study analyzing the influence of the neighborhood on real estate prices [67]. The same approach was adopted to assess the availability of selected SFS within housing estates. In turn, the values of planning parameters were determined based on the provisions of the Polish Construction Law [59] and spatial planning regulations [58] which set the minimum parameters for building development and land management. On the proposed ranking scale, minimum values were regarded as least favorable, and the remaining ranks were obtained by proportionally increasing or decreasing the values of the analyzed parameters. In this approach, an extreme rank is an open value. The number of disabled parking bays was determined based on the provisions of the Public Road Act [79] because none of the respondents was disabled. According to legal regulations, the number of disabled parking bays is determined by the total number of parking spaces, and it should equal:
  • One disabled parking bay in a parking lot with 6–15 spaces,
  • Two disabled parking bays in a parking lot with 16–40 spaces,
  • Three disabled parking bays in a parking lot with 41–100 spaces,
  • 4% in parking lots with more than 100 spaces.
Based on the above classification, the SFS indicator was regarded as unfavorable if less than 4% of total parking spaces in the analyzed housing estates were reserved for disabled drivers. However, the indicators for non-disabled parking spaces were developed by assessing the local residents’ needs in the survey.
The indicators for biologically active areas, which are defined as non-paved areas with natural vegetation, including 50% of the area of green roof and green terrace systems, were defined based on the literature [80]. The minimum share of biologically active areas in MFREs, healthcare facilities (excluding outpatient clinics), and educational facilities was set at 25%, and it was regarded as the least desirable value of the corresponding SFS indicator. The values of the analyzed SFS indicators are presented in Table 4.

4.4. Test of GIS Tools for Diagnosing SFS in Selected MFREs

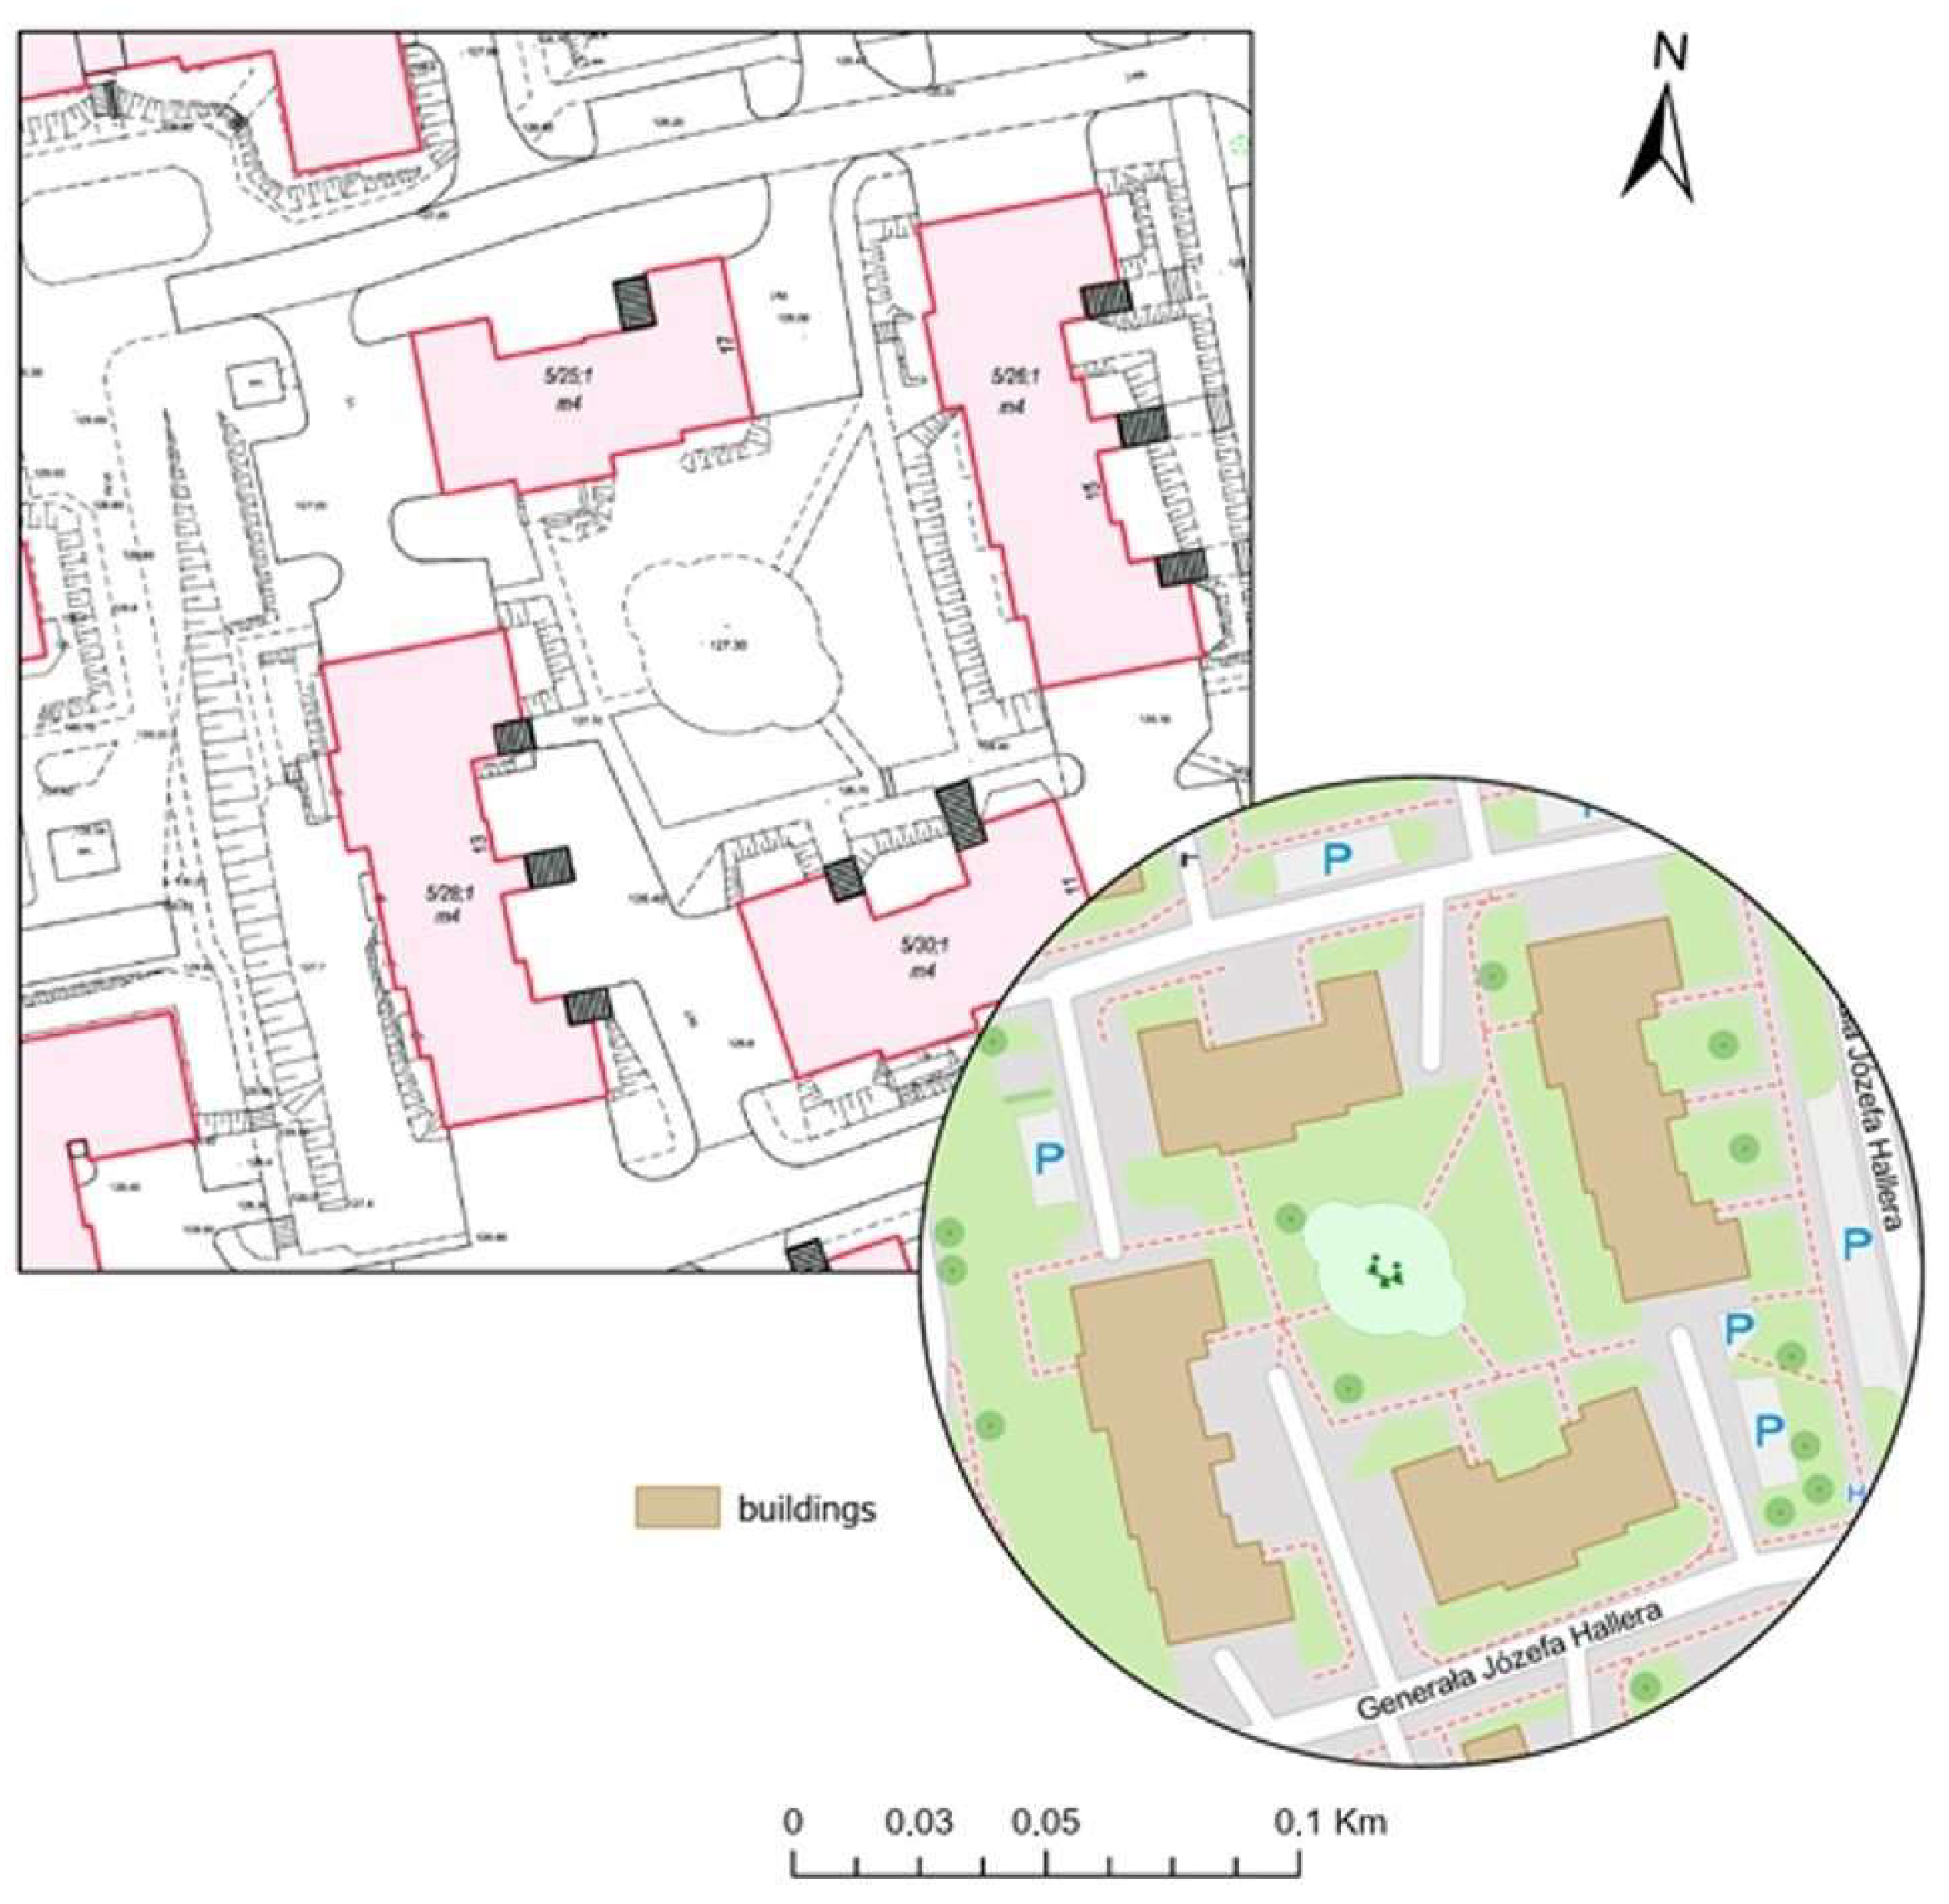
The GIS tools in ArcGIS Pro 2.9.2 and QGIS (v. 3.22.1) and the spatial databases indicated in Table 3 were used to calculate built-up areas and distances to the analyzed SFS on the developed scale. The quality of cartographic data used in the analysis, including data used to calculate the area of buildings with different functions in the evaluated housing estates (Table 5), is presented in Figure 6.
The built-up area was calculated twice. This parameter was first determined based on the vector layer of buildings in the OSM, and the result was validated by measuring the built-up area in the base (cadastral) vector map from the WebEWID system [81]. The results of both measurements were consistent in 96%, which indicates that crowdsourced data in OSM are a high-quality resource. Spatial data of high quality are increasingly available and facilitate analyses on the local scale. Spatial data are available from various sources, including informal social networks (crowdsourced data), businesses (commercial data), and public administration offices. These types of data can be downloaded from a dedicated website or directly imported into a GIS application. Spatial data are available in various formats but can be easily converted to the desired format with the use of GIS tools.
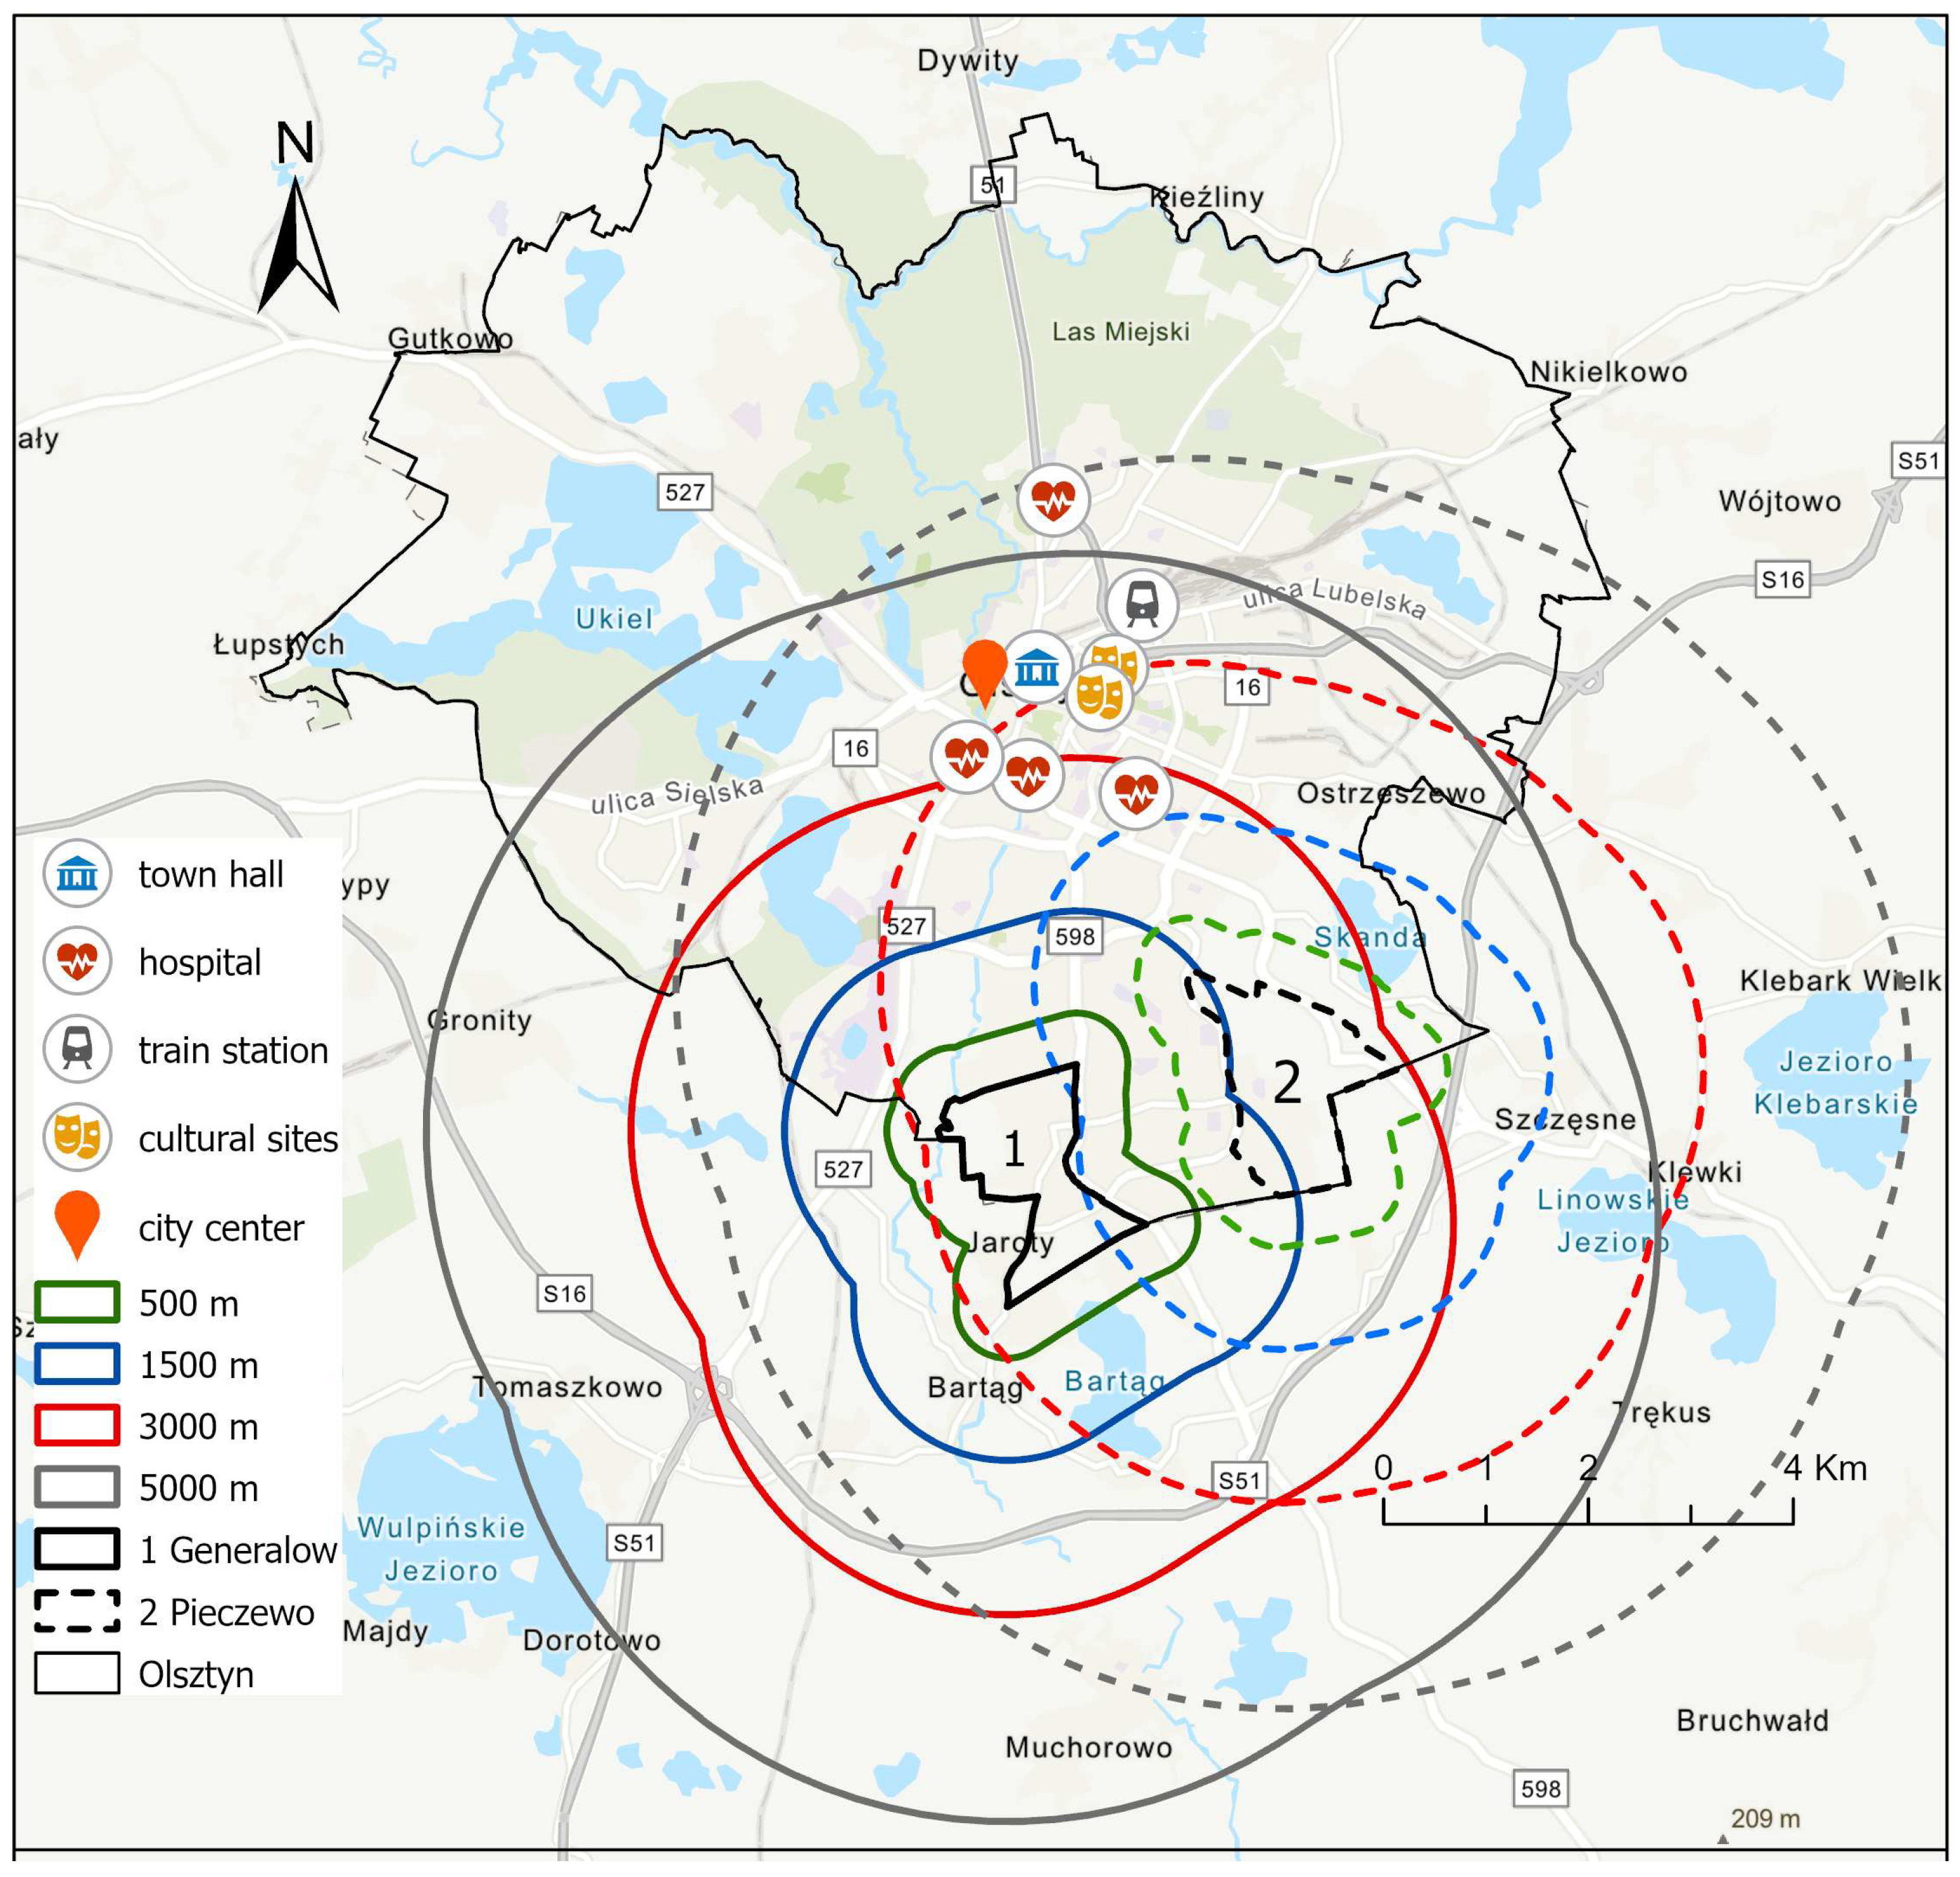
Additional layers of spatial data containing PS buildings, such as the train station or the town hall, were developed to calculate the distance to selected SFS. These objects were vectorized with the use of QGIS Desktop 3.22.1 software and the QuickMapServices plugin that adds base maps to a QGIS project. A Google map was also included to accurately identify the location of the examined SFS. The boundaries of the studied housing estates were determined based on geospatial vector data (shapefiles) from Olsztyn City Hall. The analyzed estates were separated from the shp layer with the Export function, and buffer zones were drawn around each estate. Several buffer zones with different radii were calculated (Figure 7).
As demonstrated in Figure 7, GIS tools can speed up accessibility analyses by visualizing the spatial patterns between housing estates and PS buildings and automating the process with the use of algorithms. GIS programs contain useful tools that automate spatial analyses based on specific user requirements and generate new information (secondary data). These tools can be applied to merge data from various sources, select different types of information, map buffer zones, and view 3D data.
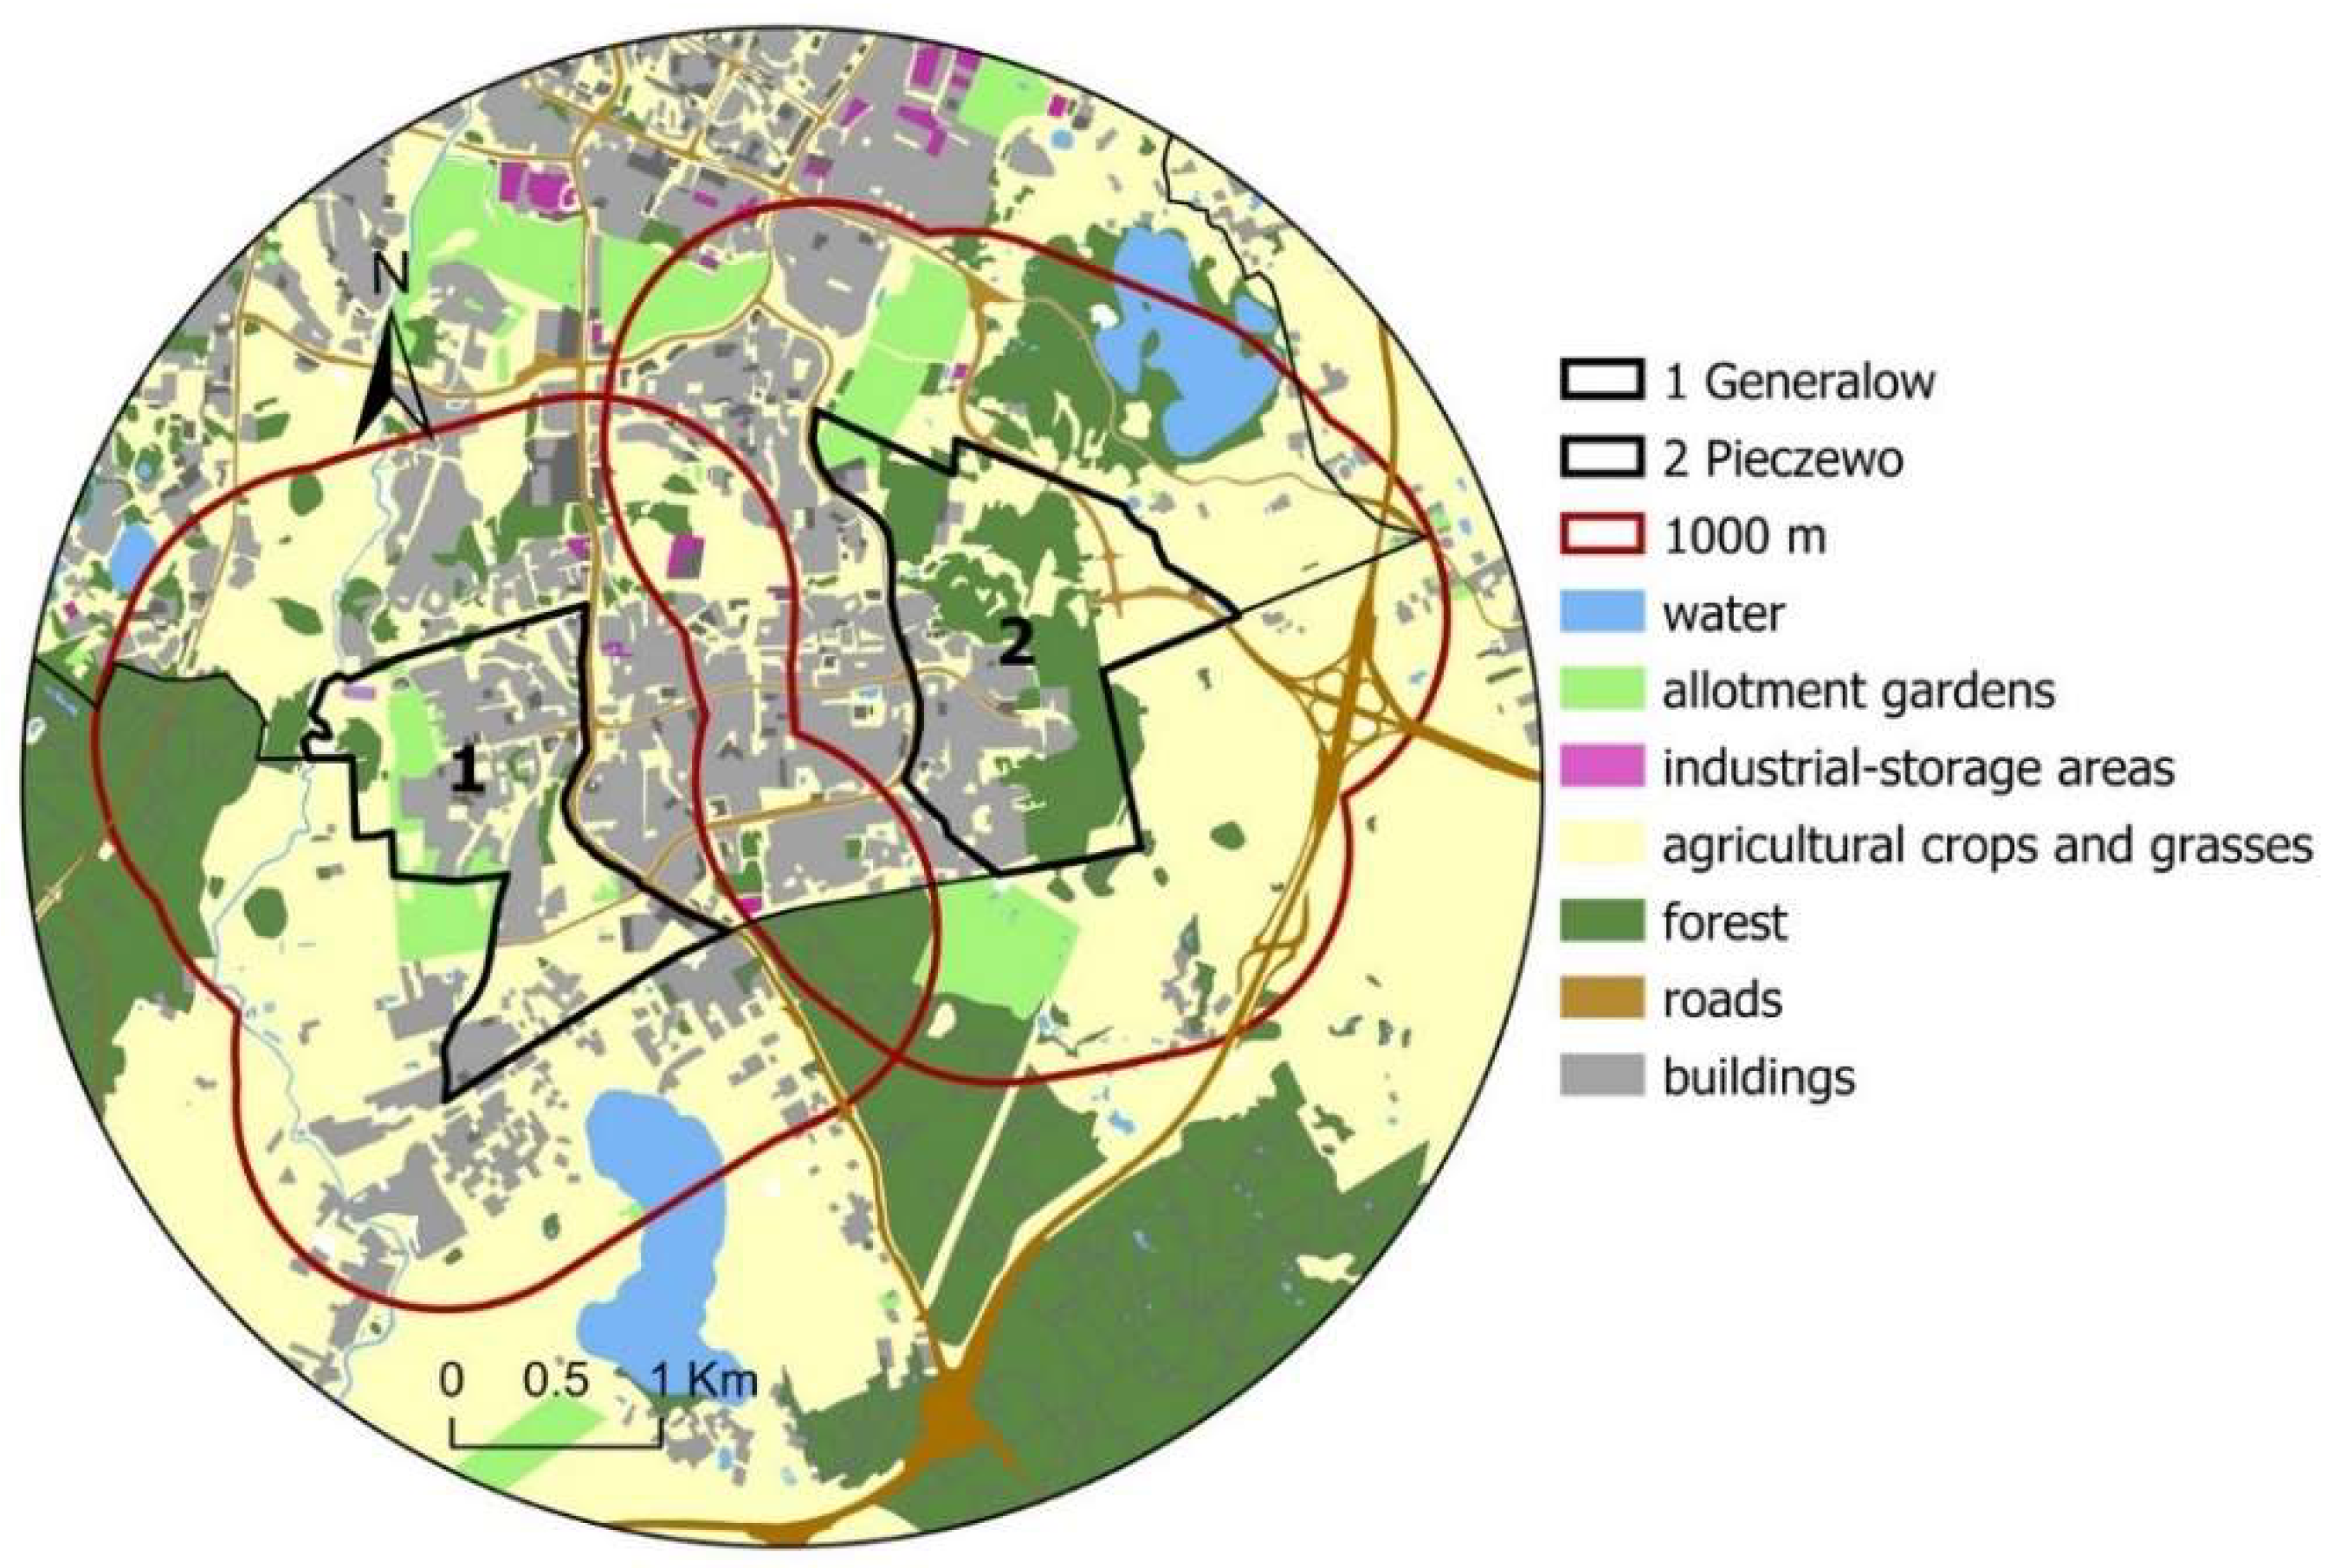
Topographic data (BDOT10k) were acquired from national geodesic and cartographic resources in the NSDI (Geoportal) [84] to identify land-use functions in areas surrounding the analyzed housing estates (Figure 8). Separate vector layers were generated for the city of Olsztyn and Olsztyn municipality, which border the studied estates. Different land-use types were placed in separate vector layers and marked with various colors to analyze neighboring areas within a 1000 m buffer from the boundaries of the evaluated housing estates.
Parking spaces were the most difficult to identify because the relevant data are not available in vector format. The Quick OSM plugin for QGIS was used to create the corresponding data layer without the need to vectorize parking lot objects. The plugin can be installed to download data in vector format from OSM. The plugin enables the user to query the OSM database and obtain the desired information (Figure 9). The new vector layer contains a description of the analyzed objects and can be used to calculate their area. In OSM, this layer was probably generated based on an inventory of orthophotomaps and images of parking spaces (P-18) and disabled parking bays (P-20) marked with horizontal labels. Therefore, the accuracy of the acquired data was verified by performing an inventory of Google Street View images. The inventory revealed additional parking spaces that were marked with vertical but not horizontal labels as parking spaces (D-18), private parking spaces (D-18a), and canopied parking spaces (D-18b). These parking spaces were added manually to the parking layer.
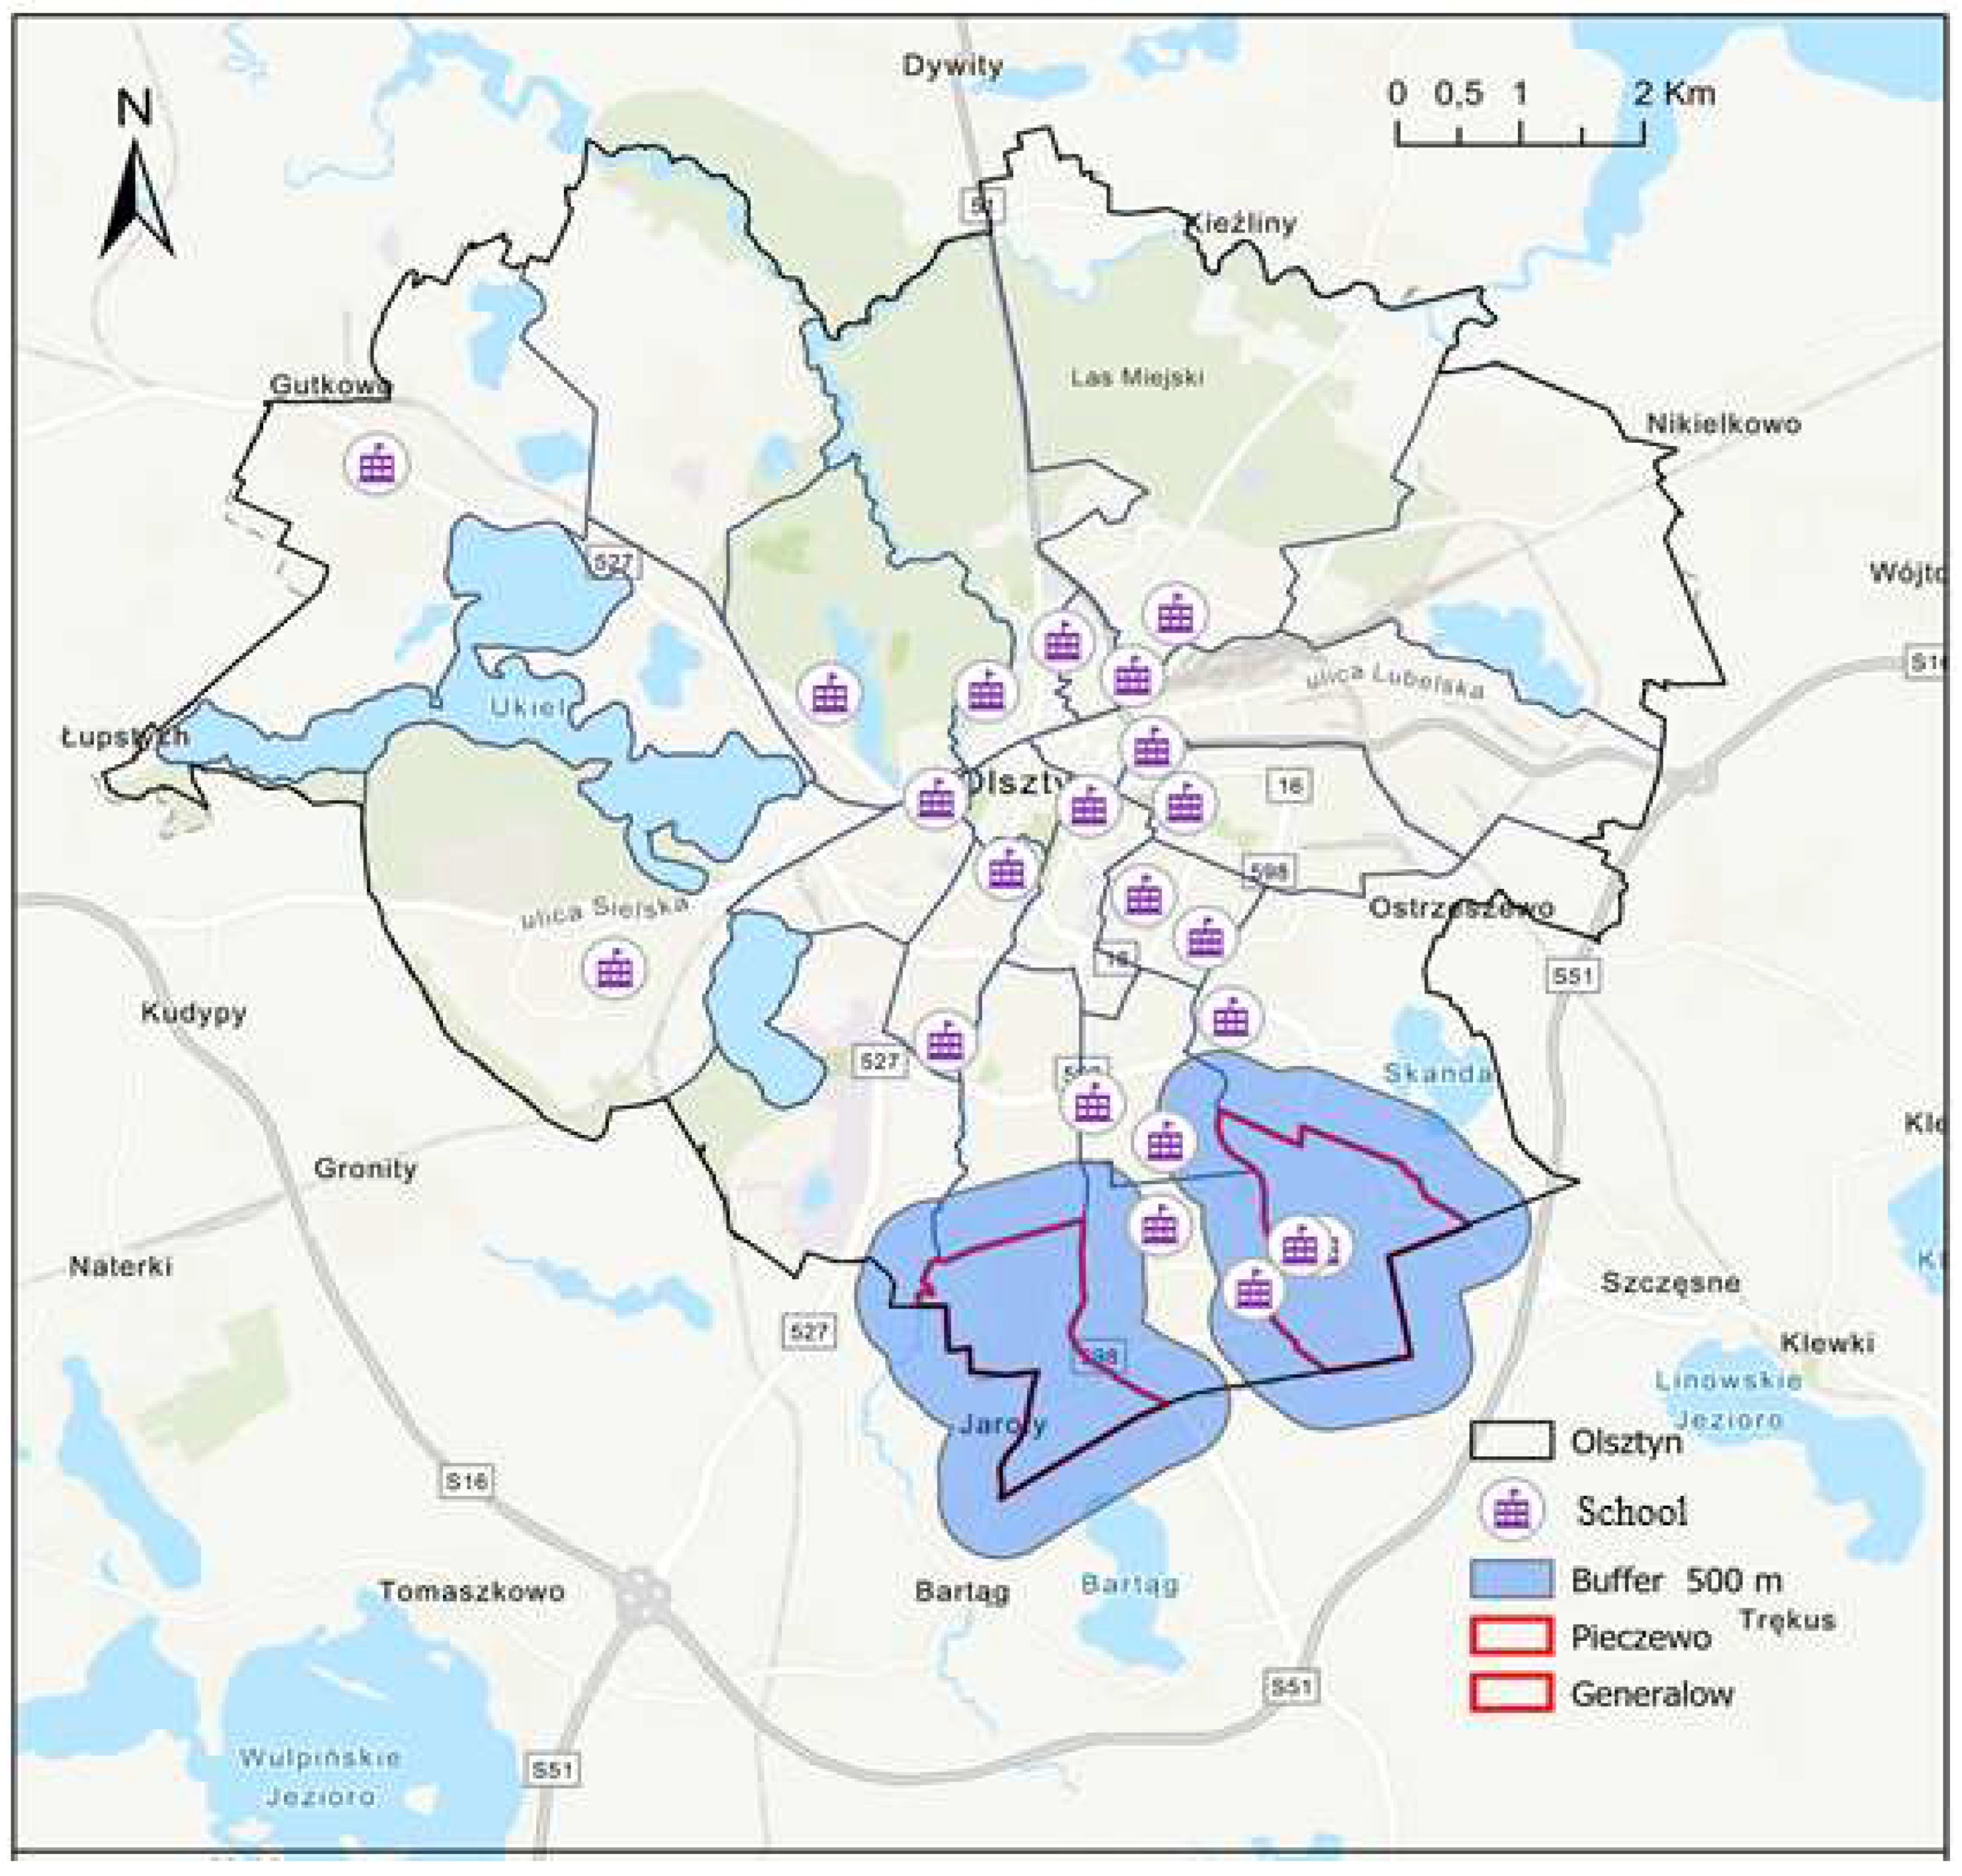
The location of educational facilities, such as primary schools, was determined by generating a map with these objects in the MSIPMO service [83]. The map was then calibrated in the ArcGIS Pro program. The point objects representing schools were vectorized and marked with the appropriate symbols. The previously generated layer of housing estates with a 500 m buffer was used in the analysis (Figure 10).
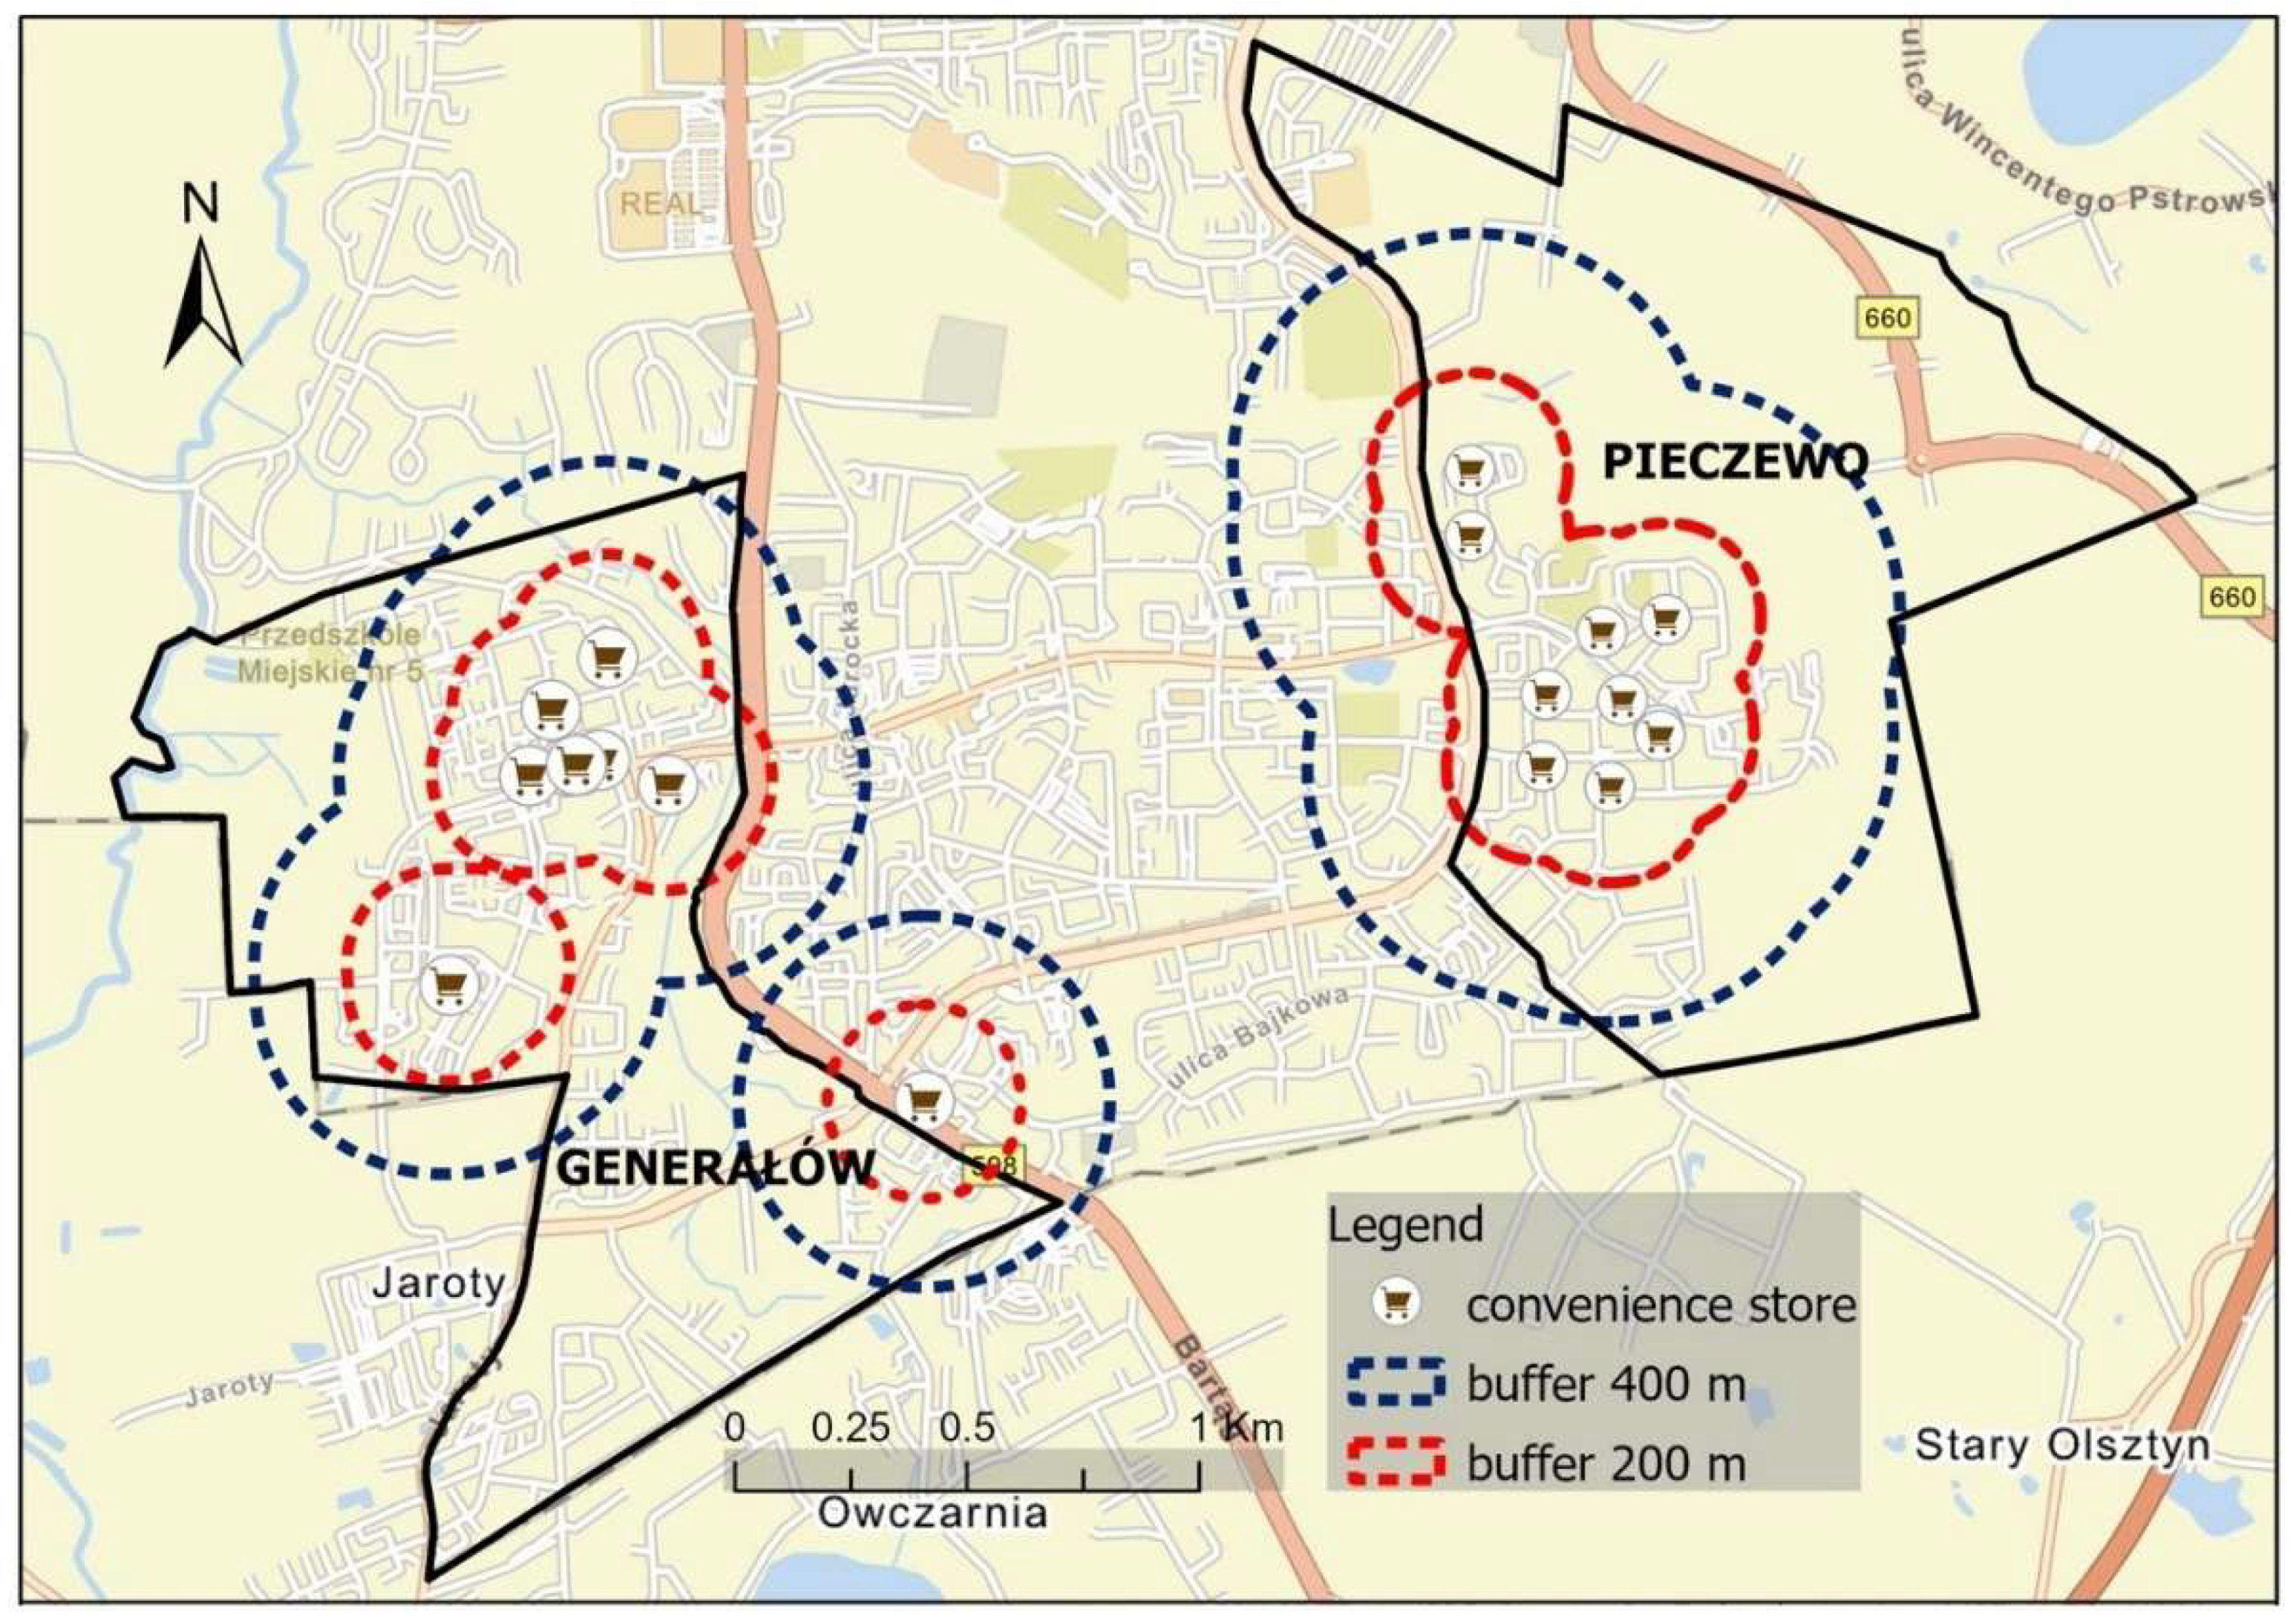
The location of retail and service outlets in the analyzed estates and in the neighborhood was determined with the use of Google Maps (Figure 11). These objects were vectorized and marked with a shopping cart symbol. Buffers with a radius of 200 m and 400 m were drawn around each identified retail and service outlet. Buffers with the same values were summed up, and their combined area was calculated in the studied housing estates. Total buffer area was then subtracted from the urbanized area in each estate to determine the percentage of each estate with access to retail and service outlets in each distance interval (Figure 11).
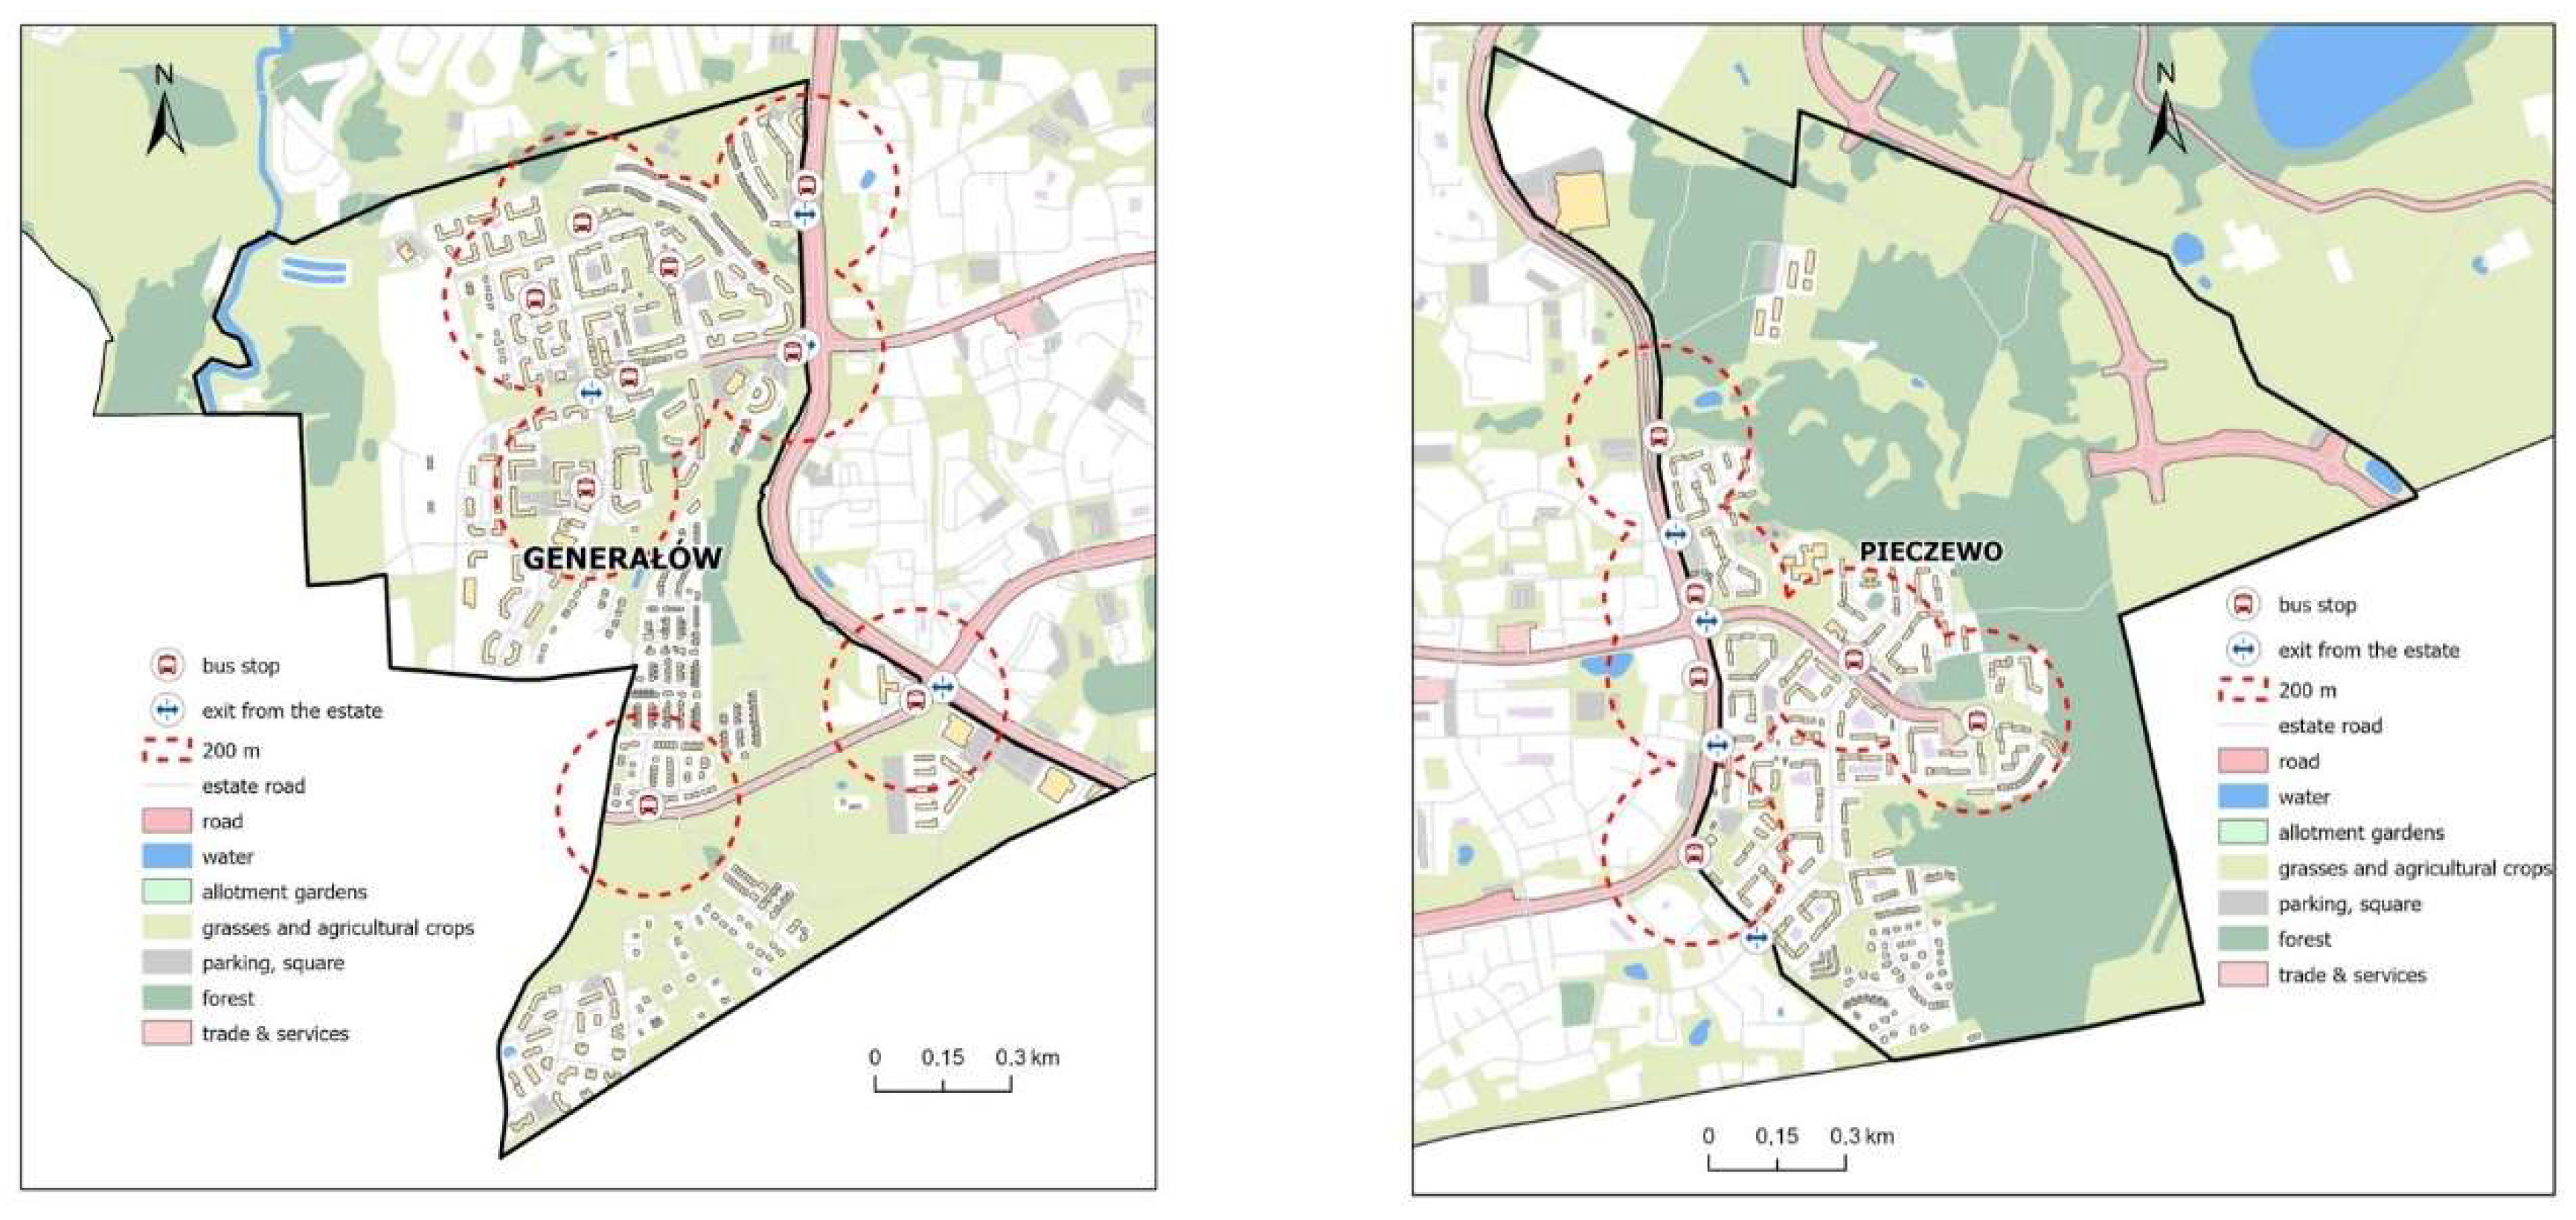
The location of public transport stops and access roads to the examined housing estates was determined with the use of the Online Mobile Bus Passenger Information System [85] and the OSM public transport database. The identified locations were vectorized and marked with vehicle symbols (public transport) and arrows (access roads). The identified public transport stops were processed with the buffering tool in GIS software (Figure 12). The total area within the 200 m buffer was calculated to determine access to public transport stops based on the preferred distances indicated by the surveyed residents in both housing estates.
GIS tools were also highly useful for identifying and assessing recreational sites such as outdoor gyms, sports fields, and playgrounds in the analyzed housing estates. The relevant data were acquired from the OSM database (Figure 13, square) and overlaid on a high-resolution orthophotomap (Figure 13, circle) from NSDI resources. This approach was used to identify and calculate the area of various types of recreational sites in the studied housing estates.
Cadastral data from the local SDI–MSIPMO were used to determine the location of buildings, building functions, number of stories, year of construction, and built-up area. Data and metadata were downloaded in tabular form. Built-up area was calculated in ArcGIS software, and the results were used to determine development density according to Formula (1) given in Directive 2012/27/EU [86]:
I = Pc/Pt
where I—density of development, Pc—total built-up area (total area of all stories), Pt—land plot area.
The process of diagnosing both housing estates was automated with the use of GIS tools. The results of spatial analyses are presented in the next Section 4.5. And they were ranked on the developed scale in Table 4.

4.5. Assessment of SFS in Multi-Family Residential Estates

The values of SFS indicators determined in the spatial analysis were summed up to determine the total value for each estate and to compare the total value with the maximum value. The results were presented in tabular form (Table 6) to facilitate the identification of similarities and differences in SFS solutions in the compared housing estates. The extent to which the identified SFS met the residents’ needs in the analyzed MFREs was evaluated on a five-point Likert scale, where SFS that met user needs in 0–20% of cases received one point (non-user-friendly), SFS that met user needs in 21–40% of cases received two points (not highly user-friendly), SFS that met user needs in 41–60% of cases received three points (moderately user-friendly), SFS that met user needs in 61–80% of cases received four points (user-friendly), and SFS that met user needs in 81–100% of cases received five points (highly user-friendly).
In the proposed method, a maximum score of 52 points could be allocated to the 26 tested parameters. The analysis revealed that Pieczewo, the older of the two estates with buildings made of precast concrete slabs, was characterized by more user-friendly SFS solutions. The SFS indicators inside the housing estate (which are highly similar in most LPHEs) played a particularly important role in the analysis due to the applied construction technology. During the construction of prefabricated settlements, concrete slabs had to be moved by heavy-duty equipment that required considerable operating space, which is why buildings had to be situated further apart from each other than in modern estates. The Pieczewo estate features additional PS, such as educational facilities and recreational sites that meet the residents’ needs. The lower density of development in LPHEs creates more space for non-residential functions, including recreation. Older housing estates feature more residential greenery and biologically active areas, which improve the quality of life, increase the attractiveness of these residential estates, and enhance access to user-friendly SFS. The compared estates also differed in external SFS indicators associated with land-use functions in the neighboring areas. However, these parameters are unique, they are unlikely to be repeated in other estates, and cannot be regarded as a rule. Older residential estates tend to be situated closer to the city center; therefore, they are more likely to have better access to selected PS. The proposed method was validated by comparing the results of the spatial analysis with the respondents’ answers to the last question in the survey. The vast majority of inhabitants from the older housing estate (83%) were satisfied with the existing SFS solutions, whereas far fewer residents in the newer estate (63%) gave equally enthusiastic answers. The main causes of dissatisfaction in the new estate were insufficient parking space, poor access to recreational sites, and obstructed views.
The values and scores assigned to SFS indicators on a three-point scale can be used to plan residential refurbishment projects in the short- and long-term perspective.

5. Conclusions

The proposed method is an effective diagnostic tool for evaluating SFS solutions in open spaces in MFREs. By conducting a survey of residents’ needs, the preferred indicators of functional–spatial structure (SFS) of residential housing estates were determined. This information can provide valuable material for designers and urban planners who are designing the layout of new housing developments or renovating existing neighborhoods. Assessing the friendliness of existing neighborhoods will also make it possible to identify those features of neighborhoods that are unfriendly to residents, which can be the basis for determining the need for renovation of neighborhoods.
The main limitation of the described method stems from the narrow scope of the conducted study, which prevented a comprehensive assessment of the quality of life in the analyzed housing estates. The developed method facilitates the assessment of the most important SFS criterion, but in this study, it was applied only to evaluate open spaces in residential estates, including in their immediate neighborhood. A comprehensive evaluation of SFS in housing estates should also involve indoor factors, including the layout of apartments and common areas in multi-family buildings. The relevant information is not available in the public domain; therefore, indoor factors were not analyzed, but they could be examined in the future. The applicability of the proposed diagnostic method can be expanded by focusing on other criteria, such as esthetics, cultural interactions, smart solutions, and economic factors. The described method can be used as the main spatial and functional reference for other evaluations. The proposed method has several advantages. Firstly, it relies on reliable and publicly available data from NSDI resources, supplemented with crowdsourced and commercial data. Secondly, the described method accounts for residents’ current needs. Thirdly, the method can be fully automated, beginning from the survey of residential needs and calculation of SFS indicators, to the generation of diagnostic results and development of maps illustrating user-friendly SFS solutions in MFREs. The proposed method is not highly laborious or time-consuming, and it can be applied periodically to monitor residents’ satisfaction with the existing SFS solutions in housing estates. The described approach should always be based on an analysis of local needs. The method can be easily implemented in countries with advanced SDI systems. In countries without SDI, spatial data must be inventoried and aggregated, and the relevant databases created and regularly updated, which is a laborious process that prolongs the implementation of the proposed method. GIS was used to represent data.
The results confirmed the research hypothesis postulating that older LPHEs are characterized by more user-friendly SFS solutions than modern MFREs.
Spatial analyses can be automated, and SFS solutions can be identified and visualized on the macro scale with the use of commercial GIS software as well as free GIS tools. These tools can be applied to evaluate and model space, including for the need for refurbishment projects in MFREs.

Author Contributions

Conceptualization, M.D. and A.D.; methodology, A.D.; software, M.D.; validation, M.D. and A.D.; formal analysis, M.D. and A.D.; investigation, A.D. and M.D.; resources, M.D.; data curation, M.D.; writing—original draft preparation, A.D. and M.D.; writing—review and editing, A.D. and M.D.; visualization, M.D.; supervision, A.D.; project administration, A.D.; funding acquisition, M.D. and A.D. All authors have read and agreed to the published version of the manuscript.

Funding

This research is not funded by external sources.

Institutional Review Board Statement

Ethical review and approval were waived for this study due to not processing sensitive and personal data.

Informed Consent Statement

Informed consent was obtained from all subjects involved in the study.

Data Availability Statement

Data was obtained from Open Source Spatial Data Information Systems referred in the manuscript and housing preference surveys. The survey interview took place with the consent of the respondents. The data is on the authors’ resources.

Conflicts of Interest

The authors declare no conflict of interest.

References

  1. Desa, U.N. Transforming Our World: The 2030 Agenda for Sustainable Development. A/RES/70/1 United Nation Publication. 2016. Available online: https://stg-wedocs.unep.org/bitstream/handle/20.500.11822/11125/unepswiosm1inf7sdg.pdf?sequence=1 (accessed on 12 January 2022).
  2. World Health Organization. Global Age-Friendly Cities: A Guide; World Health Organization: Geneva, Switzerland, 2007.
  3. Bradecki, T.; Twardoch, A. Contemporary Directions of Residential Development; Wydawnictwo Politechniki Śląskiej: Gliwice, Poland, 2013. (In Polish) [Google Scholar]
  4. EUROSTAT. 2020. Available online: https://ec.europa.eu/eurostat/statistics-explained/index.php?title=Housing_statistics/ pl&oldid=498750 (accessed on 24 August 2020).
  5. Kabisch, S.; Grossmann, K. Challenges for large housing estates in light of population decline and ageing: Results of a long-term survey in East Germany. Habitat Int. 2013, 39, 232–239. [Google Scholar] [CrossRef]
  6. Chmielewski, J.M. Urban Planning Theory: Selected Issues; Oficyna Wydawnicza Politechniki Warszawskiej: Gliwice, Poland, 1996. (In Polish) [Google Scholar]
  7. Faron, A. Selected factors of the city’s functional-spatial structure, the shaping of which may affect the transport behavior of residents. Logistyka 2014, 3, 1666–1675. (In Polish) [Google Scholar]
  8. McCoy, A.P.; Koebel, C.T.; Sanderford, A.R.; Franck, C.T.; Keefe, M.J. Adoption of high-performance housing technologies among US homebuilding firms, 2000 through 2010. Cityscape 2015, 17, 167–188. [Google Scholar]
  9. Gusmao Brissi, S.; Debs, L.; Elwakil, E. A Review on the Factors Affecting the Use of Offsite Construction in Multifamily Housing in the United States. Buildings 2020, 11, 5. [Google Scholar] [CrossRef]
  10. Lee, H.-J.; Carucci Goss, R.; Beamish, J.O. Influence of lifestyle on housing preferences of multifamily housing residents. Hous. Soc. 2007, 34, 11–30. [Google Scholar] [CrossRef] [Green Version]
  11. Roldan, H. Multifamily Housing. In Independent for Life: Homes and Neighborhoods for an Aging America; Henry, C., Margaret, D.-C., Jane, H., Eds.; University of Texas Press: Austin, TX, USA, 2021; pp. 133–138. [Google Scholar]
  12. Wolny, A.; Dawidowicz, A.; Zróbek, R. Identification of the spatial causes of urban sprawl with the use of land information systems and GIS tools. Bull. Geogr. Socio-Econ. Ser. 2017, 35, 111. [Google Scholar] [CrossRef] [Green Version]
  13. Raczyński, M. The development process of multi-family housing and the influence of sustainable development theory. Przestrz. Forma 2019, 109–130. [Google Scholar] [CrossRef]
  14. Podciborski, T.; Orzoł, R. Development of a method for assessing the state of the spatial order of multifamily housing estate. Acta Sci. Pol. Adm. Locorum 2012, 11, 4. (In Polish) [Google Scholar]
  15. Winston, N. Multifamily housing and resident life satisfaction in Europe: An exploratory analysis. Hous. Stud. 2017, 32, 887–911. [Google Scholar] [CrossRef]
  16. Zwierzchowska, I.; Haase, D.; Dushkova, D. Discovering the environmental potential of multi-family residential areas for nature-based solutions. A Central European cities perspective. Landsc. Urban Plan. 2021, 206, 103975. [Google Scholar] [CrossRef]
  17. Lis, A. Exploring social space features in residential settings. Methodological proposals. Archit. Kraj. 2010, 3, 4–13. (In Polish) [Google Scholar]
  18. Karcz, S. Trends in the formation of newly built housing estates in Europe, Poland and Lodz. Space Soc. Econ. 2018, 26, 117–137. (In Polish) [Google Scholar] [CrossRef] [Green Version]
  19. Kondić, S.; Živković, M.; Tanić, M.; Kostić, I. Sustainability of post-socialist urban design treatment of public open spaces in multi-family housing areas: Case study of Niš, Serbia. Facta Univ. Ser. Archit. Civ. Eng. 2021, 19, 155–169. [Google Scholar] [CrossRef]
  20. Vela, I.Y. The contribution of greenery in multi-family houses as a factor of well-being. In Landscape, Well-Being and Environment; Routledge: Abingdon-on-Thames, UK, 2013; pp. 101–122. [Google Scholar]
  21. Brown, F.; Neary, S.; Symes, M. Reading the residential landscape. In The Urban Experience; Routledge: Abingdon-on-Thames, UK, 2003; pp. 188–216. [Google Scholar]
  22. Shan, X.; Wang, Y.; Dong, M.; Xia, J. Application Research and Analysis of Geographic Information System in Intelligent City Surveying and Mappinge. J. Phys. Conf. Ser. 2021, 1881, 042071. [Google Scholar] [CrossRef]
  23. Dawidowicz, A.; Muczynski, A.; Pacholczyk, M.E. The use of GIS tools for sustainable management of municipal housing stock in Poland. Surv. Rev. 2019, 51, 431–441. [Google Scholar] [CrossRef]
  24. Grigsby, W.G.; Rosenburg, L. Urban Housing Policy; Routledge: Abingdon-on-Thames, UK, 2017. [Google Scholar]
  25. Directive INSPIRE. Directive 2007/2/EC of the European Parliament and of the Council of 14 March 2007 establishing an Infrastructure for Spatial Information in the European Community (INSPIRE). Off. J. 2007, 43, 233. Available online: https://inspire.ec.europa.eu/documents/Data_Specifications/INSPIRE_DataSpecification_US_v3.0rc3.pdf (accessed on 20 March 2022).
  26. Temelova, J.; Novak, J.; Ourednicek, M.; Puldova, P. Housing Estates in the Czech Republic after Socialism: Various Trajectories and Inner Differentiation. Urban Stud. 2011, 48, 1811–1834. [Google Scholar] [CrossRef] [Green Version]
  27. Vasilevska, L.; Vranic, P.; Marinkovic, A. The effects of changes to the post-socialist urban planning framework on public open spaces in multi-story housing areas: A view from Nis, Serbia. Cities 2014, 36, 83–92. [Google Scholar] [CrossRef]
  28. Kovács, Z.; Herfert, G. Development pathways of large housing estates in post-socialist cities: An international comparison. Hous. Stud. 2012, 27, 324–342. [Google Scholar] [CrossRef]
  29. Kolisz, K.; Kłosak, A.K.; Bucka, A.; Ziarko, B. Possibilities of revitalizing the spatial system of a housing complex with large-panel buildings on the example of the “Ruczaj-Zaborze” housing estate in Kraków. Przegląd Bud. 2015, 86, 43–47. (In Polish) [Google Scholar]
  30. Szafrańska, E. Transformations of large housing estates in post-socialist city: The case of Łódź, Poland. Przegląd Bud. 2015, 86, 77–93. [Google Scholar] [CrossRef] [Green Version]
  31. Kotus, J. Changes in the spatial structure of a large Polish city–The case of Poznań. Cities 2006, 23, 364–381. [Google Scholar] [CrossRef]
  32. Warchalska-Troll, A. How to measure susceptibility to degradation in large post-socialist housing estates? Prace Geogr. 2012, 130, 55–71. [Google Scholar] [CrossRef]
  33. Warchalska-Troll, A. Progress of rehabilitation of large housing estates in Katowice (Poland). Hung. Geogr. Bull. 2013, 62, 102–112. [Google Scholar]
  34. Łodziński, P. Selected problems of modernization of large-panel residential buildings on the example of Hellersdorf in Berlin. Archit. Artibus 2009, 1, 39–43. (In Polish) [Google Scholar]
  35. Vasilevska, L.; Zivkovic, J.; Vasilevska, M.; Lalovic, K. Revealing the relationship between city size and spatial transformation of large housing estates in post-socialist Serbia. J. Hous. Built Environ. 2020, 35, 1099–1121. [Google Scholar] [CrossRef]
  36. Kährik, A.; Tammaru, T. Soviet prefabricated panel housing estates: Areas of continued social mix or decline? The case of Tallinn. Hous. Stud. 2010, 25, 201–219. [Google Scholar] [CrossRef]
  37. Bouzarovski, S.; Salukvadze, J.; Gentile, M. A socially resilient urban transition? The contested landscapes of apartment building extensions in two post-communist cities. Urban Stud. 2011, 48, 2689–2714. [Google Scholar] [CrossRef] [Green Version]
  38. Hirt, S. Belgrade, Serbia. Cities 2009, 26, 293–303. [Google Scholar] [CrossRef]
  39. Hess, D.B.; Tammaru, T.; van Ham, M. Housing Estates in Europe Poverty, Ethnic Segregation and Policy Challenges Preface. In Housing Estates in Europe: Poverty, Ethnic Segregation and Policy Challenges; Hess, D.B., Tammaru, T., VanHam, M., Eds.; Urban Book Series; Springer Nature: Berlin/Heidelberg, Germany, 2018; p. 429. [Google Scholar]
  40. Jura, J. Improvement of energy and ecological parameters of a multi-family building in order to meet WT 2021 requirements. Bud. Zoptymalizowanym Potencjale Energetycznym 2018, 7, 15–22. (In Polish) [Google Scholar] [CrossRef]
  41. Goczyńska, E. Repetition versus individuality in architecture. Tech. Issues 2016, 3, 29–35. (In Polish) [Google Scholar]
  42. van Kempen, R.; Murie, A.; Knorr-Siedow, T.; Tosics, I. Regenerating Large Housing Estates in Europe: A Guide to Better Practice; Urban and Regional Research Centre: Utrecht, The Netherlands, 2006. [Google Scholar]
  43. Chaberko, T.; Kretowicz, P. New multi-family housing in the area of large housing estates on the example of Nowa Huta. Space Soc. Econ. 2012, 11, 197–209. (In Polish) [Google Scholar]
  44. Śleszyński, P. Socio-economic effects of spatial chaos on settlement and the functional structure of land. Studia KPZK 2018, 182, 1–52. (In Polish) [Google Scholar]
  45. Kuźnik, F.; Klasik, A. Spatial management in urban areas. Analysis of spatial chaos phenomena. Studia KPZK 2017, 174, 1–22. (In Polish) [Google Scholar]
  46. Gwiazdzinska-Goraj, M.; Pawlewicz, K.; Jezierska-Thole, A. Differences in the Quantitative Demographic Potential-A Comparative Study of Polish-German and Polish-Lithuanian Transborder Regions. Sustainability 2020, 12, 9414. [Google Scholar] [CrossRef]
  47. Gwiaździńska-Goraj, M.; Jezierska-Thöle, A.; Dudzińska, M. Assessment of the Living Conditions in Polish and German Transborder Regions in the Context of Strengthening Territorial Cohesion in the European Union: Competitiveness or Complementation? Soc. Indic. Res. 2022, 1–31. [Google Scholar] [CrossRef]
  48. Bradecki, T. Planning a compact city on the examples of competition urban designs: The case of Stargard Szczeciński Giżynek district. Studia Miej. 2015, 19, 47–57. (In Polish) [Google Scholar]
  49. Benkő, M. Evaluating factors in the image of housing estates. Period. Polytech. Archit. 2012, 43, 33–36. [Google Scholar] [CrossRef] [Green Version]
  50. Lis, C.; Woźniak, M. The use of taxonomic methods in assessing housing attractiveness of Szczecin’s housing estates. Zesz. Nauk. Uniw. Szczecińskiego. Studia Pr. Wydziału Nauk. Ekon. Zarządzania 2014, 36, 331–345. (In Polish) [Google Scholar]
  51. Garcia-Perez, S.; Oliveira, V.; Monclus, J.; Medina, C.D. UR-Hesp: A methodological approach for a diagnosis on the quality of open spaces in mass housing estates. Cities 2020, 103, 102657. [Google Scholar] [CrossRef]
  52. Kim, S.-S.; Yang, I.-H.; Yeo, M.-S.; Kim, K.-W. Development of a housing performance evaluation model for multi-family residential buildings in Korea. Build. Environ. 2005, 40, 1103–1116. [Google Scholar] [CrossRef]
  53. Majerska-Pałubicka, B. Attempts to optimize methods of sustainable architectural design. Architectus 2014, 2, 15–27. [Google Scholar]
  54. Johnson, T.P. Snowball sampling: Introduction. In Wiley StatsRef: Statistics Reference Online; Wiley: Hoboken, NJ, USA, 2014. [Google Scholar]
  55. Dijkstra, L.; Poelman, H.; Veneri, P. The EU-OECD Definition of a Functional Urban Area. 2019. Available online: https://www.oecd-ilibrary.org/docserver/d58cb34d-en.pdf?expires=1653683343&id=id&accname=guest&checksum=F311B377D86BDE615D84B6AE966F5A04 (accessed on 10 March 2022).
  56. GUS. BDL. Central Statistical Office. Local Data Bank. Available online: https://bdl.stat.gov.pl/bdl/start (accessed on 20 January 2022).
  57. MPRO Olsztyn, 2020. Olsztyn Urban Revitalization Program to 2020 (In Polish: Miejski Program Rewitalizacji Olsztyna do 2020 r.). Available online: http://bip.olsztyn.eu/bip/dokument/321755/xxiv_345_16_w_sprawie_przyjecia_miejskiego_programu_rewitalizacji_olsztyna_2020_r_//&cspg_page=1 (accessed on 20 January 2022).
  58. Act. 2003. Act of 27 March 2003 on Spatial Planning and Development. Polish Chancellery of the Sejm, (In Polish: Ustawa z Dnia 27 Marca 2003 Roku o Planowaniu i Zagospodarowaniu Przestrzennym Dz. U. z 2021 r. Poz. 741 z Późn. zm.) 2003. Available online: https://isap.sejm.gov.pl/isap.nsf/download.xsp/WDU20030800717/U/D20030717Lj.pdf (accessed on 15 February 2022).
  59. Act of July 7, 1994, Construction Law. (J. Laws 2021.2351), Polish Chancellery of the Sejm, (In Polish: Ustawa z Dnia 7 Lipca 2007 roku Prawo Budowlane), 1994. Available online: https://isap.sejm.gov.pl/isap.nsf/download.xsp/WDU19940890414/U/D19940414Lj.pdf (accessed on 15 February 2022).
  60. CSO—Central Statistical Office. Poland in Numbers 2020 (In Polish: Polska w Liczbach 2020), Warszawa, 2020. Available online: https://stat.gov.pl/obszary-tematyczne/inne-opracowania/inne-opracowania-zbiorcze/polska-w-liczbach-2020,14,13.html (accessed on 14 February 2022).
  61. Bradecki, T. Spatial models of optimal residence. Pr. Nauk./Uniw. Ekon. w Katowicach 2019, 54–67. Available online: http://bazekon.icm.edu.pl/bazekon/element/bwmeta1.element.ekon-element-000171564595 (accessed on 15 February 2022).
  62. Dawidowicz, A.; Zysk, E.; Figurska, M.; Zrobek, S.; Kotnarowska, M. The methodology of identifying active aging places in the city—Practical application. Cities 2020, 98, 102575. [Google Scholar] [CrossRef]
  63. Prague Food Exchange. Why Do Poles Choose to Shop in Neighbourhood Stores? Available online: https://www.praskagieldaspozywcza.pl/dlaczego_polacy_wybieraja_zakupy_w_sklepach_osiedlowych/ (accessed on 5 February 2022). (In Polish).
  64. Hui, E.C.M.; Chau, C.K.; Pun, L.L.; Law, M.Y. Measuring the neighboring and environmental effects on residential property value: Using spatial weighting matrix. Build. Environ. 2007, 42, 2333–2343. [Google Scholar] [CrossRef]
  65. Cellmer, R.; Cichulska, A.B.; Bełej, M. The regional spatial diversity of housing prices and market activity–evidence from Poland. Acta Sci. Pol. Adm. Locorum 2021, 20, 5–18. [Google Scholar] [CrossRef]
  66. D’Acci, L. Quality of urban area, distance from city centre, and housing value. Case study on real estate values in Turin. Cities 2019, 91, 71–92. [Google Scholar] [CrossRef]
  67. Glaesener, M.-L.; Caruso, G. Neighborhood green and services diversity effects on land prices: Evidence from a multilevel hedonic analysis in Luxembourg. Landsc. Urban Plan. 2015, 143, 100–111. [Google Scholar] [CrossRef]
  68. PN-ISO 9836:2015-12; Building Characteristics in Construction. Determination and Calculation of Area and Volume Indices. ISO: Geneva, Switzerland, 2015. (In Polish)
  69. Faron, A. The effect of development intensity on public transport trip share-a modeling analysis. Zesz. Nauk. -Tech. Stowarzyszenia Inżynierów Tech. Komun. Krakowie. Ser. Mater. Konf. 2012, 1, 64–75. (In Polish) [Google Scholar]
  70. Vasilevska, L.; Vranić, P.; Vasilevska, M. Evaluating the Relationship between Urban Redevelopment of Large Housing Estates and Urban Green Space Based on GIS–MCDM Approach: Empirical Experience from Niš, Serbia. J. Urban Plan. Dev. 2022, 148, 5022005. [Google Scholar] [CrossRef]
  71. Joachimowicz, A.; Nieścioruk, K. Analiza rozkładu hałasu w przestrzeni osiedla im. A. Mickiewicza w Lublinie. Bud. I Archit. 2018, 17, 181–192. [Google Scholar] [CrossRef]
  72. Xue, C.; Ju, Y.; Li, S.; Zhou, Q.; Liu, Q. Research on accurate house price analysis by using GIS technology and transport accessibility: A case study of Xi’an, China. Symmetry 2020, 12, 1329. [Google Scholar] [CrossRef]
  73. Ike, F.; Esther, N. Health-Care Facilities Accessibility Analysis Using GIS: A case Study of Uyo Municipal South–Eastern Nigeria. Eur. J. Appl. Sci. 2022, 10, 313–323. [Google Scholar]
  74. Chung, Y.S.; Seo, D.; Kim, J. Price determinants and GIS analysis of the housing market in Vietnam: The cases of Ho Chi Minh City and Hanoi. Sustainability 2018, 10, 4720. [Google Scholar] [CrossRef] [Green Version]
  75. Dawidowicz, A.; Nowak, M.; Gross, M. Land administration system and geoportal service for the need of a fit-for-purpose national urban greenery management system (UGMS). The concept for the EU member state of Poland. Acta Sci. Pol. Adm. Locorum 2022, 21, 53–81. [Google Scholar] [CrossRef]
  76. Dawidowicz, A.; Skorupska, N. The development of chosen web mapping local service of land information infrastructure in the direction of Land Administration System Construction - a case study. Acta Sci. Pol. Adm. Locorum 2016, 15, 27–45. [Google Scholar]
  77. Kulawiak, M.; Dawidowicz, A.; Pacholczyk, M.E. Analysis of server-side and client-side Web-GIS data processing methods on the example of JTS and JSTS using open data from OSM and geoportal. Comput. Geosci. 2019, 129, 26–37. [Google Scholar] [CrossRef]
  78. European Automobile Manufacturers’ Association. ACEA Report. In Vehicles in Use Europe; 2022; Available online: https://www.acea.auto/publication/report-vehicles-in-use-europe-2022/ (accessed on 10 March 2022).
  79. Act of March 21, 1985 on Public Roads. J. Laws 2021. Item 1376, Polish Chancellery of the Sejm. (In Polish: Ustawa z Dnia 21 Marca 1985 o Drogach Publicznych). Available online: https://isap.sejm.gov.pl/isap.nsf/download.xsp/WDU19850140060/U/D19850060Lj.pdf (accessed on 15 March 2022).
  80. Regulation of the Minister of Infrastructure of 12 April 2002 on the Technical Conditions Technical Conditions to Be Met by Buildings and Their Location (In Polish: Rozporzadzenie Ministra Infrastrukturyz Dnia 12 Kwietnia 2002 r. w Sprawie Warunków Technicznych, Jakim Powinny Odpowiadać Budynki i Ich Usytuowanie. Dz. U. 2002, Nr 75, Poz. 690 z Późn. zm.). Available online: https://lexlege.pl/rozporzadzenie-ministra-infrastruktury-w-sprawie-warunkow-technicznych-jakim-powinny-odpowiadac-budynki-i-ich-usytuowanie/ (accessed on 15 March 2022).
  81. WebEwid Olsztyn Portal. Available online: https://webewid.olsztyn.eu/e-uslugi/portal-mapowy (accessed on 15 March 2022).
  82. OpenStreetMap. Available online: https://www.openstreetmap.org/#map=16/53.7414/20.5088 (accessed on 21 March 2022).
  83. MSIPMO Portal. Map Portal of the Olsztyn Spatial Information System. Available online: https://msipmo.olsztyn.eu/imap/ (accessed on 15 March 2022).
  84. NSDI Geoportal (Poland). National Spatial Data Infrastructure. Available online: https://mapy.geoportal.gov.pl/imap/Imgp_2.html?gpmap=gp0 (accessed on 16 January 2022).
  85. Passenger Information System—Bus Online Mobile Timetable of Administration of Roads, Greenery and Transport in Olsztyn. Available online: http://sip.zdzit.olsztyn.eu/ (accessed on 5 February 2022).
  86. Directive on energy efficiency. Directive 2012/27/EU of the European Parliament and of the Council of 25 October 2012 on energy efficiency, amending Directives 2009/125/EC and 2010/30/EU and repealing Directives 2004/8/EC and 2006/32. Off. J. L 2012, 315, 1–56. Available online: http://data.europa.eu/eli/dir/2012/27/oj (accessed on 10 February 2022).
Figure 1. Examples of large prefabricated housing estates and modern residential estates in Olsztyn.
Sustainability 14 06642 g001
Figure 2. The MFRE evaluation process. Source: own elaboration. * Abbreviations: MFRE: multi-family residential estate, SFSs: spatial and functional structures, LPHEs: large prefabricated housing estates.
Sustainability 14 06642 g002
Figure 3. Location of Olsztyn on a map of Europe and the administrative division of the city. Source: own elaboration.
Sustainability 14 06642 g003
Figure 4. Pieczewo housing estate. Source: The map and the photographs were generated by the authors.
Sustainability 14 06642 g004
Figure 5. Generałów housing estate. Source: The map and the photographs were generated by the authors.
Sustainability 14 06642 g005
Figure 6. Residential built-up area (square—base map downloaded from WebEWID [81]; circle—map downloaded from OpenStreetMap [82]). Source: own elaboration.
Sustainability 14 06642 g006
Figure 7. Accessibility of selected public service buildings outside the studied housing estates. Source: own elaboration based on MSIPMO Portal [83].
Sustainability 14 06642 g007
Figure 8. Analysis of land-use functions in the neighborhood of the evaluated housing estates. Source: own elaboration.
Sustainability 14 06642 g008
Figure 9. Identification of parking spaces in housing estates. Source: own elaboration based on OSM data and the database of topographic objects (BDOT10k).
Sustainability 14 06642 g009
Figure 10. Accessibility of educational facilities—primary schools within a distance of 500 m from estate boundaries. Source: own elaboration.
Sustainability 14 06642 g010
Figure 11. Accessibility of retail and service outlets. Source: own elaboration.
Sustainability 14 06642 g011
Figure 12. Accessibility of public transport stops and access roads to housing estates. Source: own elaboration.
Sustainability 14 06642 g012
Figure 13. Identification of outdoor recreational areas. Source: own elaboration.
Sustainability 14 06642 g013
Table 1. The accepted body of knowledge on the core approaches to assessments of multi-family housing.
No.Core ApproachesIndicators/ParametersData SourcesCase StudyKey Authors and References
1Planning structureFeatures of settlement development including: spatial composition, development intensity ratio, basic spatial objects serving human mobility, communication solutions, and ecological solutions in spatial planning.Urban planning materials, cartographic materials, data from field survey.Dublin/Ireland (Marianella Housing); Kolonia/Germany (Physikersiedlung); Madrid/Spain (Nuevo Retiro Torres Cañaveral);
Poland/Katowice (Francuska Park); Kraków (Bagry Park); Warsaw (Nowy Targówek)
Bradecki T. [48]; Karcz S. [18]
2Revitalization/modernization parameters
(1)
Physical conditions of buildings (e.g., full renovation, only painted, under renovation/construction, no renovation) including the state of the building’s surroundings—substantial changes (pavements, driveways, etc.) as well as minor changes (street furniture, entrance doors to the blocks, waste containers, etc.);
(2)
State of playgrounds (representing public spaces and social infrastructure at the same time);
(3)
Functional structure of the estate and access to basic facilities.
Data from field survey.Katowice/Poland (Housing Estates: Witosa, Paderewskiego, Tysiąclecia)Warchalska-Troll A. [32,33]
3Esthetics (image) of the housing estateAesthetics of housing estate elements, visual assessment: facade color, decorative details, the composition of green areas around buildings, green terraces, distance from park areas, presence of recreational and leisure space.Data from field survey, public opinion research, field research.Manchester/England (Islington); Budapest/Hungary (Kelenfold and Havanna Housing Estates); Grenoble/France (Villeneuve Housing Estate); Rotterdam/The Netherlands (Lijnbaan Housing Estate)Benkő M. [49]
4Functionality of spaceThe function of a building or public space is related to daily use: transportation, housing, education, social infrastructure, retail, and services.Cartographic materials; data from field surveys.All housing estates in Szczecin/PolandLis C., Woźniak M. [50]
Diversification of the functional structure: green areas, activity space, neighborhood space (community space), building entrances and exits, traffic and parking management spaces, and senior-friendly spaces.Cartographic materials; data from field surveys.Research project RESTATE, an acronym for: "Restructuring Large-scale Housing Estates in European Cities: Good
Practices and New Visions for Sustainable Neighbourhoods and Cities" (France, Germany, Hungary, Italy, the Netherlands, Poland, Slovenia, Spain,
Sweden, and the UK), in 16 cities, and 29 estates in the period November 2002 to October 2005
K. Dekker, S. Hall, R. van Kempen, and I. Tosics [42]
5Environmental values
(1)
land cover focused on the sharing of permeable and impervious surfaces;
(2)
share of particular green space types;
(3)
several objects supporting nature-based outdoor activities, i.e., natural playgrounds located on the permeable ground, leisure facilities (benches, tables, etc.), sports facilities (outdoor gym, sports fields, etc.), sports amenities (bicycle racks), and contributing to visual amenity.
Cartographic materials; data from field surveys.Berlin/Germany (Karl-Marx-Allee,
Mehrower Allee, Marzahn);
Poznań/Poland (B. Śmiałego, Piątkowo, Oświecenia, Rataje)
Zwierzchowska I., Haase D., Dushkova D. [16]
6Public open spaces
(1)
Environmental comfort—objects’ heights and distance between objects; distance from heavily trafficked roads; occupancy level; density; floor area ratio; percentage of the green area;
(2)
Safety and accessibility—differentiation of pedestrian and vehicle movement; visual surveillance capacity; illumination of open space area and path lengths; physical barriers;
(3)
Privacy—POS area isolated from dominant communication paths and visual protection; presence of nonresidential structures and activities; enclosed open space area;
(4)
Intensity of social interaction—type of activity: athletic fields; playgrounds and green areas; supports leisure activities; a considerable level of social interaction exists.
Cartographic materials; data from field surveys.Zurich/Switzerland (Pflegi Areal, Hegianwandweg)Vela I.Y. [27]
Integration, permeability, local choice, functional mix, typology of in-between space, plot structures, density, building diversity, "eye-level" design.Cartographic materials, data from field survey, public opinion research, field research.Madrid, Barcelona, and Zaragoza/Spain (selected housing estates built in the post-war period, between 1960 and 1975—the boom years for European cities, where housing estates fulfilled the ideas of seriation and standardization)Garcia-Perez S., Oliveira, V., Monclus J. [51]
The indicators of POS quality are identified and analyzed as relevant:
(1)
Occupancy level (site coverage, the percentage of the plot covered by physical structure);
(2)
Housing density (plot ratio, the ratio between the total gross area of the building and the area of the plot, which also implies a higher number of apartments and users, greater housing density);
(3)
Percentage of a green area (ratio between greenery and total plot area);
(4)
Parking solution (ratio between the number of parking spaces in open parking lots and garages, lower ratio leaves more POS area for other purposes);
(5)
The amount of urban equipment (the amount of urban equipment implies the number of spaces for social interaction, including children’s playgrounds);
(6)
Social interaction and usage level (the data on social interaction level are gathered by field research and include the number of users and the amount of time they spend in the open spaces).
Cartographic materials, data from field surveys, field research.Niš/Serbia (Josifa Pancica area, Dositeja Obradovica Area, Stanka Vlasotincanina Area, Stara zeleznicka kolonija–Rasadnik Area)Kondić S., Živković M., Tanić M., Kostić I. [19]
7Spatial order Indicators of spatial order, i.e., sidewalks, children’s play facilities, internal roads, lawns, educational centers, trash garbage cans, lampposts, dumpsters, neighborhood stores, and building facades.Cartographic materials; data from field surveys; field research.Ostrów Mazowiecka/Poland (Selected housing estates)Podciborski T., Orzoł R. [14]
8Life quality indicatorsHousing environment: Public transportation; amenities; green areas; pollution resource; possibility of natural disaster; land use landscaping.
Housing function: Parking plan; dwelling unit plan; safety; convenience; security; adaptability.
housing comfort: temperature and humidity; thermal insulation; noise; sound insulation; daylighting; artificial lighting; view; indoor air quality; ventilation.
Cartographic materials; sensor data; data from field surveys; field research. The southern part of Seoul/KoreaKim S.-S., Yang I.-H., Yeo M.-S., Kim K.-W. [52]
9Sustainable development of multi-family housing estatesThe basic design criteria resulting from a sustainable development paradigm include:
CONTEXT OF PLACE:
(1)
adjusting the size and standard of buildings as well as the functional and spatial program to the real needs of future users;
(2)
analysis of the local climate, ecosystem, biologically active areas, and a degree of urbanization;
(3)
analysis of history, culture, and tradition;
(4)
adaptation of the location, form, and thermal mass of the designed buildings to the local climate and existing construction and technological infrastructure;
(5)
use of local building materials, in situ renewable energy sources produced;
(6)
pursuit of the integrity of the architecture and urban planning.
CONTEXT OF ENERGY:
(1)
reduction of energy consumption for heating, cooling, ventilation, and preference for natural light;
(2)
achieving high parameters and efficiency of building enclosure;
(3)
optimization of energy efficiency and use of renewable energy;
(4)
introduction of effective technological solutions;
(5)
pursuit of zero-energy and plus-energy buildings.
CONTEXT FOR THE CREATION OF SUSTAINABLE COMMUNITIES:
(1)
achieving optimization of energy and water consumption, reduction of waste production;
(2)
protection of ecosystems and biologically active areas;
(3)
life comfort and safety, fulfillment of needs;
(4)
introduction of a diversity of buildings and land use;
(5)
activation of residents through, for example, social programs;
(6)
development of the local economy;
(7)
a long time of use–durability;
(8)
pursuit of zero ecological and carbon footprint.
Provisions of applicable law regarding spatial planning, construction, technical conditions; urban planning, and architectural materials; data from field surveys.Szczecin/Poland (Housing Estates: Nautica, Chabrowe, Pogodno) Raczyński M. [13], Majerska-Pałubicka B. [53]
Table 2. General information about the analyzed housing estates in Olsztyn (as of 2011).
StatisticsOlsztyn
Pieczewo (OWP)Generałów
Area (km2) 2.241.95
Population density per km245585217
Population10,20910,174
Disabled persons per 1000 population2.052.44
Source: Own elaboration on the basis of MPRO [57].
Table 3. SFS indicators for evaluating multi-family residential estates.
CategoryCriteriaIndicatorData SourcesStages of Implementation
SFS outside the settlement (general location)Distance to public facilitiesCity centerGoogle hybrid mapViewing maps in QGIS 3.22.1, plug-in QuickMapServices
determining distance buffers. Vectorization of analyzed objects. Completion in 3 h (hours).
Train station/airportGoogle map
Cultural facilities (i.e., theater, philharmonic, museum) Google map
Specialized health care facilities (i.e., hospitals, specialized health centers)Google hybrid map
City/commune office, public administrationGoogle map, Municipal Spatial Information System of the City of Olsztyn (MSIPO—https://msipmo.olsztyn.eu/imap/ (accessed on 15 March 2022))Viewing maps in QGIS 3.22.1, plug-in QuickMapServices.
Map generation from MSIPO portal (raster), map calibration, determination of distance buffers. Realization up to 5 h.
Recreational facilities with infrastructure (i.e., parks, water bodies, forests)MSIPO (https://msipmo.olsztyn.eu/imap/ (accessed on 15 March 2022))
Neighborhood function (function of land use adjacent to the housing estate)Type of functionDatabase of topographic objects (BDOT10k—Geoportal)Vector data downloaded from the geoportal (separately for city and county, 2 packages zipped) SHP format, buffering. Implementation up to 4 h.
Planning parametersBuilt-up area of residential buildingsBDOT10k—Geoportal, MSIPO, WebEWID, OSMAnalysis of SHP vector data from OSM obtained with Quick OSM plug-in for QGIS, verification of building location data with map generation from WebEWID (raster), map calibration. Realization 6 h.
SFS inside the settlement (detailed location)Planning parameters
Communication
Building intensity including storeysBDOT10k—Geoportal, MSIPO, WebEWIDAnalysis of SHP data from point above, building floors obtained from BDOT 10 k layer description. Implementation 3 h.
View opening of the buildingsGeoportal 3D,
high-resolution orthophoto map (Geoportal)
Analysis on SHP vector data from OSM and 3D building model data downloaded from geoportal, GML data format. Implementation 5 h.
Clarity of communication areas High-resolution orthophoto map (Geoportal), OpenStreetMap (OSM—bike), CyclOSMViewing maps in QGIS 3.22.1, plug-in QuickMapServices
and WMS database plug-in (high-resolution orthophoto map).
Implementation 3 h.
Accessibility to public transport stops within 200 mOSM (public transport); Mobile Passenger Information System—Bus OnlineViewing maps in QGIS 3.22.1, plug-in QuickMapServices, map generation from Bus Online (raster), map calibration, definition of distance buffers.
Implementation up to 3 h.
Communication
Parking lots
Number of public transport linesOSM (public transport); high-resolution orthophoto map (Geoportal)
Number of exits from the estateOSM (standard and public transport)Viewing maps in QGIS 3.22.1, plug-in QuickMapServices
and WMS database plug-in (high-resolution orthophoto map), vectorization, identification of number of exits from the housing estate.
Implementation 1 h.
Access to bicycle pathsHigh-resolution orthophoto map (Geoportal);
OSM (bike); CyclOSM)
Viewing maps in QGIS 3.22.1, plug-in QuickMapServices
and WMS database plug-in (High-resolution orthophoto map)
Implementation 2 h.
Percentage of parking lots and garages per dwelling unitHigh-resolution orthophoto map (Geoportal); Olsztyn City Map Portal—WebEWID (https://webewid.olsztyn.eu (accessed on 10 March 2022)); OSM (bike); CyclOSMAnalysis of SHP layer from OSM, comparing it with base map from WebEWID, viewing maps in Qgis 3.22.1, plug-in QuickMapServices
and WMS database plug-in (High-resolution orthophoto map).
Implementation 5 h.
Parking lots
Biologically active space—Green areas
Percentage of parking lots and garages for the disabled per dwellingHigh-resolution orthophoto map (Geoportal), WebEWID, BDOT10k—Geoportal
Percentage share of biologically active areas—potential for green areasWebEWID, OSM, BDOT10k—Geoportal, high-resolution orthophoto map (Geoportal)Map analysis in QGIS 3.22.1, plug-in QuickMapServices and WMS database plug-in (high-resolution orthophoto map), maps generation from WebEWID (raster) and calibration to QGIS analysis of SHP layer from BDOT10k.
Implementation 4 h.
Biologically active space—Green areas
Recreational area
Percentage share of greenery in the total area of biologically active landWebEWID, OSM, High-resolution orthophoto map (Geoportal)
Active recreation areas (i.e., gym, playground, ice rink)WebEWID, OSM, BDOT10k—Geoportal, High-resolution orthophoto map (Geoportal)Map analysis in QGIS 3.22.1, QuickMapServices plug-in, and WMS database plug-in (high-resolution orthophoto map), maps generation from WebEWID and calibration to QGIS analysis of SHP layer from BDOT10 k, calculation of geomertia playgrounds in ArcGIS Pro 2.9.1.
Implementation 4 h.
Recreational area
Educational facilities
Number of attractive playgrounds (over 400 m2)WebEWID, OSM, BDOT10k—Geoportal, high-resolution orthophoto map (Geoportal)
KindergartenGoogle map, BDOT10k—Geoportal, MSIPO
Educational facilities
Trade and services facilities (accessibility within 200 m)
Primary schoolMSIPOMap generation from MSIPO (raster), map calibration, definition of distance buffers.
Implementation up to 3 h.
Primary medical careGoogle hybrid mapViewing maps in Qgis 3.22.1, plug-in QuickMapServices,
definition of distance buffers. Vectorization of analyzed objects.
Implementation up to 4 h.
Trade and services facilities (accessibility within 200 m)Primary shopping facilitiesGoogle map
Catering/restaurantsGoogle hybrid map
Source: own elaboration.
Table 4. Values of SFS indicators for assessing multi-family residential estates.
CategoryCriteriaIndicatorIndicator Value
Unfavorable—Rank 0Medium—Rank 1Favorable—Rank 2
SFS outside the settlement (general location)Distance to public facilitiesCity centerUp to 500 m and more than 5000 m from the settlement boundariesFrom 1501 to 5000 m from the settlement boundariesFrom 501 to 1500 m from the settlement boundaries
Train station/airportUp to 500 m and more than 5000 m from the settlement boundariesFrom 501 to 1500 m from the settlement boundariesFrom 1501 to 5000 m from the settlement boundaries
City/commune office, public administrationUp to 500 m and more than 5000 m from the settlement boundariesFrom 1501 to 5000 m from the settlement boundariesFrom 501 to 1500 m from the settlement boundaries
Recreational facilities with infrastructure (i.e., parks, water bodies, forests)More than1501 m from the settlement boundaries From 501 to 1500 m from the settlement boundariesUp to 500 from the settlement boundaries
Specialized health care facilities (i.e., hospitals, specialized health centers)Up to 500 m and more than 5000 m from the settlement boundariesFrom 501 to 1500 m from the settlement boundariesFrom 1501 to 5000 m from the settlement boundaries
Cultural facilities (i.e., theater, philharmonic, museum)Up to 500 m and more than 5000 m from the settlement boundariesFrom 501 to 1500 m from the settlement boundariesFrom 1501 to 5000 m from the settlement boundaries
Neighborhood function (function of land use adjacent to the housing estate)Type of functionIndustry function; services and commerce that are burdensome and generate heavy traffic (e.g., train station, rail traffic, hypermarkets); mines; gravel pits; wastelands (e.g., swamps, moors, dunes, landfills, etc.)AgricultureResidential function; non-intrusive services and trade; forests and wooded areas; recreation (flowing and standing waters); green areas including allotments.
SFS inside the settlement (detailed location)Planning parametersBuilt-up area of residential buildingsAbove (>) 15% of the settlement areaBetween 10 and 15% of the settlement areaLess than (<) 10% of the settlement area
Building intensity including storeys>1.51–1.5<1
View opening of the buildings<40% of the settlement area40–70% of the settlement area>71% of the settlement area
Clarity of communication areas Undifferentiated traffic for vehicles and peopleDelineated four-wheeled, pedestrian trafficDelineated four-wheeled, two-wheeled, pedestrian traffic
CommunicationAccessibility to public transport stops within 200 m<50% of the settlement area50–79% of the settlement area>80% of the settlement area
Number of public transport lines0–123 and more
Number of exits from the estate1 and more than 523–4
Access to bicycle pathsThe cycle path does not reach the settlement boundaryThe bicycle path reaches the settlement boundaryAccess to bicycle paths inside the settlement
Parking lotsPercentage of parking lots and garages per dwelling unit1 parking space per dwelling1–1.5 parking space per dwellingMore than 1.5 parking spaces per dwelling
Percentage of parking lots and garages for the disabled per dwelling<4% the total area of parking spaces4–5% of the total area of parking spaces>5% of the total area of parking spaces
Biologically active space–green areasPercentage share of biologically active areas, potential for green areas<25% of the settlement area26–35% of the settlement area>36% of the settlement area
Percentage share of greenery in the total area of biologically active land<40% of the total area of biologically active land41–60% of the total area of biologically active land>61% of the total area of biologically active land
Recreational areaActive recreation areas (i.e., gym, playground, ice rink)None within the settlement boundaries1–2 places>2 places
Number of attractive playgrounds (over 400 m2)<25%26–50%>50%
Educational facilitiesKindergartenNone within the settlement boundaries1 within the settlement boundaries>1 within the settlement boundaries
Primary school>500 m from the settlement boundary<500 m from the settlement boundaryIt is located within the boundaries of the settlement
Trade and services facilities (accessibility within 200 m)Primary medical care<40% of the settlement area40–70% of the settlement area>71% of the settlement area
Primary shopping facilities<40% of the settlement area40–70% of the settlement area>71% of the settlement area
Catering/restaurants<40% of the settlement area40–70% of the settlement area>71% of the settlement area
Source: own elaboration.
Table 5. Selected land management parameters in multi-family residential estates.
Area ParametersValues
PieczewoGenerałów
Housing area561,013.99 m2483,373.91 m2
Building area14.43%15.63%
Total building intensity0.6070.664
Residential building intensity0.5430.639
Percentage share of housing estate development area by function:Residential10.82%13.82%
Greenery36.43%32.11%
Recreational3.25%3.41%
Parking lots8.24%8.51%
Educational 4.93%0.17%
Health0.75%0.03%
Commercial1.67%1.70%
Garages0.77%0.14%
Source: own elaboration based on the results of a spatial analysis.
Table 6. Values and ranks for assessing SFS in multi-family residential estates.
CategoryCriteriaIndicatorGenerałów Housing EstatePieczewo Housing Estate
ValueRankValueRank
SFS outside the settlement (general location)Distance to public facilitiesCity center3600 m13200 m1
Train station/airport5440 m05470 m0
City/commune office, public administration3100133501
Recreational facilities with infrastructure (i.e., parks, water bodies, forests)Park—750 m, (Lake—2400 m)1Forest—50 m (lake 4500 m)2
Specialized health care facilities (i.e., hospitals, specialized health centers)2742 m21845 m2
Cultural facilities (i.e., theater, philharmonic, museum)3832 m22850 m2
Neighborhood function (Function of land use adjacent to the housing estate)Type of functionResidential, agriculture, other green areas1Residential, forest and wooded areas, other green areas2
SFS inside the settlement (detailed location)Planning parametersBuilt-up area of residential buildings13.82%110.82%1
Building intensity including storeys0.66420.6072
View opening of the buildings26.2%033.7%0
Clarity of communication areas Delineated four-wheeled, pedestrian traffic1Delineated four-wheeled, pedestrian traffic1
CommunicationAccessibility to public transport stops within 200 m69.8%171.8%1
Number of public transport lines7292
Number of exits from the estate4242
Access to bicycle pathsThe bicycle path reaches the borders of the estate1The bicycle path reaches the borders of the estate1
Parking lotsPercentage of parking lots and garages per dwelling unit1.4111.471
Percentage of parking lots and garages for the disabled per dwelling3.1%02.6%0
Biologically active space—green areasPercentage share of biologically active areas, potential for green areas32.1%136.4%2
Percentage share of greenery in the total area of biologically active land52.3%168.5%2
Recreational areaActive recreation areas (i.e., gym, playground, ice rink)2232
Number of attractive playgrounds (over 400 m2)3/30 (30.68%)111/28 (87.7%)2
Educational facilitiesKindergarten1 in the settlement area13 in the settlement area2
Primary SchoolAt a distance of 1800 m01 large in the settlement area2
Trade and services facilities (accessibility within 200 m)Primary medical care56.2%178.4%2
Primary shopping facilities72.8%281.2%2
Catering/restaurants58.3%163.1%1
Sum 29 38
% of maximum value55.8%III deg. SFS moderately user-friendly73.1%IV deg. SFS user-friendly
Source: own elaboration.
Publisher’s Note: MDPI stays neutral with regard to jurisdictional claims in published maps and institutional affiliations.