Article

Prediction of Suitable Future Natural Areas for Highland Barley on the Qinghai-Tibet Plateau under Representative Concentration Pathways (RCPs)

1
Key Laboratory of Tibetan Plateau Land Surface Processes and Ecological Conservation (Ministry of Education), Qinghai Normal University, Xining 810008, China
2
School of Geographical Science, Qinghai Normal University, Xining 810008, China
3
Academy of Plateau Science and Sustainability, Xining 810008, China
4
Faculty of Geographical Science, Beijing Normal University, Beijing 100875, China
*
Author to whom correspondence should be addressed.
Sustainability 2022, 14(11), 6617; https://doi.org/10.3390/su14116617
Submission received: 15 April 2022 / Revised: 21 May 2022 / Accepted: 25 May 2022 / Published: 28 May 2022

Abstract

:
Global climate change, mainly characterized by warming, has resulted in significant migration of temperature-sensitive crops from traditional planting areas, making crops more vulnerable to climate change and natural disasters, increasing yield losses caused by disasters. Based on the MaxEnt model, combining Representative Concentration Pathways 4.5 and 8.5, the potential suitable areas for highland barley planting on the Qinghai-Tibet Plateau were estimated, and the results showed that: (1) Over 30% of the Qinghai-Tibet Plateau is unsuitable for highland barley cultivation, the area of moderately suitable area for highland barley planting is close to 50%, and the marginally suitable and highly suitable area is less than 20%; (2) From the past distribution to the near and medium-term distributions, the unsuitable area for highland barley planting is gradually shrinking. In the moderately suitable area for highland barley planting, some of the area with relatively low suitability was transformed from unsuitable area, and some of the area with relatively high suitability was transformed into marginally suitable area, so that the total area remained basically unchanged. A small part of the marginally suitable area was converted into high-suitability area, which increased the highly suitable area; (3) From the perspective of different scenarios, in the near and medium term, the area with a slight decrease or no change in suitability under RCP 8.5 was smaller than under RCP 4.5, but the area with a significant increase was larger than under RCP 4.5. The areas with a small decrease or no change in suitability accounted for 23.66–33.77% of the total plateau area and were concentrated in the northwestern Qinghai-Tibet Plateau and the Qaidam Basin. Areas with a large increase in suitability accounted for 3.47–15.64% of the total area and were located in the southern, central, and eastern parts of the Qinghai-Tibet Plateau, this area increased significantly with time; (4) Judging from the average altitude change in highland barley planting, the average altitude of the highly suitable area will rise from 3759 m to 3937 m (RCP 4.5) and 3959 m (RCP 8.5) in the near term. By the medium term, the average elevation of the highly suitable area will increase from 3759 m to 4017 m (RCP 4.5) and 4090 m (RCP 8.5). The trend of rising average altitude continues to strengthen.

1. Introduction

The report of working group I of the sixth assessment report (AR6) of the Intergovernmental Panel on Climate Change (IPCC) points out that the global climate is warming more rapidly than before. Between 1850 and 1900, the global average surface temperature increased by about 1 °C. From the average temperature change in the next 20 years, the global temperature rise is expected to reach or exceed 1.5 °C. Unless greenhouse gas emissions are reduced immediately, rapidly, and on a large scale, it will not be possible to limit the temperature rise to close to 1.5 °C [1,2]. In the context of global climate change, food production, quality, and trade will be affected to varying degrees, thus endangering global food security [3]. Under the influence of climate change, the planting boundaries of crops have shifted. Compared with 1950–1980, during 1981–2007, the northern boundary of winter wheat planting in China’s Liaoning province moved northwestward, and the rice and maize planting range in western Heilongjiang moved northward by 1 to 1.5 latitudes. The northward shift of the rice planting line makes more rice possibly affected by frost damage [4,5,6]. Highland barley (Hordeum vulgare L. var. nudum Hook. f.) is a strain of barley in the gramineous family. Because of its short growth period, strong cold and drought resistance, and stress resistance, it has become a unique crop in the Qinghai-Tibet Plateau. Some ancient carbonized grains of highland barley were unearthed at the late Neolithic Changguogou site in Changguo Township, Gongga County, Shannan City, Tibet Autonomous Region in 1994. These carbonized grains show that highland barley has been planted in the Qinghai-Tibet Plateau for about 3500 years [7,8]. Highland barley has an extremely important economic and social position in the social activities and the development of agriculture and animal husbandry on the Qinghai-Tibet Plateau. At present, the contradiction between food demand and limited cultivated land resources in the Qinghai-Tibet Plateau is becoming increasingly prominent. How to scientifically manage and regulate agricultural resources and ensure food security on the Qinghai-Tibet Plateau against the background of global climate change is particularly important. Against the background of warm and humid climate change, the Qinghai-Tibet Plateau, as an area with relatively extreme climatic conditions and fragile ecology, is developing high-quality, efficient, and safe agriculture and reducing the impact of climate change on the local area, which are conducive to the sustainable development of the Qinghai-Tibet Plateau and ensuring the health of the local agricultural ecology and food security [9].
Predicting the potential suitable area of crops is of great significance in optimizing the spatial distribution pattern of crops and in the exploration of suitable arable land resources in the future. The prediction of suitable crop distribution areas under climate change is a mainstream research topic. Commonly used methods include crop species distribution models [10,11,12] and layer constraint methods [13,14,15]. The basic principle of the crop species distribution model is based on the niche theory, which associates known species distribution data with environmental variable data, constructs the relationship between species distribution and environmental factors through a specific algorithm, and predicts the potential distribution of the target species in the study area. The initial species distribution model is mainly based on the application of simple models such as bioclim, habitat, and domain [16]. Later, with the development of computer technology and the advent of mathematical theory, the concept of machine learning and the principle of fuzzy mathematics were integrated into niche theory. After improvement, species distribution models with more complex simulation processes and higher statistical accuracy were constructed, such as the GARP and MaxEnt models [17,18,19]. With continuous development and improvement of species distribution models, these methods has become an important method to simulate the distribution of crop species in the future.
The basic principle of the layer constraint method is to combine the evaluation index system of crop distribution suitability with spatial analysis functions such as GIS layer superposition to obtain the suitable distribution area of crops through multiple criteria constraints on the combination of influencing element layers [20]. This method has been widely used in land suitability evaluation, mapping, and other research, as well as in the prediction of future suitable crop habitat areas. For example, Lane used the Ecocrop model (including the temperature and precipitation demand of various cultivated crops), combined with precipitation, temperature observations, and future simulation data, to evaluate changes in the suitable planting range and planting area of 43 main grain and cash crops under climate change [21]. Compared with the species distribution model, the layer constraint method is simple and fast, but the selection of environmental variables and the setting of weights mostly come from expert experience and have a certain subjectivity. The MaxEnt model is the most widely used species distribution model. It is good at predicting the spatial distribution of different species affected by climate change. On the premise of reasonable screening of species sample points and ecological variables affecting species distribution, the prediction result of the model is excellent [22,23,24].
This study generated highland barley sample points based on the distribution of highland barley planting area, reasonably and randomly selected the number of sample points, and screened the habitat variables affecting the distribution of highland barley through multiple steps. On this basis, the MaxEnt model was used to predict the potential suitable areas of highland barley in the early stage, the near future, and the medium future, and the differences among different climate change scenarios in different periods in the future were considered. The purpose was: (1) to estimate the distribution of potential suitable areas for highland barley in different periods and scenarios; (2) to evaluate the changes in potential suitable areas for highland barley in time and space in the future; (3) to analyze changes in elevation in the potential suitable area for highland barley planting.

2. Materials and Methods

2.1. Study Area

As shown in Figure 1, located in the hinterland of Asia, the Qinghai-Tibet Plateau extends from 26°10′ N–39°0′ N and from 73°20′–104°20′ E, with an average altitude of more than 4000 m. It is the highest plateau in the world and is known as the third pole of the Earth. Its complex alpine physical and geographical features have become the “starter” and “regulation area” of global climate change [25]. The cultivated area of the Qinghai-Tibet Plateau is about 1.89 × 10⁴ km2, mainly distributed in the Hehuang Valley in Qinghai Province and along the Yarlung Zangbo River and its two tributaries in Tibet. Limited by the climate, most of the arable land on the Qinghai-Tibet Plateau is planted once a year, and most of it is dry or irrigated land. Eighty-two percent of the cultivated land is distributed in the river valley between 2400 and 4400 m above sea level, where the crops are mainly wheat, highland barley, corn, and rape [26]. Highland barley cultivation areas on the Qinghai-Tibet Plateau are widely distributed, with the main production areas being Shigatse City, Changdu City, Lhasa City, and Shannan City in the Tibet Autonomous Region [27]; Haibei Prefecture, Hainan Prefecture, and Haixi Prefecture in Qinghai Province [28]; Ganzi and Aba Prefectures in Sichuan Province [29]; Gannan Prefecture in Gansu Province; and Diqing Prefecture and Lijiang City in Yunnan Province [30,31,32].

2.2. Data Collection

Table 1 shows the data used to estimate the potential suitable area for highland barley planting, including basic geographic information data on the Qinghai-Tibet Plateau, highland barley planting area data, environmental variable data, and the temporal and spatial resolution of each data component and its source. Existing research shows that terrain, climate, and soil are the three most important factors affecting natural suitability for highland barley planting. A total of 42 indices, including the climate index, soil index, elevation, slope, and solar radiation, were selected as candidate indices that might affect the potential suitable area for highland barley planting [33,34].
The highland barley planting area data on the Qinghai-Tibet Plateau are based on Landsat 8 Operational Land Imager remote sensing images from June to September 2019, and the vector data were extracted using an object-oriented method [35]. In addition to Digital Elevation Model data, environmental variable data included global soil parameter data and ecological meteorological variable data. The global soil parameters came from the harmonized World Soil Database, which is one of the commonly used soil databases at present. Many soil datasets were integrated, such as China’s soil data, the European soil database (EsDB), and the SOTER system.
The environmental variable data came from the World Climate Database (Worldclim, Version 2.0). The climate model in the historical period uses 19 bioclimatic factors from 1970 to 2000. The dataset is based on global meteorological stations and interpolates longitude, latitude, and altitude as independent variables to obtain relevant indicators of temperature and precipitation [36,37].
Representative Concentration Pathways (RCPs) are a set of scenarios within the framework of the Coupled Model Intercomparison Project Phase 5 (CMIP5) of the World Climate Research Programme (WCRP). The RCPs include four emission scenarios, namely RCP 2.6, RCP 4.5, RCP 6.0, and RCP 8.5. Under each scenario, there is an emissions pathway that takes into account environmental climatic factors and socioeconomic conditions. In 2020, the test results of the Coupled Model Intercomparison Project Phase 6 (CMIP6) have been gradually released to the public. Compared with the previous modes, the CMIP6 mode has some improvements and enhancements in the kinetic parameterization scheme while improving the resolution [38,39,40].
The climate model data in the future period include simulation data in the near term (2021–2040) and the medium term (2041–2060). This study selected RCP 4.5 and RCP 8.5 as two representative concentration paths to estimate potential suitability for highland barley planting [41]. The variation range of climate indicators under different concentration pathways is shown in Table 2.
The 42 optional environment variables are detailed in Appendix A. Because the resolution of the indicators was not uniform, resampling was conducted for all indicators to ensure that their resolution was uniform at 2.5′ × 2.5′. The database was trimmed according to the boundary of the Qinghai-Tibet Plateau to ensure that all data were consistent in resolution and range, so as to facilitate the use of the MaxEnt simulation model.
Many studies have shown the uncertainty caused by the data from a single climate model. The commonly used integration method is to homogenize data from multiple models. The estimated results of the many climate models were averaged [42,43,44]. To reduce the errors and uncertainties between different climate model data and make the results more reliable, nine climate models provided in CMIP 6 were used: BCC-CSM2-MR, CNRM-CM6-1, CNRM-ESM2-1, MIROC6, CanESM5, GFDL-ESM4, IPSL-CM6A-LR, MIROC-ES2L, and MRI-ESM2-0.

2.3. Methods and Processes

2.3.1. Fundamentals of the MaxEnt Model

The MaxEnt model is a probability distribution model for estimating the potential distribution range of species. It was constructed by Philips, who first introduced the principle of maximum entropy. This model was first proposed in the field of information science and is one of the contents of statistical research. Its principle is a mathematical method to infer an unknown probability distribution based on limited known information. The MaxEnt model makes unbiased probability distribution predictions for unknown distribution information by receiving known distribution information [24]. Previous studies have shown that the MaxEnt model can simulate the potential distribution of crops in the Qinghai-Tibet Plateau and that the simulation results are excellent. This model was selected to simulate the potential suitable area of highland barley [45,46].
For a certain range X composed of a certain number of grid cells, let p(x) denote the distribution probability of any grid cell x in the distribution range X. Assuming that ∑p(x) = 1, and defining the possible distribution of p as p′, then the entropy of p′ is:
H ( p ) = x X p ( x ) l n   p ( x )
where ln p′(x) is the natural logarithm of p′(x), the known spatial distribution point information of a species is limited, and the set of grid cells with the highest entropy value among the grid cells that satisfy the known constraints in the distribution range X gives the optimal distribution of the species estimated by the MaxEnt model [47,48].
The accuracy and stability of the MaxEnt model are affected by environmental variables. Too many variables are not conducive to the accuracy of the test results. Therefore, the accuracy of the model is tested according to the ROC (receiver operating characteristic) curve. In a two-dimensional image, the area of the irregular polygon enclosed by the ROC curve and the horizontal axis of the coordinates is the AUC (area under ROC curve). It is necessary to perform multiple combination detection of each factor according to the AUC value, eliminate the environmental variables with low contribution to the prediction model, and finally obtain the potential environmental variable combination scheme with few environmental variables and the largest AUC value [49]. The AUC value is suitable as an evaluation metric for model accuracy because it is not affected by the diagnostic threshold [50]. The AUC value is generally between 0.5 and 1. The closer AUC is to 0.5, the more random is the result, and the closer AUC is to 1, the closer the result is to being perfect [51]. The specific standards are as follows: 0.50–0.60, failure; 0.61–0.70, poor; 0.71–0.80, fair; 0.81–0.90, good; and 0.91–1.00, excellent.

2.3.2. Research Framework of the MaxEnt Model

Before establishing the research framework, this article proposes the following hypotheses: (1) there will be no significant changes in soil and topography in the next 40 years; (2) the varieties and agronomic characteristics of barley will remain unchanged in the next 40 years; (3) in the fields where barley will be planted in the next 40 years, management measures will not be adjusted. Based on these three hypotheses, this paper proposes a research framework for the estimation of potential suitable cultivation areas for highland barley on the Qinghai-Tibet Plateau, as shown in Figure 2.

2.3.3. Establishment of Highland Barley Sample Point Database

When using the MaxEnt model to predict species distribution, two key issues must be addressed. One is to select representative species distribution points and choose the best sample size; the second is to avoid the deviation of model simulation results caused by sample selection.
Judging from the collection results of highland barley sample sites, the main sources of existing highland barley sample sites are the records of agricultural stations in various places, research literature records of barley in various fields, and the sampling sites of special field investigations. Due to its diverse origins, this dataset creates the following problems:
  • The years recorded by the sample points are not uniform, and the time span is long;
  • The spatial distribution of sample points is uneven, and the density of sample points in each region is significantly variable;
  • The number of sample points is still relatively small in general;
  • The accuracy of the latitude and longitude of the sample points was not uniform when they were recorded.
In view of these problems, it is difficult to ensure the reliability of the final simulation results by selecting the existing highland barley sample points to estimate potential suitable areas for highland barley planting on the Qinghai-Tibet Plateau. The option can be considered to generate a database of highland barley planting sample points based on the distribution map of the highland barley planting area on the Qinghai-Tibet Plateau.
Automatic generation of highland barley sample points from the distribution map of highland barley planting area on the Qinghai-Tibet Plateau to establish a database would have many advantages:
  • Because the extraction of highland barley planting area is based on remote sensing images in 2019, the year of the generated highland barley sample points would be the same;
  • There is no limit to the number of highland barley sample points, which can be generated according to the number of sample points required by the model;
  • As long as the balance and representativeness of the spatial distribution are considered when selecting the highland barley sample points, spatial density variation in the sample points can be avoided;
  • The highland barley sample points are generated as longitude and latitude with uniform precision.

Extraction of Highland Barley Sample Points

Based on these considerations, a database of highland barley sample points was constructed based on the distribution map of highland barley planting area in 2019 on the Qinghai-Tibet Plateau. The process is as follows:
Create a fishnet grid 1 km × 1 km in size on the Qinghai-Tibet Plateau.
Under ArcToolbox in ArcMap, select Feature Class in Data Management Tools, and then select the Create Fishnet command;
Intersect the 1 km × 1 km fishnet with the highland barley planting area vector layer, and select the grid intersecting with the highland barley layer through the “select” function of the layer;
Convert the grid intersecting with the highland barley layer into a point layer, associate the points with the gridded layer, and attach all the attributes on the points to the grid through the “Join and Relate” function;
Convert the grid of the vector layer to a grid layer, so that the value of each grid cell represents the area proportion of highland barley in the grid cell, with a range between 0 and 1 km2.
Convert the raster layer to a point layer through the “raster to point” function, obtaining a total of 134,410 points.

Screening of Highland Barley Sample Sites

According to the IPCC’s definition of possibility, the percentage of the barley planting area in the grid area x was divided into five groups: x < 1%, 1% ≤ x < 10%, 10% ≤ x < 33%, 33% ≤ x < 66%, and 66% ≤ x ≤ 100% [52]. Subsequently, the grid cells in the group x < 1% were deleted, all grid cells in the 66% ≤ x ≤ 100% group were selected, and based on the ratio of the barley planting area to the number of grid cells in this group, the number of points selected in other groups was decided at the same rate and points from the other groups were randomly selected to obtain the total number of barley sample points in each group and the number of sample points selected proportionally (Table 3).
Finally, to reduce the influence of random selection on the simulation results, 30 groups of eligible sample points were randomly generated in MATLAB to perform 30 repeated simulations in the MaxEnt model. The average of multiple simulation results was used as the final simulation result, thereby eliminating the result bias caused by sample selection.

2.3.4. Screening of Environment Variables Required by the MaxEnt Model

For the 42 candidate indicators that may affect the potential suitable areas for highland barley planting, reasonable screening is required to ensure that the selected indicators are highly correlated with highland barley planting. The selection of the final variables was carried out by three-step screening.
The first step was to estimate the probability distribution of each variable in the highland barley planting area, denoted as P and Q, respectively, and to calculate the KL divergence of P according to Q (Equation (2)). This difference is a measure of the difference between one probability distribution and another. If the two distributions of a given variable are highly similar, then this variable has little meaning for the distribution of barley planting area. All variables with KL divergence less than 1 were eliminated, and the remaining variables were taken to the next step. The formula for calculating KL divergence is:
D ( P Q ) = i X P ( i ) × [ log ( P ( i ) Q ( i ) ) ]
After the calculation of KL divergence, there were 18 indicators with D(P||Q) greater than 1, as shown in Table 4.
The second step was to input the remaining 18 variables screened in the first step into the MaxEnt model and obtain the contribution of each variable to the simulation, sort them by contribution, and keep the variables that contribute more than 0% to the underlying distribution simulation. After the contribution rate calculation, there were 15 variables with contribution rates greater than 0%, as shown in Table 5.
In the third step, because the indicators entered into the MaxEnt model should not be highly correlated, the correlation matrix was calculated for all indicators, showing the correlation of each variable with the remaining variables, and all variables with a correlation coefficient ≥0.8 were placed in one group. For the variable group with higher correlation coefficient, the variable with larger estimated contribution rate to the distribution of highland barley was preferentially selected. The results after the calculation of the correlation matrix are shown in Table 6.
Finally, among the 10 variables with high autocorrelation, five variables, BIO 6, BIO 10, BIO 11, BIO 16, and BIO 18, were eliminated.
After this three-step screening process for the 42 factors, 10 ecological environment factors were finally selected as the indicators for MaxEnt to simulate the potential suitable area for highland barley planting on the Qinghai-Tibet Plateau, as shown in Table 7.

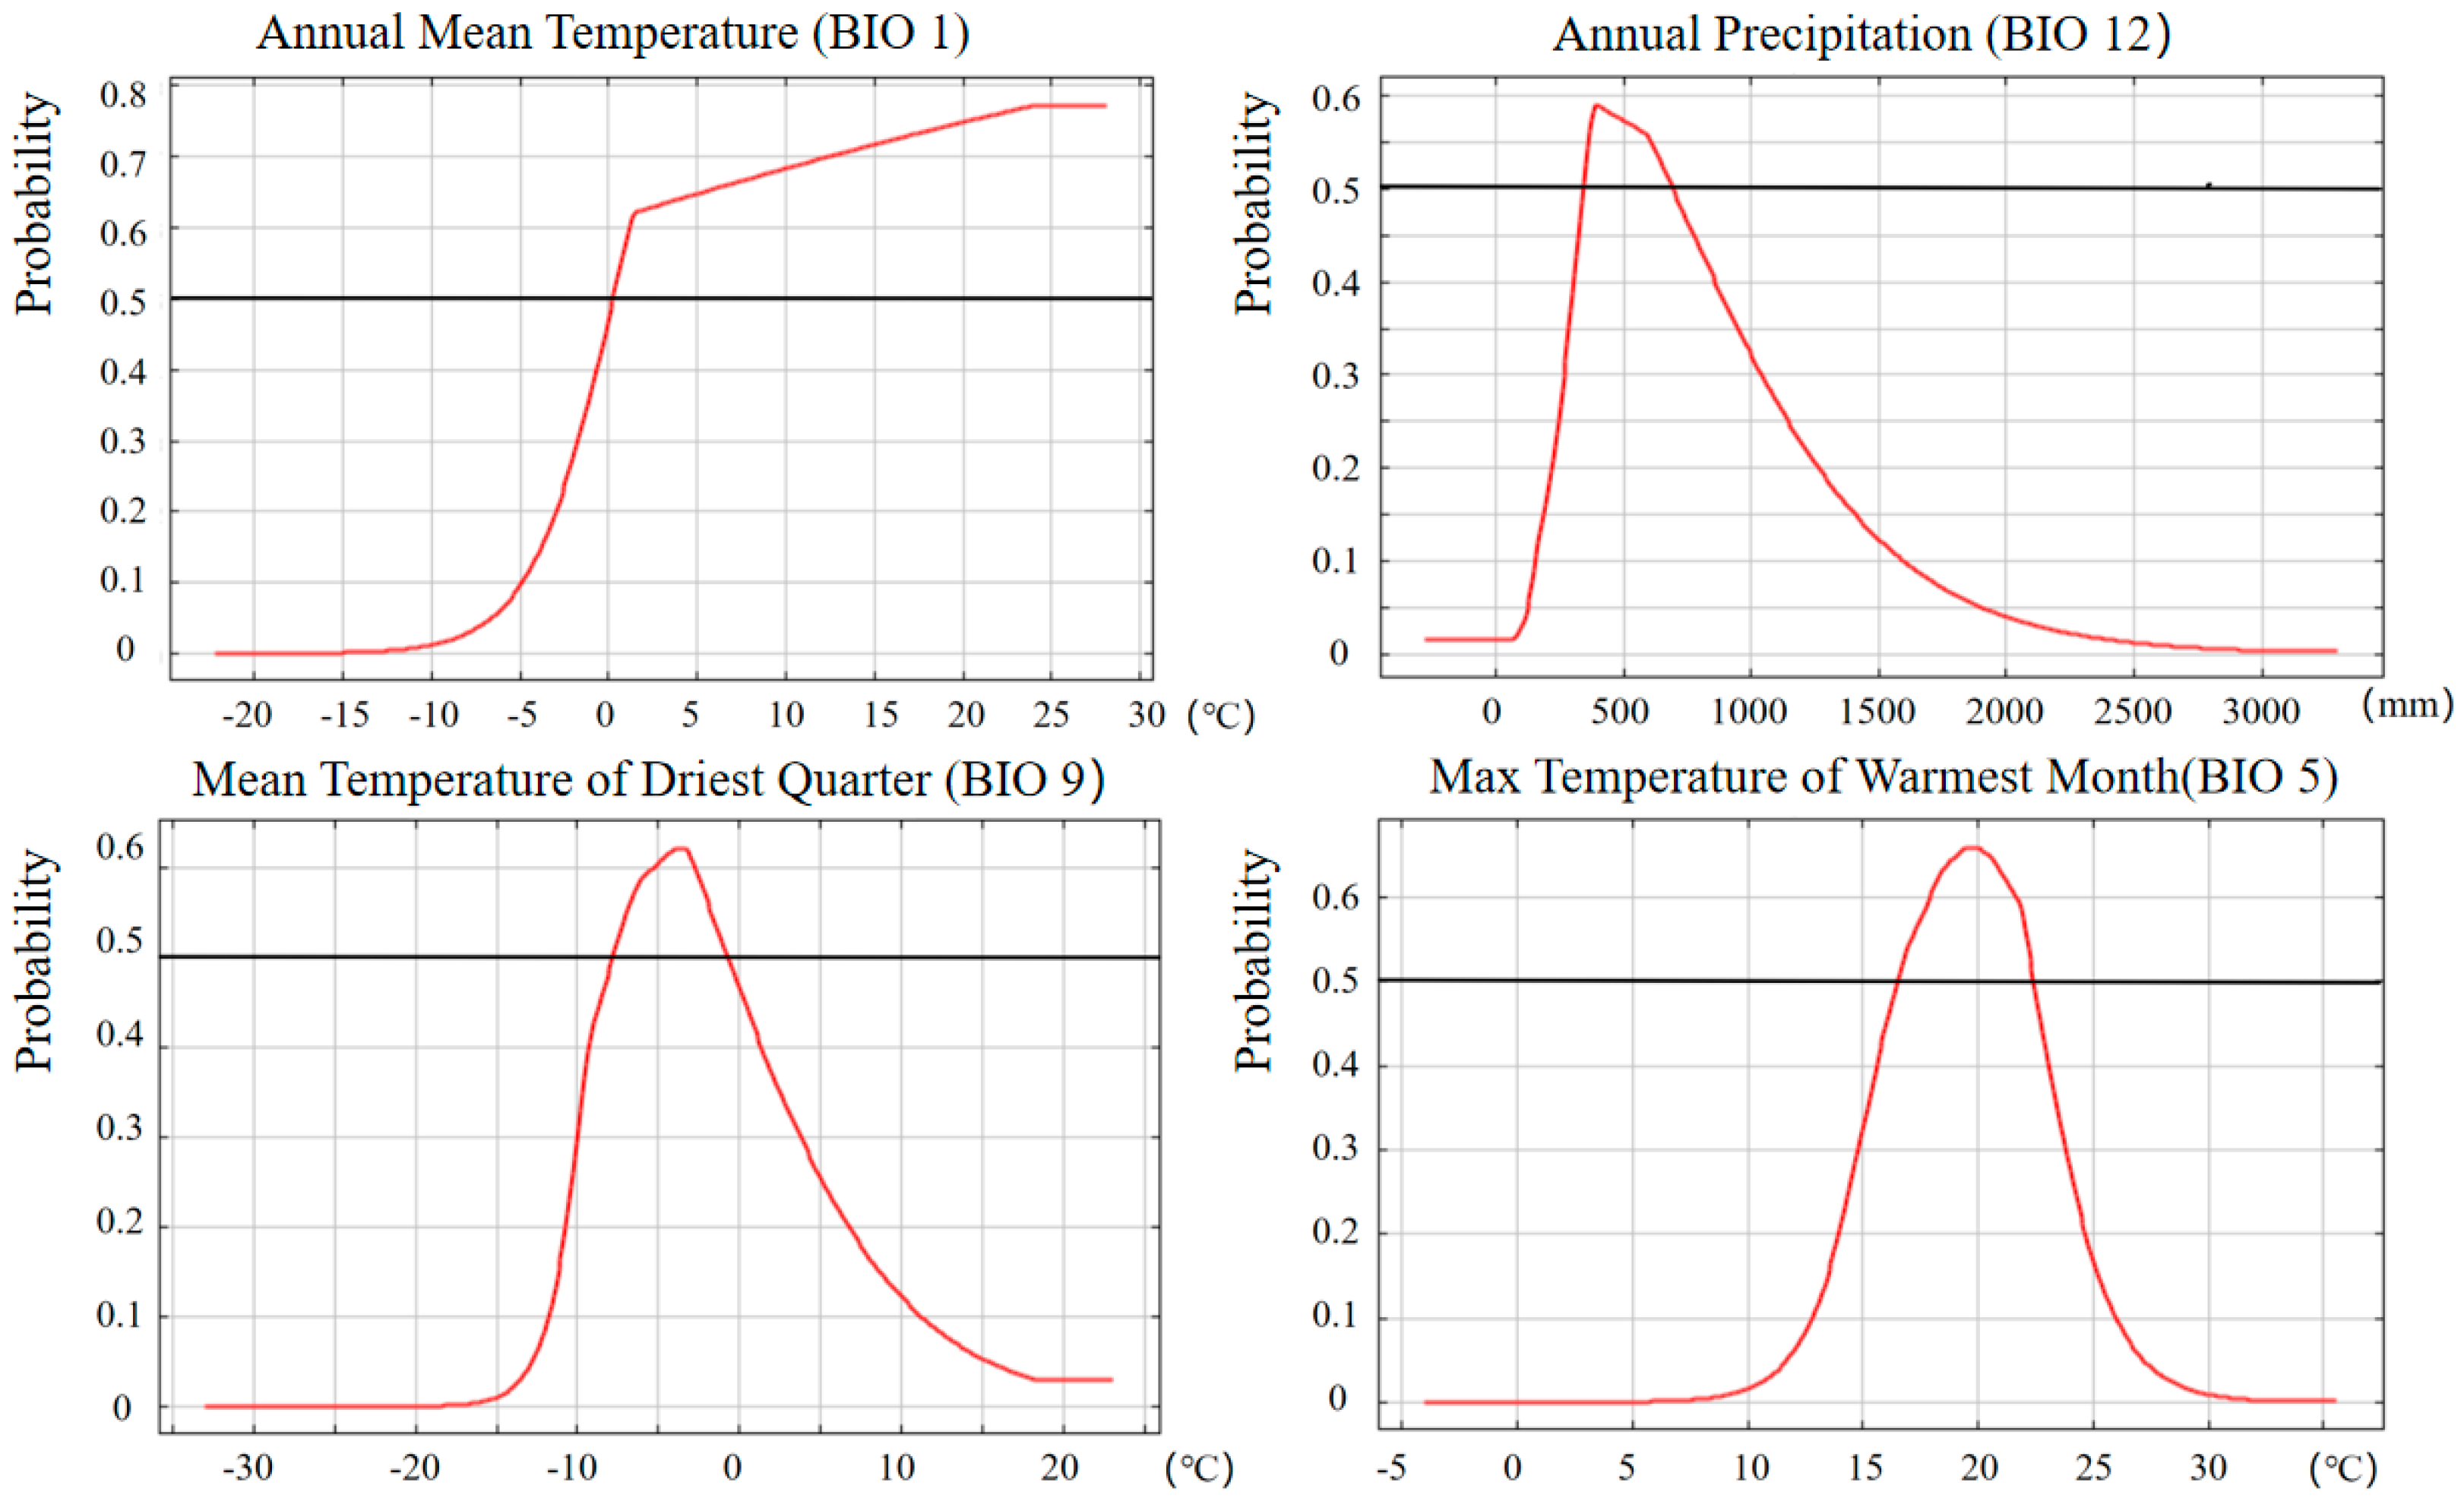
2.3.5. Response Curves of Major Ecological Factors

Table 7 shows that the ecological factors affecting cultivation of highland barley on the Qinghai-Tibet Plateau are mainly climatic factors, with a contribution rate of more than 95%, whereas the contribution rate of soil factors is less than 5%. Among them, the climate factors are BIO 1, BIO 12, BIO 9, and BIO 5 in order of contribution rate. The response curves of these four climate factors are shown in Figure 3. When the distribution probability of highland barley is greater than 0.5, the range of ecological factors is suitable for highland barley planting. The climate difference between the northern and southern parts of the Qinghai-Tibet Plateau is obvious, and the response curve of some factors has an inflection point.
The annual average temperature (BIO 1) contributed the most (50.50%) to the distribution of potential suitable areas for highland barley planting. When the temperature was less than 0.0 °C, the distribution probability of highland barley was less than 0.5, and when the temperature was greater than 0.0 °C, the distribution probability of highland barley continued to increase from 0.5 and reached its maximum at 23.0 °C. At 23.0–28.0 °C, the distribution probability of highland barley no longer increased. The annual average temperature distribution range suitable for highland barley cultivation is 0.0–28.0 °C.
The contribution rate of annual precipitation (BIO 12) to the distribution of potential suitable areas for highland barley planting is second only to the average annual temperature (31.60%). When the precipitation is 300–700 mm, the distribution probability of highland barley is greater than 0.5, and the distribution probability reaches its maximum when the precipitation is 400.0 mm. The distribution range of annual precipitation suitable for highland barley planting is 300.0–700.0 mm.
The average temperature in the dry season (BIO 9) has the third highest contribution rate (5.40%) to the distribution of potential suitable areas for highland barley planting. When the average temperature in the dry season is less than −8.0 °C or greater than −1.0 °C, the distribution probability of highland barley is less than 0.5, and when the average temperature in dry season was −8.0–−1.0 °C, the distribution probability of highland barley exceeded 0.5 and reached its maximum at −3.0 °C. The average temperature distribution range in the dry season that is suitable for highland barley planting is −8.0–−1.0 °C.
The highest temperature in the warm months (BIO 5) contributed 4.70% to the distribution of the potential suitable area for highland barley planting. When the maximum temperature in the warm months is less than 16.5 °Cor greater than 22.0 °C, the distribution probability of highland barley is less than 0.5; when the average temperature in the warm months is 16.5–22.0 °C, the distribution probability of highland barley exceeds 0.5 and reaches its maximum at 20.0 °C. The average temperature distribution range in the warm months that is suitable for highland barley planting is 16.5–22.0 °C.

3. Results

The output results of the MaxEnt model are raster data in ASCII format of the potential suitable areas for highland barley planting in the historical period (1970–2000), near term (2021–2040), and medium term (2041–2060) on the Qinghai-Tibet Plateau. The grid cell value represents the suitability (P) and ranges from 0 to 1. To easily describe the spatial differences of potential suitable areas for highland barley planting, the suitability was converted into a percentage ranging from 0% to 100%. According to differences in suitability, the distribution range is divided into unsuitable, low-suitability, medium-suitability, and high-suitability areas. Referring to the recommendations of related IPCC research, the levels of suitability (P) were defined as follows: the area with P < 1% was defined as unsuitable area for highland barley planting; the area with 1% ≤ P < 33% was defined as low-suitability area; the area with 33% ≤ P < 66% was defined as medium-suitability area; and areas with P ≥ 66% were defined as high-suitability areas [53,54].

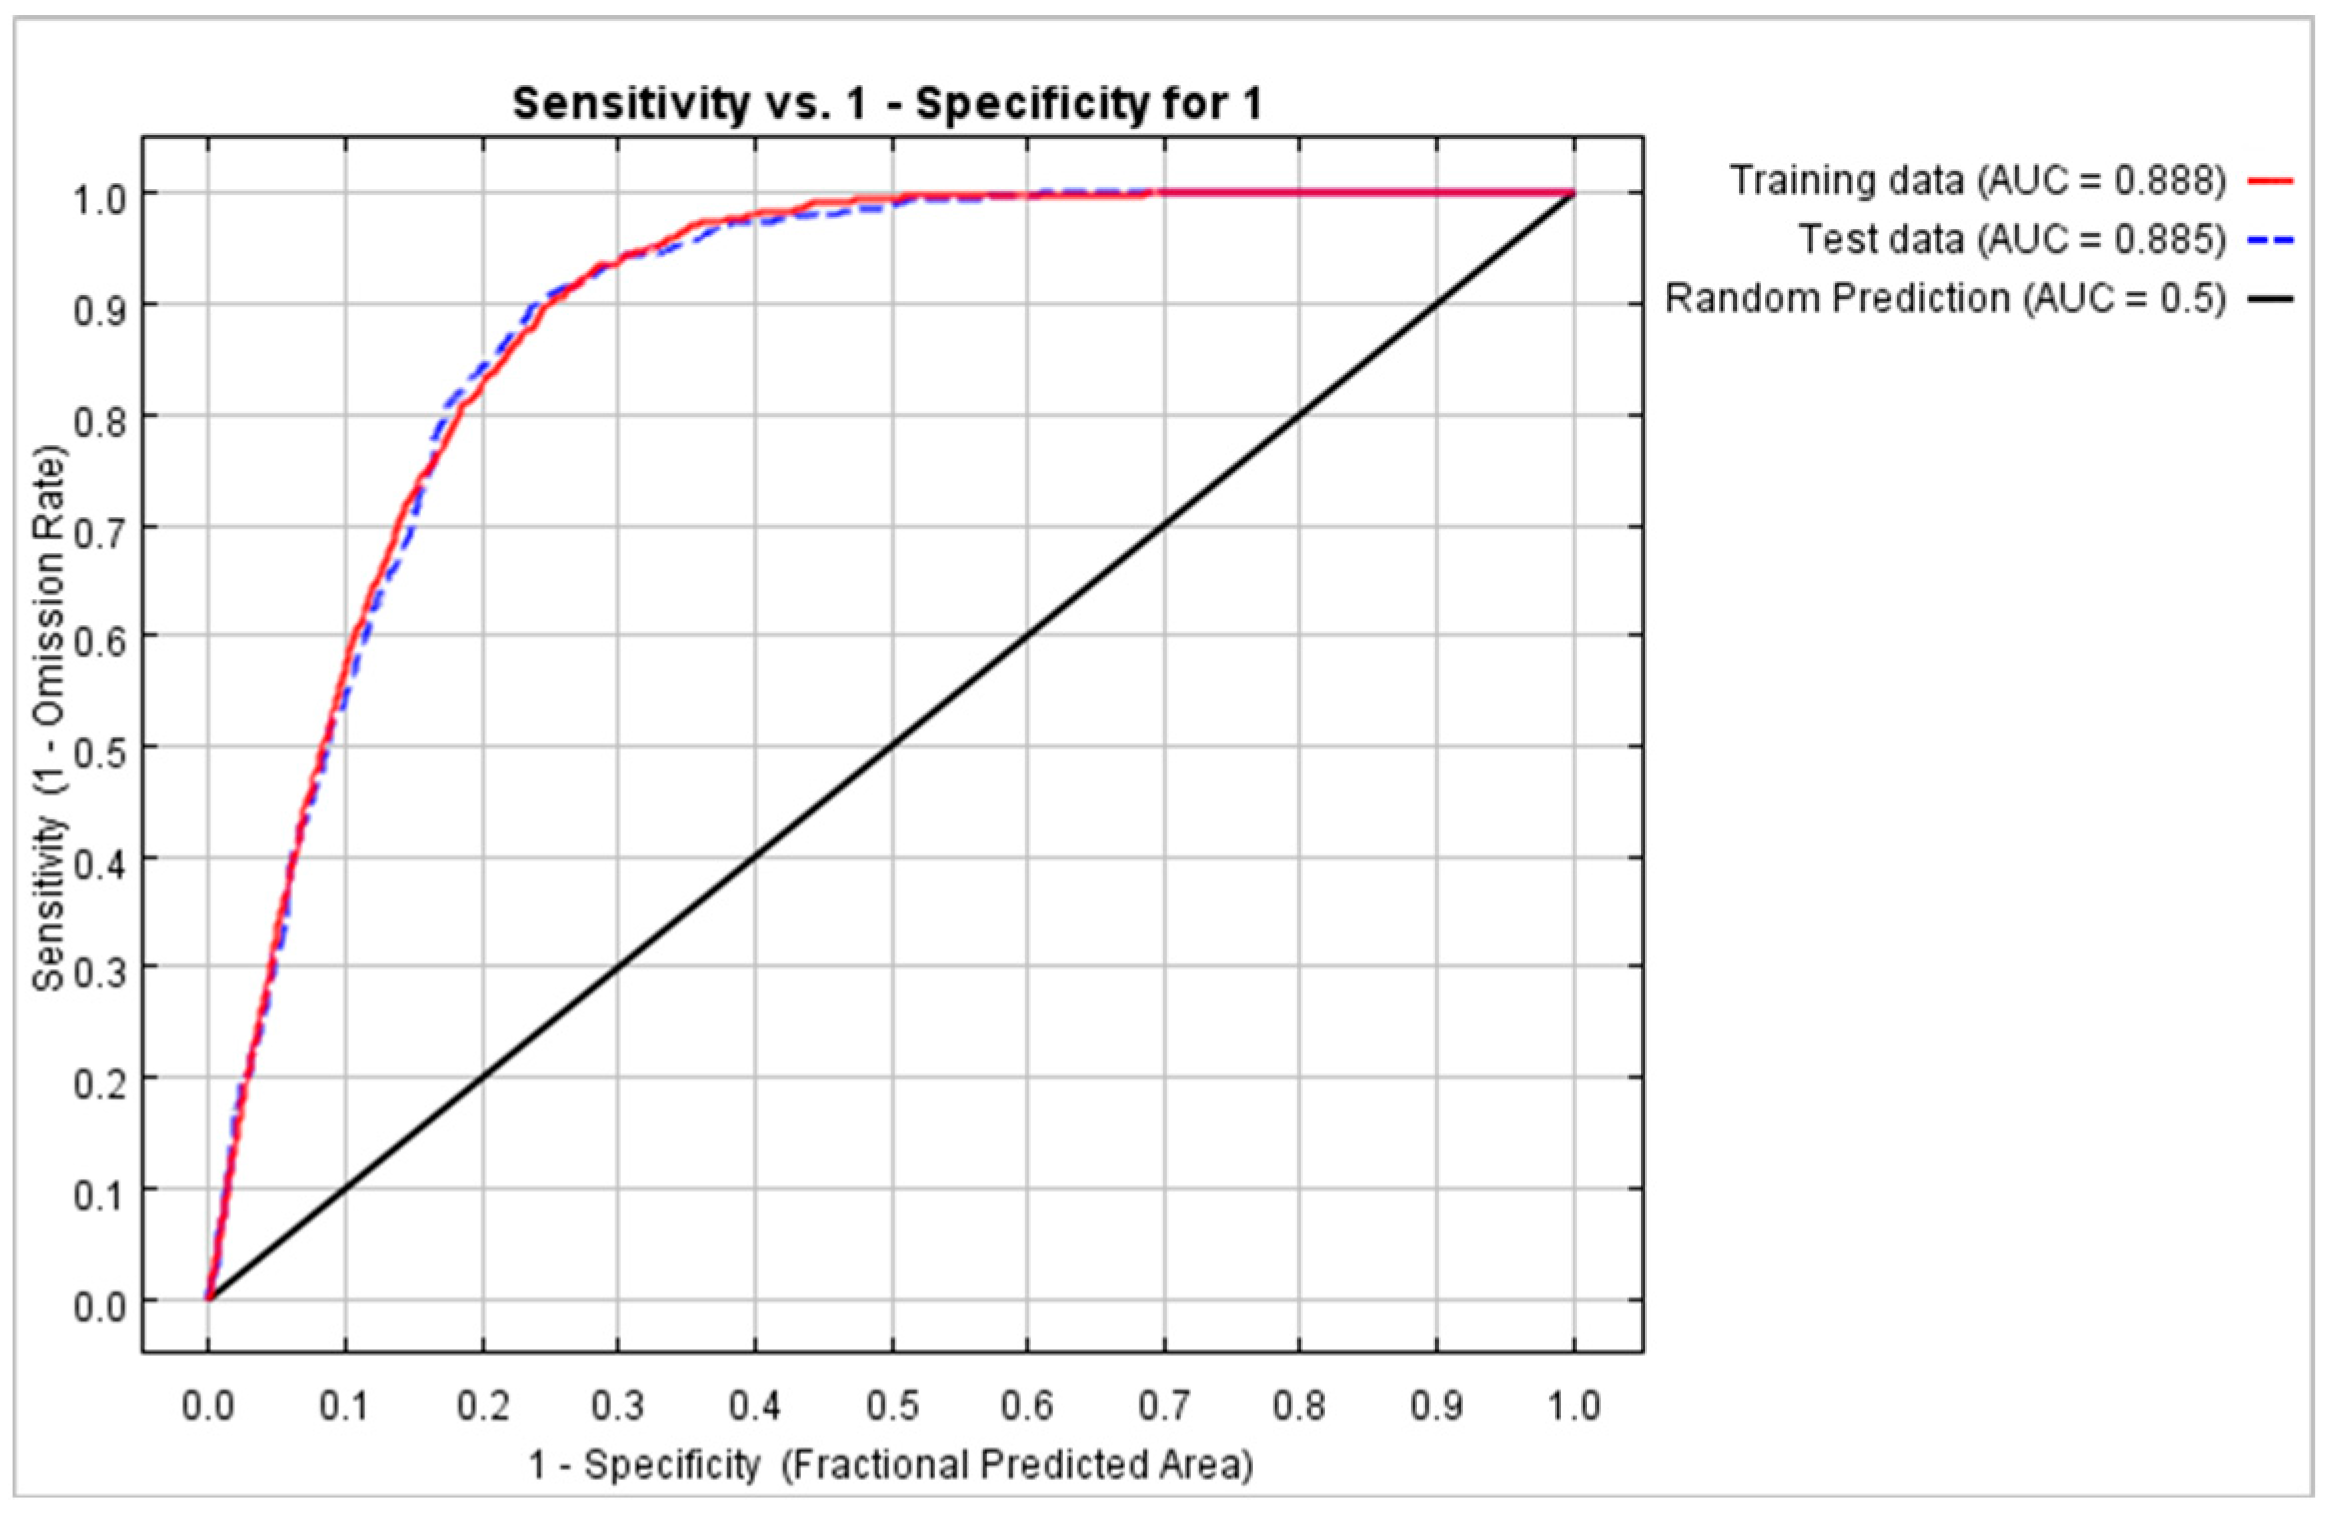
3.1. Accuracy Evaluation of MaxEnt Model Simulation Results

From the results of the model simulation, the MaxEnt model is applicable to the prediction of the potential suitable area for highland barley in the Qinghai-Tibet Plateau.
The MaxEnt model combines data on the presence of a given species in a grid cell with environmental variables representing different environmental gradients in that grid cell to judge whether an area is suitable for a particular species. The model determines, on a scale of 0 (least similar) to 1 (most similar), how similar the environment in other regions is to that desired by the species, and can be used to predict the potential distribution of a species and provide an estimated probability for that distribution. Among the 3066 highland barley sample points used as input to the model, 75% were used to train the model, and the remaining 25% were used for validation. Cloglog was selected as the output format, representing the probability of the underlying distribution, and other parameters were set to default values.
Figure 4 shows that the AUC values of the model training and test datasets were 0.888 and 0.885, which indicates that the constructed model is highly accurate and can be used to estimate the potential suitable area for highland barley on the Qinghai-Tibet Plateau. The simulation accuracy of the MaxEnt model is similar to that of existing research in the Qinghai-Tibet Plateau [40].

3.2. Estimated Results for Potential Suitable Areas for Highland Barley Planting

The estimated results of the potential suitable areas for highland barley planting in the historical period of the Qinghai-Tibet Plateau are relatively accurate, and the high suitable areas are more consistent with the current main producing areas of highland barley.

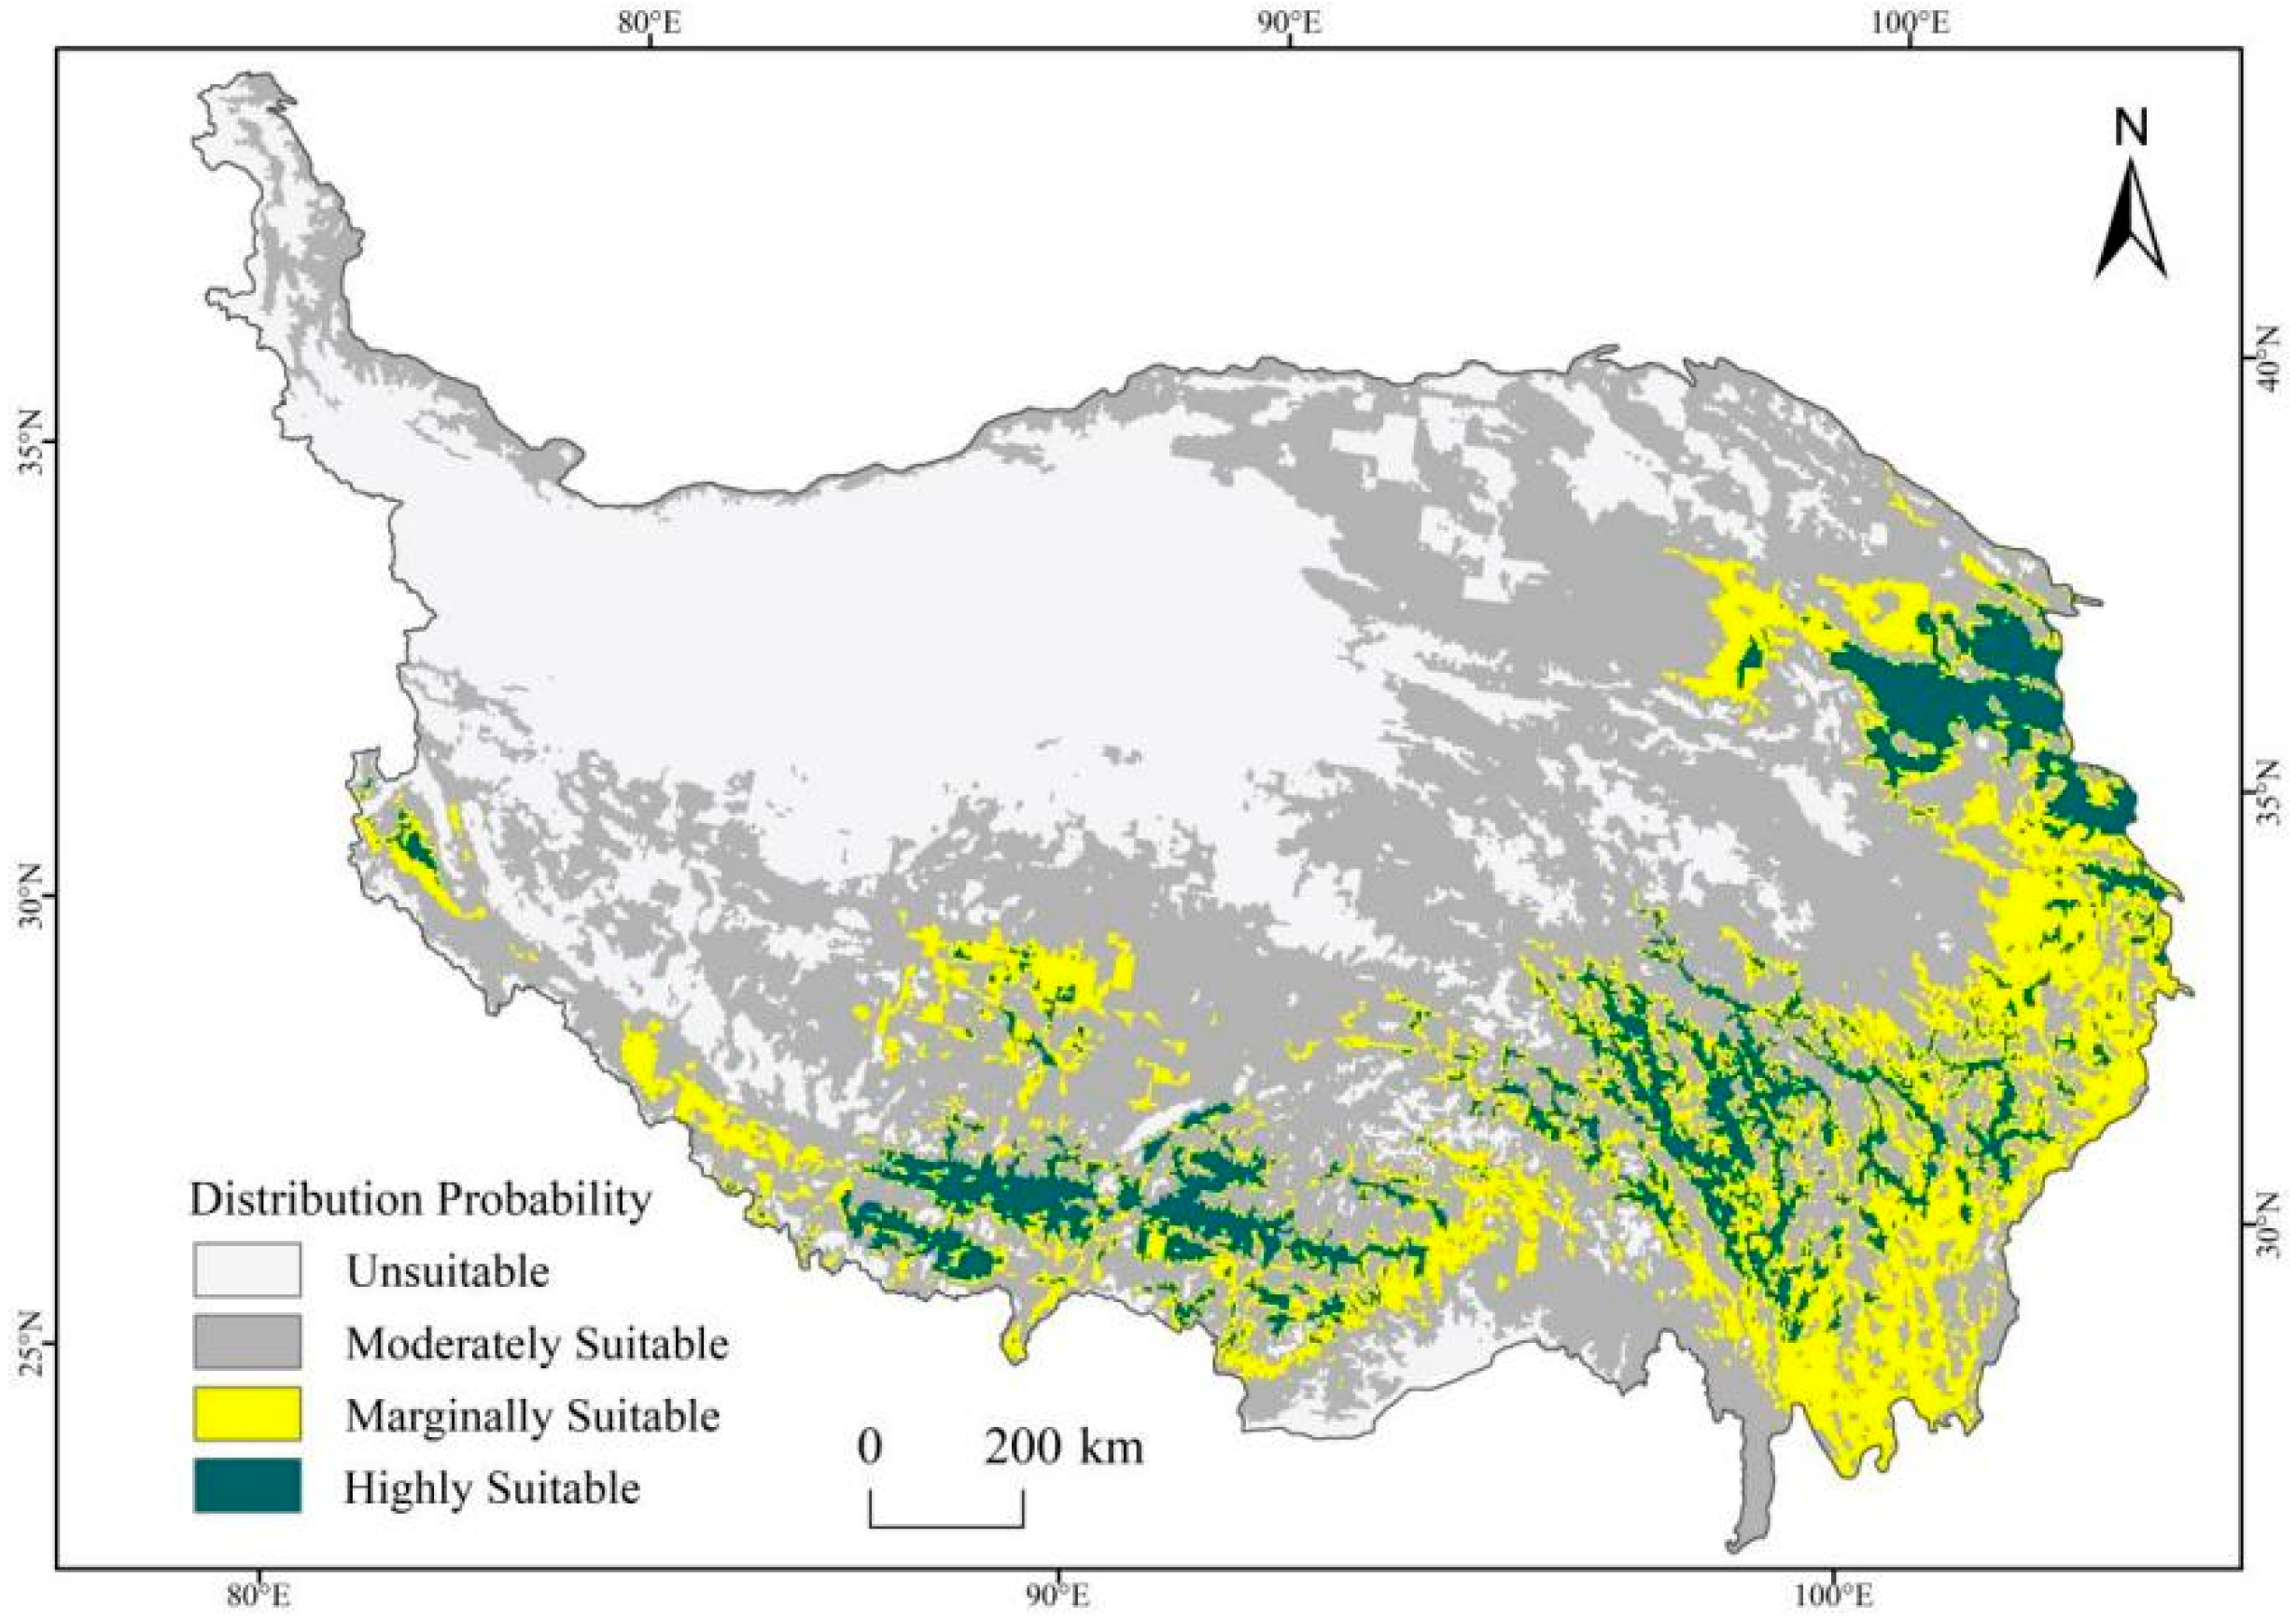
3.2.1. Estimated Results for Potential Suitable Areas for Highland Barley Planting in Historical Periods

According to the division standard given by the suitability (P) for the potential suitable area for highland barley planting on the Qinghai-Tibet Plateau, the division of the potential suitable area in the historical period is shown in Figure 5.
During the past, the unsuitable area for highland barley planting accounted for 34.33%, or about one-third, of the total area of the Qinghai-Tibet Plateau, which was mainly distributed in the higher-altitude area in the northwestern part of the Qinghai-Tibet Plateau, with an average altitude of close to 5000 m. The moderately suitable area accounted for 46.67%, or almost half, of the total area of the Qinghai-Tibet Plateau. It is mainly located in the southern part of the Qinghai-Tibet Plateau, the southern Qinghai Plateau, the Qaidam Basin, and the Qilian Mountains.
The marginally and highly suitable areas accounted for only 19.00% of the total area of the Qinghai-Tibet Plateau. These areas were concentrated in eastern Qinghai and western Sichuan and along the Yarlung Zangbo River and its two tributaries in Tibet, which is consistent with the actual main planting areas of highland barley.

3.2.2. Accuracy Verification of Estimated Results

To verify the accuracy of the estimated results for potential suitable areas for highland barley planting in the past on the Qinghai-Tibet Plateau, the verification process used here was as follows:
  • First, the potential suitable areas for highland barley planting in the historical period were re-divided into two categories according to suitability (P); P < 1% was defined as unsuitable area for highland barley planting, and P ≥ 1% was defined as suitable area for highland barley planting;
  • Second, the highland barley planting area extracted by remote-sensing images was regarded as the actual planting area and used as verification data;
  • Third, the highland barley planting area was superimposed onto the unsuitable and suitable areas for highland barley planting; the actual highland barley planting area was measured, and its proportions in the two areas were calculated.
The percentage of actual planting area falling into the suitable area for highland barley planting is close to 100%, and the percentage of actual planting area falling into the unsuitable area for highland barley planting is close to 0%. This indicates that the estimated results for the potential suitable area for highland barley planting are highly accurate.
Table 8 reveals that among the 27.4 × 10⁴ ha highland barley planting area; 27.37 × 10⁴ ha fell into the suitable area for highland barley planting in the historical period; accounting for 99.88% of the total highland barley planting area. Only 3.15 ha fell into the unsuitable area for highland barley planting, accounting for only 0.12%. This means that the estimated results for potential suitable areas for highland barley planting in the historical period on the Qinghai-Tibet Plateau are reasonably accurate

3.3. Potential Suitable Areas for Highland Barley Planting on the Qinghai-Tibet Plateau under Two Climate-Change Scenarios

From the past to the near and medium term, the unsuitable area for potential planting of highland barley is gradually shrinking, and the marginally and highly suitable areas are gradually increasing.
Figure 6 shows the potential suitable areas for highland barley planting on the Qinghai-Tibet Plateau under two scenarios in the near and medium term. The overall pattern of potential suitable areas for highland barley planting on the Qinghai-Tibet Plateau in the future is relatively consistent with the past in terms of spatial distribution, but is slightly adjusted with the passage of time and the choice of scenario.
From the perspective of different scenarios, the unsuitable area under RCP 8.5 is smaller than under RCP 4.5 in the near and medium term, but the marginally and highly suitable areas are larger than under RCP 4.5.
By the near term, the percentage of unsuitable areas for potential planting of highland barley will drop from 34% to 21% (RCP 4.5) and to 20% (RCP 8.5). The percentage of moderately suitable area increases slightly from 47% to 49% (RCP 4.5) and to 49% (RCP 8.5) and remains basically unchanged. The percentage of marginally suitable area increases from 13% to 18% (RCP 4.5) and to 19% (RCP 8.5). The percentage of highly suitable area increases from 6% to 12% (RCP 4.5) and to 12% (RCP 8.5).
By the medium term, the percentage of unsuitable areas for potential planting of highland barley will drop from 34% to 17% (RCP 4.5) and to 14% (RCP 8.5). The percentage of moderately suitable area will be fine-tuned from 47% to 48% (RCP 4.5) and to 46% (RCP 8.5), basically remaining unchanged. The percentage of marginally suitable area will increase from 13% to 21% (RCP 4.5) and to 24% (RCP 8.5). The percentage of highly suitable area will increase from 6% to 14% (RCP 4.5) and to 16% (RCP 8.5).
From the perspective of structural change, the areas with relatively low suitability among the moderately suitable areas for potential planting of highland barley were transformed from unsuitable areas. Areas with relatively high suitability were transformed into marginally suitable areas, thus keeping their total area basically unchanged. A small part of the marginally suitable area was transformed into highly suitable area, which increased the size of the highly suitable area.

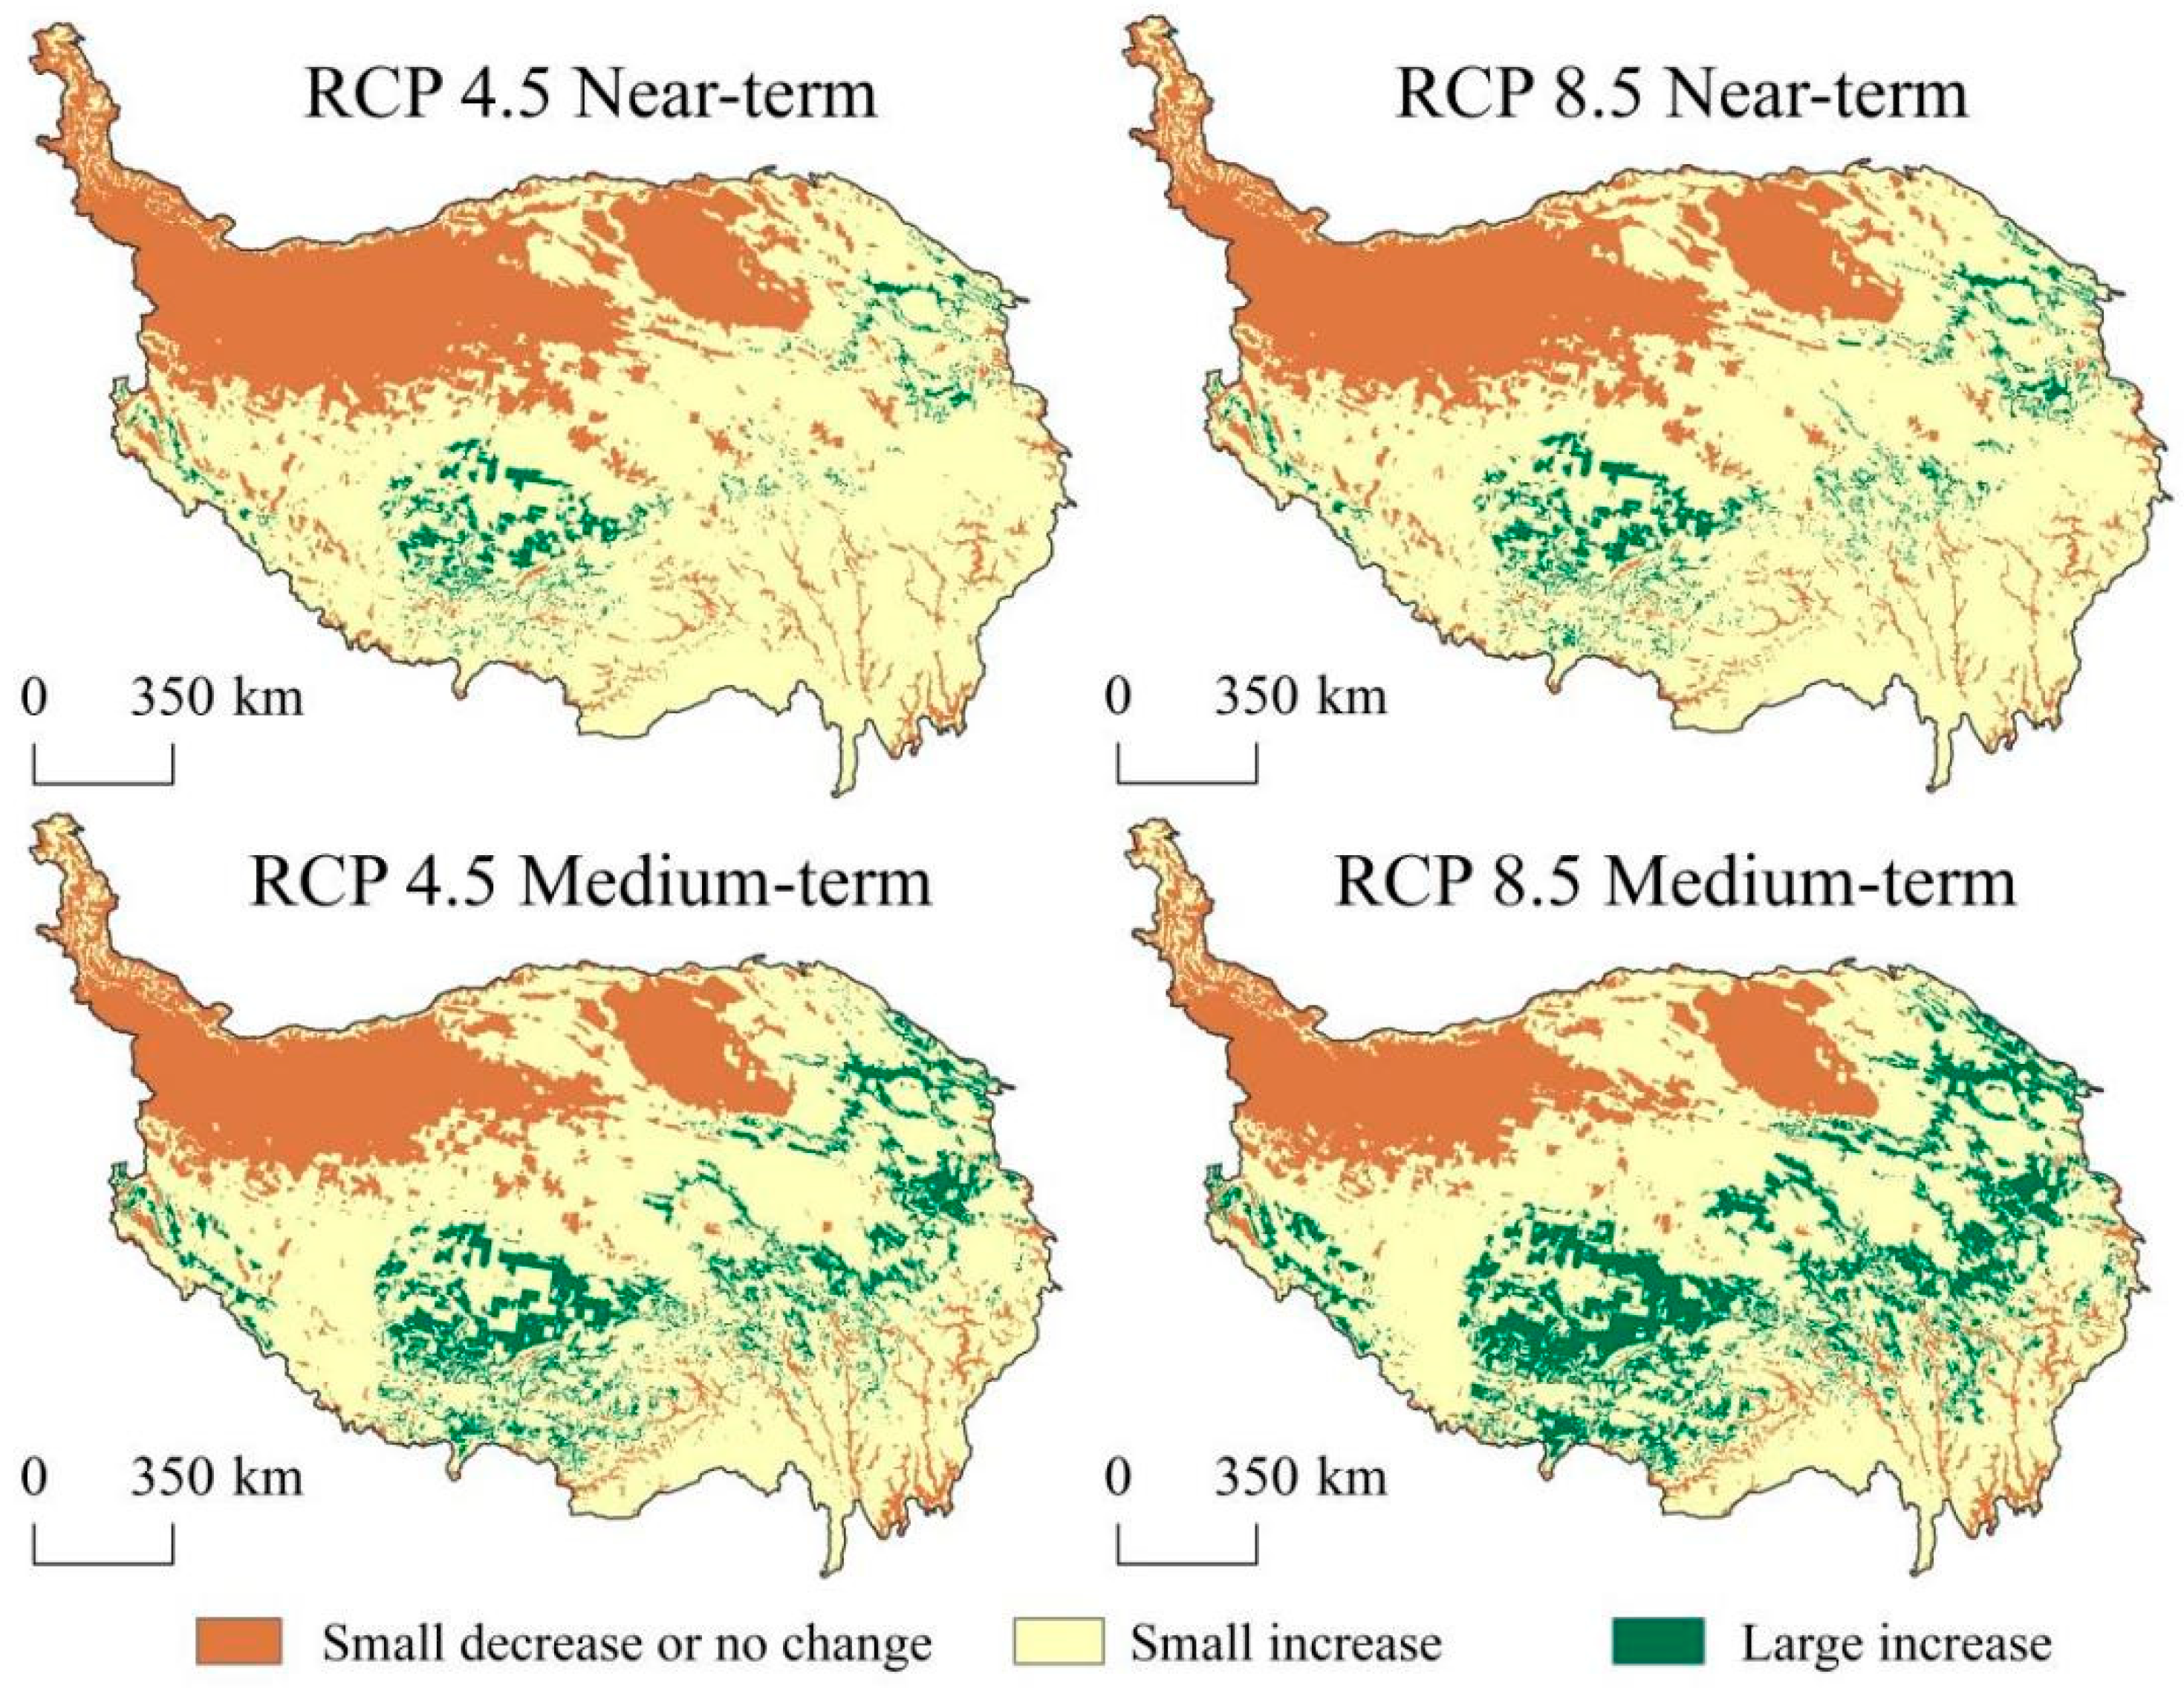
3.4. Spatial Variation in Potentially Suitable Areas for Highland Barley Planting

From the perspective of different scenarios, in the near and medium term, the area with a slight decrease or no change in suitability under RCP 8.5 was smaller than under RCP 4.5, but the area with a significant increase was larger than under RCP 4.5.
When comparing the spatial changes of the potential suitable areas for highland barley planting in different periods and under different scenarios, the degrees of change can be divided into three levels: areas where the probability (P) decreased or increased by less than 1% compared to the previous period were defined as showing a small decrease or remaining unchanged; 1% ≤ P < 33% was defined as a small increase; and P ≥ 33% was defined as a large increase.
As shown in Figure 7, the areas with a small decrease or no change in suitability accounted for 23.66–33.77% of the total plateau area and were concentrated in the northwestern Qinghai-Tibet Plateau and the Qaidam Basin. The suitability of most areas of the Qinghai-Tibet Plateau increased slightly, accounting for 60.69–62.77% of the total area. Areas with a large increase in suitability accounted for 3.47–15.64% of the total area and were located in the southern, central, and eastern parts of the Qinghai-Tibet Plateau; this area increased significantly with time.

4. Discussion

4.1. Improving Simulation Accuracy of MaxEnt Model

The AUC for the draining dataset is 0.888 and that of the test dataset is 0.885, which indicates that the constructed model is highly accurate and can be used to estimate the potential suitable area for highland barley on the Qinghai-Tibet Plateau. If we want to further improve the accuracy of model simulation, we need to consider two factors that affect the accuracy of model simulation. The first is the selection of sample points. It is necessary to ensure that there are enough sample points, and at the same time, to ensure that the sample points are evenly distributed in space [55]. In this paper, we selected 3066 sample points to ensure the number, and randomly selected 30 sample points to eliminate the possibility of uneven distribution of sample points in space. Another factor is the screening of ecological factors that affect crop distribution. In this paper, 42 indices, including climate index, soil index, elevation, slope, and solar radiation, were selected as candidate indices that might affect the potential suitable area for highland barley planting. If we want to improve the accuracy of model simulation, we should either consider improving the selection method of sample points to make the selected sample points more reasonable, or consider more factors affecting crop growth in the selection of indicators, such as irrigation conditions in anthropogenic factors.

4.2. Changes in Elevation of the Potential Suitable Area for Highland Barley Planting

Altitude was divided into six intervals by intervals of 500 m: <3000 m, 3000 m–3500 m, 3500 m–4000 m, 4000 m–4500 m, 4500 m–5000 m, and >5000 m. The areal percentages of the four potential suitable area categories for highland barley in each interval were measured, as shown in Figure 8. The results showed that the altitudes of each classification showed the same change trend under the RCP 4.5 and RCP 8.5 scenarios.
Taking the RCP 4.5 scenario as an example, the unsuitable areas are concentrated in the area above 4500 m. From the past to the near and medium term, the percentage of unsuitable areas shows a decreasing trend in each altitude range; the moderately suitable area is most concentrated within 4500–5000 m, and area percentage in each altitude interval has no obvious trend of change with time. The marginally suitable area is concentrated between 3000 and 5000 m, and the percentage shows a decreasing trend over time between 3000 and 3500 m, whereas in the range of 3500 to 5000 m, the percentage shows an increasing trend. The highly suitable areas are concentrated between 3000 and 5000 m and show a trend of increasing area over time in all intervals.
Judging from the change in the average altitude of various types of highland barley potential planting areas over time, under the RCP 4.5 scenario, the average elevation of each type of area showed an upward trend. The average altitude rise in the unsuitable and moderately suitable areas was relatively slow, but the average altitude rise in the marginally and highly suitable areas was relatively large. From the past to the near and medium term, the average elevation of the highly suitable area rose from 3759 m to 3937 m and to 4017 m, with an increase of 178 m and 258 m.
As shown in Figure 9, In the RCP 8.5 scenario, the average elevation of the highly suitable area increased from 3759 to 3959 m and to 4090 m, an increase of 200 m and 331 m. Existing research results show that the planting altitude of highland barley has increased by 100–200 m in the past few decades, and the change in altitude of highland barley planting is likely to continue this trend in the future [56,57]. Before 1950, highland barley could not be planted in Pali and Langkazi in Shannan, Tibet, China, but highland barley can be widely grown today. In the agricultural area of Tibet with an altitude of 3900~4300 m, most of the areas were originally unsuitable for crop planting due to frost. However, due to the warming climate, the frost period in this area has significantly shortened, and an area originally unsuitable for crop planting has become a suitable area [58].

4.3. Projected Potential Suitable Areas for Highland Barley Cultivation under the Dual Effects of Climate Change and Human Influence

When analyzing the changes in the potential suitable area for highland barley planting on the Qinghai-Tibet Plateau, this paper assumed other conditions to be constant and only considered changes in climatic factors. In the actual situation, the reasons affecting the change in the potential suitable area for highland barley planting cannot be limited to changes in climatic elements. Both natural and human reasons may provide reasons for changes in the potential suitable area for highland barley planting. For example, the expansion of cultivated land, the change in highland barley varieties, the change in people’s demand for highland barley, the improvement of planting technology, the improvement of soil fertility, and many other factors can affect the scope of highland barley planting.
This paper focuses on the analysis of climate change factors and does not consider human factors in depth. In the future, to predict changes in the potential suitable area for highland barley planting more accurately, it will be necessary to make predictions based on simulated climatic-factor data combined with simulated human-factor data. For example, Shared Socioeconomic Pathways (SSPs) can be considered to estimate the change trends in potential suitable areas for highland barley planting in the future under the dual paths of RCPs and SSPs [59,60].

5. Conclusions

(1)
The MaxEnt model could well predict the potential suitable areas for highland barley planting on the Qinghai-Tibet Plateau. Over 30% of the Qinghai-Tibet Plateau is unsuitable for highland barley cultivation, the moderately suitable area for highland barley planting is close to 50%, and the marginally and highly suitable area is less than 20%. The highly suitable areas for highland barley planting are concentrated in the eastern, southeastern, and southern portions of the Qinghai-Tibet Plateau, which is more consistent with the actual main planting areas of highland barley.
(2)
From the past to the near and medium term, the unsuitable area for highland barley planting is expected to gradually shrink. In the moderately suitable area for highland barley planting, some of the area with relatively low suitability will be transformed from unsuitable area, and some of the area with relatively high suitability will be transformed into marginally suitable area, meaning that the total area remains basically unchanged. A small part of the marginally suitable area will be converted into highly suitable area, increasing the size of the highly suitable area. In the near term, the percentage of highly suitable area for highland barley planting will increase from 6% to 12% (the same ratio for RCP 4.5 and RCP 8.5). By the medium term, the percentage of highly suitable area for highland barley planting will increase from 6% to 14% (RCP 4.5) and to 16% (RCP 8.5).
(3)
From the perspective of different scenarios, in the near and medium term, the area with a slight decrease or no change in suitability under RCP 8.5 was smaller than under RCP 4.5, but the area with a significant increase was larger than under RCP 4.5. The areas with a small decrease or no change in suitability accounted for 23.66–33.77% of the total plateau area and were concentrated in the northwestern Qinghai-Tibet Plateau and the Qaidam Basin. Areas with a large increase in suitability accounted for 3.47–15.64% of the total area and were located in the southern, central, and eastern parts of the Qinghai-Tibet Plateau; this area increased significantly with time.
(4)
Judging from the average altitude change in highland barley planting, the average altitude of the highly suitable area will rise from 3759 m to 3937 m (RCP 4.5) and to 3959 m (RCP 8.5) in the near term, an increase of 178 m and 200 m. By the medium term, the average elevation of the highly suitable area will increase from 3759 m to 4017 m (RCP 4.5) and to 4090 m (RCP 8.5), an increase of 258 m and 331 m. The trend of rising average altitude continues to strengthen.

Author Contributions

W.M. conducted the research, analyzed the data and wrote the paper; W.J. processed the data; F.L. guided the research and did extensive updating of the manuscript; J.W. conceived the research and provided project support; Y.Z. helped process the data. All authors have read and agreed to the published version of the manuscript.

Funding

This research was funded by the Second Qinghai-Tibet Plateau Scientific Expedition and Research Program (STEP), grant number 2019QZKK0606 and the National Key Research and Development Program of China, grant number 2016YFA0602402.

Institutional Review Board Statement

Not applicable.

Informed Consent Statement

Not applicable.

Data Availability Statement

All data and materials are available upon request.

Acknowledgments

We are particularly indebted to Professor Peijun Shi, Xingsheng Xia, and Peng Su from the Qinghai Normal University for their constructive suggestions on an earlier draft of this paper.

Conflicts of Interest

The authors declare no conflict of interest.

Appendix A

Table A1. Variables used to estimate the potential suitable area of highland barley.
Data CategoryData NameVariable
Abbreviation
Variable Meaning
Climate dataNASA Earth
Exchange Global Daily Downscaled Projections
(NEX-GDDP)
BIO 1Annual Mean Temperature
BIO 2Mean Diurnal Range (Mean of monthly (max temp–min temp))
BIO 3Isothermality (BIO2/BIO7) (×100)
BIO 4Temperature Seasonality (standard deviation ×100)
BIO 5Max Temperature of Warmest Month
BIO 6Min Temperature of Coldest Month
BIO 7Temperature Annual Range (BIO5-BIO6)
BIO 8Mean Temperature of Wettest Quarter
BIO 9Mean Temperature of Driest Quarter
BIO 10Mean Temperature of Warmest Quarter
BIO 11Mean Temperature of Coldest Quarter
BIO 12Annual Precipitation
BIO 13Precipitation of Wettest Month
BIO 14Precipitation of Driest Month
BIO 15Precipitation Seasonality (Coefficient of Variation)
BIO 16Precipitation of Wettest Quarter
BIO 17Precipitation of Driest Quarter
BIO 18Precipitation of Warmest Quarter
BIO 19Precipitation of Coldest Quarter
WorldClim 2.0
variables
Solar radiation
Wind speed
Water vapor pressure
Soil dataWISE derived soil properties (V1.2)ALSAExchangeable aluminum percentage (% of ECEC)
BSATBase saturation (% of CECs)
BULKBulk density
CECCCation exchange capacity of clay fraction (corrected for
organic C)
CECSCation exchange capacity
CFRAGCoarse fragments % (>2 mm)
CLPCClay %
CNrtC/N ratio
ECECEffective CEC
ELCOElectrical conductivity
ESPExchangeable Na percentage (as % of CECs)
GYPSGypsum content
ORGCOrganic carbon content
PHAQPH in water
SDTOSand%
STPCSilt%
TAWCVolumetric water content (−33 to −1500 kPa, cm·m−1)
TCEQCarbonate content
TOTNTotal nitrogen content
TEBTotal exchangeable bases

References

  1. Masson-Delmotte, V.; Zhai, P.M.; Pirani, A. Climate Change 2021: The Physical Science Basis; Cambridge University Press: Cambridge, UK, 2021; pp. 3–31. [Google Scholar]
  2. Fan, X.; Qin, Y.; Gao, X. Interpretation of the main conclusions and recommendations of the first working group report of the IPCC Sixth Assessment Report. Environ. Prot. 2021, 49, 44–48. [Google Scholar]
  3. Zhang, N. Climate change could lead to a global food crisis. Ecol. Econ. 2021, 37, 5–8. [Google Scholar]
  4. Yang, X.; Liu, Z.; Chen, F. The possible impact of global warming on China’s cropping system: Analysis of the possible impact of climate warming on the northern boundary of China’s cropping system and grain yield. Chin. Agric. Sci. 2010, 43, 329–336. [Google Scholar]
  5. Zhu, X.; Fang, X.; Wang, Y. Responses of rice and maize planting ranges to temperature changes in western Heilongjiang Province based on remote sensing. Geogr. Sci. 2008, 28, 66–71. [Google Scholar]
  6. Sun, Z.; Wang, X.; Yamamoto, H.; Zhang, J.; Tani, H.; Zhong, G.; Yin, S. Extraction of Rice-planting Area and Identification of Chilling Damage by Remote Sensing Technology: A Case Study of the Emerging Rice Production Region in High Latitude. Paddy Water Environ. 2017, 15, 181–191. [Google Scholar] [CrossRef]
  7. Chinese Academy of Sciences. Flora of China; Science Press: Beijing, China, 2004. [Google Scholar]
  8. Zeng, X.; Guo, Y.; Xu, Q.; Mascher, M.; Guo, G.; Li, S.; Mao, L.; Liu, Q.; Zhou, J.; Yuan, H.; et al. Origin and evolution of qingke barley in Tibet. Nat. Commun. 2018, 9, 5433. [Google Scholar] [CrossRef]
  9. Ma, W.; Su, P.; Jia, W.; Liu, F.; Wang, J. Advances in the Research on the Exposure of Highland Barley Natural Disasters on the Background of Climate Change. J. Catastr. 2020, 35, 215–221. [Google Scholar] [CrossRef]
  10. Elith, J.; Leathwick, J.R. Species distribution models: Ecological explanation and prediction across space and time. Annu. Rev. Ecol. Evol. Syst. 2009, 40, 677–697. [Google Scholar] [CrossRef]
  11. Guisan, A.; Thuiller, W. Predicting species distribution: Offering more than simple habitat models. Ecol. Lett. 2005, 8, 993–1009. [Google Scholar] [CrossRef]
  12. Hao, T.; Arroita, G.G.; May, T.W.; Monfort, J.J.L.; Elith, J. Using species distribution models for Fungi. Fungal Biol. Rev. 2020, 34, 74–88. [Google Scholar] [CrossRef]
  13. Walke, N.; Reddy, O.; Maji, K.; Thayalan, S. GIS-based multicriteria overlay analysis in soil—Suitability evaluation for cotton (Gossypium spp.): A case study in the black soil region of Central India. Comput. Geosci. 2012, 108–118. [Google Scholar] [CrossRef]
  14. Mendas, A.D.A. Integration of MultiCriteria Decision Analysis in GIS to develop land suitability for agriculture: Application to durum wheat cultivation in the region of Mleta in Algeria. Comput. Electron. Agric. 2012, 83, 117–126. [Google Scholar] [CrossRef]
  15. You, L.; Wood, S.; Wood-Sichra, U. Generating plausible crop distribution maps for Sub-Saharan Africa using a spatially dis-aggregated data fusion and optimization approach. Agric. Syst. 2009, 99, 126–140. [Google Scholar] [CrossRef]
  16. Evans, J.M.; Fletcher, R.J.; Alavalapati, J. Using species distribution models to identify suitable areas for biofuel feed stock production. Glob. Change Biol. Bioenergy 2010, 2, 63–78. [Google Scholar] [CrossRef]
  17. Xu, Z.; Peng, H.; Peng, S. Development and evaluation of species distribution models. J. Ecol. 2015, 35, 557–567. [Google Scholar]
  18. He, Q.; Zhou, G. Climate-associated distribution of summer maize in China from 1961 to 2010. Agric. Ecosyst. Environ. 2016, 232, 326–335. [Google Scholar] [CrossRef]
  19. He, Q.; Zhou, G. The climatic suitability for maize cultivation in China. Chin. Sci. Bull. 2012, 57, 395–403. [Google Scholar] [CrossRef] [Green Version]
  20. Mokarram, M.; Ghasemi, M.M.; Zarei, A.R. Evaluation of the soil fertility for corn production (Zea Mays) using the multiple-criteria decision analysis (MCDA). Model. Earth Syst. Environ. 2020, 6, 2251–2262. [Google Scholar] [CrossRef]
  21. Lane, A.; Jarvis, A. Changes in climate will modify the geography of crop suitability: Agricultural biodiversity can help with adaptation. J. Sat Agric. Res. 2007, 4, 1–11. [Google Scholar]
  22. Byeon, D.; Jung, S.; Lee, W. Review of CLIMEX and MaxEnt for studying species distribution in South Korea. J. Asia-Pac. Biodivers. 2018, 11, 325–333. [Google Scholar] [CrossRef]
  23. Lawler, J.; White, D.; Neilson, R.; Blaustein, A. Predicting climate-induced range shifts: Model differences and model reliability. Global Change Biol. 2006, 12, 1568–1584. [Google Scholar] [CrossRef] [Green Version]
  24. Phillips, S.J.; Anderson, R.P.; Schapire, R.E. Maximum entropy modeling of species geographic distributions. Ecol. Model. 2006, 190, 231–259. [Google Scholar] [CrossRef] [Green Version]
  25. Shi, P.; Chen, Y.; Zhang, A.; He, Y. Factors contribution to oxygen concentration in Qinghai-Tibetan Plateau. Chin. Sci. Bull. 2019, 64, 715–724. [Google Scholar] [CrossRef] [Green Version]
  26. Wei, H.; Lv, C.; Liu, Y.; Yang, K. Spatial distribution and temporal changes of facility agriculture on the Tibetan Plateau. Resour. Sci. 2019, 41, 1093–1101. [Google Scholar] [CrossRef] [Green Version]
  27. Du, J.; Li, Y.; Jian, J.; Bian, Z.; Yuan, L. Research on the Impact of Climate Change on Highland Barley Cultivation in Tibet; Meteorological Press: Beijing, China, 2017. [Google Scholar]
  28. Jia, J.; Li, X. Status Quo, Problems and Policy Suggestions of Highland Barley Industry Development in Qinghai Province. Chin. Food Nutr. 2016, 22, 21–24. [Google Scholar]
  29. Li, J. Research Status and Breeding Prospects of Highland Barley Quality in Ganzi Prefecture. South. Agric. 2019, 13, 187–188. [Google Scholar]
  30. Shang, X. New Ideas for Highland Barley Production in Gannan Prefecture. Jiangxi Agric. 2018, 77. [Google Scholar] [CrossRef]
  31. Mi, Y.; Zhang, J.; Zhang, J.; Yang, X.; Zhang, Y.; He, W. Status Quo and Advantages of Yunnan Highland Barley Industry. Barley Sci. 2004, 1–5. [Google Scholar] [CrossRef]
  32. Gerong, Q.; Zhao, Y.; Zhang, X. Multifunctional research of modern agriculture based on the development of highland barley industry in Diqing, Yunnan Province. J. Yunnan Agric. Univ. 2020, 14, 75–82. [Google Scholar]
  33. Lobell, D.B.; Schlenker, W.; Roberts, J.C. Climate trends and global crop production since 1980. Science 2011, 333, 616–620. [Google Scholar] [CrossRef] [Green Version]
  34. Kravchenko, A.N.; Bullock, D.G. Correlation of corn and soybean grain yield with topography and soil properties. Agron. J. 2000, 92, 75–83. [Google Scholar] [CrossRef]
  35. Ma, W.; Jia, W.; Su, P.; Feng, X.; Liu, F.; Wang, J. Mapping Highland Barley on the Qinghai-Tibet Plateau Combing Landsat OLI Data and Object-Oriented Classification Method. Land 2021, 10, 1022. [Google Scholar] [CrossRef]
  36. Hijmans, R.J.; CaMeron, S.E.; Parra, J.L.; Jones, P.G.; Jarvis, A. Very high resolution interpolated climate surfaces for global land areas. Int. J. Climatol. 2005, 25, 1965–1978. [Google Scholar] [CrossRef]
  37. Ficka, S.E.; Hijmans, R.J. Worldclim 2: New 1km spatial resolution climate surfaces for global land areas. Int. J. Climatol. 2017, 37, 4302–4315. [Google Scholar] [CrossRef]
  38. IPCC. Climate Change 2014—Impacts, Adaptation and Vulnerability: Regional Aspects; Contribution of Working Group II to the Fifth Assessment Report of the Intergovernmental Panel on Climate Change; Cambridge University Press: Cambridge, UK, 2014. [Google Scholar]
  39. Vuuren, D.; Kriegler, E.; O’Neill, B.; Ebi, K.L.; Riahi, K.; Carter, T.R.; Edmonds, J.; Hallegatte, S. A new scenario framework for climate change research: Scenario matrix architecture. Clim. Change 2014, 122, 373–386. [Google Scholar] [CrossRef] [Green Version]
  40. Wei, M.; Shu, Q.; Song, Z.; Song, Y.; Yang, X.; Guo, Y.; Li, X.; Qiao, F. Evaluation and attribution analysis of CMIP6 climate model’s ability to simulate global warming and slowdown in the early 21st century. Chin. Sci. Earth Sci. 2021, 51, 947–961. [Google Scholar]
  41. Fan, M. Simulation of land cover change in Beijing-Tianjin-Hebei region based on different scenarios of SSP-RCP. Acta Geogr. 2022, 77, 228–244. [Google Scholar]
  42. Ying, X.; Hai, X.C. Preliminary assessment of simulations of climate changes over China by CMIP5 multi-models. Atmos. Ocean.Sci. Lett. 2012, 5, 489–494. [Google Scholar] [CrossRef]
  43. Eyring, V.; Cox, M.; Flato, M.; Gleckler, J. Taking climate model evaluation to the next level. Nat. Clim. Chang. 2019, 9, 102–110. [Google Scholar] [CrossRef] [Green Version]
  44. Kim, H.Y.; Ko, J.; Kang, S.; Tenhunen, J. Impacts of climate change on paddy rice yield in a temperate climate. Glob. Chang. Biol. 2013, 19, 548–562. [Google Scholar] [CrossRef]
  45. Zhang, L.; Wei, Y.; Wang, J.; Zhou, Q.; Liu, F.; Cen, Q.; Liu, F. Potential geographic distribution of Lycium barbarum nigra under climate change scenarios. J. Appl. Environ. Biol. 2020, 26, 969–978. [Google Scholar]
  46. Zhang, L. Research on the Potential Geographic Distribution of Endangered Plants on the Qinghai-Tibet Plateau and the Construction of Protected Areas; Qinghai Normal University: Xining, China, 2020. [Google Scholar]
  47. Xing, D.; Hao, Z. The principle of maximum entropy and its application in ecological research. Biodiversity 2011, 19, 295–302. [Google Scholar]
  48. Kong, W.; Li, H.; Zou, H. Optimization of Maximum Entropy Model in Species Distribution Prediction. J. Applied Ecol. 2019, 30, 2116–2128. [Google Scholar]
  49. Lobo, J.M.; Valverde, A.J.; Real, R. AUC: A misleading measure of the performance of predictive distribution models. Glob. Ecol. Biogeogr. 2008, 17, 145–151. [Google Scholar] [CrossRef]
  50. Fielding, A. A review of methods for the assessment of prediction errors in conservation presence/absence models. Environ. Conserv. 1997, 24, 38–49. [Google Scholar] [CrossRef]
  51. Swets, J.A. Measuring the accuracy of diagnostic systems. Science 1988, 240, 1285–1293. [Google Scholar] [CrossRef] [Green Version]
  52. Manning, M.R. The treatment of uncertainties in the Fourth IPCC Assessment Report. Res. Adv. Clim. Chang. 2006, 2, 13. [Google Scholar]
  53. Oke, T.A.; Hager, H.A.; Bussmann, R. Assessing environmental attributes and effects of climate change on sphagnum peatland distributions in North America using single- and multi-species models. PLoS ONE 2017, 12, e0175978. [Google Scholar] [CrossRef] [Green Version]
  54. Yi, Y.; Zhou, Y.; Cai, Y.; Yang, W.; Li, Z.; Zhao, X. The influence of climate change on an endangered riparian plant species: The root of riparian homonoia. Ecol. Indic. 2018, 92, 40–50. [Google Scholar] [CrossRef]
  55. Su, P.; Zhang, A.; Wang, R.; Wang, J.; Gao, Y.; Liu, F. Prediction of future natural Suitable areas for rice under Representative Concentration Pathways (RCPs). Sustainability 2021, 13, 1580. [Google Scholar] [CrossRef]
  56. Zhang, G.; Dong, J.; Zhou, C.; Xu, X.; Wang, M.; Ouyang, H.; Xiao, X. Increasing cropping intensity in response to climate warming in Tibetan Plateau, China. Field Crops Res. 2013, 142, 36–46. [Google Scholar] [CrossRef]
  57. Pu, J.; Yao, X.; Deng, Z.; Yao, Y.; Wang, W.; Zhang, M. Impact of climate warming on winter rape planting in Gansu Province. Acta Agron. Sin. 2006, 32, 1397–1401. [Google Scholar]
  58. He, X. Research on the Current Situation and Influencing Factors of Cultivated Land Expansion in the Pengqu River Basin of the Qinghai-Tibet Plateau; Southwest University: El Paso, TX, USA, 2020. [Google Scholar]
  59. Jiang, T.; Jing, C.; Wang, Y.; Zhai, J.; Cao, L.; Xu, X.; Yu, D.; Su, B. Possibility Analysis of Realizing Global Sustainable Development Goals under the Path of SSPs. Sci. Sin. 2020, 50, 1445–1454. [Google Scholar]
  60. Weng, Y.; Cai, W.; Wang, C. Application and Prospect of Shared Socioeconomic Pathways (SSPs). Clim. Change Res. 2020, 16, 215–222. [Google Scholar]
Figure 1. The location of the study area.
Sustainability 14 06617 g001
Figure 2. Research framework for the study.
Sustainability 14 06617 g002
Figure 3. Response curves of major ecological factors.
Sustainability 14 06617 g003
Figure 4. AUC values of MaxEnt model training data and test data.
Sustainability 14 06617 g004
Figure 5. Distribution of potential suitable areas for highland barley planting on the Qinghai-Tibet Plateau in the historical period.
Sustainability 14 06617 g005
Figure 6. Distribution of potential suitable areas for highland barley planting on the Qinghai-Tibet Plateau in the near term and medium term.
Sustainability 14 06617 g006
Figure 7. Spatial changes of potential suitable areas for highland barley planting on the Qinghai-Tibet Plateau.
Sustainability 14 06617 g007
Figure 8. Distribution of potential suitable areas for highland barley planting in different periods.
Sustainability 14 06617 g008
Figure 9. Elevation migration of potential suitable areas for highland barley planting in different periods.
Sustainability 14 06617 g009
Table 1. Data and sources.
Data CategoryData NameTime
Resolution
Spatial
Resolution
Data Sources
Basic geographic
information
Geographic Information System Data of the Scope and Boundary of the
Qinghai-Tibet Plateau
2014-Global Change Scientific Research Data Publishing System
http://www.geodoi.ac.cn (accessed on 1 April 2020)
Highland barley planting areaQinghai-Tibet Plateau highland barley planting area data2019-Based on Landsat 8 Operational Land Imager remote sensing image extraction
Environment
variable
Global Digital Elevation Model data201030 m × 30 mUnited States Geological Survey
https://topotools.cr.usgs.gov (accessed on 1 Octomber 2019)
Global soil parameter data20125′ × 5′International Soil Reference and
Information Centre
http://www.isric.org (accessed on 15 November 2020)
Climate model data1970–20992.5′ × 2.5′WorldClim
https://www.worldclim.org (accessed on 25 November 2020)
Table 2. Changes in climate indicators under the representative concentration pathway of future climate models.
Representative
Concentration Pathway
Temperature VariationCO2 Concentration ChangePrecipitation Change
RCP 4.5Rise 1.0~2.6 °C650 × 10−6 L/LIncrease by 4.00%
RCP 8.5Rise 2.6~4.8 °C1350 × 10−6 L/LIncrease by 4.60%
Table 3. Number of sample points in each group.
Proportion of Highland Barley Planting Area in the Grid (%)1–1010–3333–66≥66Total
Number of grids35,523499881313941,473
Highland barley planting area (km2)1118.70850.13358.22110.582437.63
Number of sample points140710694511393066
Table 4. Variables for which the calculation result of KL divergence is greater than 1.
VariableKL Divergence
Mean Temperature of Coldest Quarter (BIO 11)8.12
Annual Mean Temperature (BIO 1)7.51
Mean Temperature of Driest Quarter (BIO 9)6.07
Effective CEC (ECEC)3.47
Min Temperature of Coldest Month (BIO 6)3.41
Mean Temperature of Wettest Quarter (BIO 8)2.58
Mean Temperature of Warmest Quarter (BIO 10)2.27
Precipitation of Wettest Quarter (BIO 16)1.55
Annual Precipitation (BIO 12)1.54
Precipitation of Wettest Month (BIO 13)1.50
Sand% (SDTO)1.40
Precipitation of Warmest Quarter (BIO 18)1.31
Coarse Fragments% (>2 mm) (CFRAG)1.29
Exchangeable Na Percentage (as % of CECs) (ESP)1.23
Temperature Seasonality (standard deviation ×100) (BIO 4)1.19
Max Temperature of Warmest Month (BIO 5)1.16
Organic Carbon Content (ORGC)1.08
Cation Exchange Capacity of Clay Fraction (corrected for organic C) (CECC)1.05
Note: Indicators in the table are abbreviated when referred to later.
Table 5. Variables whose contribution rate is greater than 0% after MaxEnt model simulation.
VariableContribution Rate (%)VariableContribution Rate (%)VariableContribution Rate (%)
BIO 131.80BIO 63.54BIO 110.82
BIO 1222.72BIO 42.22ORGC0.66
BIO 1021.26CECC1.40BIO 80.58
BIO 187.66SDTO1.12BIO 90.20
BIO 55.00ECEC0.92BIO 160.08
Table 6. Variables with correlation greater than 0.8 after correlation matrix calculation.
BIO 1BIO 10BIO 11BIO 12BIO 16BIO 6
BIO 100.93-----
BIO 110.96-----
BIO 16---0.99--
BIO 18---0.980.99-
BIO 5-0.96----
BIO 60.94-0.98---
BIO 8-0.87----
BIO 9--0.86--0.86
Table 7. 10 final variables after screening of habitat variables.
VariableContribution Rate (%)VariableContribution Rate (%)
BIO 150.50BIO 41.70
BIO 1231.60BIO 81.30
BIO 95.40SDTO1.00
BIO 54.70ORGC1.00
CECC2.50ECEC0.30
Table 8. Accuracy verification of the historical estimated results in potentially suitable areas for highland barley planting.
ClassificationArea (ha)Proportion (%)
Highland barley planting area in suitable area27.37 × 10499.88
Highland barley planting area in unsuitable areas3.150.12
Publisher’s Note: MDPI stays neutral with regard to jurisdictional claims in published maps and institutional affiliations.

