Article

Testing Convergence of Tourism Development and Exploring Its Influencing Factors: Empirical Evidence from the Greater Bay Area in China

1
School of Geography and Planning, Sun Yat-Sen University, Guangzhou 510006, China
2
Faculty of Health and Sports Science, Juntendo University, Inzai 2701695, Chiba, Japan
3
School of Information Technology in Education, South China Normal University, Guangzhou 510631, China
4
School of Geography and Remote Sensing, Guangdong Provincial Center for Urban and Migration Studies, Guangzhou University, Higher Education Mega Center, Guangzhou 510006, China
*
Authors to whom correspondence should be addressed.
Sustainability 2022, 14(11), 6616; https://doi.org/10.3390/su14116616
Submission received: 3 April 2022 / Revised: 22 May 2022 / Accepted: 26 May 2022 / Published: 28 May 2022

Abstract

:
Inverse globalization and the spread of epidemics have affected the world economy. Promoting the convergence and resilience of the tourism industry is an important means of boosting regional economic recovery and high-quality development. Taking the nine cities in the Guangdong–Hong Kong–Macao Greater Bay Area (GBA) as cases, this study measures the state of development in each city from 2010 to 2019, and it constructs a coupled coordinated model to evaluate the integration of culture and tourism development. The entropy method and the coupling-coordination-degree model are evaluated through this empirical analysis. The results demonstrate that most cities in the GBA show an upward trend in the development and integration of the tourism industry. The development and integration of the tourism industry in Guangzhou and Shenzhen has always been in a leading position. The main factors that affect the level of tourism-industry convergence in the GBA cities include the level of economic development, the scale of government spending, the level of urbanization, and the level of technological innovation.

1. Introduction

The coronavirus pandemic has spread rapidly around the world and has substantially affected all sectors of the world economy. Many emerging markets and developing countries have implemented domestic consumption-driven economic rebalancing to reduce their reliance on overseas markets and technology in their long-term development. In the context of this new “dual circulation” development paradigm, which is being constructed at a high speed, the domestic market plays a pivotal role in resource allocation and economic growth. With the gradual control of the epidemic and the release of huge consumer demand from the people, domestic tourism has become a favorable starting point for promoting economic recovery and driving the internal cycle of the economy. Under severe economic conditions and health crises, tourism can contribute to people’s well-being and quality of life [1,2]. The domestic tourism sector is set to enjoy further growth in China, bolstered by huge opportunities unleashed by the “dual circulation” path. The early strategy to boost cultural attraction and regional competitiveness, and the comparative advantage of tourism destinations, could be changed by the “dual circulation” paradigm [3].
The Guangdong–Hong Kong–Macao Greater Bay Area (GBA) is the largest and most populated urban area in the world. The GBA has a total area of 56,000 km2 and is in South China, with the most competitive cities. The GBA has a population of approximately 5% of the total population of China. Already dubbed “richer than Silicon Valley,” the expected GDP of the GBA by 2030 would be larger than the current GDP of Germany, making it the highest GDP among other bay areas, according to a report by PwC. With a rich culture and heritage-related resources, the GBA is a famous world-class tourist destination. With strong economic vitality, a high degree of inclusiveness and openness, and leading innovation capabilities, the development of the GBA is a priority for the government.
Destination marketing has received considerable attention for the past several years. However, the sustainable tourism development in the GBA has not yet been systematically studied. For example, very few studies have been conducted to explore the differences in the tourism industry’s convergence of cities within this urban agglomeration. Within a modern tourism format, culture has become a key product and has created distinctiveness in an increasingly crowded global marketplace. Exploring the issue of convergence between tourism and culture in the GBA on the basis of tourist arrivals from different destinations, and identifying the influencing factors, is conducive to promoting multidimensional sustainability in tourism, designing long-term recovery strategies, and providing ongoing support and constructive guidance for delivering tourism services.
Against the background of cultural and tourism integration, the purpose of this research was threefold: (1) to conduct a dynamic analysis to estimate the trend in the coupled development of the tourism and culture industries; (2) to explore the influencing factors that contribute to the coupling relationship between the tourism and culture industries; and (3) to provide a reference for macro-policy formulation in the GBA with regard to the sustainable development of the tourism industry. Against this background, a sequential mixed-methods design that consists of three steps was adopted to achieve these research objectives. An aggregated-evaluation-index system was constructed to assess the impact of tourism clusters on local development. The commonly used entropy-weight method was then adopted to determine the weights of the relative importance of the criteria. The coordination-degree model was built to evaluate the degree of the coupling coordination in tourism development.

2. Literature Review

In general, the term “convergence” can be used to describe the coming together of two different entities. In the world of technology, the meaning of convergence refers to different technological systems that move towards performing a range of identical or similar duties. Over the past year, the blurring of boundaries between industries through the convergence of elements has been an emerging trend as a response to the global economy. Convergence is usually related to integration and coordination to show a similar trend among industries [4,5,6]. Industrial convergence is an important phenomenon in the development of modern industry. “Industrial convergence” can be defined as the blurring of industry boundaries through the integration of interactive elements, such as tech-led strategies, valuations, and business models [7,8]. Industrial convergence is characterized by a gradual and continuous unsolidified and dynamic process [9].
The convergence between tourism and culture, and the increasing interest of visitors in history, preservation, heritage sites, and cultural activities, bring incredible opportunities, but also immediate challenges, to the core business model of tourism. Over the past several years, as a popular term, convergence is an emerging branch of tourism research, and it has been widely known, cited, and mentioned explicitly in the development of tourism destinations. Cultural tourism is a modality that has been expanding over the past 20 years. It has recorded strong growth and has become one of the largest and fastest-growing global tourism markets. Cultural tourism is a trend of many countries and regions. Cultural tourism has the conditions and characteristics that are required for industrial convergence, and it is an important practical form of modern industrial convergence and development. Today, it is widely accepted that cultures are not naturally bounded entities, and they involve multiple aspects across borders and the global marketplace [10,11].
The convergence between tourism and culture, and the increasing interest of visitors in cultural experiences, provide unique opportunities, as well as complex challenges, for the global economy from different perspectives. Previous studies have used the evaluation model of the coordination degree to explore the integration between the culture and tourism sectors. For example, the direct economic impact of tourism development can be measured by evaluating the investment efficiency [12], the synergy of the tourism industry and regional innovation [6], a competitiveness evaluation and the regional synergy [13], and the integration of the cultural tourism industry and influencing factors [14,15]. In recent years, research on the convergence between tourism and culture has been making significant progress in digital transformation. However, few studies have investigated the convergence between the tourism and culture industries in the Greater Bay Area, which consists of nine cities and two special administrative regions in South China, from the economic-development and opening-up perspective.

3. Methodology

3.1. Study Area

The GBA comprises nine municipalities within Guangdong province, plus two special-administrative-region cities—Hong Kong and Macau. Because of the large differences in the economic statistics and related measures between the Hong Kong and Macau special administrative regions, this study takes the Pearl River Delta’s nine cities as the research object. The data from 2010 to 2019 were collected from the statistical yearbooks of local cities, the official website of the Ministry of Culture and Tourism of the People’s Republic of China, and the National Bureau of Statistics of the People’s Republic of China.

3.2. Evaluation of Convergence Model

On the basis of the key findings that were synthesized from the empirical and conceptual articles [14,15], a comprehensive and methodical evaluation-index system was established to measure the industrial convergence between the cultural and tourism industries (Table 1).

3.2.1. Dimensionless Quantification Processing

The raw data were standardized by using Equation (1) to eliminate the influence of the dimensional homogeneity:
x i j = ( x j ( t ) x min ) / ( x max x min ) + 0.0001
where x i j is the standardized value and the original value of index j in year i, and xmax is the maximum and minimum value of index j among all the years, respectively. We added “0.0001” to the calculation formula to avoid the result of 0 in the dimensionless processing.

3.2.2. Evaluation of Tourism and Cultural Industries

Two or more chaotic and mechanical systems are coupled when they interact with or are dependent on each other. This interaction phenomenon is complex in its manifestations, and interrelationships involve and integrate various system components in a variety of ways; they are dynamic, and they change at a variety of timescales [16].
Suppose x1, x2, , xp are the indicators of the subsystem in tourism, and y1, y2, , yq are the indictors of the culture subsystem. Then,
f ( x ) = f = 1 n w f M i j
g ( y ) = g = 1 n w g N i j
where f(x) and g(y) represent the normalized integration values of the subsystem between the tourism and the cultural industries, respectively. Mij and Nij represent the standardized values of xf and yg, respectively, and they are estimated by x i j , as described above. In addition, wf and wg are the weights of xf and yg, respectively, which can be determined by the commonly used weighting method of the information-entropy weight.
The concept of information entropy was originally defined as a theoretical model of communication to measure information content. This can be used as a novel analysis method for visualizing and analyzing the uncertainty of a random variable. In general, an entropy increase leads to more information, which is an increase in uncertainty or entropy. A value-weighted index can be calculated to quantify information about an event and a random variable. As a systematically highly-quality technique for assessing indicators, using entropy weight to determine weight is a better way to evaluate value dispersion in decision making. To implement this, the following steps were followed.
Calculating the proportion of the index j in year i:
s i j = x i j / i = 1 m x i j
Calculating the information entropy of the index j:
h j = 1 ln m i = 1 m s i j ln s i j       ( 0 h j 1 )
Calculating the entropy redundancy:
α j = 1 h j
This formula simply tests the value and determines whether the value of the information entropy (hj) varies with different acquired data. If so, the redundancy of index j (αj) is larger. In general, if αj is larger, hj is smaller, which demonstrates that the more large-scale information that indicator j contains, the more meaningful the index j weight is.
The weight of the index j (wj) can be further calculated as:
w j = α j / j = 1 n α j
where n represents the number of indices, and n is defined as the number of years.

3.2.3. The Coupling-Coordination-Degree Model

The coordination-degree-measurement model was conducted to calculate the degree of coupling or interaction between culture and the tourism industry (C). The formula that was used is as follows:
C = 2 f ( x ) g ( y ) / [ ( f ( x ) + g ( y ) ) ( f ( x ) + g ( y ) ) ] D ( f ( x ) , g ( y ) ) = C T T = α f ( x ) + β g ( y )
where D is the value of the coupling coordination degree, D ∈ [0,1], C is the value of the coupling degree between tourism and culture, T is the overall development of the culture and tourism sectors, and a and b are the contributions of tourism and culture, respectively. The two values are equivalent; that is, a = b = 0.5.
The coupling connection between tourism and culture was classified into 3 groups, 8 subgroups, and 24 types, according to the established connection between the overall evaluation index of tourism f(x) and culture g(y) (Table 2).

3.3. Factoring Determining the Real Convergence

The panel model analyzes the factors that affect the degree of coupling between the culture and tourism systems. On the basis of the results of the analysis of factors that affect the growth and development of the tourism and cultural industries at home and abroad, the indicators that affect the degree of coupling between the culture and tourism industries were selected from four key areas.
The first factor is the level of economic growth and development. Tourism contributes to the national economic activity, and the cultural sector requires strong economic support. With overall improvements in material prosperity, people have higher pursuits of material and spiritual civilization, and an increasing number of people are participating in tourism and cultural activities. They are no longer satisfied with typical and traditional sightseeing tourism but are focused on the customs and cultural connotations of tourism, the pursuit of cultural experiences, and spiritual enjoyment. Thus, the level of economic development is likely to affect the integration and development of the tourism and cultural industries. This factor is reflected in the GDP per capita.
The second factor is the scale of government or public spending. The financial support that is provided by the government for the tourism industry helps improve the infrastructure construction that is required for the growth of the tourism sector, and it provides driving forces and foundations for the integration of tourism and the cultural industry. This is expressed as the government fiscal expenditure, taxation, and borrowing.
The third factor is the development level of urbanization. Urbanization is conducive to adjusting the industrial structure, improving traffic conditions, and simultaneously bringing in human capital, which thus affect the integration of culture and the tourism economy. The urbanization level of each city was measured by the urban population (% of the total population).
The fourth factor is the intensity of technological innovation. Innovation is an endogenous driving force of economic and industrial development in urban areas. Technological innovation has been integrated into the management and operation mode of the tourism industry, involving elements, products and services, markets, systems, etc., to provide vitality for industrial development. This factor is reflected in the number of patent applications granted.
The driving factors are analyzed on the basis of the main indicators, such as the per capita GDP (X1), the government financial expenditure (X2), the proportion of urban population to the population at the end of the year (X3), and the number of patent applications granted (X4).
The degree of the coupling coordination varied significantly between 0 and 1, and the dependent variables with limit values were truncated, conforming to the setting conditions of the limited-dependent-variable Tobit-regression model. A random-effect Tobit model was estimated to show the econometric relations. This is an effective way to avoid biased results caused by least-squares regression. The model settings were as follows:
Y i t = α i + β 1 X 1 t + β 2 X 2 t + β 3 X 3 t + β 4 X 4 t + ε i t
where Yit is the degree of coupling coordination between the tourism industry; Xit represents the explanatory variable; αi is a constant term; β is the coefficient vector of Xit; and εit is a random-error term and obeys the assumptions of mutual independence, mean 0, and homoscedasticity. By using the Stata15.1 quantitative analysis software, a random-effects panel Tobit regression was performed.

4. Results

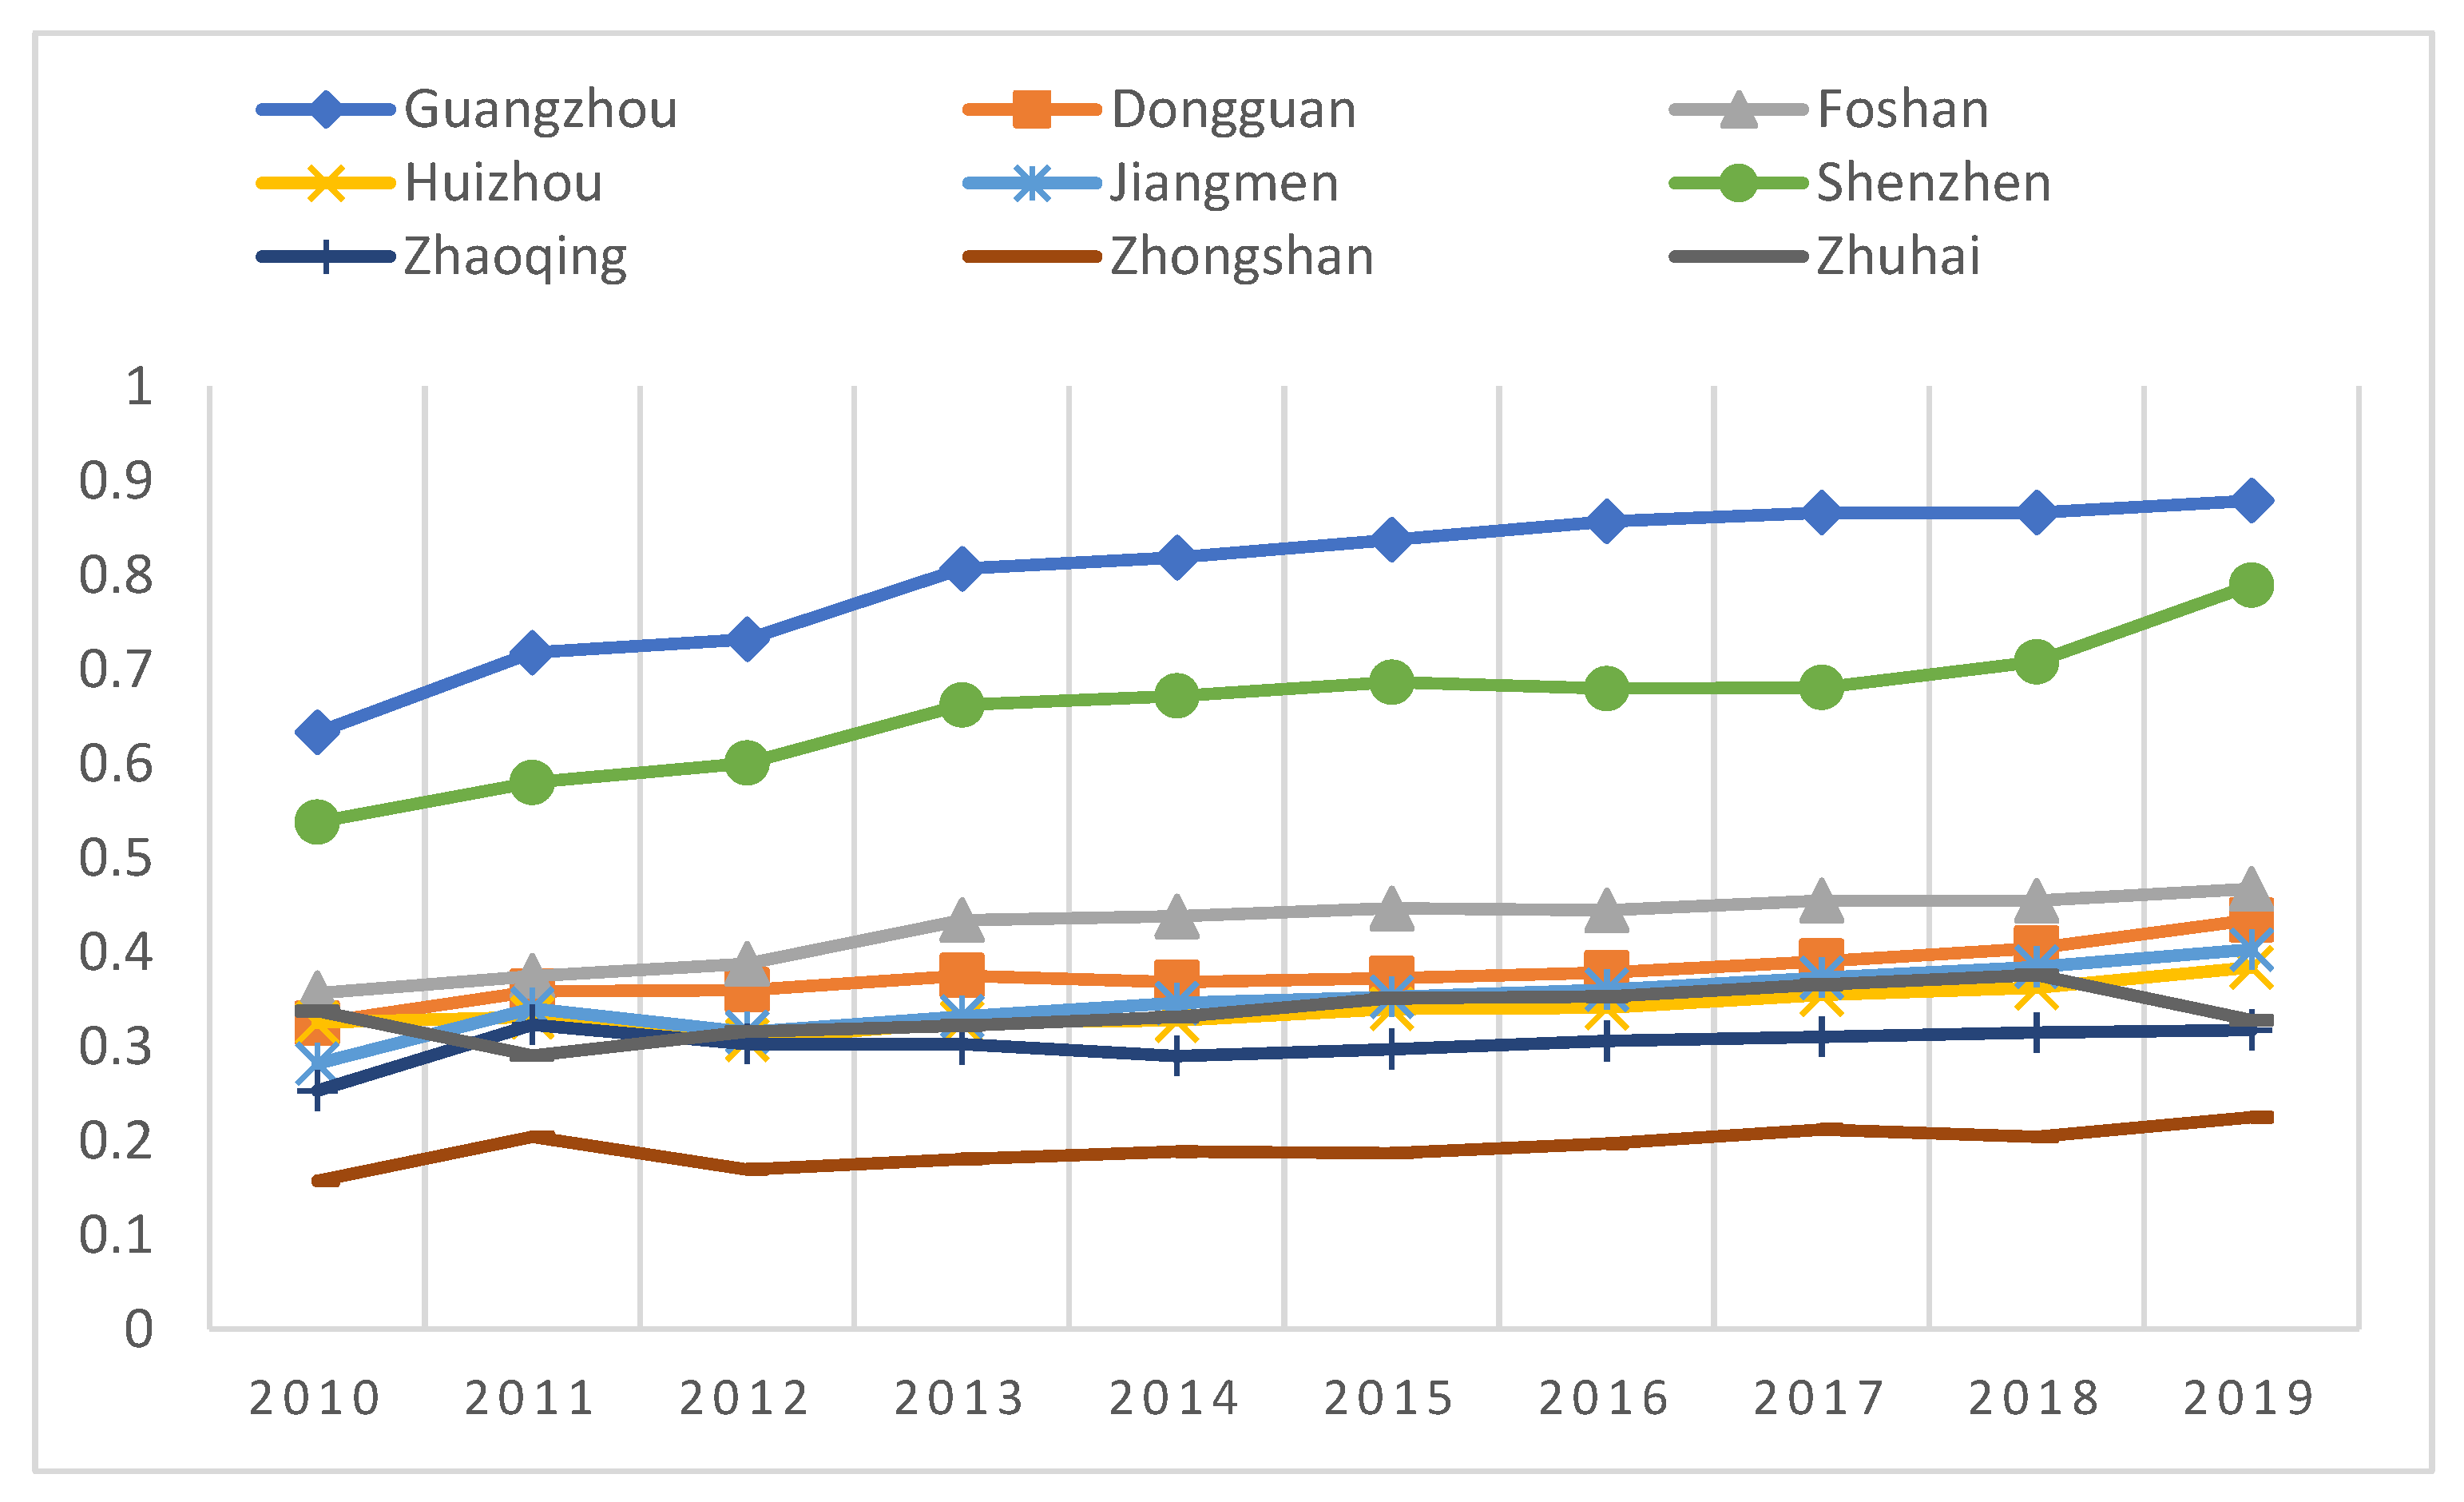
4.1. Comprehensive Development in GBA

From 2010 to 2019, the level of cultural industry development showed a clear upward trend, with apparently random fluctuations from year to year; however, the development speed was slow (see Figure 1). The cultural-industry-development level of Guangzhou is better than that of Shenzhen, but the development trend of Shenzhen is better. The overall development levels of other cities are not high and are relatively close, followed by Foshan, Zhaoqing, Jiangmen, Dongguan, Huizhou, Zhuhai, and Zhongshan. The level of cultural industry development in these areas is far from that in the first-tier cities of Guangzhou and Shenzhen. This shows that cities in the GBA show a phenomenon of “polarization” of cultural industry development, and regional coordinated development needs to be strengthened.
The tourism-industry-development level in the GBA from 2010 to 2019 is shown in Figure 2. It is found that, compared with the cultural sector, the tourism sectors of most cities in the GBA show a more obvious upward trend, and industry development gradually matures. Guangzhou’s tourism industry has the highest level of development, followed by Shenzhen. Figure 2 shows the development levels of the other cities: Dongguan, Foshan, Zhuhai, Huizhou, Jiangmen, Zhongshan, and Zhaoqing.

4.2. Development Trend of Industrial Integration

A slow upward trend was demonstrated with regard to the latest trends in the integration of the culture and tourism sectors (Figure 3), which means that the integration is developing in a positive direction. In recent years, the differences between Guangzhou and Shenzhen have gradually approached each other, but the overall development level of Guangzhou is better than that of Shenzhen. The development levels of Guangzhou and Shenzhen are much better than those of the other cities. Foshan, Dongguan, Jiangmen, and Huizhou are relatively slow to integrate. The level of industrial integration in Zhongshan needs to be strengthened.

4.3. Convergence of Culture and Tourism Sectors in GBA

Although the overall convergence of the tourism and culture sectors in the GBA was mostly at the imbalance level, the convergence of most cities showed a positive trend from 2010 to 2019 (see Table 3). Guangzhou and Shenzhen outperformed other cities and achieved good coordination levels.
On the basis of the coupling model, we compared the development levels of the tourism industry f(x) and the cultural industry g(y) to determine the coupling coordination degree (see Table 4). Among them, when f(x) > g(y), the cultural industry lags; when f(x) < g(y), the tourism industry lags; and when f(x) = g(y), the tourism industry development is synchronized. By using the above analysis method, the coupling coordination degree of each city in different periods was determined. It was found that the numbers of cultural lags and tourism lags are equal, and the cities can be roughly separated into three groups. The first group is Shenzhen, Dongguan, and Zhongshan, which are dominated by cultural lags. The second group is Guangzhou, Foshan, Jiangmen, and Zhaoqing, which are lagging in tourism. In the third group, Huizhou and Zhuhai were dominated by tourism lags in the early stages.

4.4. Influencing Factors of Convergence

A panel model was used to identify the factors that influence convergence on the basis of the degree of coupling between the culture and tourism sectors in each city. The effect coefficients of the level of economic development, the scale of government expenditure, the level of urbanization, and the level of technological innovation are all significant at the 5% level. The coefficients of the four variables are 0.082, 0.098, 0.245, and 0.164, respectively, which indicates that economic development and government financial expenditure, urbanization, and technological innovation have strong positive impacts on convergence in the GBA (see Table 5).

5. Discussions and Conclusions

5.1. Theoretical Contributions

Urban agglomerations show different developmental patterns and stages in the GBA. The high-quality and sustainable performance of cultural tourism plays a significant role in revitalizing the economy and in improving the quality of residents’ lives. Under the severe economic situation and health crisis, choosing the GBA to explore the evolution of cultural tourism development and to influence evolutionary change has conceptual contributions and reference values to realize collaborative innovation, and to help tourism firms transition to an appropriate collaborative innovation model.
From 2010 to 2019, the development level of the cultural tourism in the GBA gradually improved. Guangzhou had the highest level of cultural tourism development, followed by Shenzhen. The integration of cultural tourism in the GBA can be divided into three categories on the basis of their development characteristics. The first category includes Dongguan and Zhongshan, which are dominated by cultural lags. The development of the tourism industry in such cities performs better than that of the cultural industry. The specific performance of such cities is that the infrastructure level is better and transportation is developed. However, they have not yet developed profound cultural heritages, and they lack core cultural competitiveness. Taking Dongguan as an example, it is adjacent to Guangzhou and Shenzhen. It has convenient transportation conditions and a relatively complete infrastructure for tourism development. There is insufficient historical and cultural exploration, and there is always room for improvement in terms of urban cultural construction. The second category is Foshan, Jiangmen, and Zhaoqing, which are lagging in tourism. Such cities often have rich historical and cultural resources, as well as unique urban images. However, there are significant deficiencies in the relative geographical locations of the cities, connecting major tourist attractions, and location advantages. For example, Zhaoqing is the birthplace of Lingnan culture, and the capital of Chinese inkstones, and it has inherited ancient and modern. There are many cultural relics and historical sites. It has 19 national and provincial intangible cultural heritage sites, and 36 national and provincial cultural relics’ protection units. It has been rated as a national, historical, and cultural city. Despite rich cultural resources, the cultural industry development of the region, and the needs of residents, have not been able to effectively meet tourism needs. At the same time, compared with other cities, Zhaoqing has significant deficiencies in connecting major tourist attractions and location advantages. In the third category, Huizhou and Zhuhai were dominated by tourism lags in the early stages. In the early stages of investment in infrastructure construction, tourism development progressed significantly. For example, there were problems such as imperfect public service facilities, tourism infrastructure, and transportation facilities in the early stages, and the tourism industry lagged behind. Recently, Zhuhai Hengqin promoted the construction of an international tourism island and created a national all-for-one tourism demonstration. Great achievements have been made in the construction of districts and coastal international leisure tourism destinations, and the level of tourism development has significantly improved.
Limited studies have been conducted on exploring the special role of the overall culture and heritage-related travel of the Greater Bay Area over a long period of time, despite the fact that the region has developed a comprehensive industry chain and has become an arts and culture destination. An impact-factor-dynamics model was developed in this study, which can be used to analyze the correlation between the impact factor and the elements. It has been quantitatively confirmed that economic development, government expenditure, urbanization construction, and technological innovation all play pivotal roles in accelerating the integrated planning of regional cultural tourism. The evolution of cultural tourism is driven by several factors. With improvements in general living standards, an increasing number of people are participating in tourism activities to pursue cultural experiences and spiritual enjoyment. The government provides more financial support for the development of the cultural tourism industry, which helps improve the infrastructure construction that is required for the integration of the cultural tourism industry, and it promotes the integrated development of the two. Urbanization is conducive to adjusting the industrial structure, improving traffic conditions, and simultaneously bringing in human capital, which thus affect the integration of culture and the tourism economy. Technological innovation plays an important role in all aspects of cultural-tourism-industry activities, including elements, products and services, markets and systems, and many other aspects of culture, tourism management, and operation models.

5.2. Managerial Implications

For cities with low degrees of integration in the tourism industry, local governments must first identify problems and determine the reasons, and then clarify the development concept, learn advanced experiences, and realize a significant coupling coordination relationship between the two industries. In addition, the GBA government should optimize industrial-development ideas between cities and promote the integration of culture and tourism.
For cities with lower degrees of integration, we must first identify the problems and determine their reasons. The phenomenon of tourism-industry imbalance in cities in the Pearl River Delta region (“cultural lag” or “tourism lag”) indicates that the potential of the cultural or tourism industries has not been efficiently used. Therefore, for the lagging cultural industry, the city may not have enough influence on the factor supply, the industrial support, the product innovation, and the service design, failing to meet people’s tourism needs and to achieve deep integration with the tourism industry. The lag in the tourism industry may be due to deficiencies in the local tourism infrastructure, traffic conditions, destination image construction, and publicity, which lag the development of the cultural industry.
The local government should clarify the development concept, gain advanced experience, and realize the coordinated development of the two industries. Local governments should absorb experience from inter-regional comparisons, and cities with low degrees of integration should actively learn from the development paths and models of Guangzhou and Shenzhen in the tourism industry. They should explore the multiple integration paths of tourism-industry-value-chain reconstruction and cultivate diversified integration models. For example, from the perspective of innovative combinations of value modules, the deep integration path of animation, theater, performing arts, amusement, the creative design industries, and tourism needs to be explored.
At the regional level, the GBA government needs to improve industrial development and cooperation between cities. To accelerate the level of urban cultural tourism and improve industrial competitiveness in the GBA, cities need to explore the characteristics of their respective industries, clarify their industrial positioning, reduce the negative impact of industrial homogeneity, and build a coordinated development system for the tourism industry with a reasonable industrial division of labor, orderly coordination, fairness, and efficiency.
Second, it promotes factors such as economic development, government spending, urbanization, and technological innovation. From the perspective of the general economic environment, the increase in the per capita GDP reflects an improvement in the economic development level of the entire country, which means that relevant units or enterprises will incur more expenditures for infrastructure construction in both industries. For the integration of the two industries, the improvement in hardware facilities is essential to create a suitable environment and a basic material foundation for the integration of the tourism industry.
Government financial investment increases the orientation of the integrated development of the two industries, promotes the combination of urbanization and the construction of a modern economic system, and combines infrastructure construction with environmental protection to accelerate the flow of factors and improve the efficiency of resource allocation. The government establishes a coordinated and stable cooperative relationship with tourism-related enterprises, and it provides a strong guarantee for promoting the integration and innovation of the tourism industry through financial expenditures and policy support.

6. Limitations

This study has several limitations that need to be addressed in future studies. First, urbanization construction is conducive to adjusting the industrial structure, improving traffic conditions, and simultaneously bringing about human capital, which thus affect the development of the culture and tourism economy. Future studies could dispose of the “population urbanization” concept of achievement, appropriately control the population size, and pay special attention to the quality of life and welfare among urban residents. Second, from the perspective of technological innovation, cultural-tourism-related enterprises in the GBA can use modern scientific and technological means to digitize and virtualize cultural tourism resources, such as VR technology, to increase the immersive cultural experiences of tourists, meet high-level and diverse needs, and promote the deeper integration of the culture and tourism industries. Future studies could incorporate digital culture and tourism resources into mass communication systems to enhance the influence of regional cultural tourism to a certain extent.

Author Contributions

Methodology, X.C.; Supervision, J.H.; Writing—original draft, T.C.; Writing—review & editing, H.C. and L.L. All authors have read and agreed to the published version of the manuscript.

Funding

This research was funded by National Social Science Foundation of China (Grant number: 21&ZD179).

Conflicts of Interest

The authors declare no conflict of interest.

References

  1. Shin, Y. Residents’ perceptions of the impact of cultural tourism on urban development: The case of Gwangju, Korea. Asia Pac. J. Tour. Res. 2010, 15, 405–416. [Google Scholar] [CrossRef]
  2. Bhalla, R.; Chowdhary, N.; Ranjan, A. Spiritual tourism for psychotherapeutic healing post COVID-19. J. Travel Tour. Mark. 2021, 38, 769–781. [Google Scholar] [CrossRef]
  3. Shi, Z.; Xu, D.; Xu, L. Spatiotemporal characteristics and impact mechanism of high-quality development of cultural tourism in the Yangtze River Delta urban agglomeration. PLoS ONE 2021, 16, e0252842. [Google Scholar] [CrossRef] [PubMed]
  4. Loulanski, T.; Loulanski, V. The sustainable integration of cultural heritage and tourism: A meta-study. J. Sustain. Tour. 2011, 19, 837–862. [Google Scholar] [CrossRef]
  5. Zhou, C.B.; Sotiriadis, M. Exploring and Evaluating the Impact of ICTs on Tourism industry’ Convergence: Evidence from China. Sustainability 2021, 13, 11769. [Google Scholar] [CrossRef]
  6. Su, Z.; Aaron, J.R.; McDowell, W.C.; Lu, D.D. Sustainable Synergies between the Cultural and Tourism Industries: An Efficiency Evaluation Perspective. Sustainability 2019, 11, 6607. [Google Scholar] [CrossRef] [Green Version]
  7. Bröring, S.; Leker, J. Industry convergence and its implications for the front end of innovation: A problem of absorptive capacity. Creat. Innov. Manag. 2007, 16, 165–175. [Google Scholar] [CrossRef]
  8. Katz, M.L. Remarks on the economic implications of convergence. Ind. Corp. Chang. 1996, 5, 1079–1095. [Google Scholar] [CrossRef]
  9. Dong, F.; Li, Y.F.; Qin, C.; Sun, J.J. How industrial convergence affects regional green development efficiency: A spatial conditional process analysis. J. Environ. Manag. 2021, 300, 113738. [Google Scholar] [CrossRef] [PubMed]
  10. Throsby, D. Cultural capital. J. Cult. Econ. 1999, 23, 3–12. [Google Scholar] [CrossRef]
  11. Richards, G. Production and consumption of European cultural tourism. Ann. Tour. Res. 1996, 23, 261–283. [Google Scholar] [CrossRef]
  12. Richards, G. Tourism Trends: The Convergence of Culture and Tourism; Academy for Leisure NHTV University of Applied Sciences: Breda, The Netherlands, 2014. [Google Scholar]
  13. Zhang, H.; Gu, C.; Gu, L.; Zhang, Y. The evaluation of tourism destination competitiveness by TOPSIS & information entropy: A case in the Yangtze River Delta of China. Tour. Manag. 2011, 32, 443–451. [Google Scholar]
  14. Sun, J.F.; Li, S.T.; Ji, X.M.; Qing, W.S.; Wang, F.X. Coupling analysis and optimization measures of cultural resources endowment and tourism industry in Shandong. Econ. Geogr. 2019, 39, 207–215. (In Chinese) [Google Scholar]
  15. Liu, A.L.; Yang, C.Y.; Ming, Q.Z.; Zhang, H.M.; Lu, B.Y. Spatial-Temporal Coordination and driving forces of provincial cultural and tourism industry in China. Econ. Geogr. 2020, 40, 203–213. (In Chinese) [Google Scholar]
  16. Guan, D.; Gao, W.; Su, W.; Li, H.; Hokao, K. Modeling and dynamic assessment of urban economy–resource–environment system with a coupled system dynamics–geographic information system model. Ecol. Indic. 2011, 11, 1333–1344. [Google Scholar] [CrossRef]
Figure 1. Development level of the cultural industry.
Sustainability 14 06616 g001
Figure 2. Development levels of the tourism industry.
Sustainability 14 06616 g002
Figure 3. The convergence levels of the culture and tourism industries.
Sustainability 14 06616 g003
Table 1. Evaluation indicators for cultural tourism.
ItemsPrimary Indicators Secondary Indicators
Tourism IndustryOutputDomestic tourism generated total receipts
International tourism generated total receipts
Number of international tourists
International tourism income
InputNumber of luxury hotels
Number of over 4A-grade tourist attractions
Number of people employed in the travel sector
Cultural IndustryOutputTotal operating income of cultural market
Number of visitors to museums
Number of cultural performance spaces
Number of audiences of performing arts
InputTotal spending on culture
Number of individuals working for cultural industry
Number of mass cultural institutions
Table 2. Discriminating standards of the coupling coordination degree.
ClassesSubclassesTypes
Balanced development index0.8 < D ≤ 1
Superior
Superior coordination with culture lagged
Superior coordination with tourism and culture
Superior coordination with tourism lagged
0.7 < D ≤ 0.9
Moderate
Moderate coordination with culture lagged
Moderate coordination with tourism and culture
Moderate coordination with tourism lagged
0.6 < D ≤ 0.7
Primary
Primary coordination with culture lagged
Primary coordination with tourism and culture
Primary coordination with tourism lagged
Transitional development index0.5 < D ≤ 0.6
Barely
Barely coordination with culture hindered
Barely coordination with tourism and culture
Barely coordination with tourism hindered
0.4 < D ≤ 0.5
On the verge of disorder
On the verge of disorder with culture lagged
On the verge of disorder with tourism and culture
On the verge of disorder with tourism lagged
Unbalanced development index0.3 < D ≤ 0.4
Mild disorder
Mild disorder with culture hindered
Mild disorder with tourism and culture
Mild disorder with tourism hindered
0.1 < D ≤ 0.3
Moderate disorder
Moderate disorder with culture hindered
Moderate disorder with tourism and culture
Moderate disorder with tourism hindered
0 < D ≤ 0.1
Extreme disorder
Extreme disorder with culture hindered
Extreme disorder with tourism and culture
Extreme disorder with tourism hindered
Table 3. The convergence grades of the tourism industry.
2010201120122013201420152016201720182019
GuangzhouPrimary coordinationModerate coordinationModerate coordinationModerate coordinationModerate coordinationModerate coordinationModerate coordinationModerate coordinationModerate coordinationModerate coordination
DongguanMild disorderMild disorderMild disorderMild disorderMild disorderMild disorderMild disorderMild disorderOn the verge of disorderOn the verge of disorder
FoshanMild disorderMild disorderMild disorderOn the verge of disorderOn the verge of disorderOn the verge of disorderOn the verge of disorderOn the verge of disorderOn the verge of disorderOn the verge of disorder
HuizhouMild disorderMild disorderModerate disorderMild disorderMild disorderMild disorderMild disorderMild disorderMild disorderMild disorder
JiangmenModerate disorderMild disorderMild disorderMild disorderMild disorderMild disorderMild disorderMild disorderMild disorderOn the verge of disorder
ShenzhenBarely coordinationBarely coordinationPrimary coordinationPrimary coordinationPrimary coordinationPrimary coordinationPrimary coordinationPrimary coordinationModerate coordinationModerate coordination
ZhaoqingModerate disorderMild disorderModerate disorderModerate disorderModerate disorderModerate disorderMild disorderMild disorderMild disorderMild disorder
ZhongshanModerate disorderModerate disorderModerate disorderModerate disorderModerate disorderModerate disorderModerate disorderModerate disorderModerate disorderModerate disorder
ZhuhaiMild disorderModerate disorderMild disorderMild disorderMild disorderMild disorderMild disorderMild disorderMild disorderMild disorder
Table 4. The convergence types of the tourism industry.
2010201120122013201420152016201720182019
Guangzhouculture laggedculture laggedtourism laggedtourism laggedtourism laggedtourism laggedtourism laggedculture laggedtourism laggedtourism lagged
Dongguanculture laggedculture laggedculture laggedculture laggedculture laggedculture laggedculture laggedculture laggedculture laggedculture lagged
Foshantourism laggedtourism laggedtourism laggedtourism laggedtourism laggedtourism laggedtourism laggedtourism laggedtourism laggedtourism lagged
Huizhoutourism laggedculture laggedtourism laggedtourism laggedtourism laggedtourism laggedculture laggedculture laggedculture laggedculture lagged
Jiangmentourism laggedtourism laggedtourism laggedtourism laggedtourism laggedtourism laggedtourism laggedtourism laggedtourism laggedtourism lagged
Shenzhenculture laggedculture laggedculture laggedculture laggedculture laggedculture laggedculture laggedculture laggedculture laggedtourism lagged
Zhaoqingtourism laggedtourism laggedtourism laggedtourism laggedtourism laggedtourism laggedtourism laggedtourism laggedtourism laggedtourism lagged
Zhongshanculture laggedculture laggedculture laggedculture laggedculture laggedculture laggedculture laggedculture laggedculture laggedculture lagged
Zhuhaitourism laggedculture laggedtourism laggedtourism laggedculture laggedculture laggedculture laggedculture laggedculture laggedculture lagged
Table 5. The influencing factors of the tourism industry’s convergence.
ItemsCoef.St. Err.t-Valuep-Value[95% Conf.][Interval]Sig
Economic Development0.0820.0272.990.0030.0280.136**
Government Spending0.0980.0442.230.0260.0120.184*
Urbanization0.2450.0922.670.0070.0660.425**
Technological Innovation0.1640.0433.7900.0790.249***
Constant0.2040.0762.670.0080.0540.354**
*** p < 0.001, ** p < 0.01, * p < 0.05.
Publisher’s Note: MDPI stays neutral with regard to jurisdictional claims in published maps and institutional affiliations.

