1. Introduction
In 2006, Germany introduced a right of action for recognized environmental associations (environmental non-governmental organizations, ENGOs), by way of implementing the Aarhus Convention and Directive 2003/35/EC. This right of action, which was initially limited in its clout, was then successively expanded (as a result of rulings of the European Court of Justice) to a general right of action in environmental matters [
1] (p. 6), [
2]. The idea behind this (e.g., on the part of the European Commission) was to enable the associations to significantly contribute to improving the notoriously precarious application of (European) environmental law and to enhance environmental quality [
3,
4,
5]. However, whether the lawsuits indeed improve both, the application of environmental law and environmental quality have not yet been investigated.
Clean air policy is a case in point for the frequently deficient application of European environmental law [
6,
7]. The Ambient Air Quality Directive of 2008 contains concentration thresholds for several pollutants, of which particulate matter (PM10) and nitrogen dioxide (NO
2) are the most important. In 2018, Germany (as one of 13 Member States) was sued by the European Commission for non-compliance with the limit values for highly harmful NO
2 emissions. Although the provisions of the directive were translated into the Federal Immission Control Act (BImSchG), in 2018 actual NO
2 concentrations were still above the limit value in 57 major German cities [
8] (p. 24). Between 2011 and 2019, environmental non-governmental organizations filed 49 lawsuits before German administrative courts, challenging air quality plans for German cities as being inadequate. These 49 lawsuits represent “most likely cases” for the question of possible environmental effects in that the lawsuits in all cases decided by courts to date have been fully or substantially successful [
9].
The problematic enforcement of the Air Quality Directive has been the subject of a number of publications, but none has linked the aspect of real pollution reduction with the legal actions taken by ENGOs to challenge the local air quality plans. In this paper, we attempt to make this connection by being the first to address the question of whether ENGO lawsuits have a positive effect on air quality by reducing NO2 concentrations in German cities. The theoretical assumption is—in a nutshell—that the lawsuits should motivate political decision makers to—finally—adopt measures that have the potential to effectively improve air quality. This should be the case particularly because they want to avert driving bans for diesel cars that were looming as a consequence of court decisions. Those measures should improve air quality, even if not to the extent that the concentration limits can be complied with.
To answer this research question, we proceed as follows: In the next section, we briefly review the state of the research on the application of environmental law and air quality (
Section 2). Next, we describe our case in more detail: the Air Quality Directive and the lawsuits against air quality plans (
Section 3). In
Section 4, we develop our theoretical argument, which is mainly based on a rational choice perspective. We continue with a description of our data set and methodological approach that is based on a staggered difference-in-differences (DiD) design, given that we have variation in treatment timing. This is followed by the presentation of the results (
Section 6), which we subsequently discuss (
Section 7). The paper ends with a conclusion (
Section 8).
2. The State of Research
Improving the environmental condition or health protection through policies is far from trivial. It is politically difficult to adopt restrictive regulations, because there is often strong resistance from powerful addressees [
10]. Even the adoption of restrictive regulations does not guarantee that the environmental condition will improve or that health burdens will be reduced because environmental policy measures, in particular, are often not or not fully implemented. This deficient implementation of an ever-increasing number of environmental policies has been the subject of implementation research for decades. Accordingly, the design of the policies themselves, the resources and willingness of the administration as well as the (lack of) interest or even resistance on part of the addressees are the major factors determining (or undermining) effective application [
11,
12,
13]. Moreover, the process of implementation is usually inherently political and controversial [
14].
In EU member states, a major share of national environmental policies is based on European policies. Studies investigating the implementation of environmental policies in the European Union mainly focus on the transposition of directives into national law [
15,
16], which, however, is a necessary, but not a sufficient condition for the effective application of these policies on the ground [
6,
15]. Whereas a lot of research is interested in different aspects of implementation and compliance [
12] (p. 440), significantly fewer studies investigate the effects of the political measures on the quality of the environment, the so-called impact. For several environmental parameters studies conclude that political measures do have an effect in the intended direction [
17,
18]. For air quality, however, Knill et al. [
19] conclude in their study of 24 OECD countries between 1976 and 2003 that there is no robust relationship between the regulatory density and intensity of environmental policies and the air quality parameters for the pollutants CO
2, SO
2, and NO
x [
19] (p. 436). A recent study finds that, in 14 OECD countries between 1990 and 2014, command and control regulations “lead to a significant reduction in air pollutant emissions—but only when they are adequately executed and enforced” [
13,
20] (p. 227).
The implementation of the European Ambient Air Quality Directive adopted in 2008 has been examined for certain countries or municipalities, although all studies so far focus on the development of air quality plans rather than on compliance with the concentration limits (e.g., for the Netherlands Bondarouk and Liefferink [
21] and Bondarouk et al. [
22]). For Germany, an evaluation by the Federal Environment Agency (UBA) looks at air quality plans published between 2008 and 2012 and concludes that most of the examined German cities are still very far from complying with the concentration limits [
23] (p. 135). Gollata and Newig [
24] examine 137 air quality plans and find that the multi-level structure (i.e., the typical situation, where the federal government implements the European directive, but the states—in cooperation with the federal government—apply it) proves to be rather obstructive to goal achievement in clean air policy [
24] (p. 1323). Lenschow et al. [
25] analyze the application of the directive in 12 cities in Poland, the Netherlands, and Germany, asking to what extent appropriate territorial levels were involved in the implementation [
25] (p. 521). They conclude that “the German federal system tended to shift responsibility downwards without the necessary legal and financial backing” [
25] (p. 530).
In addition, there are a number of studies with a technical background assessing the effect of different kinds of low emission zones (LEZ) on air quality levels [
26,
27,
28,
29,
30]. For instance, Jiang et al. [
28] investigate the development of NO
2 concentrations in German cities between 2002 and 2012, i.e., before and after the introduction of LEZs in 2008. They find no or only a small reduction effect on NO
2 [
28] (pp. 3378–3379), which is not surprising since, at least in Germany, these early LEZs mainly aimed at reducing particulate matter emissions and did not specifically target the high NO
x-emitting diesel vehicles.
Green et al. [
29] even note for the case of London that the congestion charge introduced in 2003 has led to varied but substantial reductions in three traditional pollutants, yet “a more robust countervailing increase in harmful NO
2 likely reflecting the disproportionate share of diesel vehicles exempt from the congestion charge” [
29]. In Madrid, in contrast, considerable reductions in NO
2 pollution were achieved by implementing a tailored LEZ [
30].
The introduction of the right of environmental associations to file suits is the subject of a range of studies. Most publications on Germany focus on the legal success of the lawsuits [
1,
31], whereas Töller [
9] investigates the role of lawsuits in fostering driving bans (or the threat of driving bans) in German cities. Studies on other countries discuss, among other things, the role of lawsuits in the respective legal systems [
32] and analyze the role of lawsuits as a legal opportunity structure for the strategic orientation of environmental associations [
33].
The present paper thus fills an important research gap arising at the intersection of these discussions: the above-described debates on the determinants of air quality parameters, on the implementation of the Ambient Air Quality Directive, and on the right of environmental associations to file lawsuits have not yet been related to each other. This paper establishes this connection by investigating, for the first time, what effect the lawsuits of environmental associations have on the development of urban NO2 concentrations using the example of Germany.
4. Lawsuits and Their Effects from a Theoretical Point of View
If we assume that the lawsuits filed by ENGOs should result in more significant reductions in NO
2 concentrations than without the lawsuit, how can such an effect be theoretically conceived? What causal mechanisms might link the filing of a lawsuit to an improvement in air quality? While the expectation that the right of ENGOs to file lawsuits could contribute to improving the practical application of law in the EU is quite common in the literature [
2,
3] (p. 3), [
5], the causal mechanism by which this should occur and how this is to affect environmental quality have not been elaborated further.
Rational choice institutionalism seems a useful approach for understanding the effects of institutions on agency, policies, and outcome parameters [
42] (pp. 53–66). Looking at the NGOs’ right of legal action from this perspective, lawsuits appear as procedures that may change the ways in which political decision makers perceive their preferences and accordingly chose their strategies. Political decision makers have to weigh the costs of high NO
2 concentrations against the costs and benefits of measures to reduce them. How could lawsuits affect this calculation? Plausibly, the filing of a lawsuit against a city’s air quality plan would initially result in a broader public debate, both at the local and state level, on the problem of air quality, which until then was more a topic for expert circles. Thus, the problem cannot simply continue to be ignored. However, we can expect that in such a discussion, residents and local businesses affected by possible restrictions usually have a greater saying than those negatively affected by NO
2 concentrations, some of whom live in disadvantaged areas of the city and are often unaware of the negative impact of NO
2 on their health. As pointed out above, courts have from the outset ruled in favor of the environmental associations while signaling (albeit in varying degrees of concreteness) that diesel driving bans could be considered as ultima ratio. As a consequence, responsible administrations should be motivated to try to avert such driving bans. After all, driving bans would severely restrict citizens and the local business and lead to political resentment. Since in most states air quality plans are decided by state governments that ultimately depend on a parliamentary election, a loss of political confidence is feared. The political leaders therefore should be motivated by the lawsuits to adopt costly and unpopular alternative measures that would lead to a more effective reduction in NO
2 concentrations and thus make the imposition of driving bans unnecessary.
This motivation to decide on effective measures that are not driving bans is likely to grow over time with increasing levels of legal escalation (legal action, judgment, appeal, next-instance judgment, appeal for revision, and possibly even revision by the Federal Administrative Court) in the individual case. Albeit not each individual step would yield a quantifiable effect on air quality, all these measures over time can be assumed to have a negative effect on NO
x emissions in the respective urban area and on NO
2 concentrations, respectively (certainly, decreasing NO
x emissions does not necessarily translate in a linear way into lower NO
2 concentrations. Rather, there are intervening factors, such as the weather [
30] (p. 6)).
Thus, it seems plausible that the lawsuits can have a negative effect on NO2 concentrations, so that in the cities for which legal action is taken, NO2 levels should decrease stronger after a lawsuit was filed than before and, additionally, be stronger than in cities where no lawsuit was filed. Moreover, due to the abovementioned logic of escalation, we also assume a more pronounced effect over time; hence, we formulate the following two hypotheses:
Hypothesis 1 (H1): The filing of a lawsuit against a city’s air quality plan should have a negative effect on NO2 concentrations in that city.
Hypothesis 2 (H2): This negative effect of lawsuits on NO2 concentrations should increase over time, i.e., with the time that passes after the lawsuit was filed.
5. Materials and Methods
While the translation of the Air Quality Directive into national immission law came into force in January 2010, we set our investigation period from 2008 to 2019 (most recent available data when we conducted this research) in order to allow for a sufficient period of time prior to the filing of the first lawsuits in 2011, and thus to enable the consideration of a pre-treatment period for cases with early lawsuits as well. Moreover, 2019 is used as endpoint because the COVID-19 pandemic, which starts in early 2020, might have an impact on the results of the analysis.
To investigate whether the lawsuits have an effect on the NO
2 concentrations of German cities, we draw on data from the Federal Environment Agency’s (UBA) annual evaluation of nitrogen oxide pollution [
43], which includes the NO
2 monitoring stations operated by the states [
44] (p. 6). The monitoring grid includes industrial, background, and traffic stations in urban, suburban, and rural areas with measurements available for the years from 2001 to 2019. For the purpose of our study, in a first step, all stations measuring background or industrial pollution are sorted out, and only those measuring traffic pollution remained. Second, according to our research question, only the stations that exceeded the limit of 40 µg/m
3 at least once during the investigation period are considered. This meant to include only those cities where a lawsuit could potentially be filed. The population of our study can thus be described as cities with traffic monitoring stations where the NO
2 limit value was exceeded at least once between 2008 and 2019.
Finally, we have to deal with problems of an unbalanced panel, which can be problematic for the DiD design we use in this study (an important issue for the validity of a DiD design is that the differences between the control and treatment groups are stable over time [
45]. However, as the composition of the two groups changes across time due to missing data, this could bias the estimated results. This is rather unproblematic if the missing values are randomly distributed, which is not necessarily the case in our study). A special characteristic of the UBA’s annual NO
2 measurement is that new monitoring stations are frequently set up in cities, whereas measurements at old stations are discontinued. The number of available monitoring stations therefore varies from year to year, and not all measurement series are complete during our investigation period. To handle this problem, stations for which no complete measurement series were available during the investigation period are sorted out.
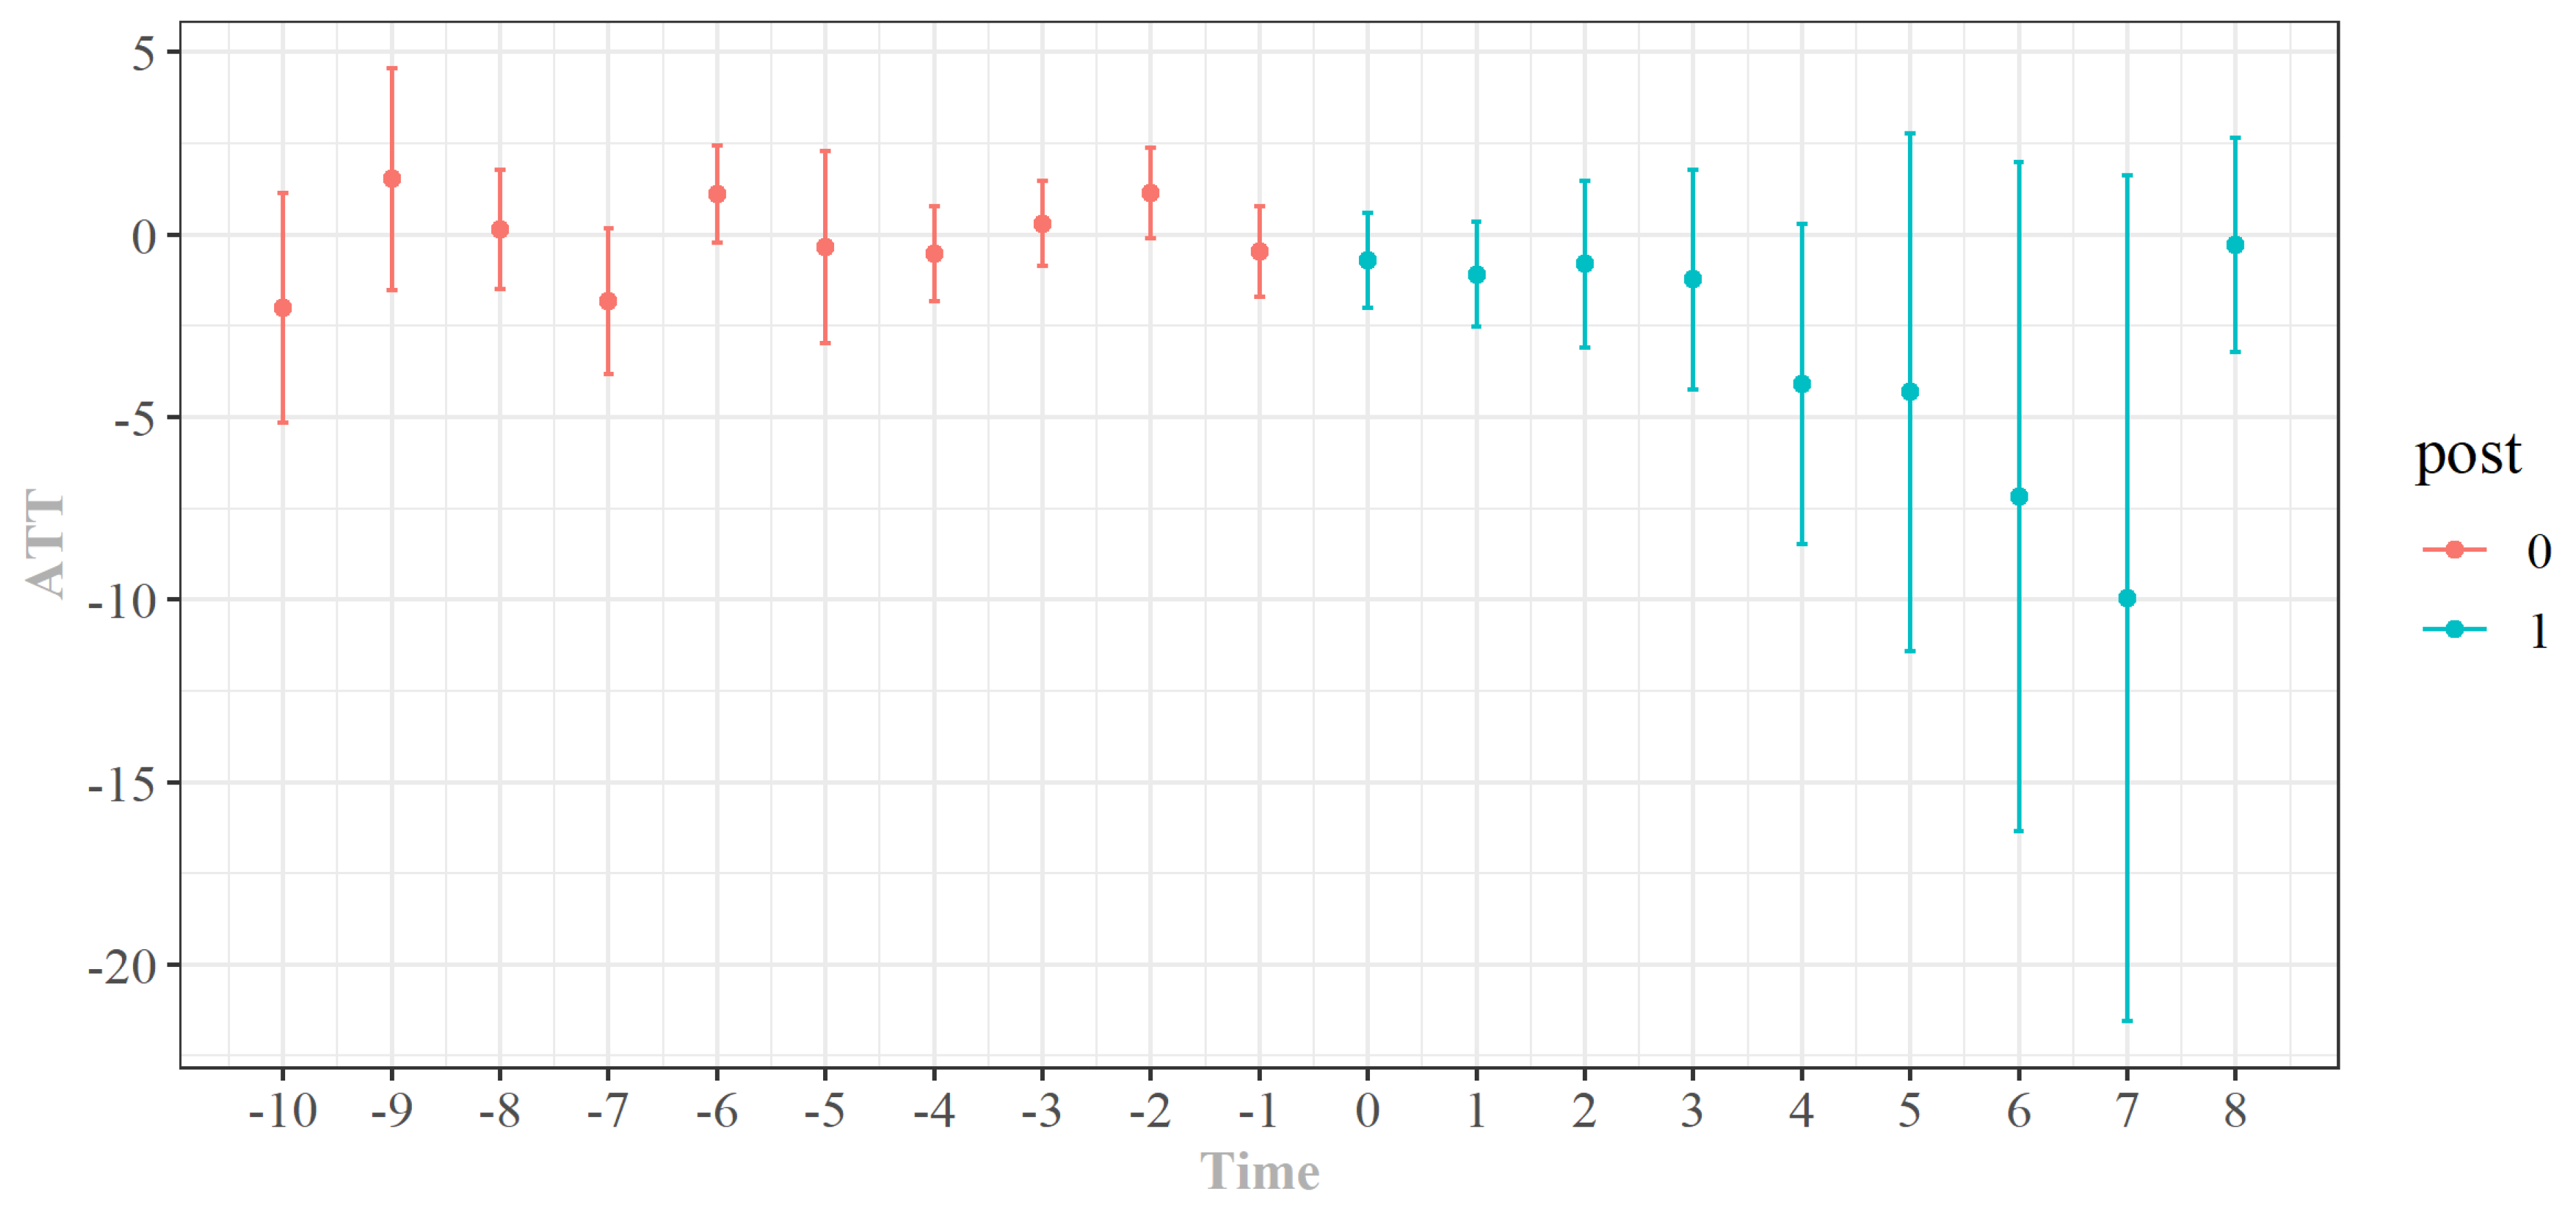
Thus, our sample includes complete measurement series from 91 stations in 59 cities. From those 59 cities, 34 cities were never sued during the investigation period (non-treatment group), whereas in 25 cities, a lawsuit was filed at least at some point (treatment group). Furthermore, to overcome the problem that different stations located in the same city may correlate through their shared location, the values measured at stations within the same city are aggregated to a mean for that city. Our sample thus arrives at 59 cases, with annual measurements from 2008 to 2019 for every single case, resulting in a total of 708 observations in the sample (in addition, we run our model with a non-aggregated sample, i.e., we treat each station as a separate observation, using clustered standard errors at the city level. The results are similar to those for the aggregated sample and can be found in the
Appendix A, see
Figure A1 and
Table A1).
Causally attributing policy measures and results in the real world is equally important and methodologically demanding [
46] (pp. 37–47). As a result, there are different approaches to identify causal effects of policy “treatments”. Quasi-experimental approaches in particular have become increasingly popular in recent years. A simple, but effective method for calculating the effects of (policy) measures are DiD regression models. While they are common in the field of political economy [
47,
48], they are also used in the context of air pollution measures [
29,
30]. In its simplest format, there are two groups and two time periods: a treated group (experimental group) and an untreated group (control group) [
49] (p. 200). If, in the absence of treatment, the average outcomes of both groups follow parallel trends over time (parallel trend assumption), it is possible to calculate the average treatment effect (ATT) for the experimental group by comparing the average change in outcomes in the treated group with the average change in outcomes in the control group [
49] (p. 200).
As already mentioned, our dataset contains monitoring stations in all German cities that have not complied with the limit value of 40 µg/m
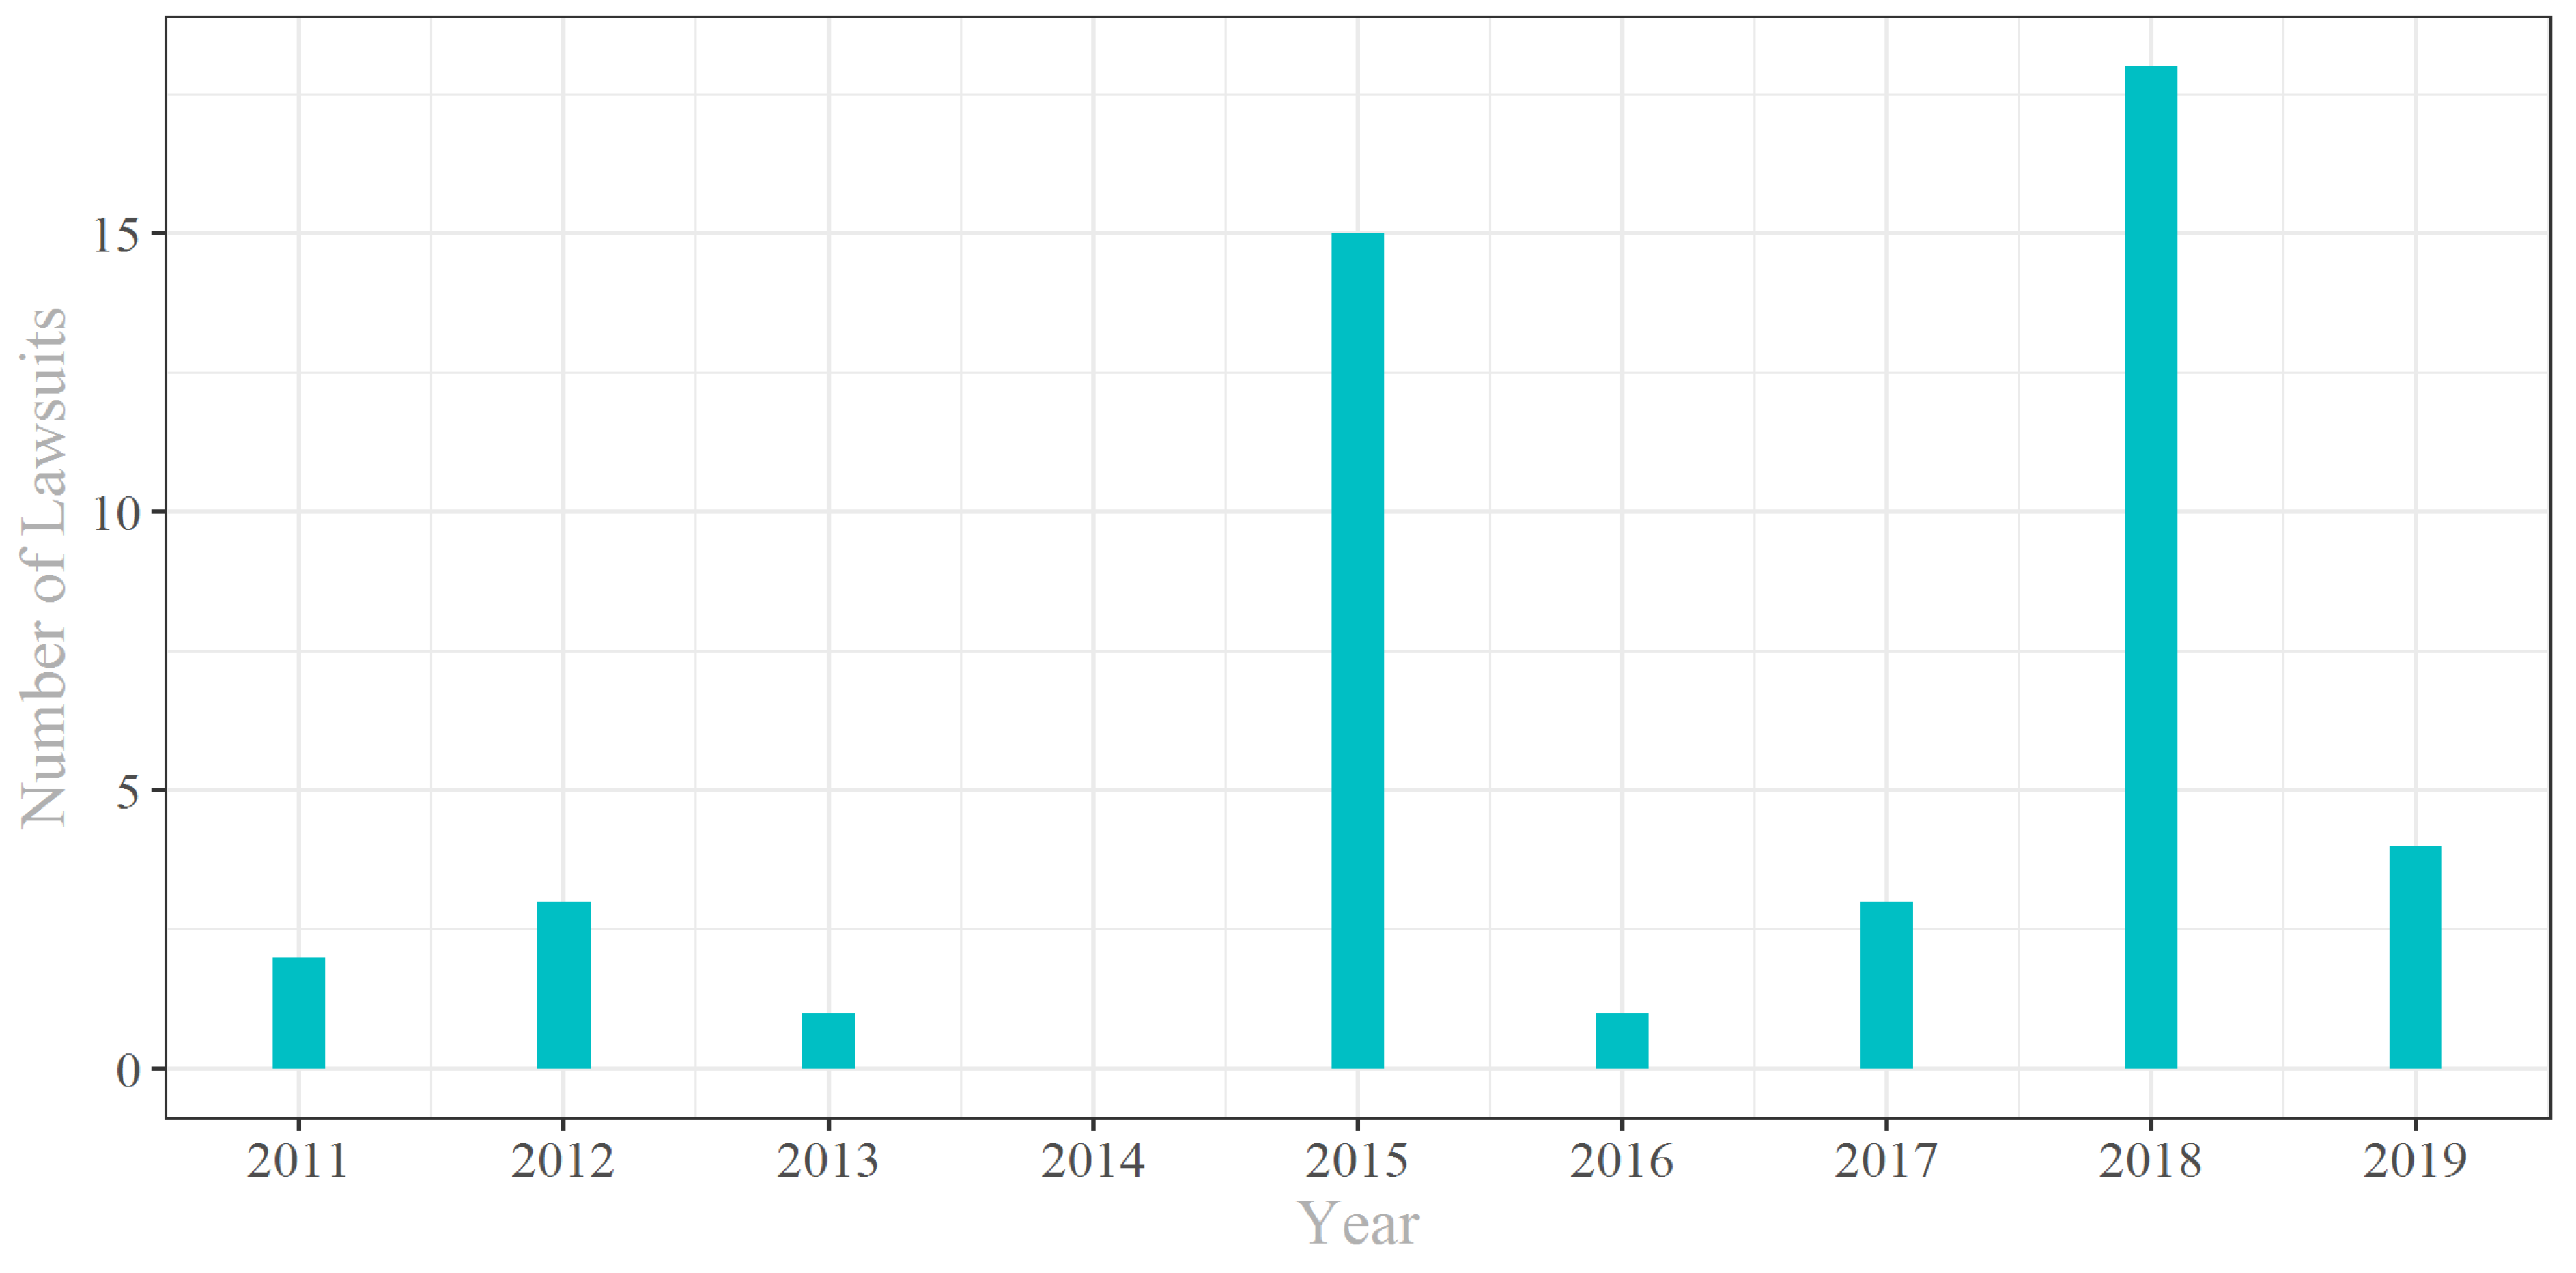
3 in annual average for at least one time during the investigation period. While lawsuits were filed against some of these cities, there were no lawsuits in others. Thus, with a treated group (cities with lawsuits) and a non-treated group (cities without lawsuits) we have a good setting for a DiD regression. However, unlike the simple DiD setting, there is variation in treatment timing in our study due to the lawsuits being filed in different cities at different times (see
Figure 1). To date, it is common to use a two-way fixed effects regression model (TWFE) for analysis of groups with varying treatment timings. However, several recent studies indicate that the use of a TWFE in a staggered DiD, especially in the presence of effect heterogeneity, may cause problems that affect the estimation [
49,
50,
51]. Although this does not have to result in complete design failure, some caution is needed when using a TWFE estimator to summarize treatment effects [
51] (p. 255). Therefore, we rely on the model of Callaway and Sant’Anna [
49]. Their approach not only allows us to estimate a treatment effect in the presence of effect heterogeneity and dynamic effects, but also proposes several ways to aggregate the ATT to answer different research questions. Especially for our study, which includes a rather small number of cases, it seems appropriate to use and interpret the aggregated ATTs, as they are more robust than the simple ATTs.
However, as with other DiD models, some basic assumptions must be made for the Callaway and Sant’Anna approach [
49] (pp. 202–207). First, no unit is treated at the beginning of the observation period, and if a unit is treated, it remains treated until the end of the observation period. Second, there should be limited treatment anticipation, which is “likely to be the case when the treatment path is not a priori known and/or when units are not the ones who “choose” treatment status” [
49] (p. 204). Third, the assumption of a parallel trend must hold at least under specific conditions. For our study, we assume that it holds even unconditionally. However, we may face the problem of non-random treatment in our study. This means that cities are not sued randomly but on certain characteristics. Although all cities in our data set exceeded the 40 µg/m
3 limit at least once and are therefore at risk of getting sued, it is not clear on what basis ENGOs like the DHU decide to sue cities. However, it does not seem far-fetched that cities with high NO
2 concentrations have a higher probability of being sued than cities with lower NO
2 concentrations. This assumption is supported by the fact that the cities sued have on average a significantly higher NO
2 concentration (see
Figure 2). Fredrikson and de Oliveira [
52] (p. 525) capture this problem by claiming: “with a non-random assignment to treatment, there is always the concern that the treatment states would have followed a different trend than the control states, even absent the reform”. To address this issue, Frederikson and de Oliveira [
52] propose to control for factors that lead to differences in time trends between groups. Normally this could be done by including control variables or by doing a matching procedure [
52]. However, since in our case we assume that cities being sued mainly because of their NO
2 concentrations, including control variables seems not purposeful. Nevertheless, the fact that we have a variation in treatment timing allows us some sort of “matching” by using only treated cities and taking the “all not-yet-treated” cities as the control group [
53]. Assuming that cities are sued because of specific characteristics (mainly the NO
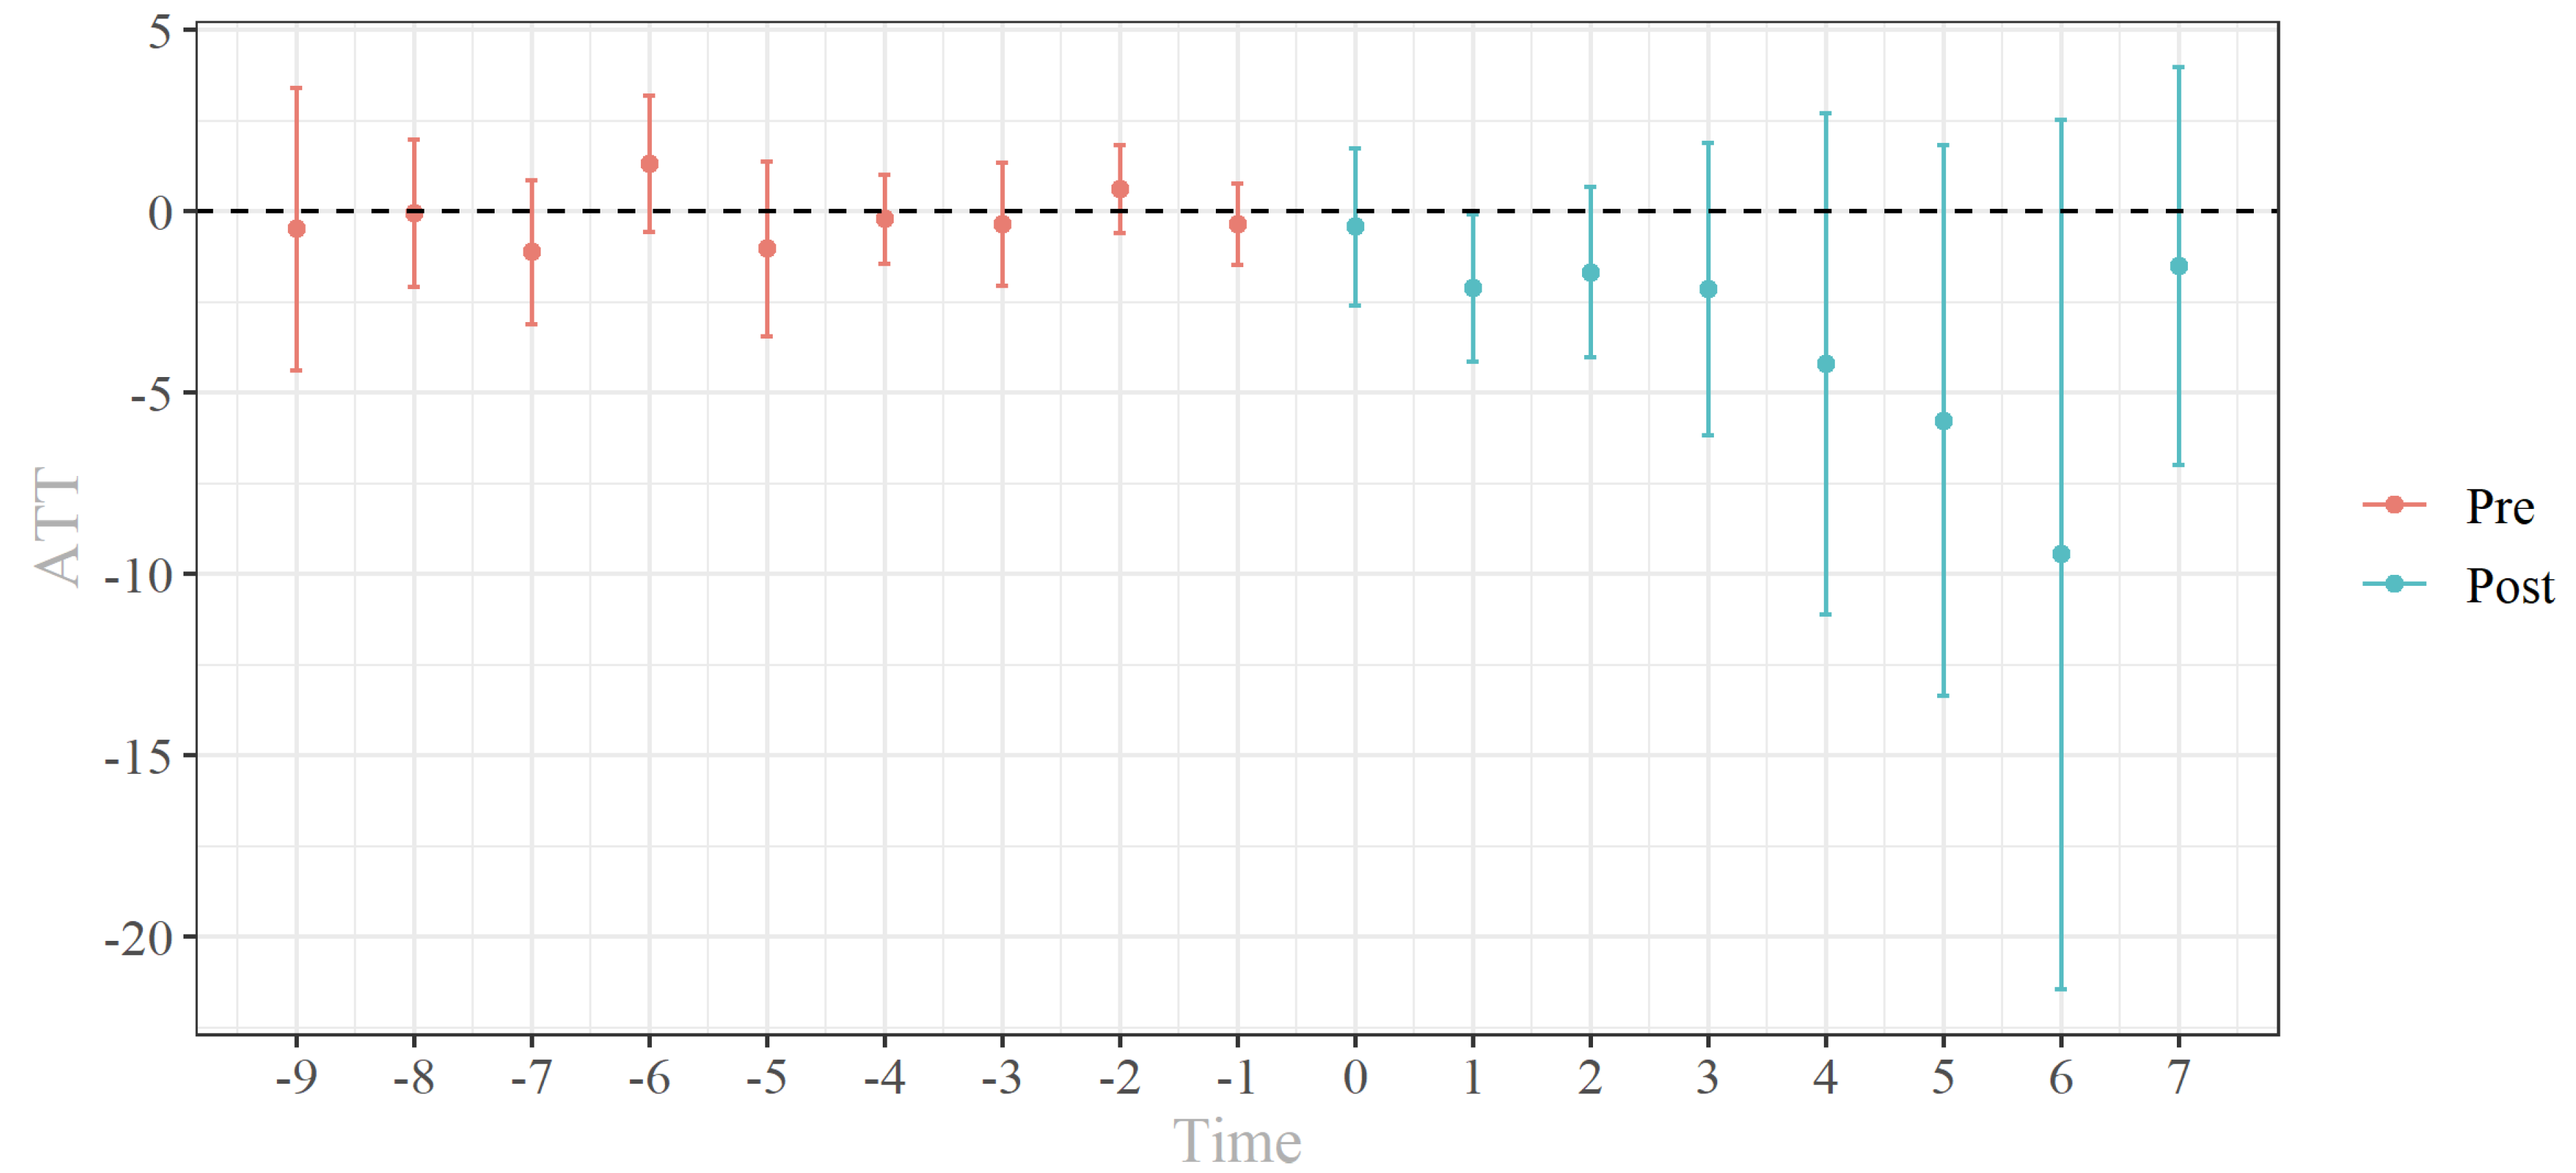
2 concentration), the not-yet-treated cities seem to be a good control group since they should share the same characteristics as the already treated cities. To test for the effects of potential non-random treatment, we conduct our analysis once with the entire sample and once with the subsample of cities sued (the results for the subsample can be found in the
Appendix A, see
Figure A2 and
Table A2).
6. Results
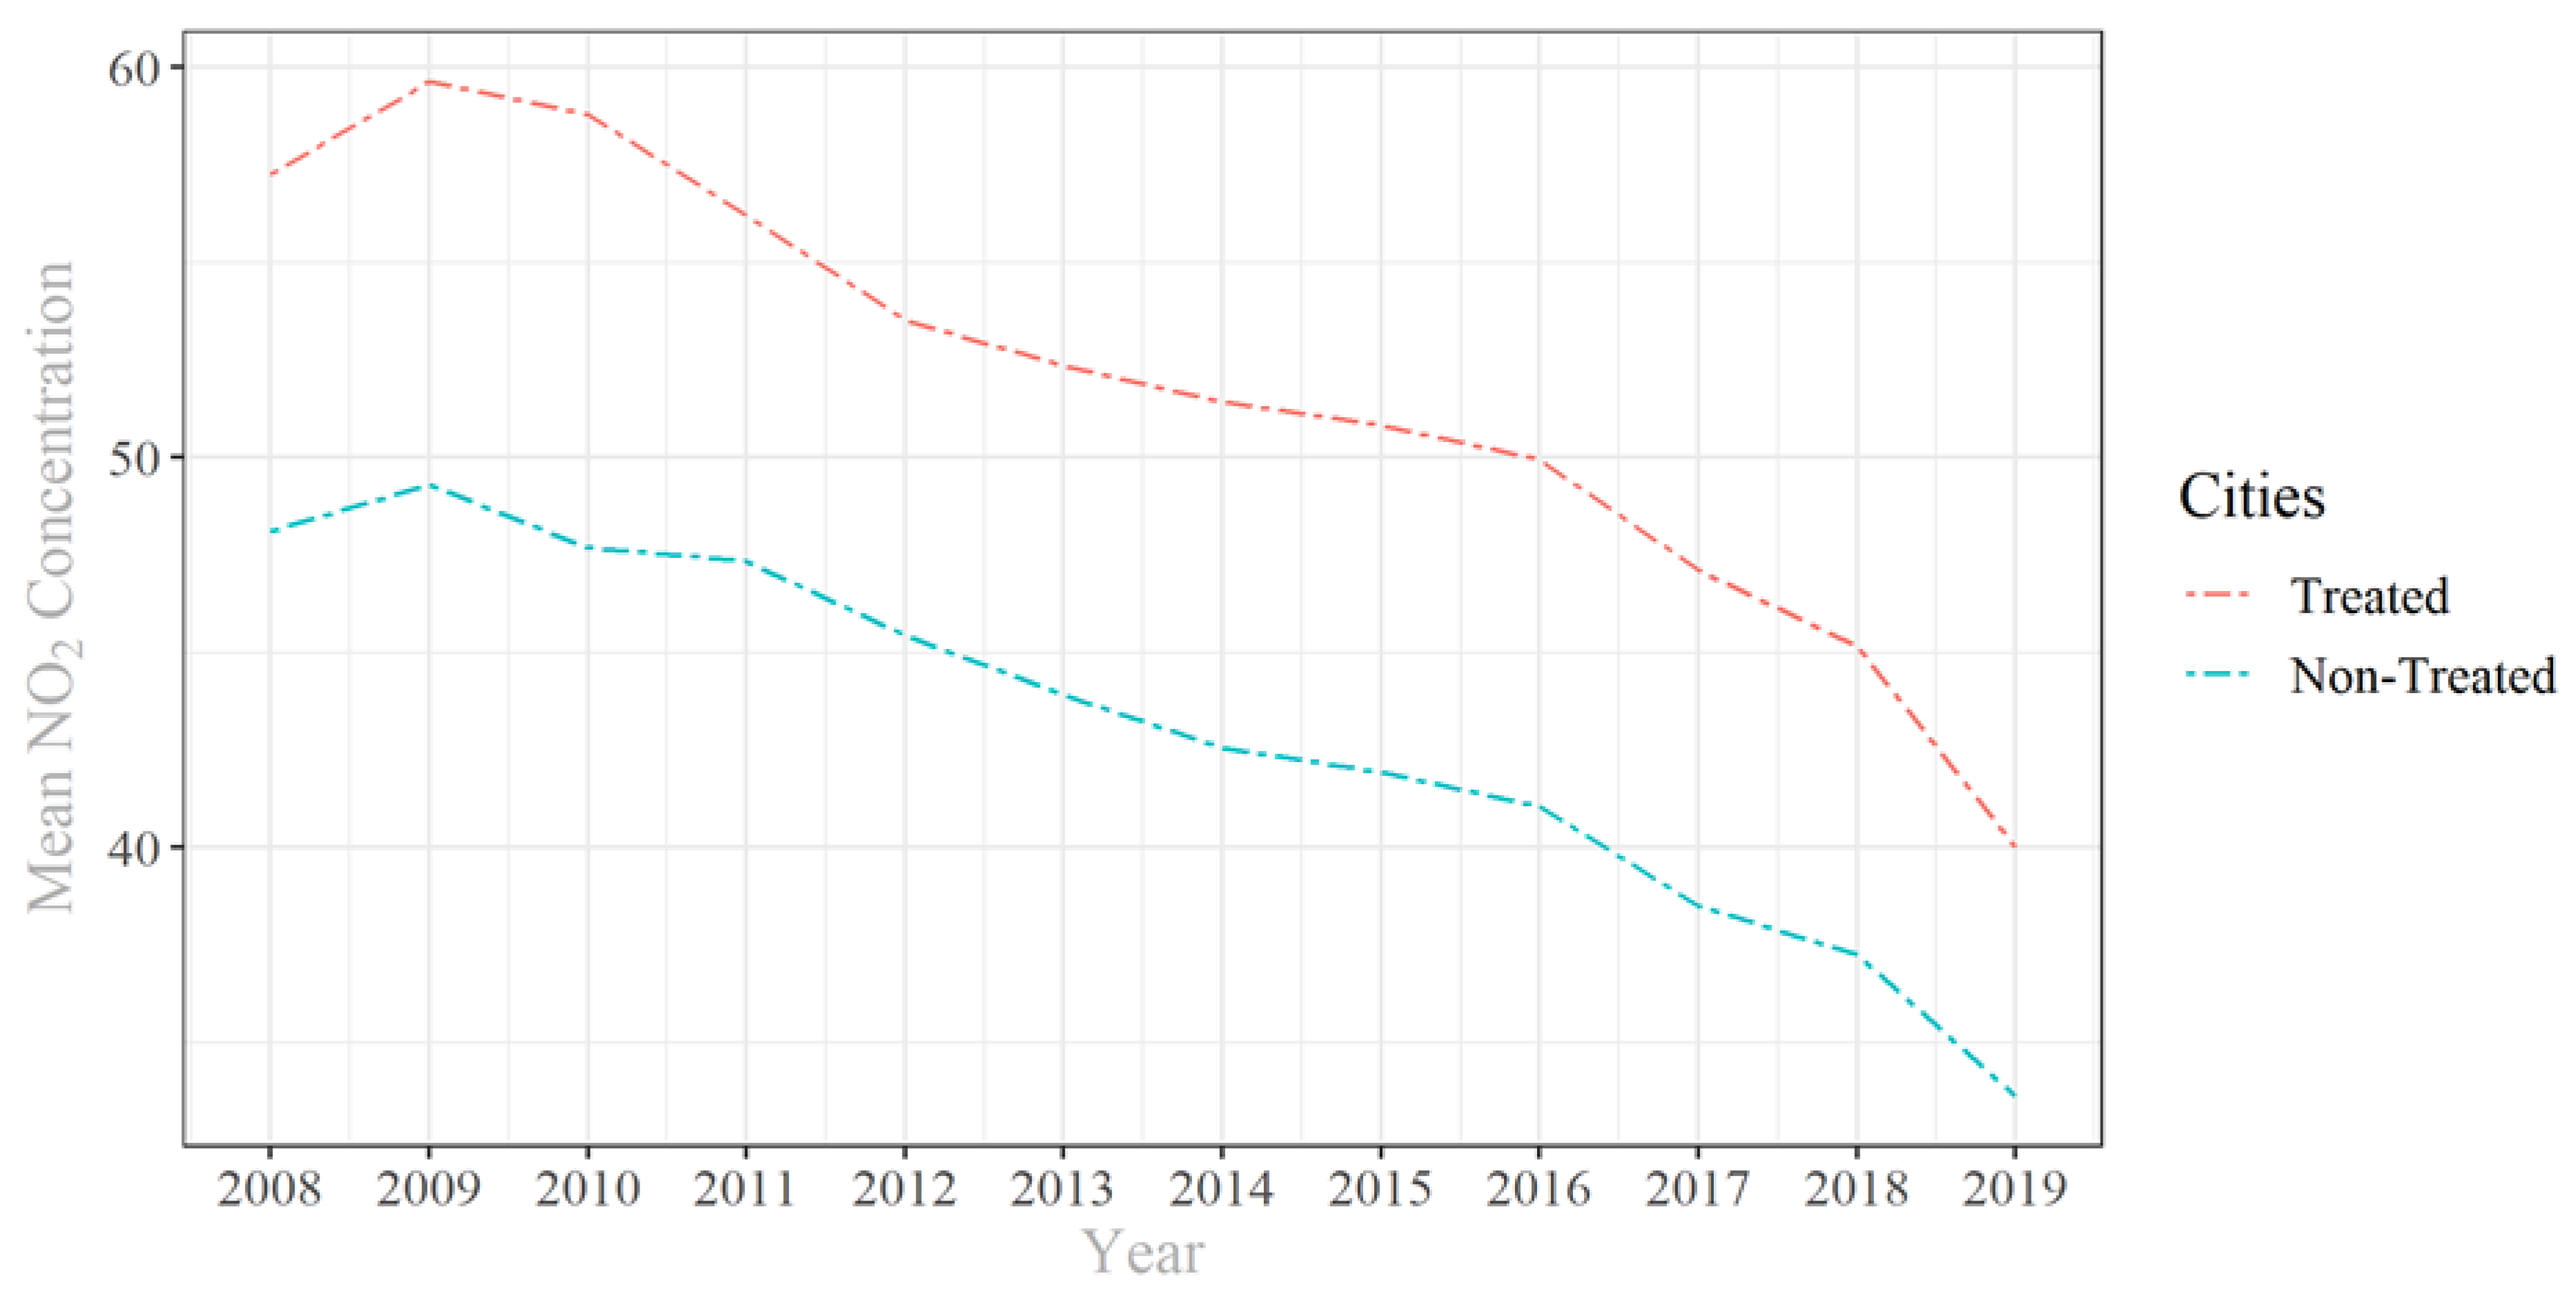
Figure 2 shows the mean NO
2 concentration in µg/m
3 from 2008 to 2019 for cities with a lawsuit against their air quality plan (treated group) and cities without a lawsuit against their air quality plan (not treated group). While treated cities have higher NO
2 concentration compared to untreated cities, the figure shows that NO
2 concentration follows a similar trend of decreasing values for both groups. This is true for the period before the first lawsuit in 2011, but also for the following years. For a simple DiD setting, (i.e., there is only one treatment time point) this would support the argument for maintaining the parallel trend assumption but against a significant effect of treatment. This is the case because the parallel trend is still intact until the end of the observation period, but for a substantial effect, we would expect the sued cities to reduce their NO
2 concentration to a greater extent than the non-sued cities. However, for our setting the interpretation is much more complex, since we have different treatment points (2011, 2012, 2015, 2017, 2018, and 2019). The variation of treatment timing causes different pre- and post-treatment periods. For example, cities that were sued in 2011 have a pre-treatment period of three years (2008, 2009, and 2010) and a post-treatment period of eight years (2012 to 2019). Cities sued in 2018, on the other hand, have a 10-year pre-treatment period but only one post-treatment year. Therefore,
Figure 2 gives us an idea of the overall trend in urban NO
2 concentrations but cannot be used to assess the parallel trend assumption or the effect of treatment.
Figure 2.
Mean NO2 concentration in cities with and without lawsuit, 2008–2019.
Figure 2.
Mean NO2 concentration in cities with and without lawsuit, 2008–2019.
Thus, as described in
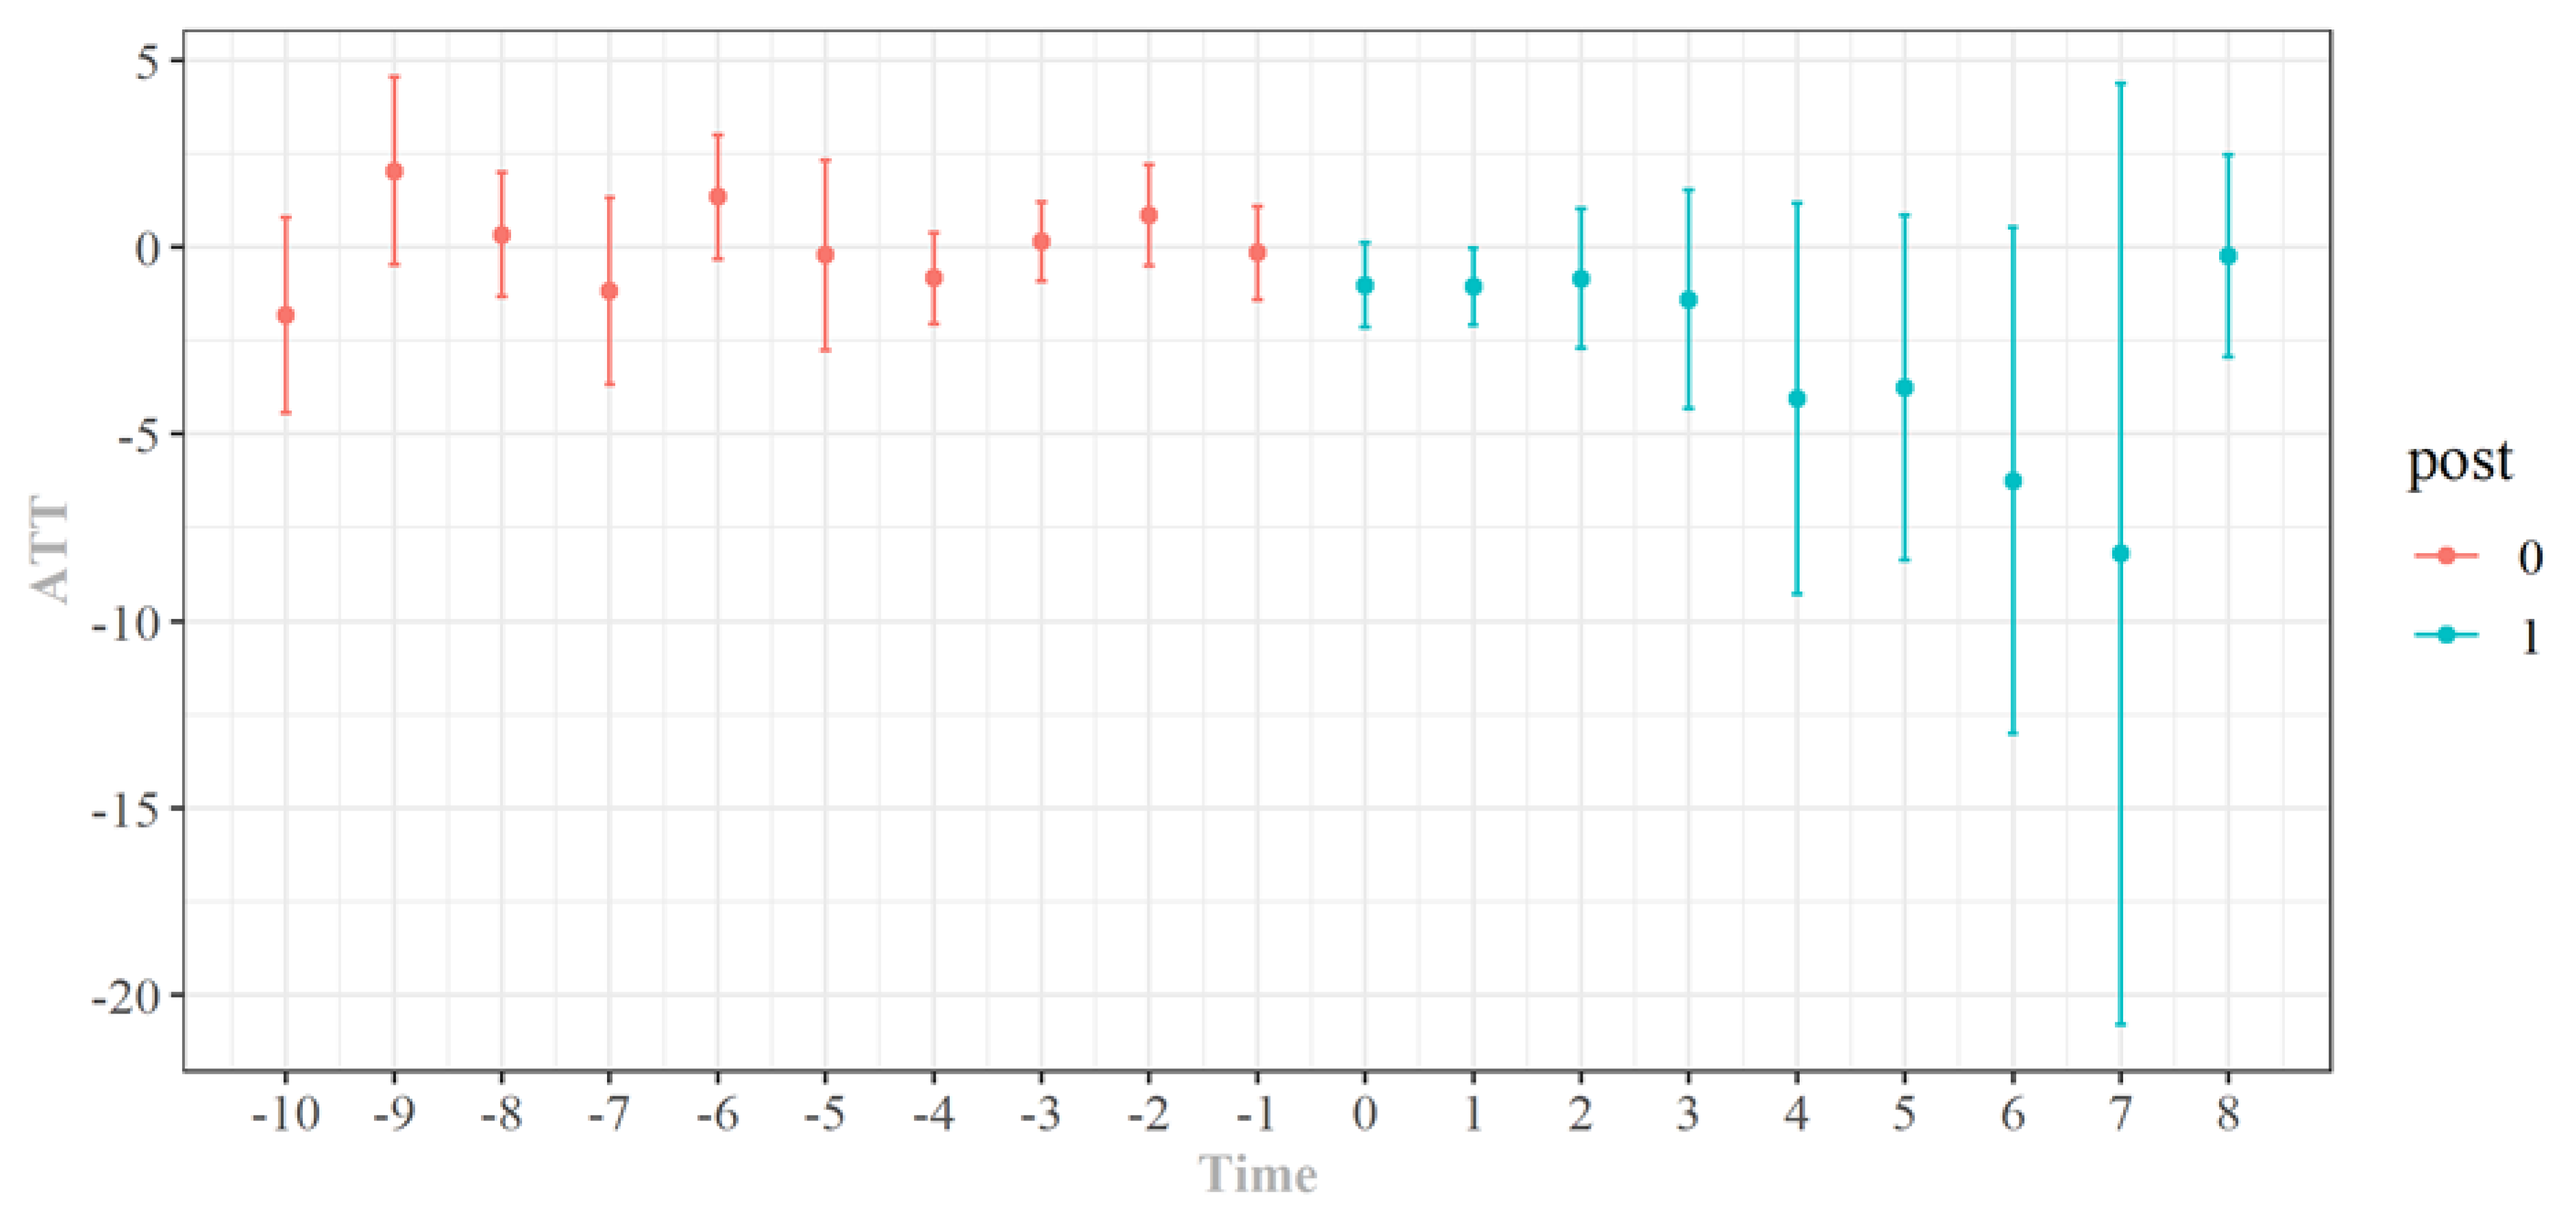
Section 5, we must use a staggered difference-in-differences design that allows us to test the assumption of a parallel trend and to calculate the effect of treatment even for different treatment time points. The most common way to do this is to use an event study plot (see
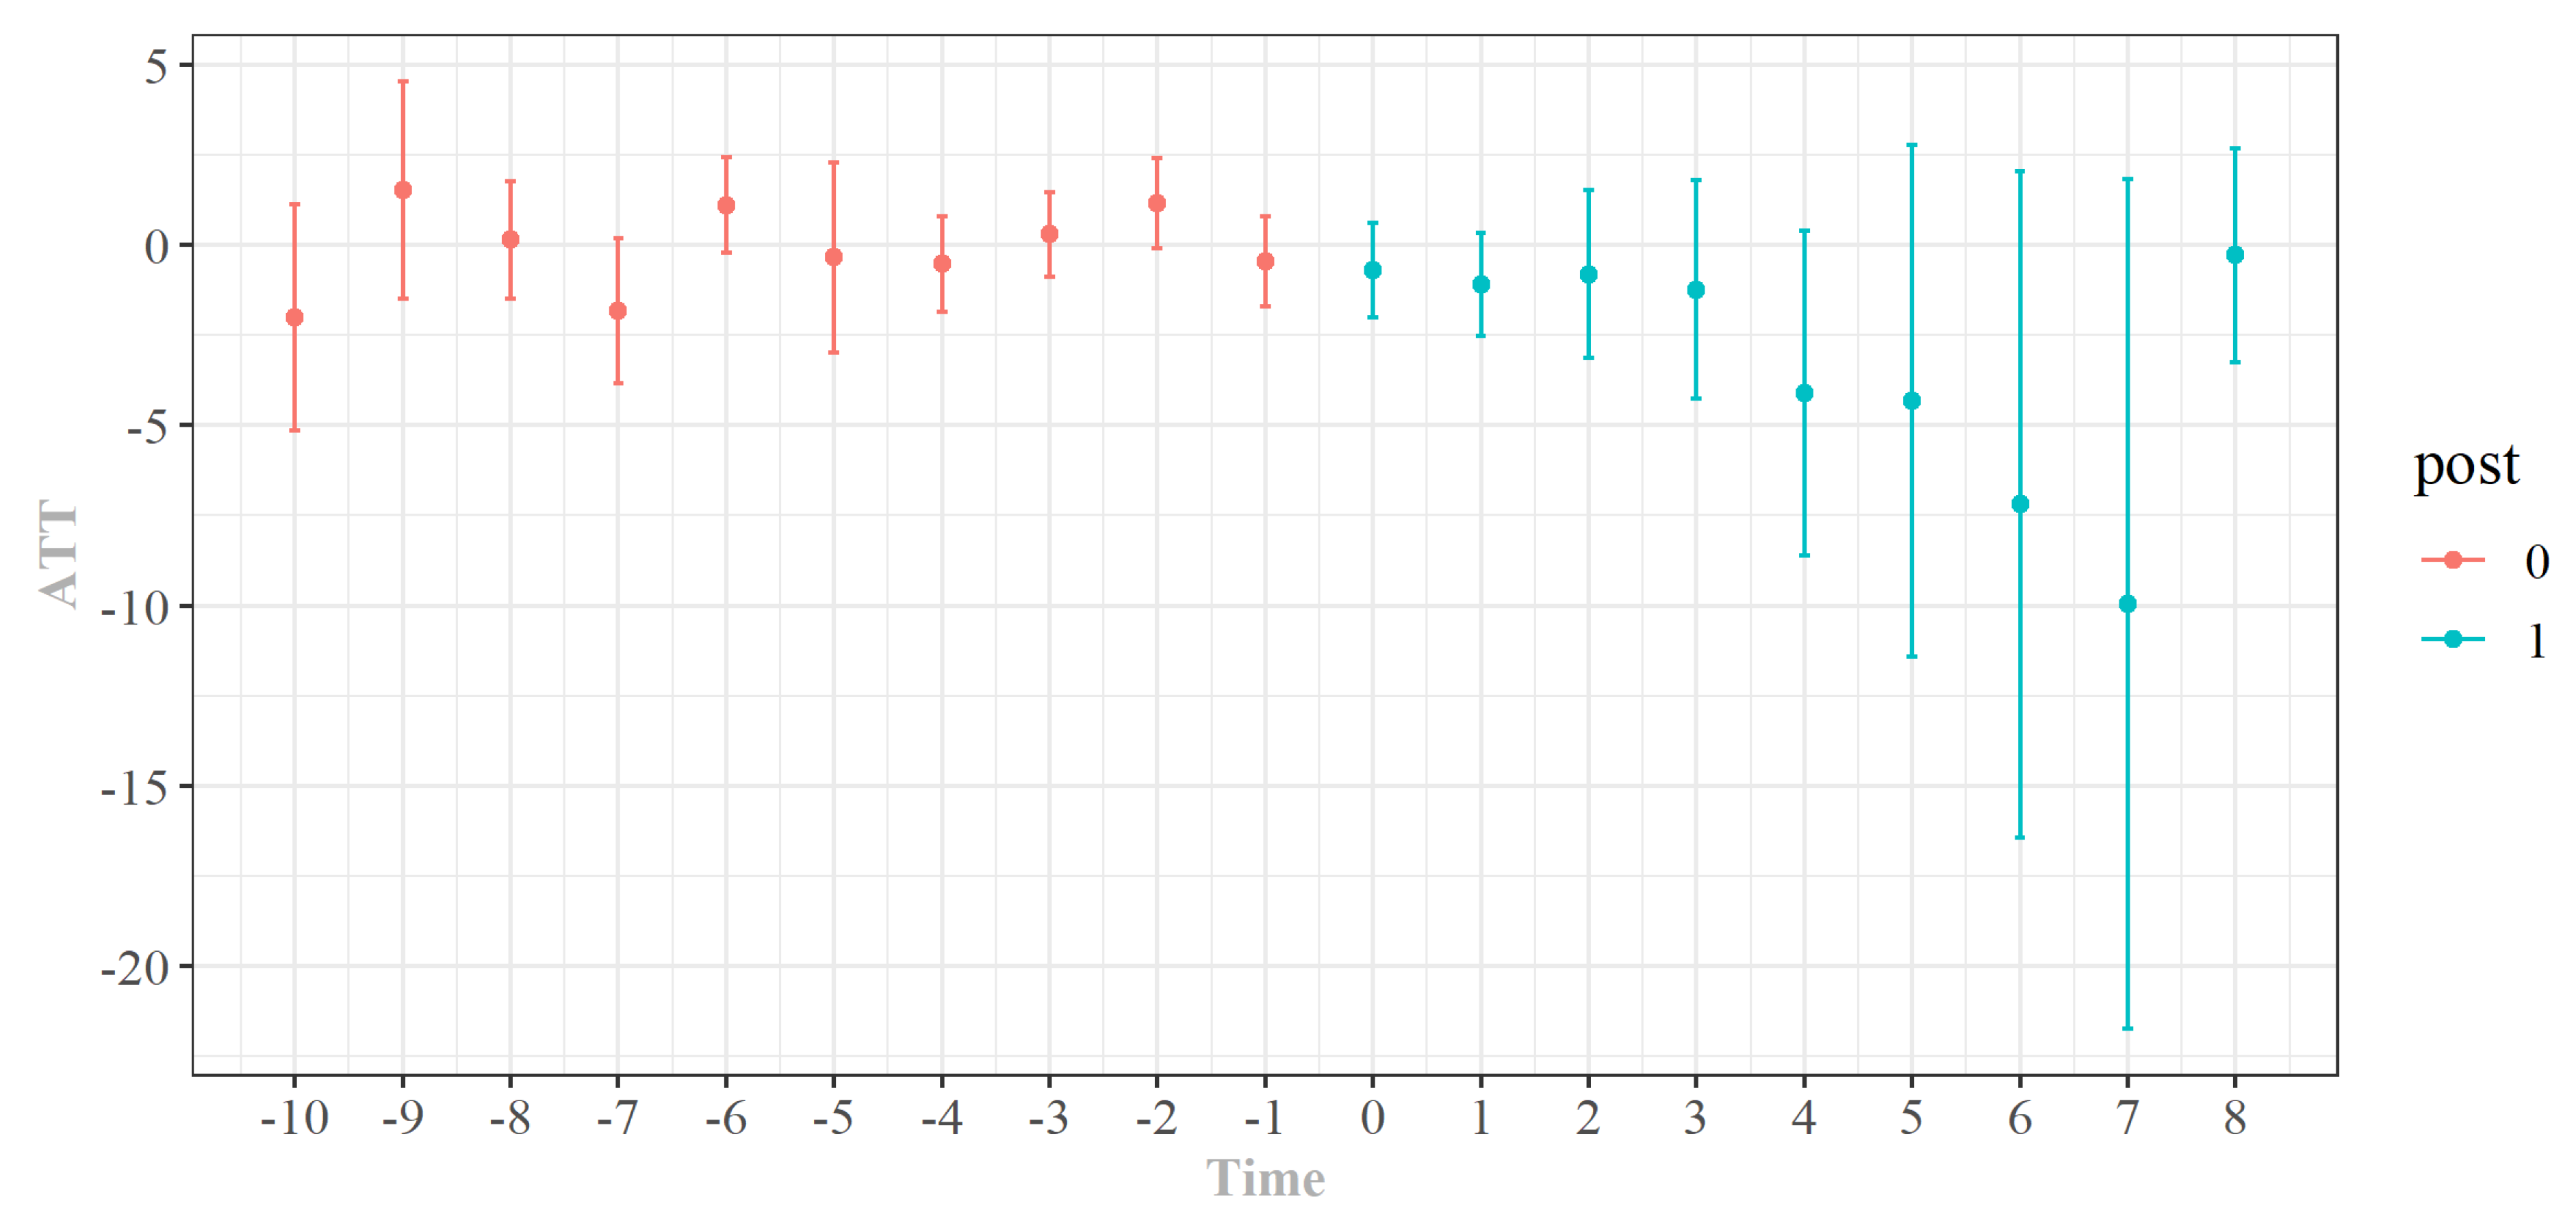
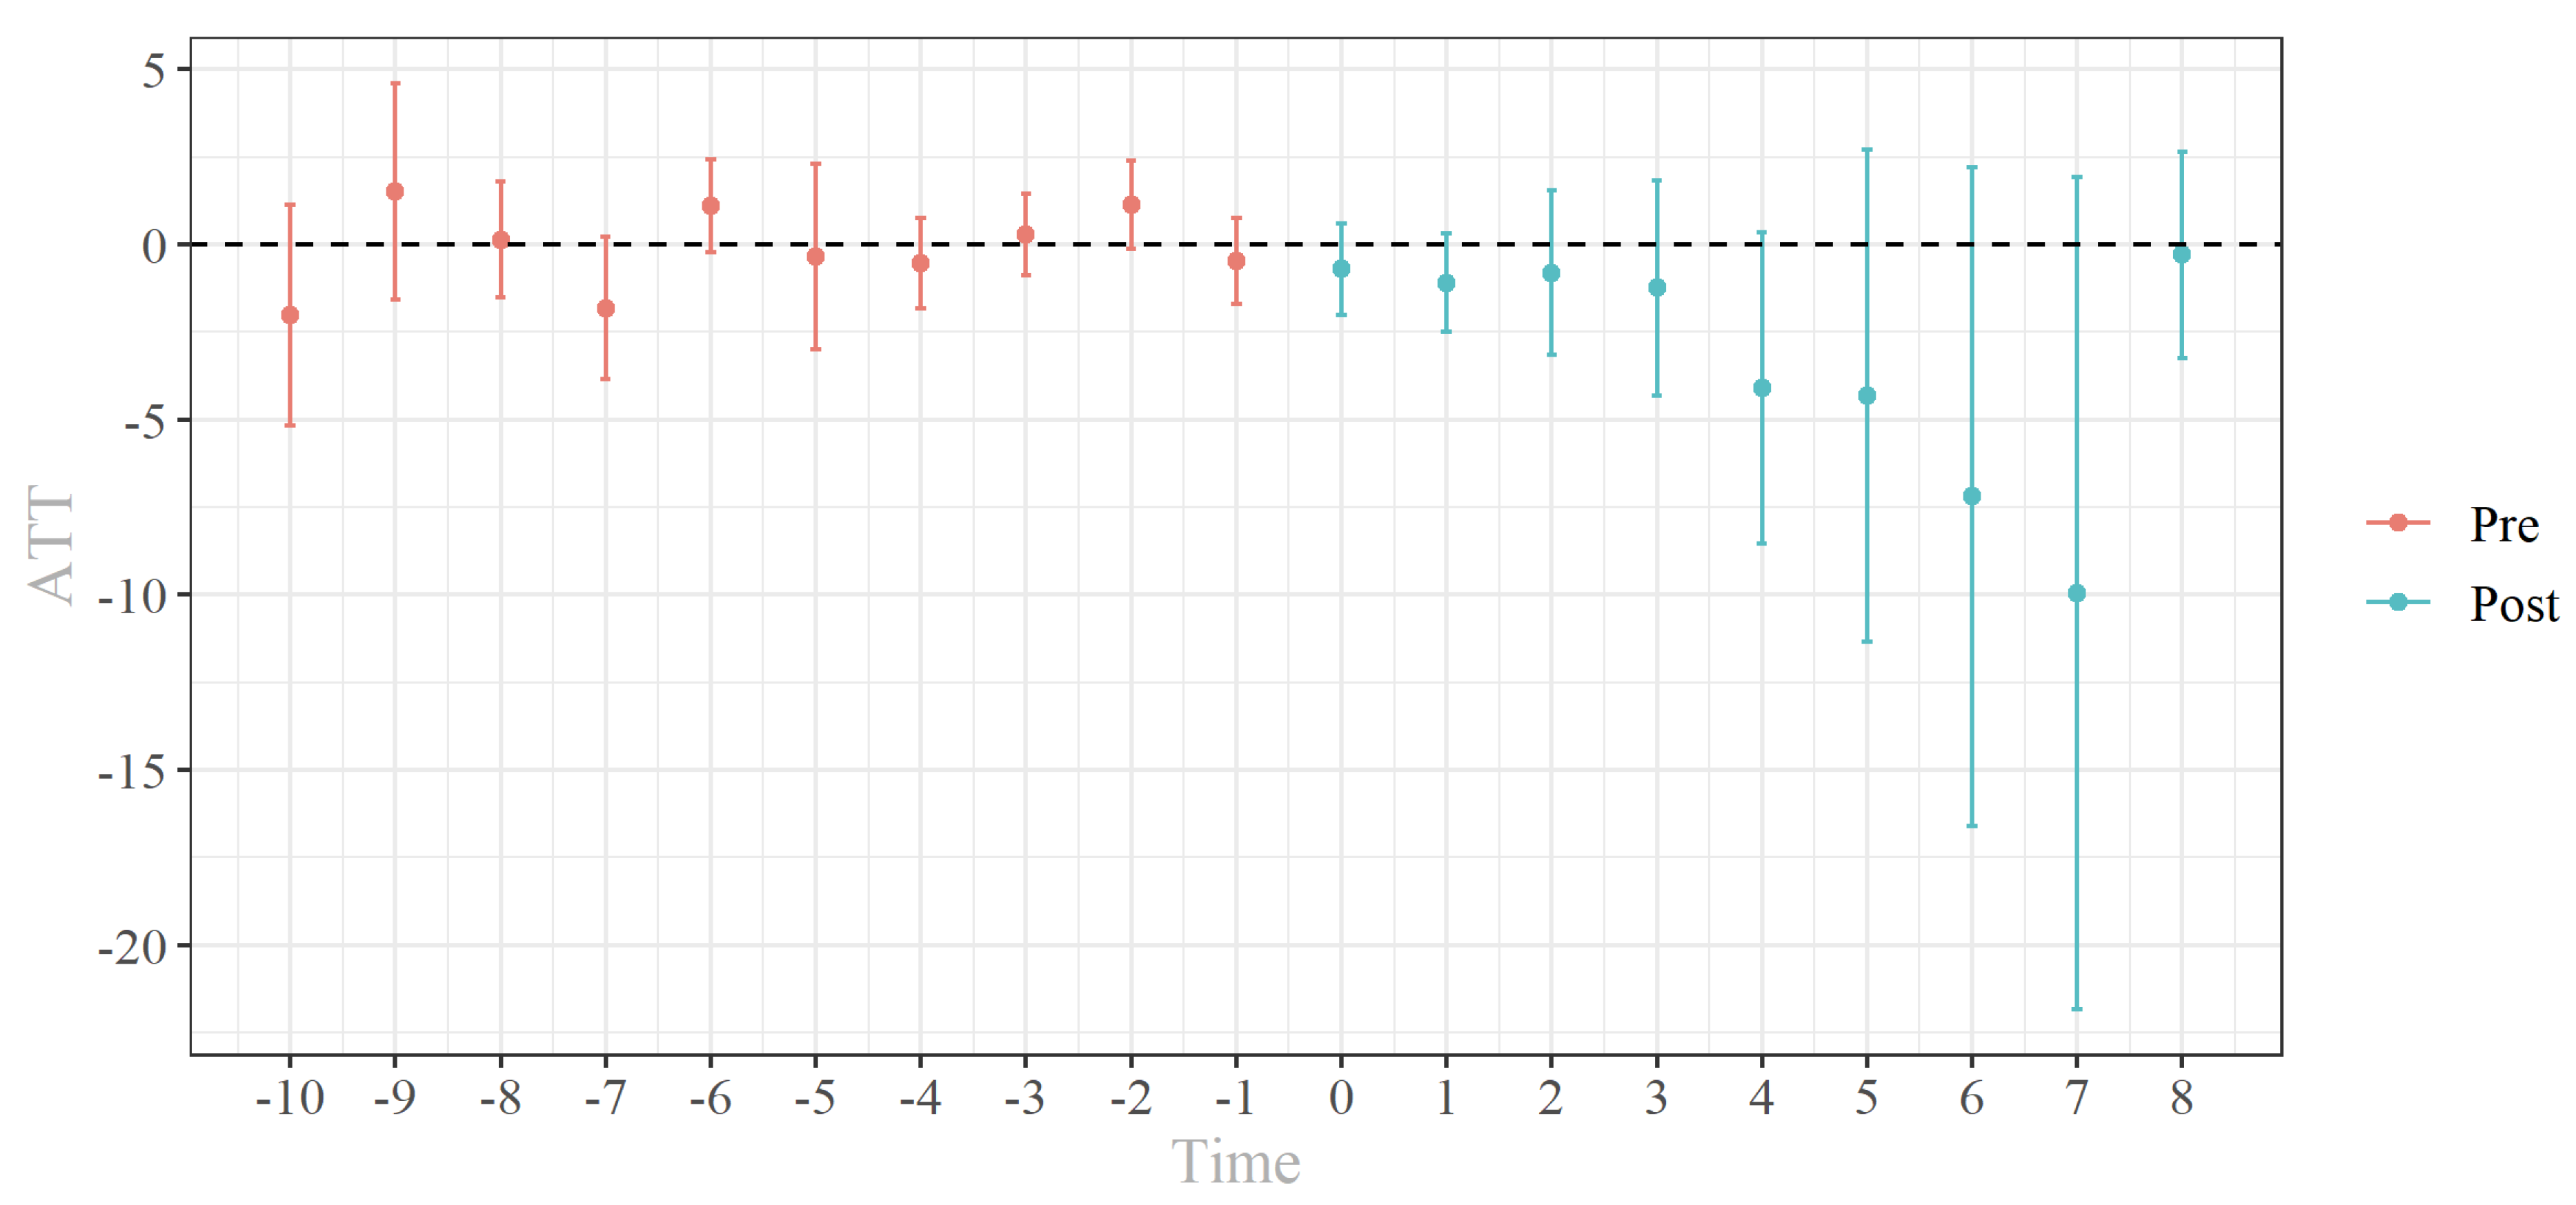
Figure 3). The plot shows pre-treatment estimates that can be used as an indication about the parallel trend assumption as well as estimated post-treatment effects [
49] (p. 218). The
x-axis of the event study plot shows the years before and after treatment. In our case, the longest pre-treatment period is 10 years since our investigation starts in 2008, and 2019 is the last year in which cities are sued. The longest post-treatment period is 8 years since the first cities were sued in 2011 and the study period goes to 2019. The
y-axis shows the partially aggregated effects of the treatment for both the pre- (red) and post-treatment period (blue) (The exact values are also shown in
Table 1, line 2) In the pre-treatment period, we logically expect no effect of treatment, as there should be no significant difference between treated and non-treated cities. If this is the case, we can assume that the parallel trend assumption holds. A look at the pre-treatment period in
Figure 3 shows that there is indeed no significant effect, which suggests that the parallel trend assumption holds for our case.
Regarding the post-treatment time, the plot indicates that the effect size becomes larger over time. However, we could not find a significant effect for the individual periods of the post-treatment period. The reason is that the group size varies and becomes smaller as more time passes, which is particularly problematic when the total number of observations is rather small, as is the case in our study [
49] (p. 210). While at time zero we count every city that was sued, and at time seven we only count cities that were treated before 2013, as we can only observe the treatment effect after seven years for cities that were sued in 2011 and 2012. As
Figure 1 shows, we have a large group of cities that were sued in 2015 and 2018. If we assume that the effect of being sued does not materialize immediately but rather requires a few years to take effect, this, in combination with the small number of observations, could explain why we do not find significant effects in the event study for the post-treatment periods.
As Callaway and Sant’Anna [
49] point out, it seems more appropriate in such a setting to aggregate ATT into an overall effect of participating in the treatment. However, there are different methods for calculating the overall treatment effect, each with different advantages and disadvantages.
Table 1 shows three ways to calculate such an overall effect, as well as the partially aggregated treatment effects required for this calculation. The simplest way is to estimate a weighted average across all groups and time points with weights proportional to group size (see
Table 1, line 1). However, such an approach tends to overweight the effect of the early treated groups because we have more observations for them in the post-treatment period [
49] (p. 212). Another approach is to use the ATTs estimated in the event study and aggregate them into an overall measure (see
Table 1, line 2). In this case, the overall ATT is based on the average of the partially aggregated treatment effects of the post-treatment periods (e = 0 to e = 8). In contrast, Callaway and Sant’Anna [
49] (p. 212) promote the idea to “first compute[s] the average effect for each group (across all time periods) and then averages these effects together across groups to summarize the overall average effect of participating in the treatment”. Hence, the so-called aggregated group-specific ATT (see
Table 1, row 3) is based on the aggregate average of the partially aggregated group-specific effects (g = 11 to g = 19). It can be interpreted similarly to the ATT in a classic two-group, two-period DiD design. For our study we calculate all three overall measures.
The simple weighted average shows a 2.26 µg/m3 lower NO2 concentration, while the aggregated event study average indicates a 3.30 µg/m3 lower NO2 concentration. The aggregated average effect of a lawsuit across all groups sued indicates a 1.31 µg/m3 lower NO2 concentration due to a lawsuit. All three aggregate ATT measures mostly paint the same picture, showing that a lawsuit against a city’s air quality plan reduces NO2 concentrations in that city.
7. Discussion
According to the aggregated group-specific ATT (see
Table 1, line 3), the NO
2 concentration in cities that were sued by ENGOs decreased by roughly 1.31 µg/m
3 relative to their counterfactual level. How can this result be interpreted? Firstly, the estimated 1.31 µg/m
3 decrease should not be misinterpreted. It tells us that the NO
2 concentration in cities would be 1.31 µg/m
3 higher if there were no lawsuit against a city’s air quality plan and not that the NO
2 concentration decreased by 1.31 µg/m
3 in absolute levels. Moreover, our results do not indicate that cities that have not been sued do not reduce NO
2 (see
Figure 2), but rather suggest that sued cities reduce the NO
2 concentration to a larger extent. At first glance, however, it appears to be a rather small effect, but it should be noted that the aggregate group-specific ATT is an average effect that does not consider that later treated cities may experience a much smaller effect due to the time lag between the lawsuit and the adoption of measures against NO
2 concentration. This is due to the fact that the aggregate group-specific ATT weighs all groups equally, regardless of treatment duration and group size [
49] (p. 210). For example, the treatment effect of the 2015 group (g = 15) is weighted equally with the treatment effect of the 2019 group (g = 19), even though the 2019 group is much smaller and experiences treatment for only one year. Thus, for our setting, it seems that the aggregated group-specific ATT underestimates the treatment effect. In contrast, the aggregate ATT of the event study (see
Table 1, line 2) provides a measure of the mean effect of the treatment for the entire observation period. However, the aggregate ATT of the event study also does not take the group size into account. As already explained, in the event study setting, the group size becomes smaller with increasing length of exposure to the treatment (see
Figure 3), which leads to a disproportional weighting of the effect for observations that receive the treatment very early (similar to the simple weighted average, but to a greater extent). Since
Figure 3 indicates that, in our case, the treatment effect becomes stronger over time, this may lead to an overestimation of the aggregate ATT of the event study. Although the simple aggregated ATT (see
Table 1, line 1) also overestimates the effect of the treatment, in our case, it seems to be the most appropriate measure for determining the treatment effect, as the other two measures either overestimate or underestimate the effect to a much greater extent.
Nevertheless, since all three measures are significant, we are confident that the first hypothesis is supported by our findings. In cities where legal action has been taken, NO
2 levels decrease more after the action than before the action and also more than in cities where no action has been taken. This assessment is supported by the findings of our subset analysis, in which we use only treated cities and use all the “not-yet-treated” cities as the control group (see
Figure A1 and
Table A1). We also find significant negative effects for the treatment. For the simple aggregated ATT, the coefficient is −2.44 and is significant at the 10% level. For the aggregated ATT of the event study the coefficient is also negative (−3.44) and significant even on a 5% level. Only for aggregated group-specific ATT is a smaller (−1.27) and no longer significant effect observed. However, this could be due to the now significantly reduced number of observations (300 to 709). Overall, the results of the subset analysis suggest that a treatment effect occurs even when the cities have similar NO
2 concentrations.
For our second hypothesis, however, the empirical evidence is not as clear as for the first hypothesis.
Figure 3 and
Table 1 indicate that the effect of a lawsuit increases over time but, as already mentioned, the partially aggregated effects of the event study are not significant due to the small numbers of observations within the groups (see
Table 1, line 2). Further support for our hypothesis comes from the partially aggregated group-specific ATTs (see
Table 1, line 3). The group-specific ATTs are estimated based on all observations within a group and across all post-treatment time points. For example, the 2012 group ATT is estimated based on all cities sued in 2012 over the years 2012 to 2019. Assuming that the effect takes time to become apparent or increases over time, early treated groups should have greater ATT. Overall,
Table 1 shows that this is the case for the partially aggregated group-specific ATTs. As it shows, cities sued before 2016 (g = 11 to g = 15) tend to have large negative and significant effects, while groups treated after 2016 (g = 16 to g = 19) show small positive average treatment effects. In the case of the 2017 group (g = 16), there is indeed a significant positive effect, but this group is based on a single case, namely the city of Kiel, and should not be overinterpreted. Although the empirical evidence for the second hypothesis is not perfect, there is some evidence that the negative effect of lawsuits on NO
2 concentrations increases over time (this should not be misinterpreted as effect heterogeneity, since effect heterogeneity describes the phenomenon that different groups experience different treatment effect paths [
50] (p. 193)).
8. Conclusions
The starting point of our paper is the question of whether lawsuits filed by ENGOs under the Aarhus Convention can lead to improvements in environmental quality, as assumed in the literature. For this question, the 49 lawsuits filed between 2011 and 2019 by ENGOs against the air quality plans for German cities represent a “most likely case” because they were exceptionally successful. Our theoretical argument is that the lawsuits should have motivated political decision makers to adopt more effective measures in order to avoid resorting to diesel driving bans. Those measures should have a negative impact on emissions and thus also on NO2 concentrations. Indeed, the results of our DiD model suggest that sued cities have a 1.31 to 3.30 µg/m3 lower NO2 concentration relative to their counterfactual level. In addition, there is some evidence that lawsuits are not immediately effective, since the event study plot shows that the more time that passes after treatment, the larger the effects.
Our findings indicate that it is possible for lawsuits by ENGOs to lead to an improvement in air quality that would not have occurred without the lawsuit. However, it is still an open question of which actions and measures taken are exactly responsible for this improvement, i.e., which causal mechanisms connect the lawsuits with (improved) air quality and also what role they play, e.g., agency. With our DiD analysis, we applied a quantitative method to establish this causal connection as such. However, bringing light into the causal mechanisms will require further studies with research designs including qualitative methods, e.g., comparative case studies that look into what really happened in the affected cities after a lawsuit was filed, and which measures were adopted, causing a stronger decrease of NO2 concentrations than we find elsewhere.
Furthermore, it is unclear how far this finding can travel. It seems at least doubtful that our findings are generalizable for all areas of environmental protection. It is important to note that ENGOs use the right to sue in a broad variety of areas with very different regulatory settings and conflict structures [
40]. Besides air quality plans, ENGOs sue, for example, against the admission of wind energy plants [
54], against water law permits, and against a variety of planning decisions. Success rates are lower than rates with air quality plans but still higher than on average of other administrative cases [
40] (p. 54). In addition, in other areas besides air quality, it can be more ambivalent to determine what exactly improves environmental quality, especially in cases with conflicting environmental protection objectives. For instance, the ENGOs “Green League” and “NABU” are suing against the additional water pumping in the Grünheide area, which would be necessary due to the consumption of the recently completed Tesla Gigafactory [
55]. Looking at lawsuits against the admission of wind energy plants, it is even debatable if the ENGOs’ right to sue could harm specific environmental interests [
54]. Thus, more research is needed on the effects of ENGOs’ lawsuits in different areas.
