Article

Multi-Agent Simulation of Product Diffusion in Online Social Networks from the Perspective of Overconfidence and Network Effects

Department of Economy, Wuhan University of Technology, Wuhan 430070, China
*
Author to whom correspondence should be addressed.
Sustainability 2022, 14(11), 6589; https://doi.org/10.3390/su14116589
Submission received: 17 April 2022 / Revised: 24 May 2022 / Accepted: 25 May 2022 / Published: 27 May 2022

Abstract

:
Online social networks (OSNs) have steadily become the primary mechanism of product promotion. However, previous studies have paid little concern to the irrational consumer behavior (e.g., overconfidence) and network effects that influence product diffusion in OSNs. We use overconfidence theory, network effects theory, and evolutionary game theory to build a multi-agent simulation model that captures the nonlinear relationship between individual actions to examine the effects of overconfidence and network effects on product diffusion in OSNs. We found that (1) overestimation is profitable for improving the diffusion level of product diffusion in OSNs and maintaining market stability; however, the closer the degree of overprecision is to 1 (i.e., individuals are more rational), the more stable the market will be. We also found that (2) moderate network effect intensity can better promote product diffusion on the social network. When the network effect intensity is small, the non-overconfident scenario has the highest percentage of adoption. The overprecision scenario has the highest percentage of adoption where the network effect intensity is high. Additionally, we found that (3) the scale-free network is more conducive to the diffusion of products in OSNs, while the small-world network is more susceptible to overconfidence and network effect. This research laid the groundwork for investigating dynamic consumer behavior utilizing a multi-agent method, network effects theory, and a psychological theory.

1. Introduction

Online social networks (OSNs) have steadily become the primary mechanism of product promotion as more people distribute information via online social applications, e.g., Instagram, CrowdRise, Twitter, and Facebook [1,2]. Based on this background, OSNs instead of technical research become the major barrier for companies. Online consumers’ decisions become increasingly irrational and susceptible to the influence of social networks as communication between consumers becomes fast and frequent [3,4,5,6]. In such a circumstance, it is of great significance to study the evolution of product diffusion in OSNs from the perspective of overconfidence and network effects.
Product diffusion in OSNs refers to the dynamic process by which more consumers buy products in OSNs over time [7]. In essence, macro-level product diffusion arises from micro-level interactions between individuals in OSNs, making product diffusion consequences uncertain. Thus, the behavioral decisions of individuals can significantly influence the outcome of product diffusion in OSNs. When presented with complex situations, however, humans are prone to irrational tendencies such as loss aversion, herd behavior, and overconfidence [8]. Among these, the research on overconfidence is especially significant [5]. Overconfidence is a well-established bias that can lead to unrealistic expectations or faulty assessments [9]. The evolution of product spread in OSNs cannot be completely understood if its effect is neglected.
In addition, scholars have confirmed the existence of network effects in OSNs [6,10]. Social networks provide consumers with convenient information communication channels, which makes the role of network effects in OSNs increasingly prominent. On the one hand, adopters have access to a large number of potential adopters, even those they cannot reach directly in real life. On the other hand, more and more consumers like to share their shopping experiences on OSNs, which means that users’ adoption behavior is relatively open. This means that neighbors in the “circle” can see whether they have purchased a particular product. As the number of users who adopt a product increases, their neighbors also want to adopt the same product. Then, the value and utility of the product to the users will also increase, which ultimately affects user decision-making. The intensity of the network effects can be interpreted as the openness of consumer adoption behavior. The stronger the network effects intensity of OSNs is, the greater the influence of users’ decisions on their neighbors [11,12,13].
In short, the evolution of product diffusion in OSNs is complex and is influenced by irrational consumer behavior (such as overconfidence) and network effects. However, most of the existing research is based on the rational man hypothesis, but ignores the impact of irrational behavior, and fails to consider the network effects. As a result, conventional research methodologies are ineffective for exploring the evolution of product diffusion in OSNs. Thus, the present study develops a multi-agent simulation model by combining overconfidence theory, network effects theory, and evolutionary game theory, which captures the nonlinear relationship between individual behaviors and provides insights for an in-depth study of the effects of overconfidence and network effects on product diffusion in OSNs. In this way, individual fundamental micro-interactions could be properly examined using evolutionary game theory. The influence of irrational behavior and OSNs could be set using overconfidence theory and network effects theory, respectively.
We found that overestimation is profitable for improving the diffusion level and maintaining market stability. However, the closer the degree of overprecision is to 1 (i.e., individuals are more rational), the more stable the market will be. Moderate network effect intensity can better promote product diffusion on the social network. The small-world network is more susceptible to overconfidence and network effect. Additionally, we make two key contributions to theory. First, this study provides a further theoretical basis for integrating other behavioral theories and complex network theories into the new product diffusion model. Second, this multi-method study provides a basic framework for the combination of simulation method and behavior as well as psychology theory to test dynamic group behavior.
The remainder of this paper is organized as follows: Section 2 presents a literature review on product diffusion, overconfidence theory, network effects, multi-agent simulation, and game theory. Section 3 builds a simulation model based on evolutionary game theory, overconfidence theory, and network effects theory to describe individual decision-making processes. The results of the simulation experiments about the influence of overconfidence scenarios, network effects, and network structures on diffusion are introduced and analyzed in Section 4, and the conclusions are presented in Section 5.

2. Literature Review

2.1. Product Diffusion in OSNs

The Bass model [14] is a classic model used to study product diffusion, and aims to model market behavior from the macro-level [15]. It usually assumes that consumers are independent and have the same preferences, which can reflect the impact of mass word-of-mouth and interpersonal communication between consumers on product diffusion [16]. However, the Bass model has some limitations in studying product diffusion in OSNs. First, it can only describe the macro process of product diffusion, and cannot examine the influence of individual behavior on product diffusion from the micro-level. Secondly, existing studies cannot understand the irrational behaviors of consumers and the network effects of complex OSNs, thereby lacking a certain predictive and explanatory power [5]. To describe the dynamic process of product diffusion in OSNs considering irrational behavior from the micro-level, this paper introduces network effects into the model and studies the influence of overconfidence and network effects on product diffusion in OSNs by using evolutionary game theory and the multi-agent model.

2.2. Overconfidence Theory

Overconfidence is a well-established bias and is usually manifested as cognitive bias behavior in decision makers’ decisions [9,17]. Studies have indicated that overconfidence is very common in economics, mainly in the area of the overconfidence of managers [18,19,20,21]. In addition, consumers also tend to be overconfident in the process of consumption. Malmendier and Della Vigna examined a dataset from three U.S. health clubs and suggested and concluded that inferences based on the rational expectation hypothesis can lead to biases in the estimation of consumer preferences [22]. Xia and Li analyzed the data from the 2012 Chinese Survey of Consumer Finance and showed that financial literacy overconfidence is positively connected with stock market participation [23]. Dowling et al. investigated the effects of overconfidence on the decision to choose between a pay-per-use and a flat-rate option and discovered that overconfident consumers underestimate their actual usage [24]. Overconfidence and game theory have been merged in a few research. Taking the coevolution of overconfidence and bluffing as fundamental, Li and Wang provide a simple version of a resource competition game [25]. Xiang and Xu suggested a two-stage remanufacturing CLSC dynamic model with a manufacturer, an IRP, and a supplier based on differential game theory [26]. Wei et al. developed a multi-agent simulation model integrating overconfidence and evolutionary games [5]. However, overconfidence has not been well addressed in the area of product dispersion.

2.3. Network Effects

People desire to satisfy their social demands by boosting interactions with their friends, and online social networks are vital platforms where individuals share personal data from their daily lives [1,2]. Scholars have confirmed the existence of network effects in OSNs. Network effects mean that the benefit of using a good/service increases with the number of users adopting the same or compatible good/service [27,28]. According to network effect theory, new users will prefer products with large adopter networks, which makes the large networks larger [29]. Earlier studies on network effects tended to focus on global network effects, but in recent years scholars have found that network effects are composed of local and global network effects. Parker and Van Alstyne [30] developed a formal model of two-sided network externalities based on network effects to study how firms can profitably give away free products. Sundquist et al. [31] presented a multi-agent model of local network effects and showed that the symmetric Bayes-Nash equilibria of this network game are in monotone strategies. Zhou and Yang [32] proposed a diffusion model that includes the interactions between network effects and bandwagon effects and found that the trade-off between local and global network effects is necessary to improve the diffusion of innovation. Katona et al. [33] studied the diffusion process in an online social network given the individual connections between members and found two marked effects: degree effect and clustering effect. Product diffusion in OSNs is inevitably affected by the network effect of OSNs. However, few studies have applied the network effect theory to product diffusion in OSNs. Therefore, in this research we investigate the features of product dissemination in OSNs under local and global network effects.

2.4. Multi-Agent Simulation and Game Theory

Multi-agent simulation has become another typical method of studying product diffusion in recent years [34]. As a bottom-up modeling method from a micro perspective, it is well suited to the study of heterogeneous individual agents interacting within a social system [35,36,37,38,39]. It explores the macro-level emergence phenomena created by individual interaction and analyzes the process of individual interaction by creating interaction rules. However, the multi-agent simulation model’s interaction rules are frequently insufficient to fully characterize individual interactions. One of the key frameworks for behavioral decision analysis is game theory [5,40], which could be used to create individual interaction rules and compensate for multi-agent simulation flaws. At present, some scholars have combined multi-agent simulation and game theory. Da Silva Rocha and Salomão integrated them to study the interplay between corporate environmental compliance and enforcement promoted by the policymaker in a country facing a pollution trap [41]. Shi et al. built an agent-based model to simulate enterprises’ reactions to multiple policy interventions aimed at spurring low-carbon technology diffusion, in which enterprises are in a complex network where they play evolutionary games with their neighbors [42]. Therefore, in this paper, the evolutionary game model is regarded as the most group unit of individual decision making, which is embedded into the multi-agent simulation model, and the inter-individual learning imitation rules are designed to describe the process of individual interaction changing decision making.

3. Methodology

Product diffusion in OSNs is a process of continuous change and continuous interactive learning among bounded rational consumers, in which individuals adjust their strategy in purchasing according to their expected utility, neighbor’s strategy, and overconfidence. In this section we hereby design the conceptual model of product diffusion in OSNs. Firstly, we made assumptions about products and users. Secondly, we constructed the model of product diffusion in OSNs. Finally, we described the construction rules of the simulation model.

3.1. Assumptions

The assumptions of models are vital in simulating the user’s decision-making process [43,44]. Therefore, we first need to make assumptions about the consumer and product in product diffusion in OSNs. This is the basis for modeling the diffusion of product.
  • Products are abstractions of common features and attributes of the product that are diffused in OSNs. The unique characteristics of some internet products are not considered.
  • We only consider the diffusion of one product on the OSNs.
  • Consumers are assumed to have bounded rationality. They only know the strategies of their neighbors and their ultimate goal in decision-making is to maximize their interests.
  • Individual overconfidence leads to bias in expected utility estimation.
  • Some consumers have free-riding behavior and they are punished for it.

3.2. Conceptual Model of Product Diffusion in OSNs

3.2.1. Conceptual Model of Product Diffusion in OSNs Based on Game Theory

The first step of modeling the situation is the definition of the utility function for each [45]. Product diffusion in OSNs refers to the dynamic process by which more consumers buy products in OSNs over time [7]. Information processing theory states that bounded rational consumers process the information they receive, make decisions, and switch between the roles of adopter and rejector (i.e., potential adopter) [46]. Researchers usually use game theory as a framework for analyzing behavioral decisions [5,40,41,42]. Therefore, the interaction between users in product diffusion in OSNs can be represented by a game matrix as Table 1. In which, b represents the benefits of adopting the product,   c denotes the cost of diffusion this product in OSNs, and   d is the loss of the benefits due to rejection, i.e., penalty. Corresponding to the real scene, we assume that the benefits of consumers purchasing a product in OSNs are greater than the cost, that is, b > c ; similarly, the loss of the benefits is always smaller than the benefits, that is, b > d . Assume that in a fixed time step, the percentage of users who choose to adopt the product is p . According to the dynamic replication method, the expected revenue of the adoption of product diffusion in OSNs can be expressed as follows:
E a = p ( b c ) + ( 1 p ) ( b c ) = b c ,
Meanwhile, the expected revenue of rejection is as follows:
E r = p ( b d ) ,
If b > c > d are satisfied, the equilibrium result ( p * )   is 0 < p * < 1 . The proof can be viewed in Appendix A.

3.2.2. Conceptual Model of Product Diffusion in OSNs Considering Network Effects

In addition, network effects also closely relate to the utility obtained in the process of product diffusion in OSNs [16]. Katz and Shapiro divided the effect of value utility on users’ individual decisions into the expected revenue and the network effects [27]. Therefore, this paper adds network effects to the calculation of user value utility. Then, the value utility of user i at the timestamp t is as follows:
U i ( t ) = E i + N i ( t 1 )
where E i represents the expected revenue of user i , N i denotes the network effects of the online social network.
Under the global network effects, N i g l o b a l ( t 1 ) = h × p , where h represents the network effects intensity, p is the proportion of adopters. While under the local network effects, users can only know the decision-making status of their neighbors in the surrounding local network. So, we use G i ( t 1 ) represents the number of neighbor users who adopt the product at the timestamp t 1 and d i indicate the degree of user i . So, under the local network effects, N i l o c a l ( t 1 ) = h × G i ( t 1 ) / d i .
Then, the value utility of adoption under the global and local network effects at the timestamp t can be expressed as follows, respectively:
U a g l o b a l ( t ) = E i + N i g l o b a l ( t 1 ) = b c + h × p ,
U a l o c a l ( t ) = E i + N i l o c a l ( t 1 ) = b c + h × G i ( t 1 ) d i .
Rejectors cannot enjoy the network externalities of the online social network. Therefore, for both types of network effects, the value utility of rejection at the timestamp t can be expressed as follows:
U r l o c a l ( t ) = U r l o c a l ( t ) = p ( b d ) ,
However, individuals have diverse perceptions of the utility of product dispersion in a real-world context due to the effect of irrational behavior characteristics such as overconfidence [5]. Thus, we will combine the overconfidence theory with the evolutionary game model described above to investigate the impact of customers’ overconfidence on product dissemination in OSNs.

3.2.3. Conceptual Model of Product Diffusion in OSNs Considering Overconfidence

In complex situations, people tend to behave irrationally [8,47]. For example, someone overestimates his or her potential to gain advantages and exaggerates the amount of the benefit, believing that by purchasing, he or she may obtain more benefits, such as inner pleasure and social influence [5].
Overestimation and overprecision are two typical types of overconfidence scenarios [5,17]. Overestimation refers to people overestimating their actual performances or mistakenly believing they are better than others and thinking that they have high expectations for their decision. Overprecision means people have excessive precision in their beliefs and they believe that they can control the fluctuation range of variables well through their ability to control the variance well. Based on the above perspective, we considered two overreaction scenarios on product diffusion in OSNs: overestimation and overprecision, i.e., the estimation of the expected mean and variance are biased.
  • Overestimation. We defined that k is the degree of overestimation and k = ( B 1 b ) / b , where B 1 and b represent the perceived benefit and actual benefits of individuals adopting the product. The value utility of adoption and rejection under the global and local network effects at the timestamp t can be expressed as follows, respectively:
    U a g l o b a l ( t ) = B 1 c + h × p = ( 1 + k ) b c + h × p ,
    U a l o c a l ( t ) = B 1 c + h × G i ( t 1 ) d i = ( 1 + k ) b c + h × G i ( t 1 ) d i ,  
    U r g l o b a l ( t ) = p ( B 1 d ) = p [ ( 1 + k ) b d ] ,
    U r l o c a l ( t ) = p ( B 1 d ) = p [ ( 1 + k ) b d ] ,
  • Overprecision. We defined β as the degree of overprecision. Additionally, we assume the linear function of each individual’s expected benefit can be expressed by B 2 = b + X ¯ = b + σ β × X where B 2 ~ N ( b , σ β 2 ) . B 2 represents the perceived benefit, b represents the actual benefits, X ¯ is a random disturbance, σ is the actual variance, X is the stabilized random disturbance. The value utility of adoption and rejection under the global and local network effects at the timestamp t can be expressed as follows, respectively:
    U a g l o b a l ( t ) = B 2 c + h × p = b + σ β × X c + h × p ,
    U a l o c a l ( t ) = B 2 c + h × G i ( t 1 ) d i = b + σ β × X c + h × G i ( t 1 ) d i ,
    U r g l o b a l ( t ) = p ( B 2 d ) = p ( b + σ β × X d ) ,
    U r l o c a l ( t ) = p ( B 2 d ) = p ( b + σ β × X d ) .  

3.2.4. The Game Learning Algorithm for Users in the Product Diffusion

Product diffusion emerges from the micro-level interaction between individual consumers [47]. Therefore, it is necessary to design the rules of interaction between consumers. In OSNs, given consumers’ bounded rationality, individuals cannot understand the overall situation and can only acquire knowledge by observing and learning their neighbors’ behaviors. The decision of individuals at time t in the model is influenced by the decision of neighbors at time t 1 , according to the theory of social influence [48]. That is, people will imitate the neighbor who has the highest utility value. In evolutionary dynamics, this stochastic process is usually denoted by human interactions, which is mathematically equivalent to the statistics on the dynamics of spins in a Fermi-Dirac distribution [49]. In this model, the imitation rule can be denoted by the stochastic process as shown in Equation (15):
P ( i j ) = 1 1 + e U i U j   m a x n
where U i is the value utility of an individual, while U j   m a x is the largest expected utility of neighborhoods that have a straight linking with the individual at time t 1 and calculated by neighborhoods themselves, and n is the information noise.

3.3. Simulation Model with Multi-Agents

In this section, the simulation conceptual model will be implemented in Anylogic 6.5.0, which is a tool that provides many simulation modeling methods [46]. The simulation model includes the following three parts: (1) basic multi-agent simulation model; (2) state transition rules; and (3) model validation.

3.3.1. Basic Multi-Agent Simulation Model

If the multi-agent simulation model is used to imitate the interactive decision-making process of the consumer group, consumers, shopping settings, and the transformation rules of consumers’ decision-changing should all be taken into account. Thus, an agent is used to describe an individual consumer with independent decision-making abilities. A complex network is used to represent consumers’ consumption environments, and the consumer’s decision transformation rules can be expressed by functions. The basic model is defined as follows:
  • Θ is the set of agents. Θ = { A g e n t 1 ,   A g e n t 2 ,   ,   A g e n t n } , where n is the number of consumers in the network. Each agent is a consumer in the online social network.
  • Z is the decision-making state of the consumer at time t . Z = { Z 1 ,   Z 2 } , where Z 1 means purchase and Z 2 means refusal.
  • N is the neighbor set of the Agent. N = { N 1 ,   N 2 ,   , N n } , where N i = { A g e n t i A g e n t j } . That is, N consists of agents connected to the Agent.
  • P is the set of overconfidence parameters, and P = { k ,   β } . k is the degree of overestimation, and β is the degree of overprecision.
  • F is the consumer’s decision transfer function, that is, the current state of an individual is related to the state of itself and its neighbors, overconfidence, and network effects at the last moment.
  • t is the system clock, and t = { t 1 ,   t 2 ,   , t n } is the basis of the simulation system.

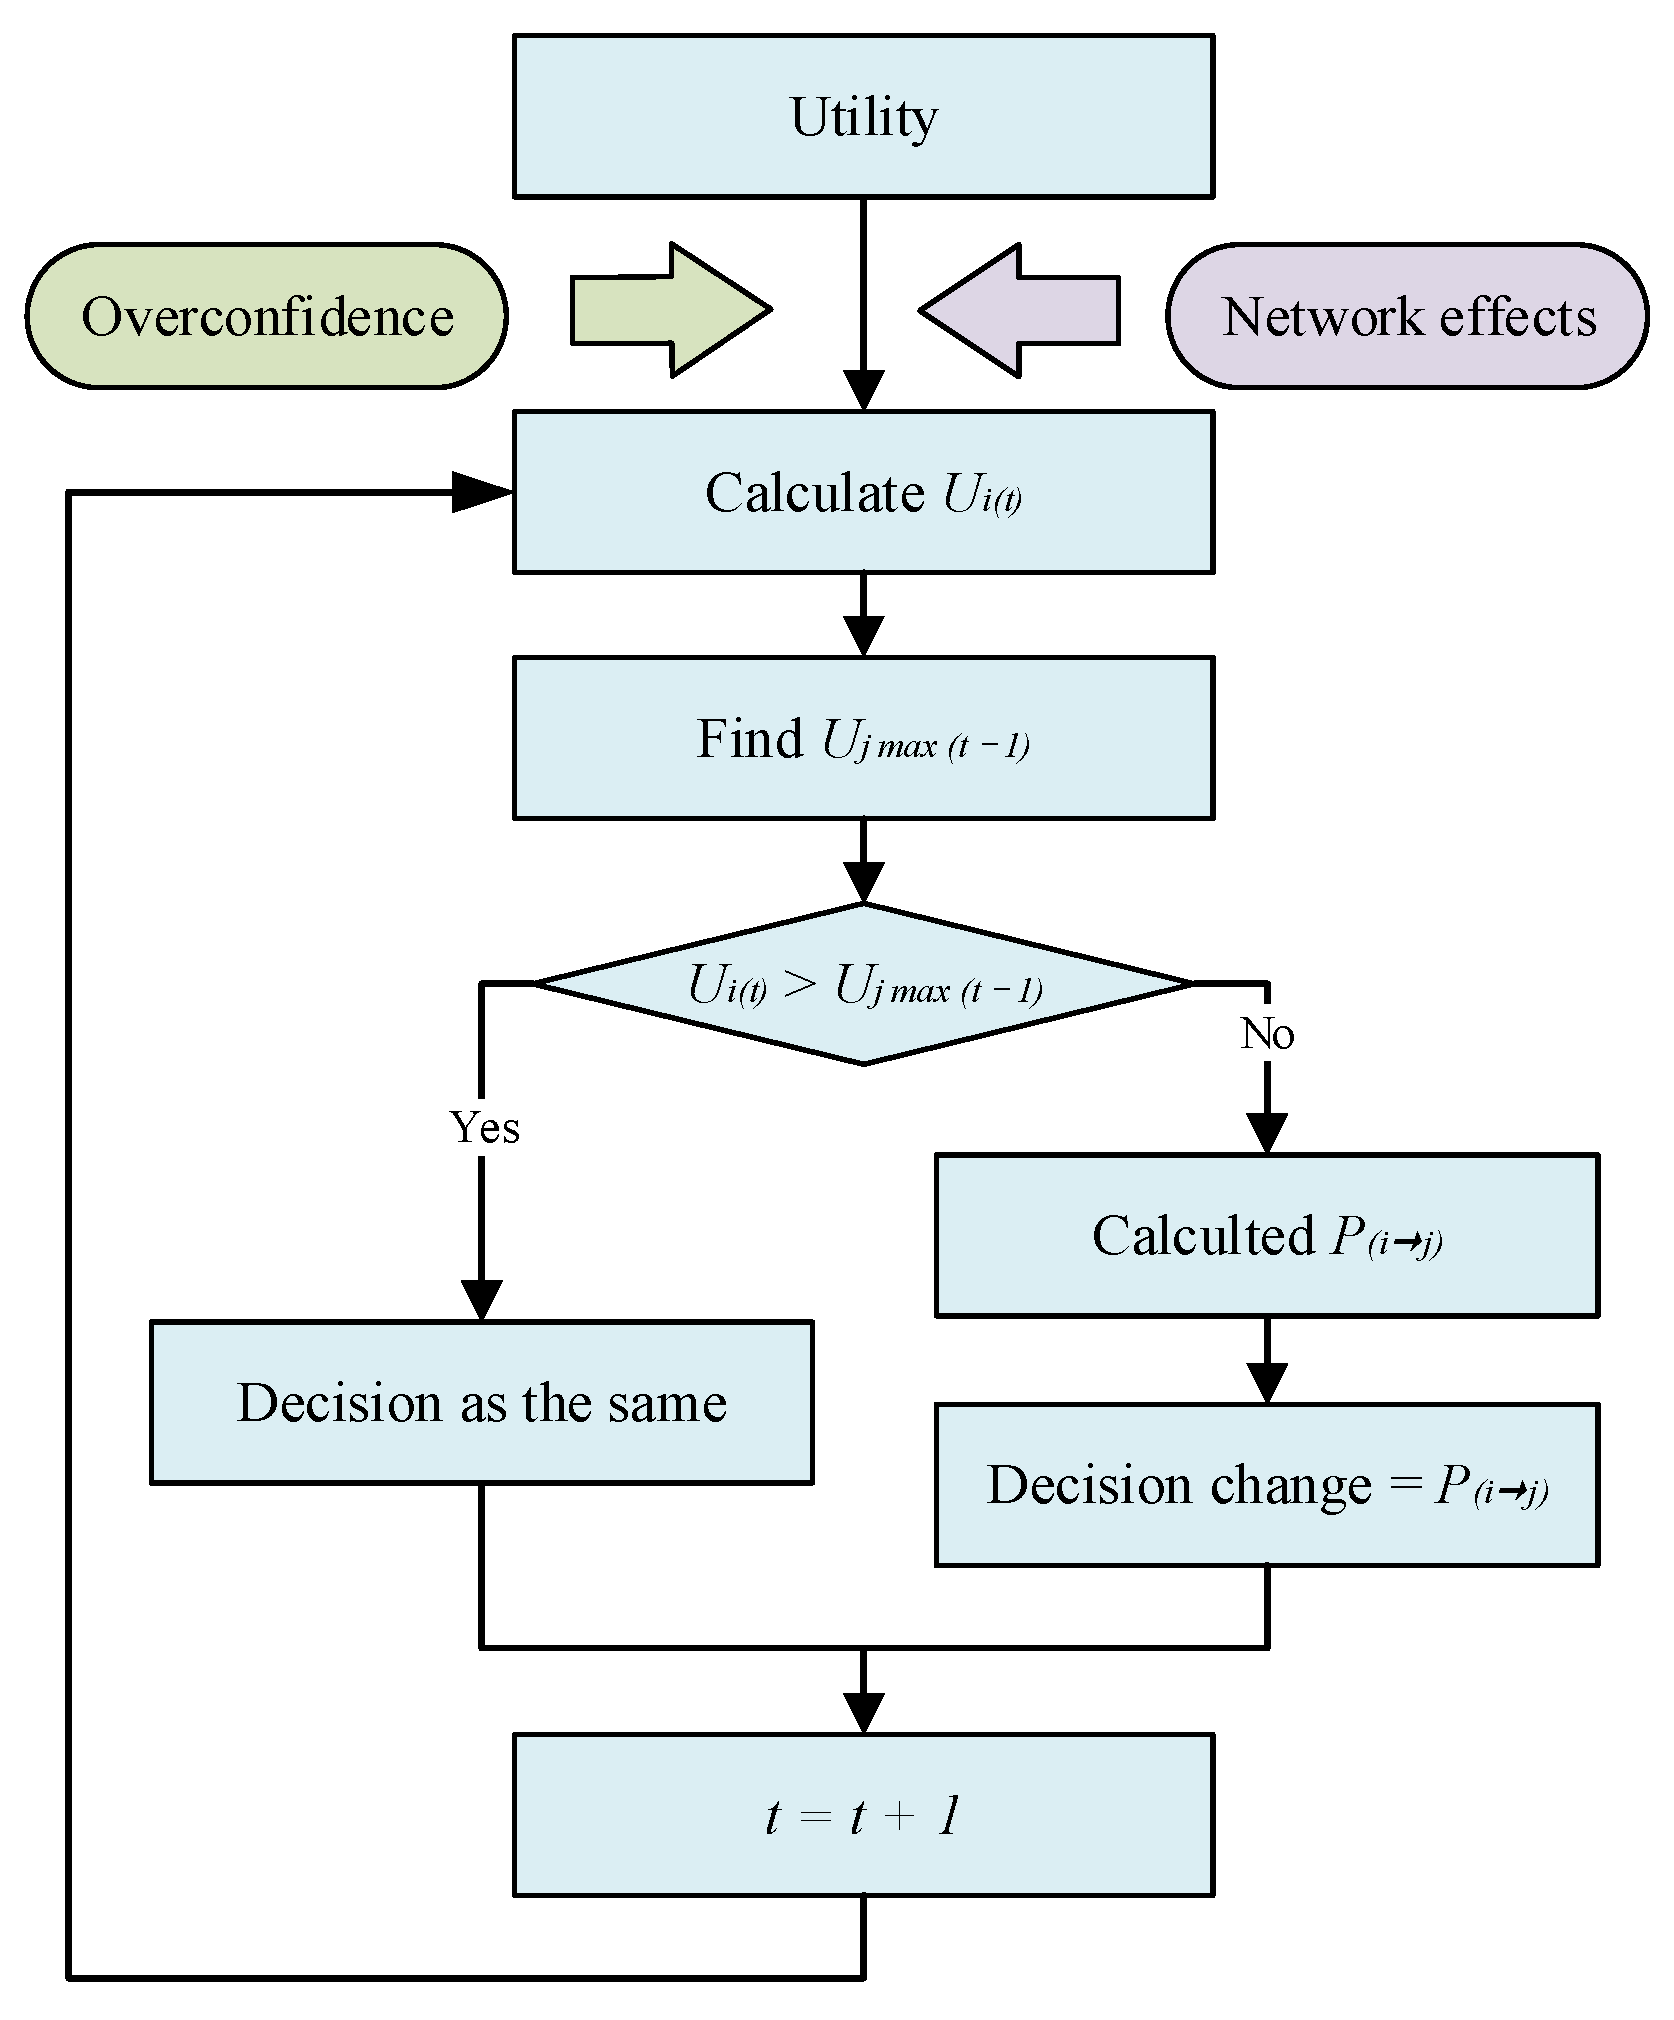
3.3.2. State Transition Rules of Multi-Agent Simulation Model

The state transition rules of our multi-agent simulation model are shown in Figure 1. According to Equation (15), in each time unit t , consumers first calculate their own utility ( U i ) and find the neighbor with the largest ( U j   m a x ) at time t 1 . Then, consumers compare them. If U i > U j , their decision will not change. Otherwise, consumers will calculate P ( i j ) and change their decision by the probability   P ( i j ) . The code for this part can be viewed in Appendix B.

3.3.3. Model Validation of Multi-Agent Simulation Model

Next, we did internal validation to see if the simulation model was feasible according to the relevant research results [5,50]. In two sets of scenarios, we evaluated whether this simulation system with different parameter settings could deliver the required results. The test time step was set at 100, and each group of parameters was repeated 1000 times. According to evolutionary game theory, a higher level of cost c will hamper diffusion, whereas a higher degree of penalty d will encourage consumers to pick - an adoption strategy. For example, in Figure 2a, the adoption rate increases with decreasing adoption costs. In Figure 2b, consumers will choose to buy the product and the adoption rate will approach 1 over time if the penalty is very large. Figure 2a,b are consistent with the expectation. Thus, our simulation model’s internal validity demonstrates that it corresponds to the actual situation.

4. Simulation Results

We perform sensitivity analysis to investigate the influence of each parameter on product dissemination in OSNs by adjusting parameter values in experiments and collecting numerical data under various scenarios. For each scenario, we implemented 1000 replications to ensure the reliability of the simulation outcomes.

4.1. Experimental System and Default Parameters

Among the complex network types, the most representative ones are random networks, small-world networks, and scale-free networks. Therefore, we chose these three network types as the network environment herein. According to the characteristics of the Facebook network [5], the network construction rules are as follows:
  • The number of agents is at as 400.
  • For the random network, the node layout is set as a ring type and the number of agents in the neighborhood of each node (i.e., average degree distribution) is set at 6.
  • For the small-world network, the node layout is set as an arranged type. The average degree distribution is set at 6, and the reconnection probability of each edge (i.e., rewiring probability) is 0.6.
  • For the scale-free network, the node layout is set at random and the number of large nodes is 5.
The parameters listed in Table 2 are the default settings of our experimental system. We assume b = 55 , c = 35 , and d = 15 to be compatible with the “tit-for-tat” game pattern in the actual world. To simulate a realistic situation, the initial number of adopters and potential adopters in the system is set to be equal, i.e., p = 0.5 . Additionally, n = 0.1 is used to set the degree of information noise [51,52]. We classified information dissemination into two scenarios in Section 3.2: overestimation and overprecision. We assume β = 1 for the overestimation scenario, ignoring overprecision. When doing different simulations to address a new circumstance, we may manually adjust the parameter values for the overprecision scenario.

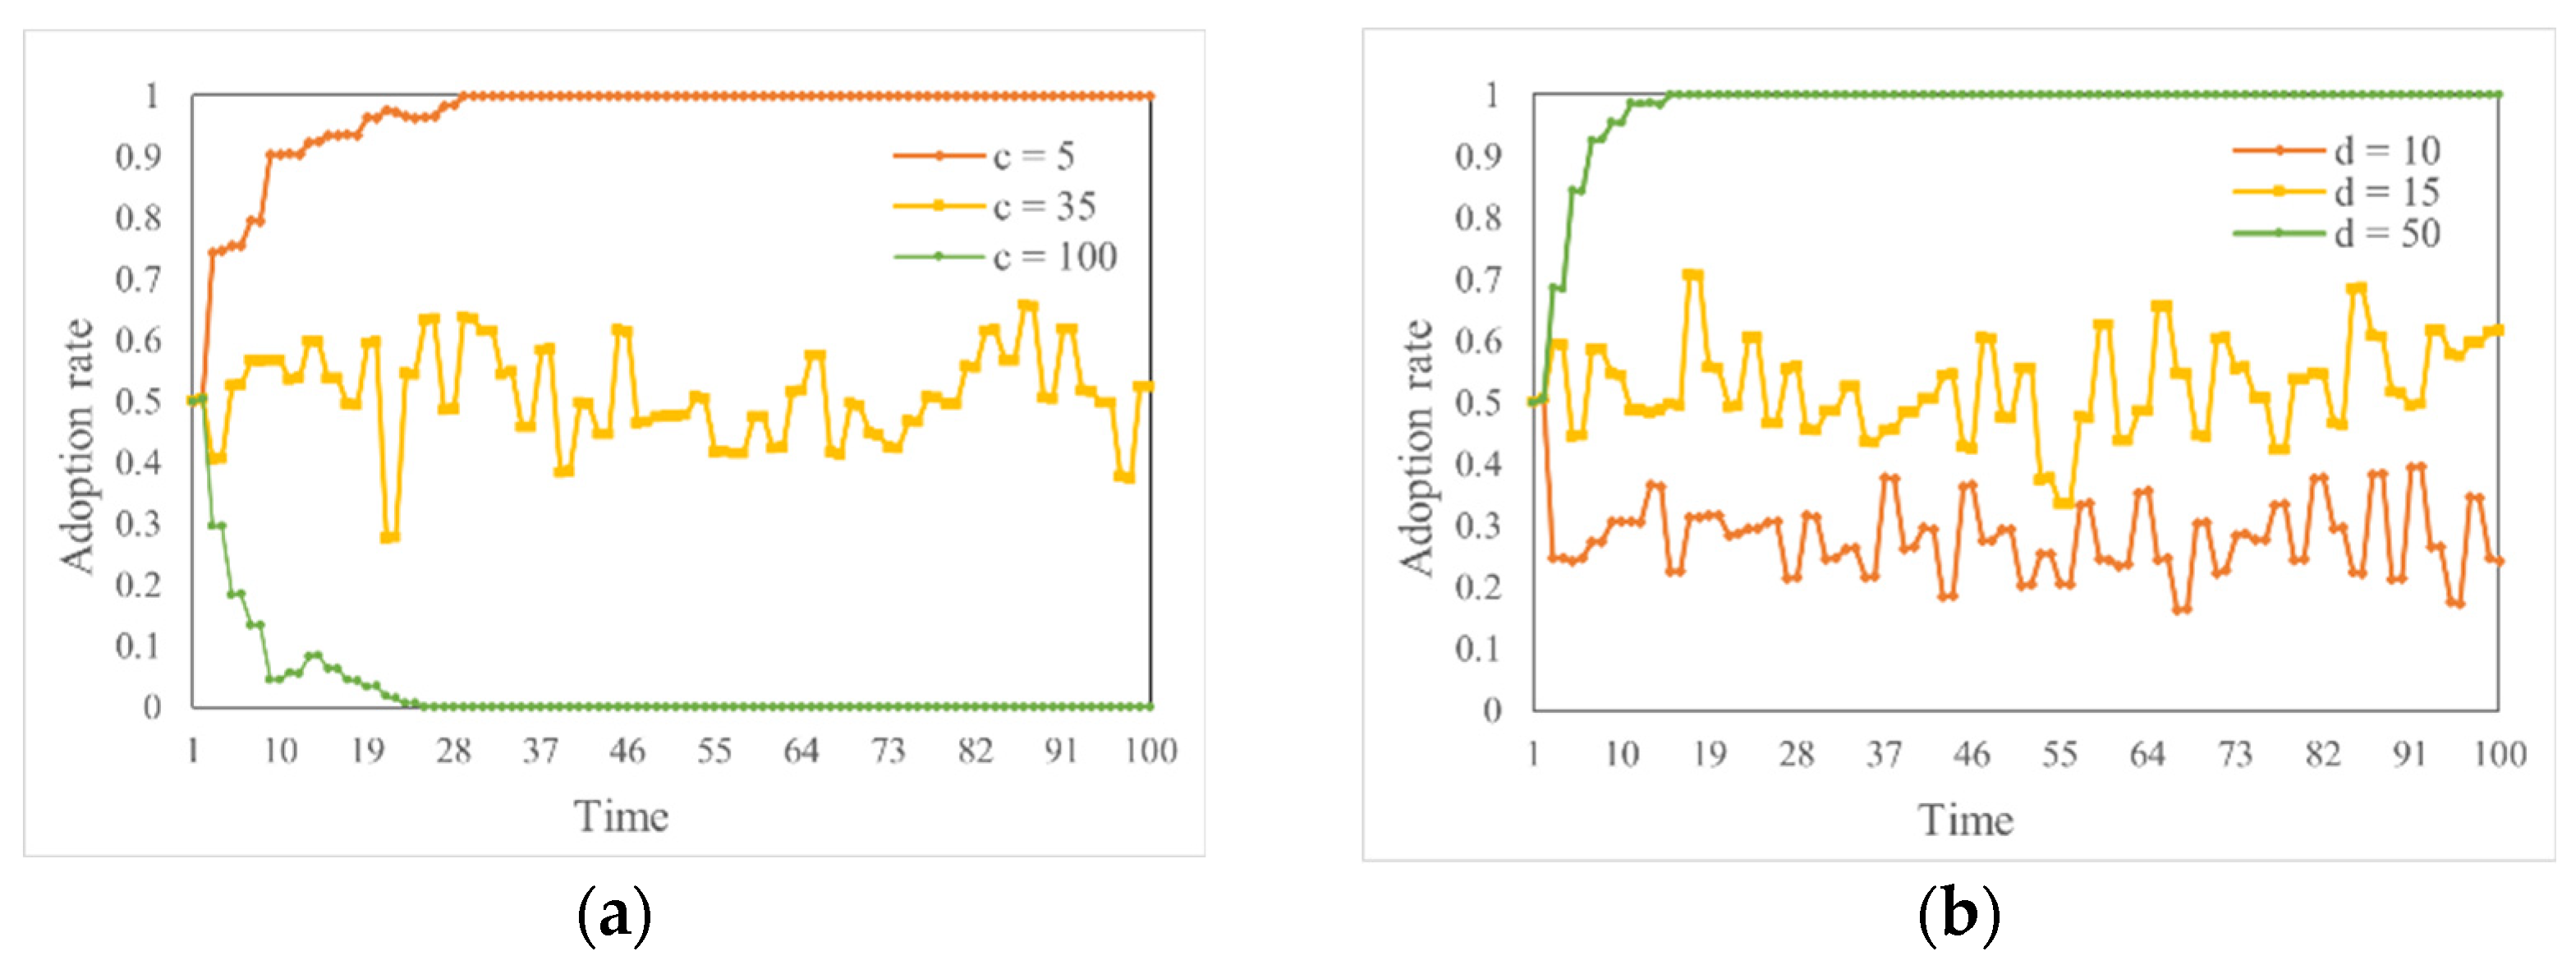
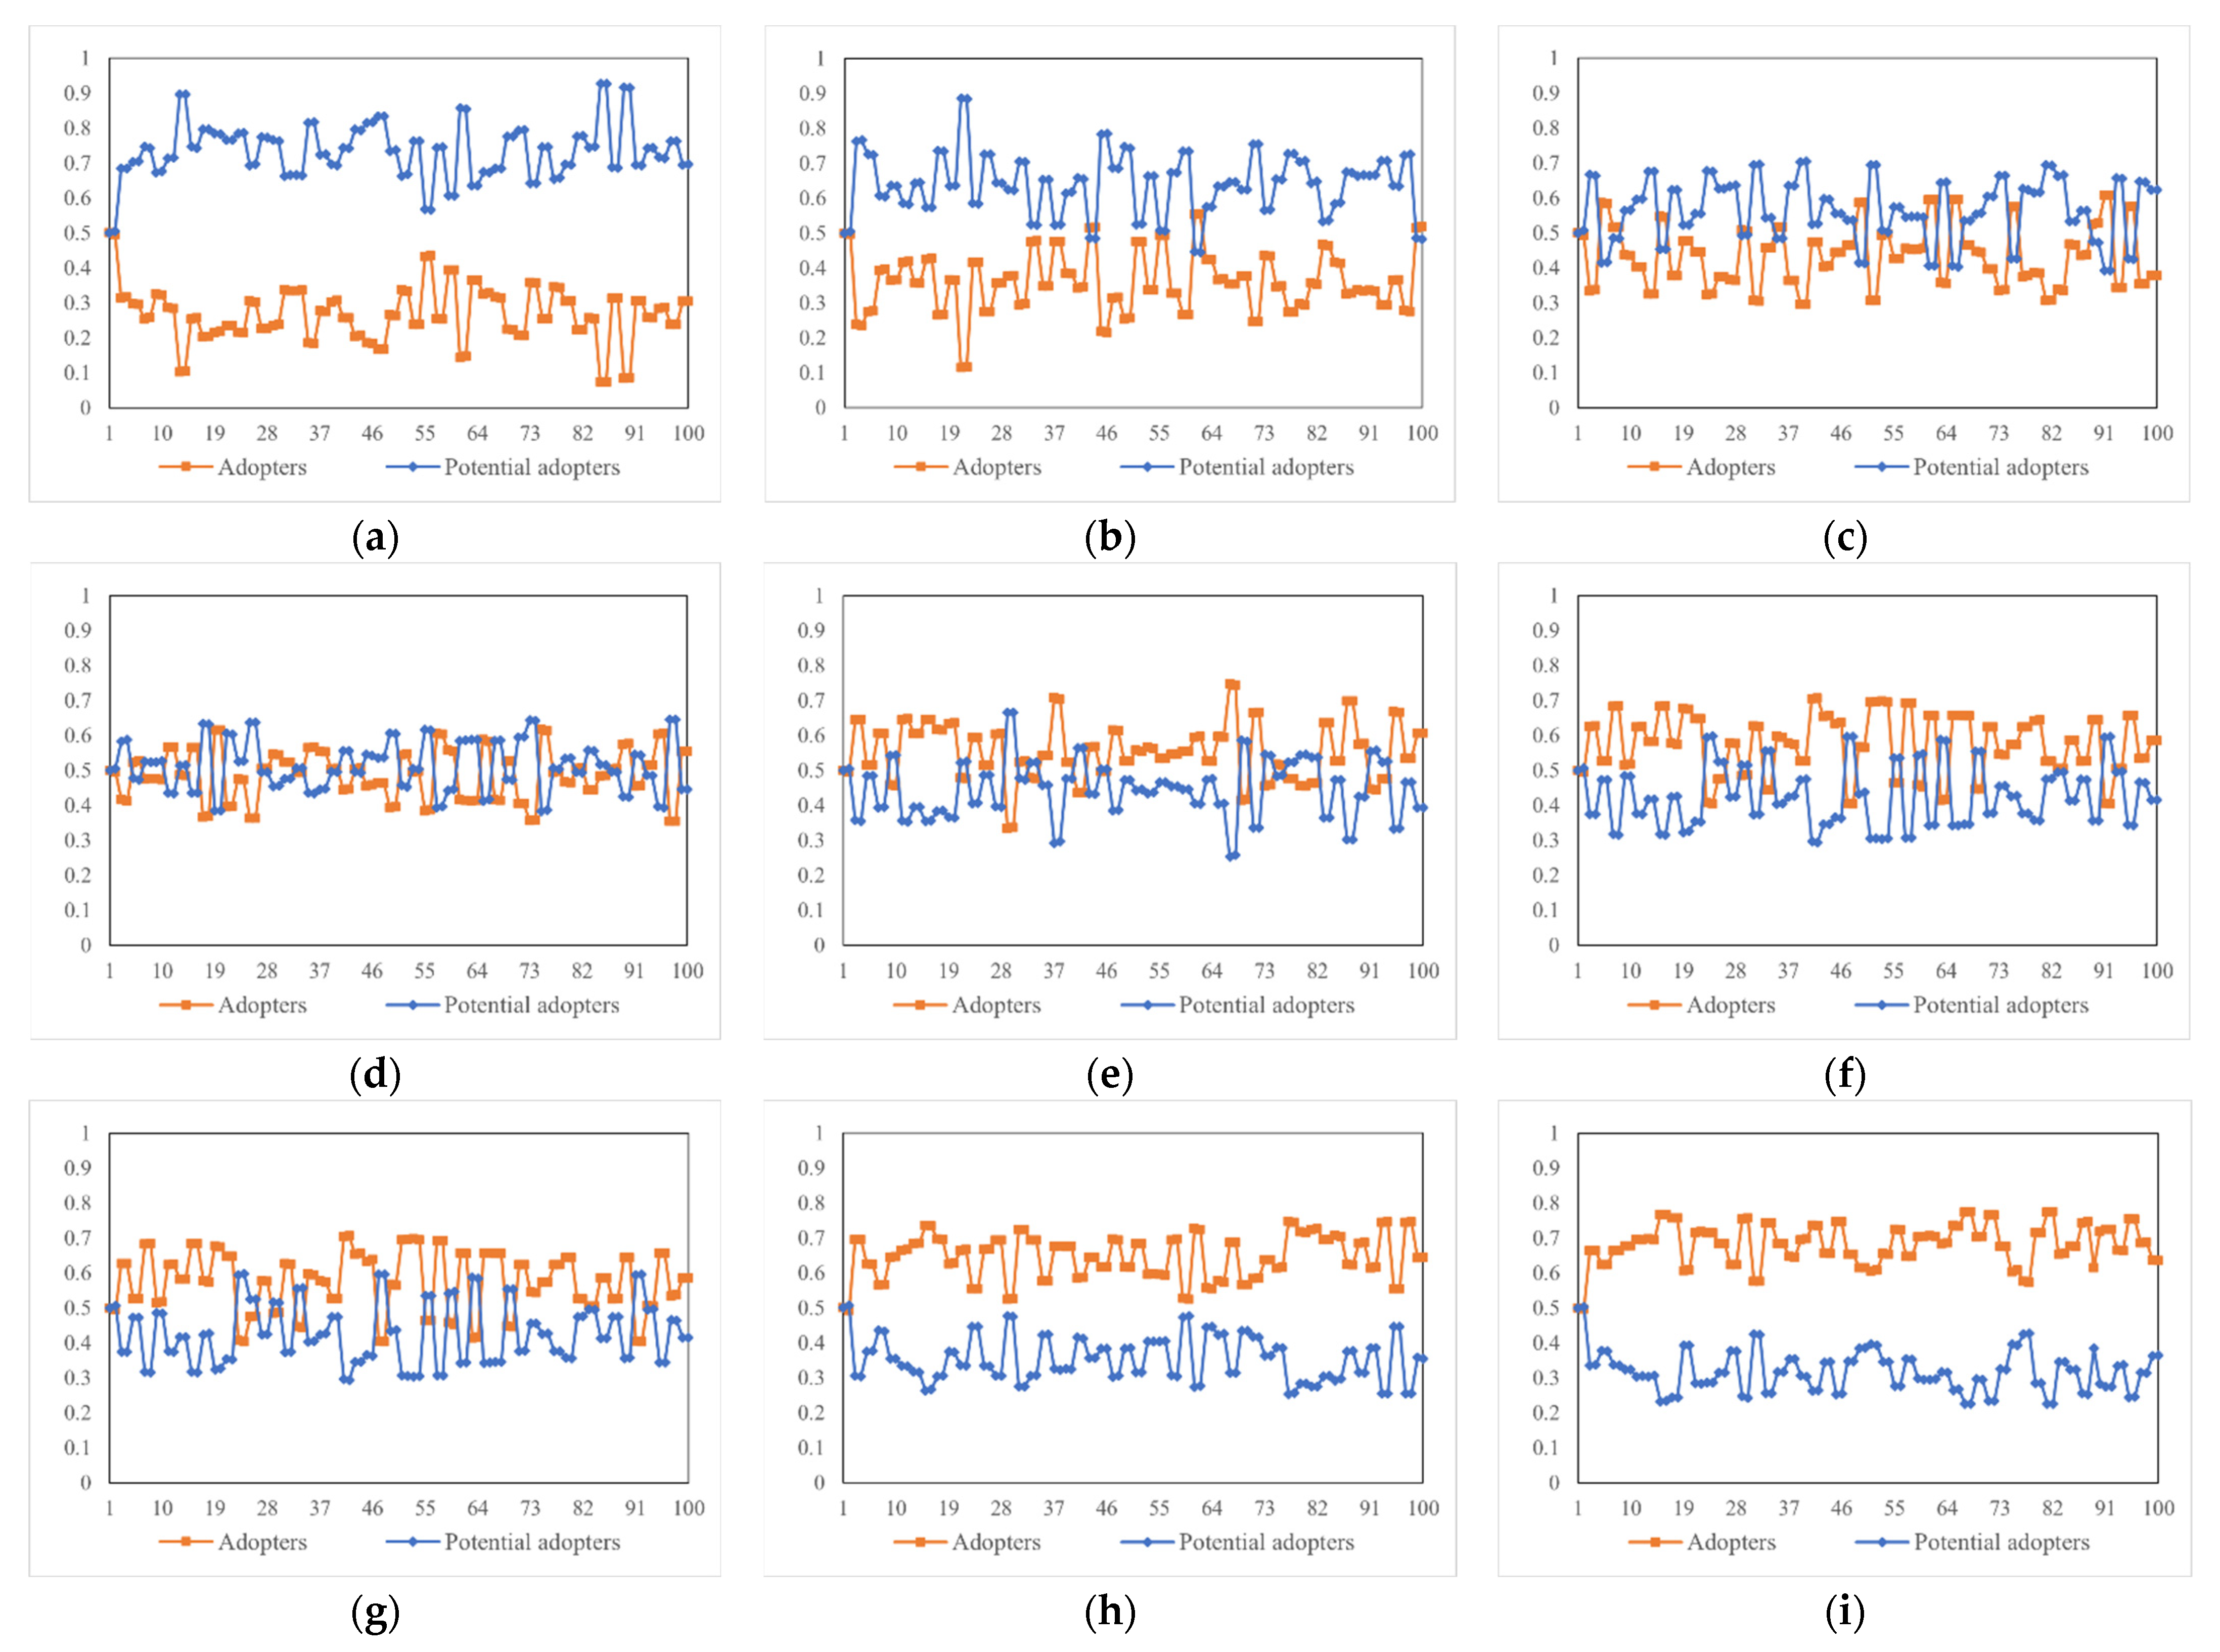
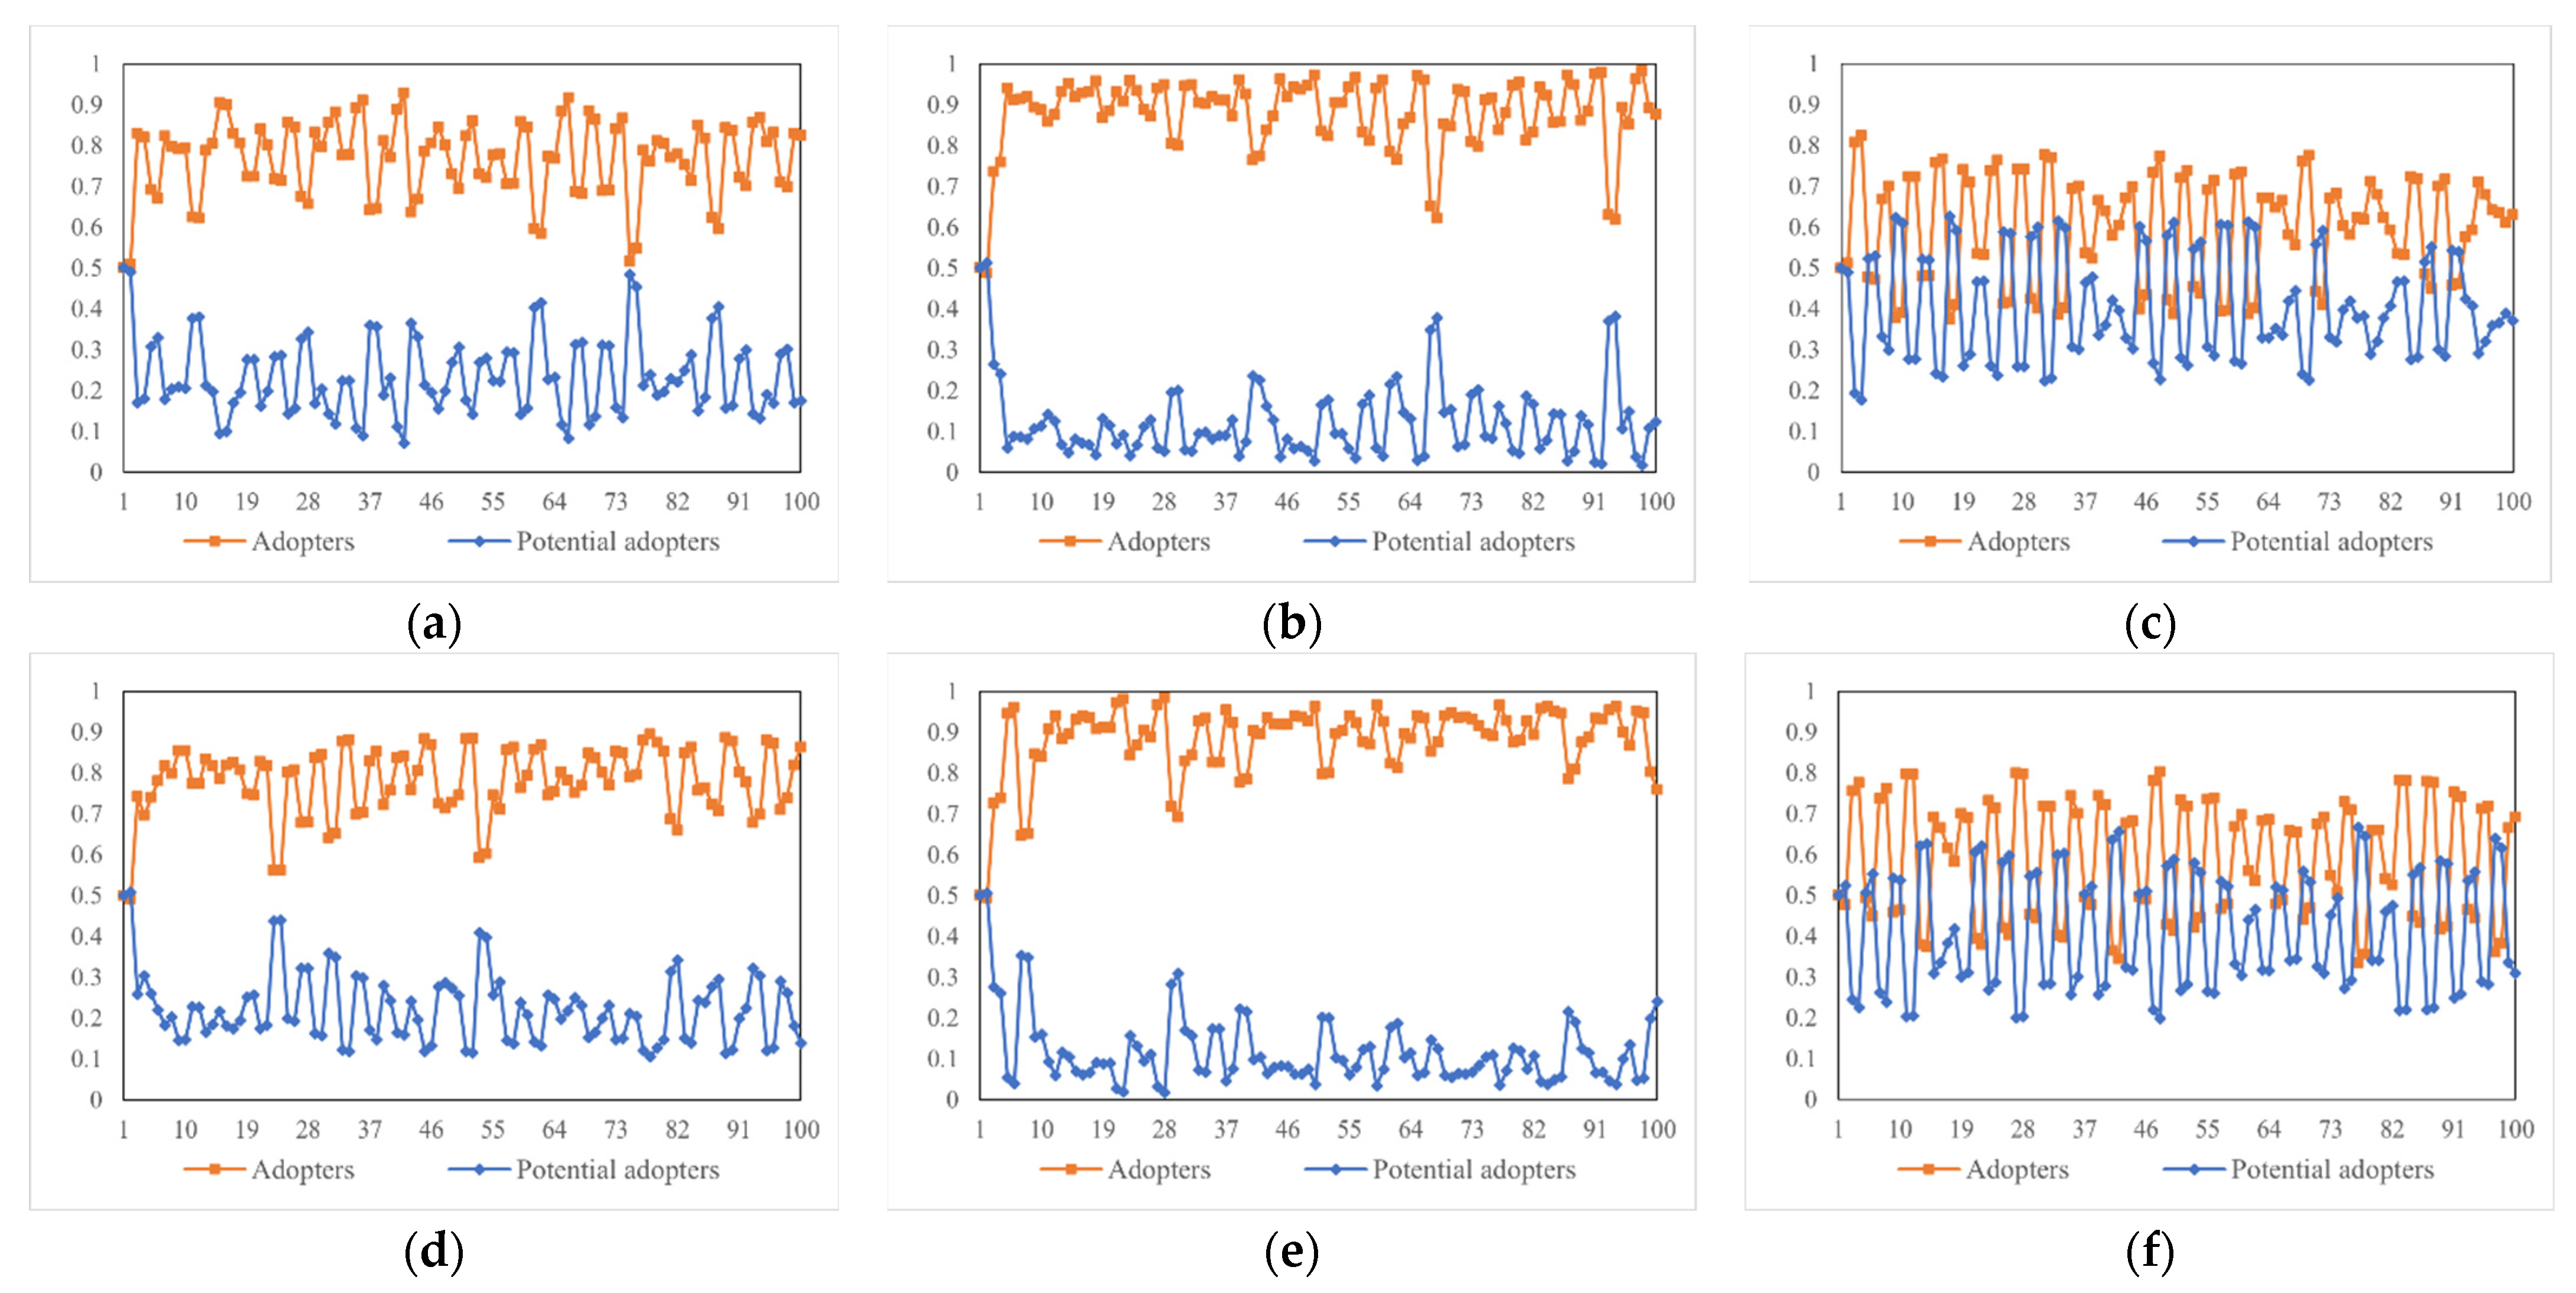
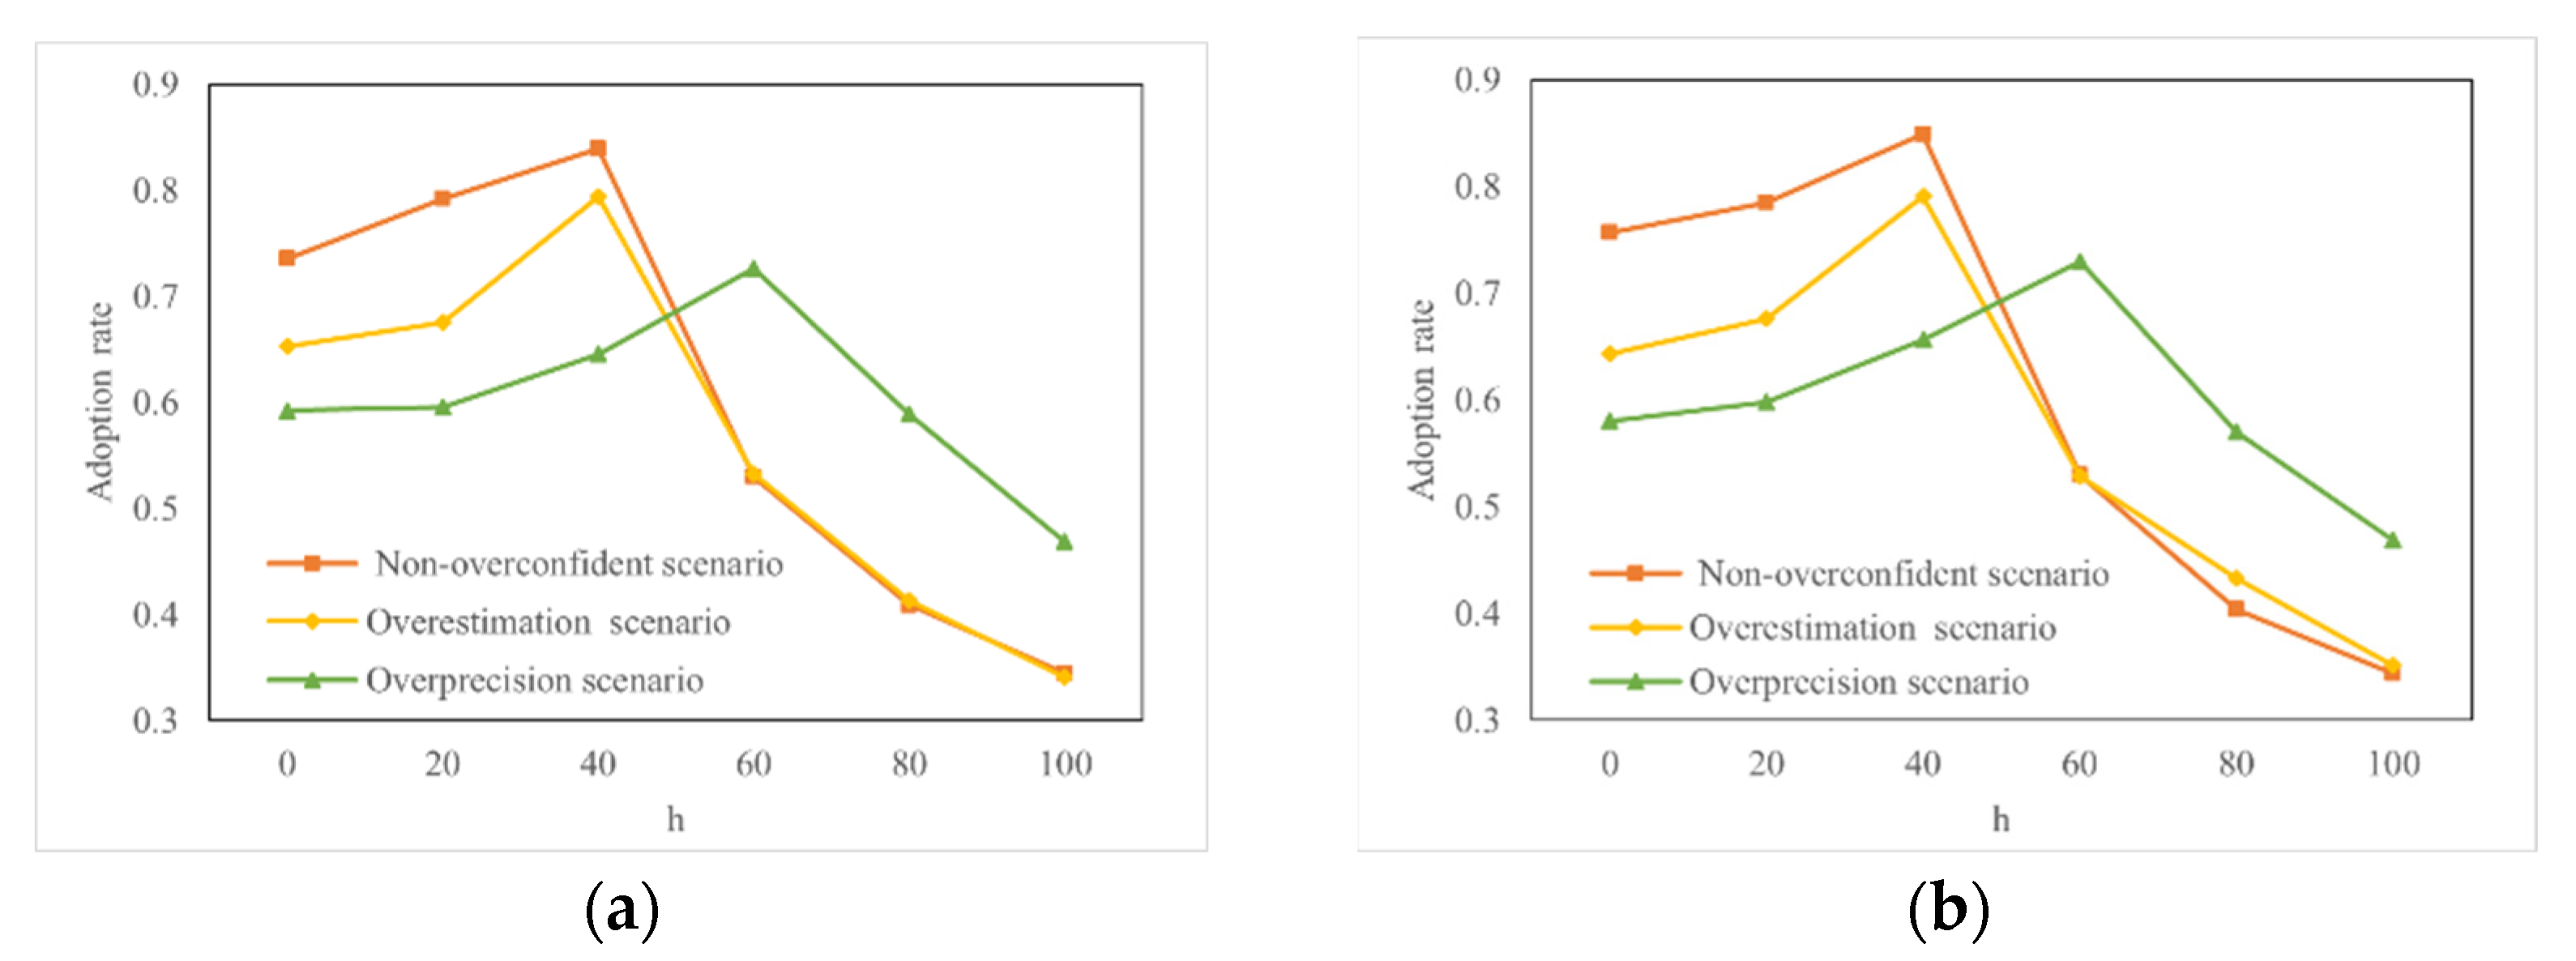
4.2. Parameters Related to Overconfidence

We ran a series of simulations to see how overestimation affects product dispersion in OSNs. The overestimate parameter k was set to progressively rise from 0 to 0.8, with a 0.1 step size. The simulation results (Figure 3) demonstrate that k affects the diffusion level positively. With the gradual increase of k , the evolutionary result gradually changed from the pattern of rejective dominance (as shown in Figure 3a–c), to the pattern of tit-for-tat (as shown in Figure 3d–f), and finally to the pattern of cooperative dominant (as shown in Figure 3g–i). Moreover, the decision-making volatility of consumers gradually changed from high (as shown in Figure 3a–c) to low (as shown in Figure 3g–i).
This demonstrates that overestimation is beneficial to enhancing product dissemination in OSNs and sustaining market stability. This conclusion is confirmed in the existing literature [5], and there are similar related research results in the finance field. Investors tend to overestimate the value of financial assets and, because of the “ limits of arbitrage”, this misevaluation is maintained in the short term.
Next, we changed the overprecision parameter β and reran the simulations to see how it would affect product diffusion in OSNs. As shown in Figure 4, the decision-making volatility of consumers gets smaller as β approaches to 1. As β goes from 0.1 to 1 , the volatility of the evolutionary process declines (as shown in Figure 4a–c). When β is 1, the variance of the estimated value is closest to the variance of actual value, and consumers make stable decisions and rational choices (as shown in Figure 4c). Then, as β increases from 1 to 10 , the volatility increases (as shown in Figure 4d–f). This shows that consumers are constantly changing their decision-making strategies. In the process of changing decision-making strategies, consumers doubt the benefits of decision-making, and the proportion of adoption continues to decline.
This shows that the closer the degree of overprecision is to 1, the more stable the market will be. That is to say, the closer the estimation of the variance of each consumer’s expected benefit of buying this product is to the real level (i.e., individuals are more rational), the more beneficial it is to product diffusion. For example, the live streaming economy prevails, but the return rate remains high. This is because some anchors with goods will exaggerate the efficacy of the product, which makes consumers overestimate the benefits of purchasing the product. However, consumers are disappointed after receiving the goods and return them. Therefore, anchors with goods should be practical and realistic when describing products and should not exaggerate too much to avoid consumers changing their purchase decisions when their expectations are inconsistent with reality.

4.3. Parameters Related to Network Effects

We ran a series of simulations under various overconfidence scenarios to investigate the impact of network effects intensity on product diffusion in OSNs. The network effects intensity parameter h was set to increase gradually from 20 to 60 with increments of 20 . The simulation results (Figure 5) show that only moderate intensity of network effects can promote product diffusion better. The overall trend of adoption ratio change is similar regardless of the global network effect or local network effect. With the increase of h , the adoption ratio increases first and then decreases. This shows that higher network effects intensity is not the best. Whether it is under global or local network effect, moderate network effect intensity can better promote product diffusion on the social network.
Does the network effects intensity have the same influence under different overconfidence scenarios? To answer this question, we conducted a set of simulations under different overconfidence scenarios and different network effects intensities. We adjusted parameters for the evolutionary game: b = 40 ,   c = 20 ,   d = 5 . The network effects intensity parameter h was set to increase gradually from 0 to 100 by increments of 20 . The simulation results (Figure 6) show a similar overall trend that the average adoption rate experienced a brief increase and then a decline. This corresponds to the previous result.
When h is small, the adoption proportion of the non-overconfidence scenario is the highest. With the increase of h , the adoption proportion of the overprecision scenario is highest. Therefore, when the network effects intensity of the social networks is low, enterprises should try to reduce the degree of consumers’ overconfidence. When it is high, they should try to improve the consumers’ overprecision but control their overestimation.

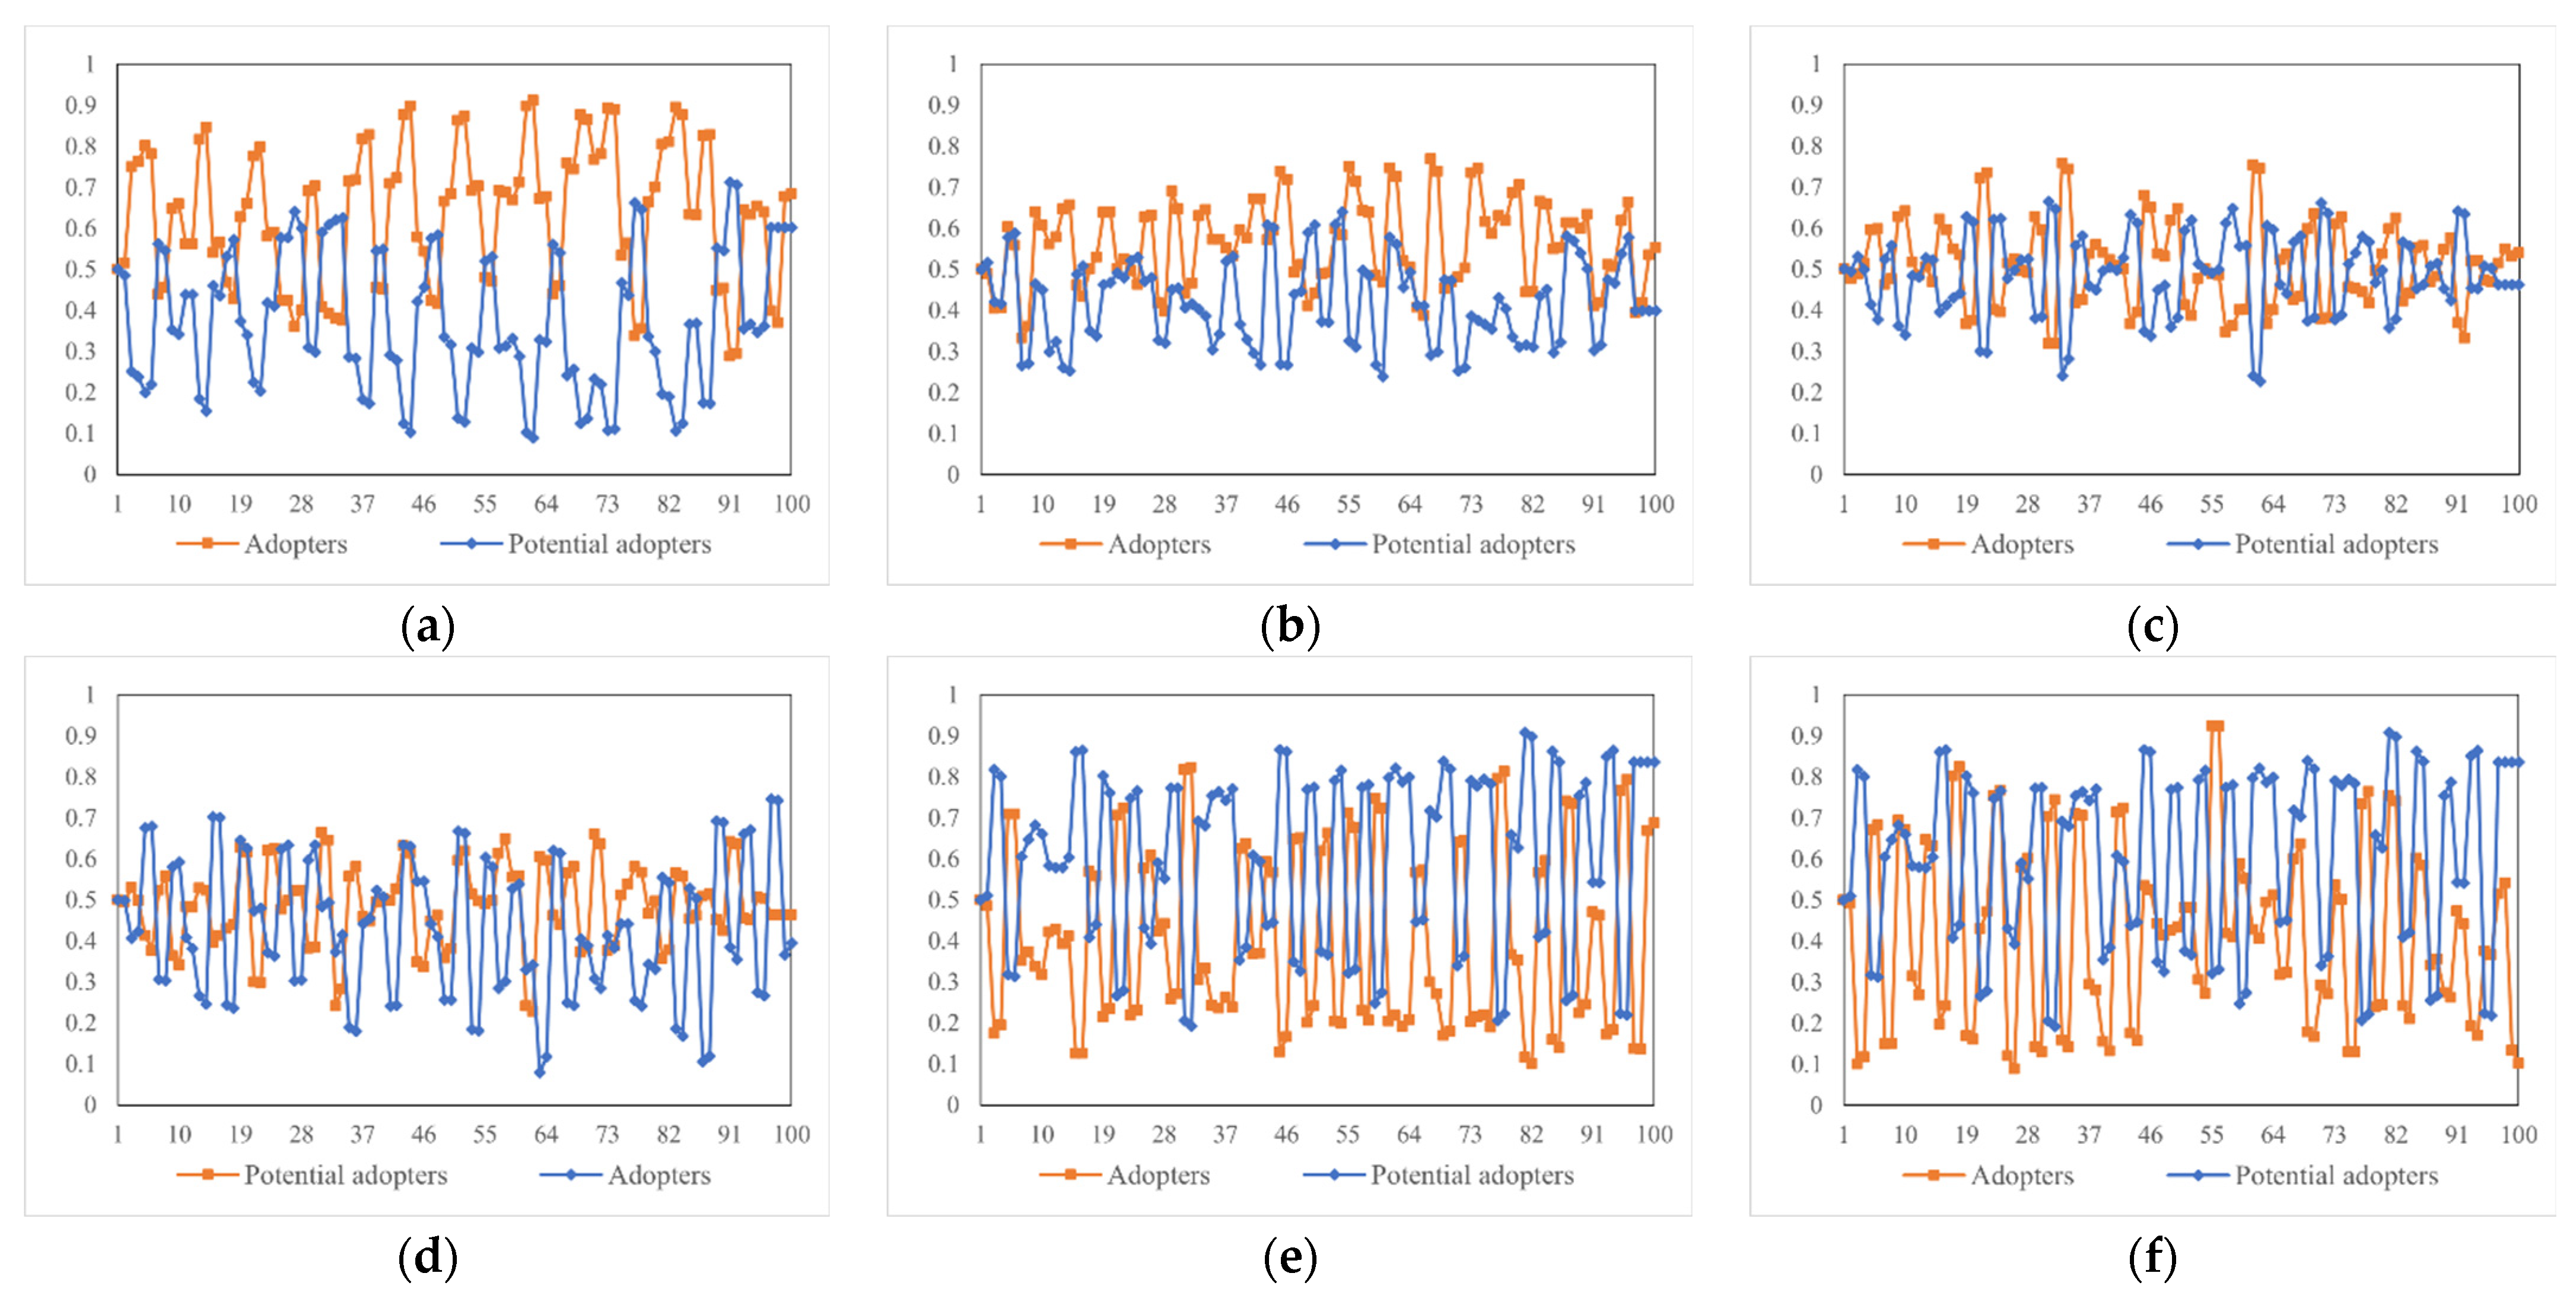
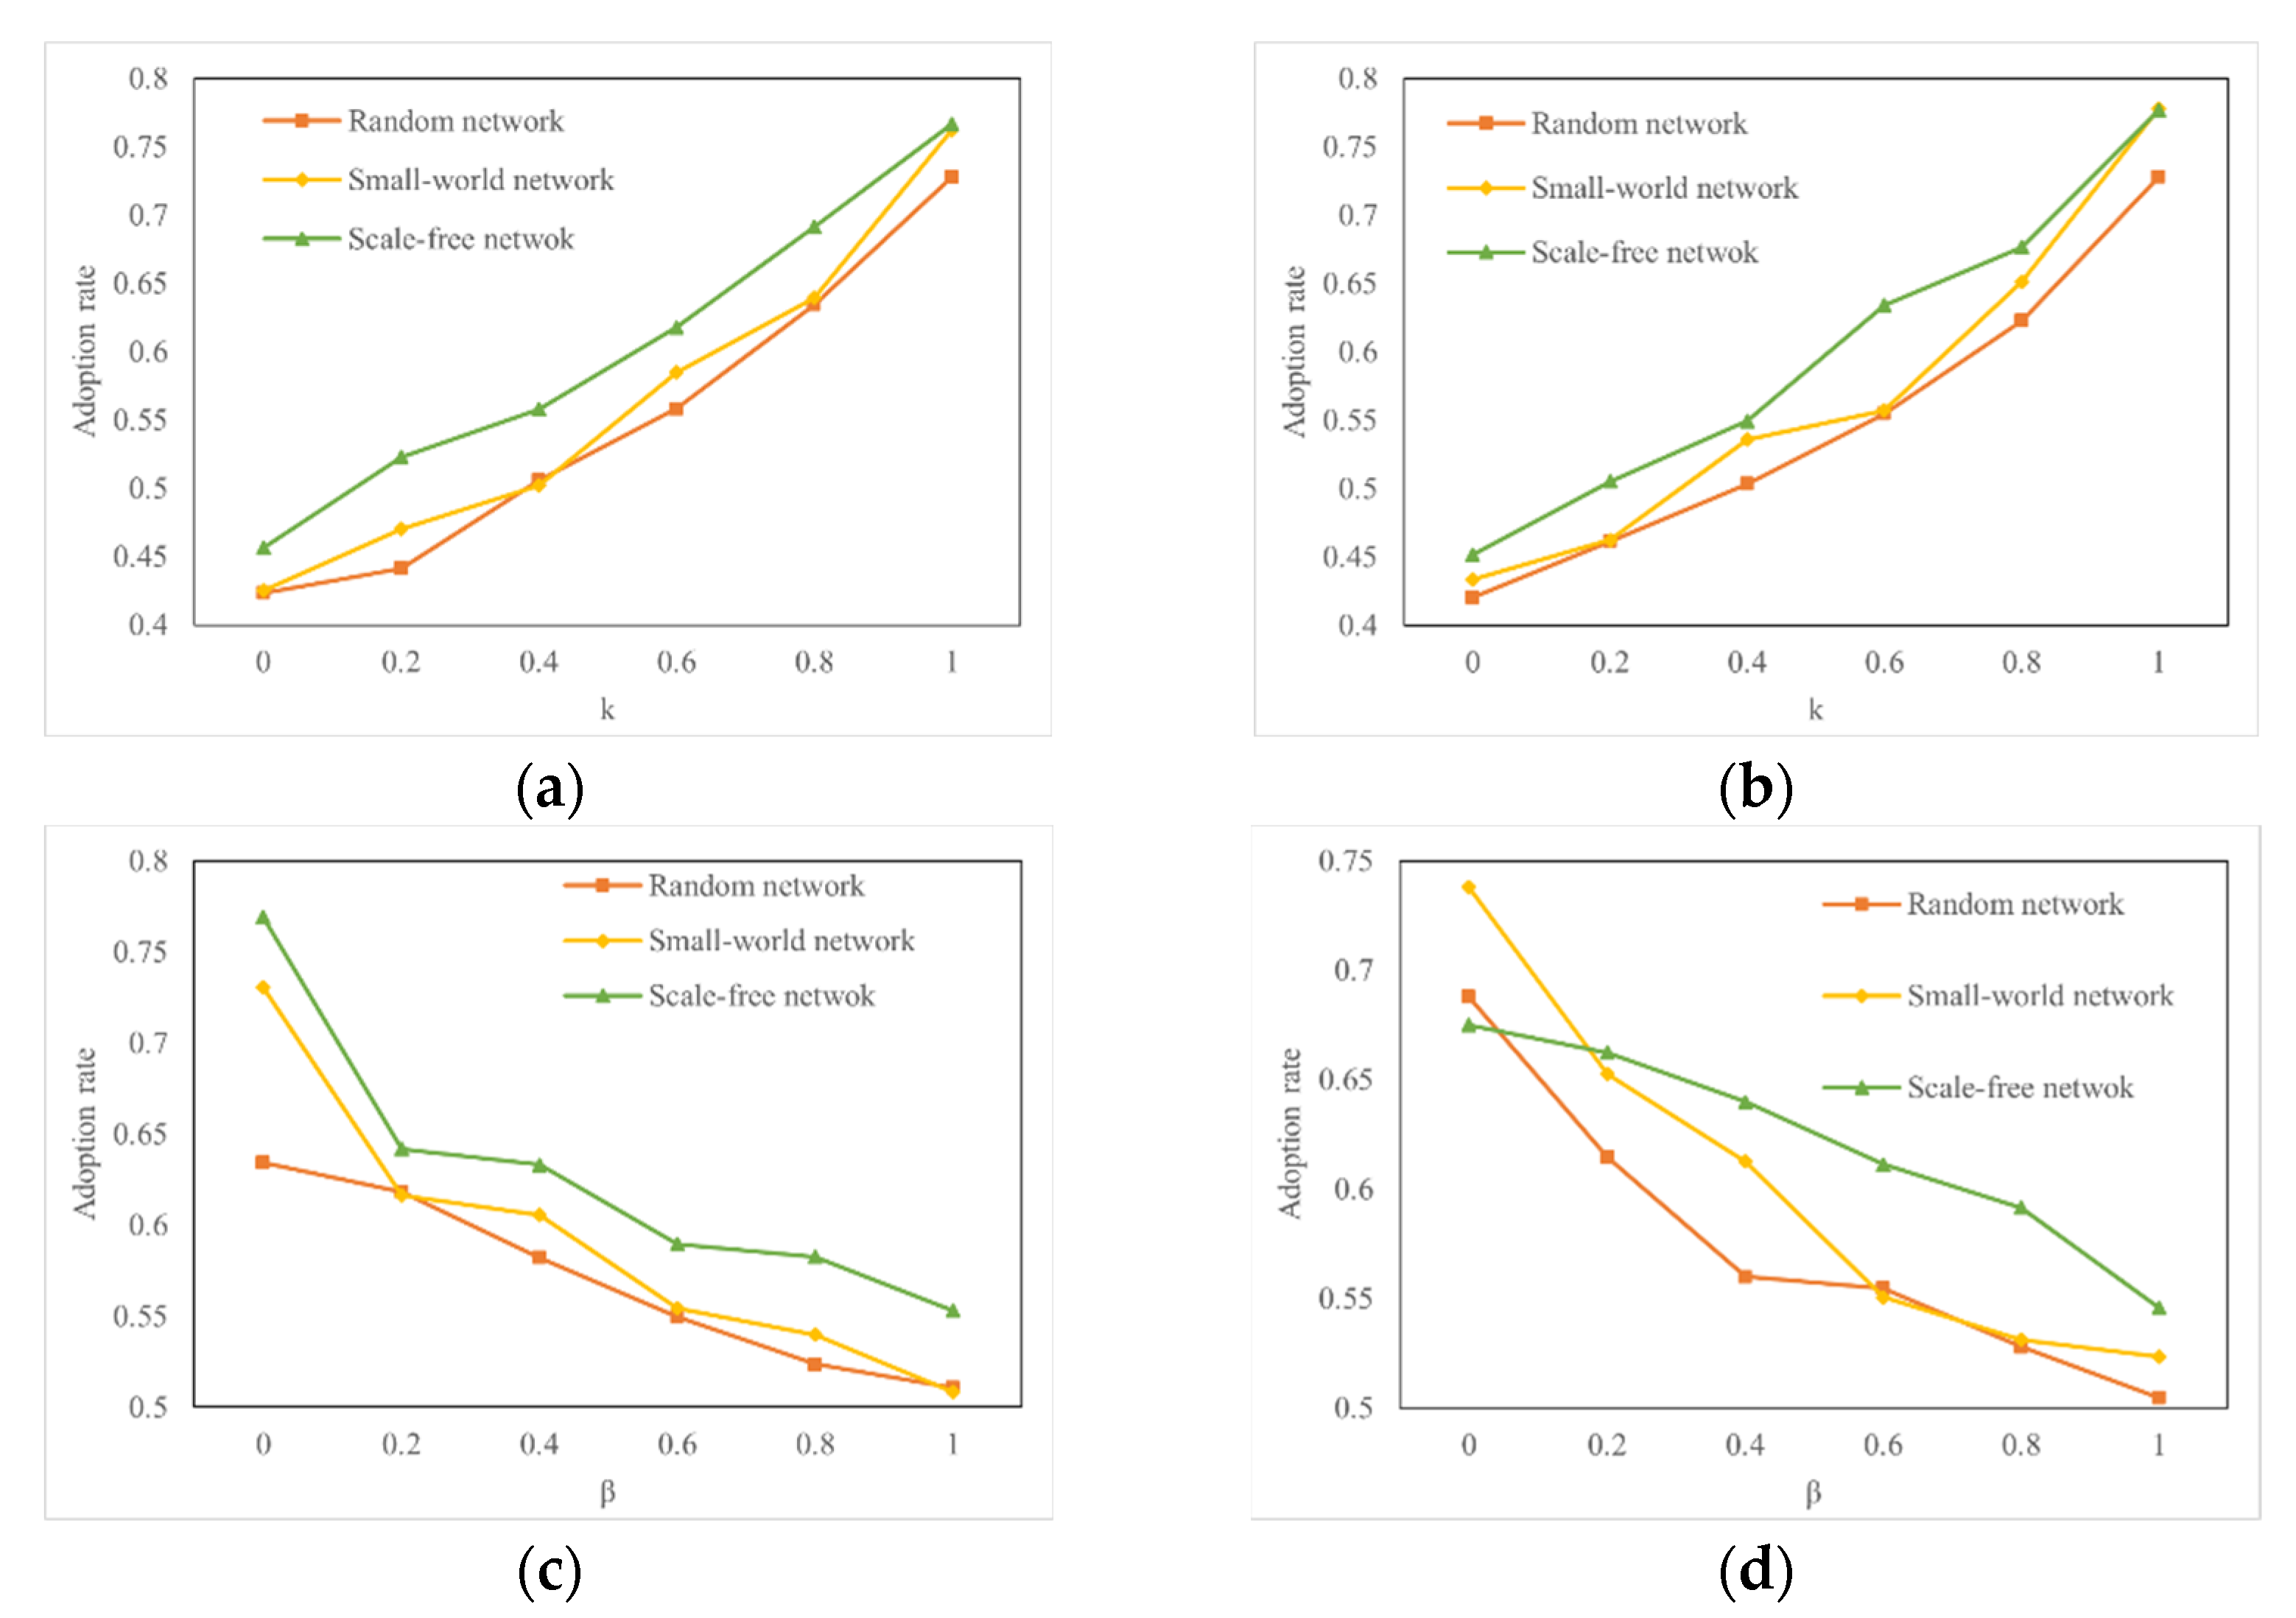
4.4. Parameters Related to Network Structure

To study the effect of network structure on product diffusion in OSNs, we conducted a set of simulations under different overconfidence scenarios, different intensity of network effects, and different network structures. We adjusted b = 40 ,   c = 25 ,   d = 5 ,   h = 40 , and k from 0 to 25 with increments of 5 under the overestimate scenario, and h = 60 and β from 0 to 1 under the overprecision scenario. The simulation results (Figure 7) show a similar overall trend; with the increase of k or β , the adoption ratio of the three network structures under global and local network effects gradually decreases, and the average adoption ratio of a scale-free network is always the highest. A small-world network is more susceptible to the impact of network effects. Under the overestimation scenario (as shown in Figure 7a,b), when β = 0 , the average adoption ratio in small world network is close to the random network, but with the increase of β , it is gradually close to the scale-free network. Under the overprecision scenario (as shown in Figure 7c,d), compared with the other two kinds of network structures, the adoption ratio of the small-world network changes more.
This shows that a scale-free network is more conducive to the diffusion of products in OSNs, while a small-world network is more susceptible to overconfidence and network effect. This is because hub nodes in a scale-free network provide sufficient influence for product diffusion. Hub nodes interact with a large number of neighbors, and their behaviors and decisions may quickly affect their neighbors and promote the diffusion of products in OSNs. However, in the small-world network, the connection path between node users is short and the influence is limited. Therefore, overconfidence and network effects both affect the fluctuation of product diffusion in a small-world network.

5. Conclusions

This paper developed and implemented a simulation model based on multi-agent modeling and game theory, integrating overconfidence theory and network effect theory to simulate product diffusion in OSNs. To understand individual decision-making processes in product dissemination in OSNs, we first created a simulation model based on evolutionary game theory. Then, considering the impact of overconfidence and network effects, a multi-agent model of product dispersion in OSNs was built. Finally, simulation studies were used to explore the impact of overconfidence scenarios, network effects, and network structures on diffusion, which helps businesses advertise products.
We found that overestimation is profitable for improving the diffusion level of product diffusion in OSNs and maintaining market stability. However, the closer the degree of overprecision is to 1 (i.e., individuals are more rational), the more stable the market will be. Moderate network effect intensity can better promote product diffusion on the social network. When the network effect intensity is small, the non-overconfident scenario has the highest percentage of adoption. The overprecision scenario has the highest percentage of adoption where the network effect intensity is high. The scale-free network is more conducive to the diffusion of products in OSNs, while the small-world network is more susceptible to overconfidence and network effects.
Our findings offer several practical implications for businesses:
  • Enterprises should fully display the product information so that consumers have a proper overestimate of the benefits of buying the product. However, at the same time, enterprises should not exaggerate the utility of products too much, to prevent consumers from changing their purchase decisions when their expectations are inconsistent with reality.
  • Companies should not invest too much capital in enhancing network effects. Moderate promotion can yield high returns, but over-enhancing social network effects often backfires, for example by making consumers loathe them. When the social network effects intensity is low, enterprises should try to reduce the degree of overconfidence of consumers. When it is high, they should try to improve the overprecision of consumers but control their overestimation.
  • Enterprises should try to introduce influential KOLs (Key Opinion Leaders) into social networks to transform the small-world network into a scale-free network to achieve a higher level of product diffusion. This avoids fluctuations in consumer overconfidence and network effects on product proliferation.
We make two key contributions to theory:
  • The psychological effects (overconfidence) and network effects perspectives opened up an entirely new way of looking at product diffusion in OSNs. This study adds to the theoretical foundation for the new product diffusion model by including additional behavioral theories and complex network theories.
  • This research uncovered several different modeling strategies for complicated group behavior resulting from individual interaction. The micro-basis of the multi-agent simulation model was overconfidence theory, which was utilized to discover probable individual-level processes. This multi-method provides a fundamental framework for testing dynamic group behavior using a mix of a multi-agent method, network effects theory, and a psychological theory.
Overconfidence is a relatively recent psychological idea that deserves more research. This research served as a guide for using psychological theory and computer simulation to product dispersion, as well as offering assistance for new product marketing decisions. However, there are certain limitations to this paper. Personal preferences influence consumer decision-making, and including preference components in the evolutionary game simulation model requires more research. The rationale and resilience of parameter sets in the simulation system must be tested in this study, especially by merging several real-world scenarios. Furthermore, individuals’ underestimation of the utility of others has not been taken into account.

Author Contributions

Conceptualization, X.W.; Formal analysis, Q.L.; Funding acquisition, X.W.; Methodology, Y.Z.; Project administration, G.N.; Resources, X.W. and G.N.; Software, Y.Z.; Visualization, X.W. and Q.L.; Writing—original draft, X.W. and Q.L.; Writing—review & editing, Y.Z. All authors have read and agreed to the published version of the manuscript.

Funding

This work was supported in part by the China National Nature Science Fund under Grant No. 71601151, and in part by the Ministry of Education (MOE) in China through the Project of Humanities and Social Sciences under Grant No. 16YJC630131.

Institutional Review Board Statement

Not applicable.

Informed Consent Statement

Not applicable.

Data Availability Statement

Not applicable.

Acknowledgments

The suggestions of teachers in Wuhan University of Technology are of great help to this study.

Conflicts of Interest

The authors declare no conflict of interest.

Appendix A

Let p be the percentage of users who choose to adopt the product. The expected revenue of the adoption of product diffusion in OSNs can be expressed as follows:
E a = p ( b c ) + ( 1 p ) ( b c ) = b c
Meanwhile, the expected revenue of rejection is as follows:
E r = p ( b d )
The average benefit of this group is E ¯ :
E ¯ = p E a + ( 1 p ) E r
From dynamic replication, we find the state of the evolutionary system over time can be expressed as:
d p d t = p ( E a E ¯ ) = p ( 1 p ) ( E a E r ) = p ( 1 p ) [ b c p ( b d ) ]
Therefore, the evolutionary system has three possible solutions to game equilibrium.
p = 0 ,   1 ,   b c b d   ( p * = b c b d )
If 0 < p * < 1 are satisfied, we will find the equilibrium is at p = p * .
Corresponding to the real scene, we assume that b > c and b > d . So, to solve 0 < p * < 1 , it can be got that b c > 0 , b d > 0 , and b c < b d , i.e., b > c > d .

Appendix B

1. The code of Main model:
//Set the consumer’s initial strategies:
int n = people.size()/2;
for (int i = 0; i < n; i++){
▸        people.get(0).deliver(“potentialAdopters!”, people.get(i));
▸        }
for (int i = people.size()−50; i < people.size();i++){
▸        people.get(0).deliver(“adopters!”, people.get(i));
▸        }
2. The code of Person class:
//Calculate the global network effect
for(int i = 0; i < people.size(); i++){
           Person per = people.get(i);
           if(per.statechart.isStateActive(per.potentialAdopters)){
                     allRefuseNum++;
           }
}
pG = 1-(allRefuseNum*1.0)/neiNum;
for(int i = 0; i < people.size(); i++){
           Person per = people.get(i);
           int neiRefuseNum = 0;
           int neiNum = per.getConnectionsNumber();
//Calculate the local network effect
           if(neiNum>0){
                     for(Agent a: per.getConnections()){
                               if(((Person)a).statechart.isStateActive(per.potentialAdopters)){
                                        neiRefuseNum++;
                               }
                     }
                     pL = 1-(neiRefuseNum*1.0)/neiNum;
//Calculate the utility of agent
                     if(per.statechart.isStateActive(per.potentialAdopters)){
                               per.u = (1 + k)*b−c + h * pG;//Global network effect & Overestimation
                               //per.u = (1 + k)*b−c + h * pL;//Local network effect & Overestimation
                               //per.u = b + (y/z)*x−c + h * pG;//Global network effect & Overprecision
                               //per.u = b + (y/z)*x−c + h * pL;//Local network effect & Overprecision
                     }
                     if(per.statechart.isStateActive(per.adopters)){
                               per.u = pG *((1 + k) * b−d);//Global network effect & Overestimation
                               //per.u = pG *((1 + k) * b−d);//Local network effect & Overestimation
                               //per.u = pG *(b + (y/z) * x−d);//Global network effect & Overprecision
                               //per.u = pG *(b + (y/z) * x−d);//Local network effect & Overprecision
                     }
           }
}
3. The code of interaction rules between agents:
neiNum = this.getConnectionsNumber();
if(neiNum>0){
           boolean nei = false;
           for(Agent a: getConnections()){
                     if(Uj < ((Person)a).u){
                               Uj = ((Person)a).u;
                               nei = ((Person)a).statechart.isStateActive(adopters);
                     }
           }
           double proLmiate = 1/(1+Math.pow(Math.E, (this.utility—Uj)/n));
           if(random()<proLmiate){
                     if(nei&this.statechart.isStateActive(potentialAdopters)){
                               p21 = true;
                     }else if((!nei)&this.statechart.isStateActive(adopters)){
                               p12 = true;
                     }
           }
}

References

  1. Wang, Y.; Wang, J.; Wang, H.; Zhang, R.; Li, M. Users’ Mobility Enhances Information Diffusion in Online Social Networks. Inf. Sci. 2021, 546, 329–348. [Google Scholar] [CrossRef]
  2. Wu, Y.; Pan, L. SG-PAC: A stochastic game approach to generate personal privacy paradox access-control policies in social networks. Comput. Secur. 2021, 102, 102157. [Google Scholar] [CrossRef]
  3. Zhang, H.; Vorobeychik, Y. Empirically grounded agent-based models of innovation diffusion: A critical review. Artif. Intell. Rev. 2019, 52, 707–741. [Google Scholar] [CrossRef] [Green Version]
  4. Muller, E.; Peres, R. The effect of social networks structure on innovation performance: A review and directions for research. Int. J. Res. Mark. 2019, 36, 3–19. [Google Scholar] [CrossRef]
  5. Wei, X.; Zhang, Y.; Fan, Y.; Nie, G. Online Social Network Information Dissemination Integrating Overconfidence and Evolutionary Game Theory. IEEE. Access 2021, 9, 90061–90074. [Google Scholar] [CrossRef]
  6. Saxton, G.D.; Wang, L. The Social Network Effect: The Determinants of Giving Through Social Media. Nonprof. Volunt. Sec. 2014, 43, 850–868. [Google Scholar] [CrossRef]
  7. Oren, S.S.; Schwartz, R.G. Diffusion of new products in risk-sensitive markets. J. Forecast. 1988, 7, 273–287. [Google Scholar] [CrossRef]
  8. Starcke, K.; Brand, M. Decision making under stress: A selective review. Neurosci. Biobehav. Rev. 2012, 36, 1228–1248. [Google Scholar] [CrossRef]
  9. Li, K.; Cong, R.; Wu, T.; Wang, L. Bluffing promotes overconfidence on social networks. Sci. Rep. 2014, 4, 5491. [Google Scholar] [CrossRef] [Green Version]
  10. Song, P.; Xue, L.; Rai, A.; Zhang, C. The ecosystem of software platform: A study of asymmetric cross-side network effects and platform governance. MIS Q. 2018, 42, 121–142. [Google Scholar] [CrossRef]
  11. Gibbons, D.E. Network structure and innovation ambiguity effects on diffusion in dynamic organizational fields. Acad. Manag. J. 2004, 47, 938–951. [Google Scholar] [CrossRef] [Green Version]
  12. Tseng, F.C.; Pham, T.T.L.; Cheng, T.C.E.; Teng, C.I. Enhancing customer loyalty to mobile instant messaging: Perspectives of network effect and self-determination theories. Telemat. Inform. 2018, 35, 1133–1143. [Google Scholar] [CrossRef]
  13. Fu, W.; Wang, Q.; Zhao, X. The influence of platform service innovation on value co-creation activities and the network effect. J. Serv. Manag. 2017, 28, 348–388. [Google Scholar] [CrossRef]
  14. Bass, F.M. A new product growth for model consumer durables. Manag. Sci. 1969, 15, 215–227. [Google Scholar] [CrossRef]
  15. Dawid, H.; Decker, R.; Hermann, T.; Jahnke, H.; Klat, W.; König, R.; Stummer, C. Management science in the era of smart consumer products: Challenges and research perspectives. Cent. Eur. J. Oper. Res. 2017, 25, 203–230. [Google Scholar] [CrossRef] [Green Version]
  16. Zhou, L.; Lin, J.; Li, Y.; Zhang, Z. Innovation diffusion of mobile applications in social networks: A multi-agent system. Sustainability 2020, 12, 2884. [Google Scholar] [CrossRef] [Green Version]
  17. Moore, D.A.; Healy, P.J. The trouble with overconfidence. Psychol. Rev. 2008, 115, 502. [Google Scholar] [CrossRef] [Green Version]
  18. Malmendier, U.; Tate, G. CEO overconfidence and corporate investment. J. Financ. 2005, 60, 2661–2700. [Google Scholar] [CrossRef] [Green Version]
  19. Malmendier, U.; Tate, G. Who makes acquisitions? CEO overconfidence and the market’s reaction. J. Financ. Econ. 2008, 89, 20–43. [Google Scholar] [CrossRef] [Green Version]
  20. Chen, G.; Crossland, C.; Luo, S. Making the same mistake all over again: CEO overconfidence and corporate resistance to corrective feedback. Strateg. Manag. J. 2015, 36, 1513–1535. [Google Scholar] [CrossRef]
  21. Van den Steen, E. Overconfidence by Bayesian-rational agents. Manag. Sci. 2011, 57, 884–896. [Google Scholar] [CrossRef] [Green Version]
  22. Malmendier, U.; Della Vigna, S. Paying not to go to the gym. Am. Econ. Rev. 2006, 96, 694–719. [Google Scholar] [CrossRef]
  23. Xia, T.; Wang, Z.; Li, K. Financial literacy overconfidence and stock market participation. Soc. Indic. Res. 2014, 119, 1233–1245. [Google Scholar] [CrossRef]
  24. Dowling, K.; Stich, L.; Spann, M. An experimental analysis of overconfidence in tariff choice. Rev. Manag. Sci. 2020, 8, 1–23. [Google Scholar] [CrossRef]
  25. Li, K.; Szolnoki, A.; Cong, R.; Wang, L. The coevolution of overconfidence and bluffing in the resource competition game. Sci. Rep. 2016, 6, 21104. [Google Scholar] [CrossRef] [Green Version]
  26. Xiang, Z.; Xu, M. Dynamic Game Strategies of a Two-stage Remanufacturing Closed-loop Supply Chain Considering Big Data Marketing, Technological Innovation and Overconfidence. Comput. Ind. Eng. 2020, 145, 106538. [Google Scholar] [CrossRef]
  27. Katz, M.L.; Shapiro, C. Network externalities, competition, and compatibility. Am. Econ. Rev. 1985, 75, 424–440. [Google Scholar]
  28. Niemczyk, J.; Trzaska, R.; Wilczyński, M.; Borowski, K. Business Models 4.0 Using Network Effects: Case Study of the Cyfrowy Polsat Group. Sustainability 2021, 13, 11570. [Google Scholar] [CrossRef]
  29. Tseng, F.C.; Teng, C.I. Carefulness matters: Consumer responses to short message service advertising. Int. J. Electron. Comm. 2016, 20, 525–550. [Google Scholar] [CrossRef]
  30. Parker, G.G.; Van Alstyne, M.W. Two-Sided Network Effects: A Theory of Information Product Design. Manage. Sci. 2005, 51, 1494–1504. [Google Scholar] [CrossRef] [Green Version]
  31. Sundquist, A.; Bigdeli, S.; Jalili, R.; Druzin, M.L.; Waller, S.; Pullen, K.M.; Ronaghi, M. Bacterial flora-typing with targeted, chip-based Pyrosequencing. BMC. Microbiol. 2007, 7, 108. [Google Scholar] [CrossRef] [PubMed] [Green Version]
  32. Zhou, Q.; Yang, F. Innovation Diffusion with Network Effects and Band-wagon Effects Based on Complex Networks. WHICEB 2020 Proc. 2020, 23, 546–555. Available online: https://aisel.aisnet.org/whiceb2020/23 (accessed on 7 May 2020).
  33. Katona, Z.; Zubcsek, P.P.; Sarvary, M. Network effects and personal influences: The diffusion of an online social network. J. Mark. Res. 2011, 48, 425–443. [Google Scholar] [CrossRef] [Green Version]
  34. Kiesling, E.; Günther, M.; Stummer, C.; Wakolbinger, L.M. Agent-based simulation of innovation diffusion: A review. Cent. Eur. J. Oper. Res. 2012, 20, 183–230. [Google Scholar] [CrossRef]
  35. Jiang, G.; Tadikamalla, P.R.; Shang, J.; Zhao, L. Impacts of knowledge on online brand success: An agent-based model for online market share enhancement. Eur. J. Oper. Res. 2016, 248, 1093–1103. [Google Scholar] [CrossRef]
  36. Stummer, C.; Kiesling, E.; Günther, M.; Vetschera, R. Innovation diffusion of repeat purchase products in a competitive market: An agent-based simulation approach. Eur. J. Oper. Res. 2015, 245, 157–167. [Google Scholar] [CrossRef]
  37. Bohlmann, J.D.; Calantone, R.J.; Zhao, M. The Effects of Market Network Heterogeneity on Innovation Diffusion: An Agent-Based Modeling Approach. J. Prod. Innov. Manag. 2010, 27, 741–760. [Google Scholar] [CrossRef]
  38. Jiang, G.; Feng, X.; Liu, W.; Liu, X. Clicking position and user posting behavior in online review systems: A data-driven agent-based modeling approach. Inf. Sci. 2020, 512, 161–174. [Google Scholar] [CrossRef]
  39. Berger, T. Agent-based spatial models applied to agriculture: A simulation tool for technology diffusion, resource use changes and policy analysis. Agric. Econ. 2001, 25, 245–260. [Google Scholar] [CrossRef]
  40. Zhang, Q.; Wang, H.; Feng, Z. Three-Sided Matching Game Based Joint Bandwidth and Caching Resource Allocation for UAVs. In Proceedings of the 2021 IEEE/CIC International Conference on Communications in China (ICCC), Xiamen, China, 28–30 July 2021; IEEE: New York, NY, USA, 2021. [Google Scholar] [CrossRef]
  41. Rocha, A.B.D.; Salomão, G.M. Environmental policy regulation and corporate compliance in evolutionary game models with well-mixed and structured populations. Eur. J. Oper. Res. 2019, 279, 486–501. [Google Scholar] [CrossRef]
  42. Shi, Y.; Han, B.; Zeng, Y. Simulating policy interventions in the interfirm diffusion of low-carbon technologies: An agent-based evolutionary game model. J. Clean. Prod. 2019, 250, 119449. [Google Scholar] [CrossRef]
  43. Bryson, J.J.; Ando, Y.; Lehmann, H. Agent-based modelling as scientific method: A case study analysing primate social behaviour. Philos. Trans. R. Soc. B Biol. Sci. 2007, 362, 1685–1699. [Google Scholar] [CrossRef] [PubMed] [Green Version]
  44. Joseph, J.; Gaba, V. Organizational structure, information processing, and decision-making: A retrospective and road map for research. Acad. Manag. Ann. 2020, 14, 267–302. [Google Scholar] [CrossRef]
  45. Delaram, J.; Houshamand, M.; Ashtiani, F.; Valilai, O.F. A utility-based matching mechanism for stable and optimal resource allocation in cloud manufacturing platforms using deferred acceptance algorithm. J. Manuf. Syst. 2021, 60, 569–584. [Google Scholar] [CrossRef]
  46. Hann, I.H.; Hui, K.L.; Lee, S.Y.T.; Png, I.P. Overcoming online information privacy concerns: An information-processing theory approach. J. Manag. Inf. Syst. 2007, 24, 13–42. [Google Scholar] [CrossRef]
  47. Dellarocas, C. Strategic manipulation of internet opinion forums: Implications for consumers and firms. Manag. Sci. 2006, 52, 1577–1593. [Google Scholar] [CrossRef] [Green Version]
  48. Yang, H.X.; Tian, L. Enhancement of cooperation through conformity-driven reproductive ability. Chaos Solitons Fractals 2017, 103, 159–162. [Google Scholar] [CrossRef] [Green Version]
  49. Szabó, G.; Tőke, C. Evolutionary prisoner’s dilemma game on a square lattice. Phys. Rev. E 1998, 58, 69. [Google Scholar] [CrossRef] [Green Version]
  50. Knoeri, C.; Binder, C.R.; Althaus, H.J. An agent operationalization approach for context specific agent-based modeling. JASSS-J. Artif. Soc. S 2011, 14, 4. [Google Scholar] [CrossRef] [Green Version]
  51. Du, W.B.; Cao, X.B.; Hu, M.B.; Yang, H.X.; Zhou, H. Effects of expectation and noise on evolutionary games. Phys. A 2009, 388, 2215–2220. [Google Scholar] [CrossRef]
  52. Mäs, M.; Nax, H.H. A behavioral study of “noise” in coordination games. J. Econ. Theory 2016, 162, 195–208. [Google Scholar] [CrossRef] [Green Version]
Figure 1. The state transition rules.
Sustainability 14 06589 g001
Figure 2. Internal validation indicates simulation model conformance with the conceptual model. (a) the adoption rate increases with c decreasing; (b) consumers will choose to buy the product and the adoption rate will approach 1 over time if d is very large.
Sustainability 14 06589 g002
Figure 3. The influence of overestimation on product diffusion in OSNs. (a) k = 0; (b) k = 0.1; (c) k = 0.2; (d) k = 0.3; (e) k = 0.4; (f) k = 0.5; (g) k = 0.6; (h) k = 0.7; (i) k = 0.8.
Sustainability 14 06589 g003
Figure 4. The influence of overprecision on product diffusion in OSNs: (a) β = 0.1; (b) β = 0.5; (c) β = 1; (d) β = 4; (e) β = 7; (f) β = 10.
Sustainability 14 06589 g004
Figure 5. The influence of the network effects intensity on product diffusion in OSNs: (a) h = 20 under local network effect; (b) h = 40 under local network effect; (c) h = 60 under local network effect; (d) h = 20 under global network effect; (e) h = 40 under global network effect; (f) h = 60 under global network effect.
Sustainability 14 06589 g005
Figure 6. The influence of network effects on product diffusion in OSNs under different overconfidence scenarios: (a) global network effect; (b) local network effect.
Sustainability 14 06589 g006
Figure 7. The influence of network structure on product diffusion in OSNs: (a) overestimation scenario under global network effect; (b) overestimation scenario under local network effect; (c) overprecision scenario under global network effect; (d) overprecision scenario under local network effect.
Sustainability 14 06589 g007
Table 1. Game payoff matrix for consumer interaction.
Player 1Player 2
AdoptionRejection
Adoption b c ,   b c b c ,   b d
Rejection b d , b c 0 ,   0
Table 2. Default settings of parameters in the experimental system.
No.ParameterDescriptionDefault
1Network-typeType of networkSmall-world
2 b Value of b in Table 155
3 c Value of c in Table 135
4 d Value of d in Table 115
5 p Percentage of users holding an adoption strategy0.5
6 n Information noise0.1
7 k The overestimation parameter0
8 β The overprecision parameter1
9 h The network effects intensity100
Publisher’s Note: MDPI stays neutral with regard to jurisdictional claims in published maps and institutional affiliations.

