Article

Perceived Climate Change and Determinants of Adaptation Responses by Smallholder Farmers in Central Ethiopia

1
Department of Plant Sciences, College of Agriculture and Natural Resources, Salale University, Fiche P.O. Box 245, Ethiopia
2
International Maize and Wheat Improvement Center (CIMMYT), Addis Ababa P.O. Box 5689, Ethiopia
3
Stichting Wageningen Research (SWR) Ethiopia, Bole Sub-City, Wereda 9, Addis Ababa P.O. Box 30912, Ethiopia
4
Department of Crop Production, Faculty of Agriculture, University of Eswatini, Luyengo P.O. Box M205, Eswatini
5
Ethiopian Institute of Agricultural Research, Holeta Agricultural Research Center, Holeta P.O. Box 2003, Ethiopia
*
Author to whom correspondence should be addressed.
Sustainability 2022, 14(11), 6590; https://doi.org/10.3390/su14116590
Submission received: 24 February 2022 / Revised: 16 May 2022 / Accepted: 24 May 2022 / Published: 27 May 2022

Abstract

:
Climate change is a global phenomenon but disproportionately affects smallholder farmers, prompting them to use various coping and adaptation strategies to counter the problem. This study aimed to examine the trends of climate parameters, assess farmers’ perception of climate change, and identify the strategies of adaptation measures in central Ethiopia. Climate data were obtained from the National Meteorological Agency. Survey data were collected from 120 randomly selected households in 2017 and complemented with focus group discussions. The Mann–Kendall approach was used to detect climate trends, while a rainfall anomaly was calculated using the rainfall anomaly index. Multinomial logit model was used to examine determinants of farmers’ adaptation to the perceived change. In most of the cases, farmers’ perceptions were in accordance with climate trend analyses. Farmers used crop diversification, adjustments of planting dates, destocking of livestock, seasonal migration, crop rotation, and climate information services to adapt to climate-related shocks. Empirical results showed that the age and education of the household heads, family size, access to extension services, and farm and nonfarm incomes had a significant association with the adaptation practices farmers took. The existence of strong correlations between the demographic, socio-institutional variables, and the choice of adaptation strategies suggests the need to strengthen local institutions to enhance the adaptation of smallholder farmers to climate change.

1. Introduction

Scientific evidence indicates that the earth’s climate is rapidly changing, owing to increases in greenhouse gas emissions. Climate change is a global challenge affecting human beings and their socioeconomic activities, health, livelihood, and food security [1,2]. Developing countries and regions are more vulnerable to the impacts of climate change than developed ones [3]. Thus, rural farmers in sub-Saharan African (SSA) countries are likely to be more vulnerable to climate change than other regions, particularly because of compounding challenges of poverty, low infrastructural and technological developments, and the high dependence on rain-fed agriculture [4,5].
Ethiopia’s geographical location within the tropics and extremes of topography in combination with the low adaptive capacity of the people and their resources result in a high degree of vulnerability to the adverse impacts of climate change [6,7]. A strong link has been observed between climate variations and the overall performance of the country’s economy, mainly due to the direct impacts of climate variability on agriculture and the links to other sectors of the economy [8].
In central Ethiopia, climate change/variability is manifested through erratic rainfall, frequent droughts, reduced surface water resources, soil erosion, floods, water-logging, and variable diurnal temperatures [9]. The delay in the onset and early cessation of rainfall thereby shortens the length of the growing period in central Ethiopia [10,11,12,13]. The extent to which farmers feel the impacts of these and other forms of climate shocks depends largely on the degree of adaptation [14]. Adaptation practices adopted by smallholder farmers could lessen the adverse effects and take advantage of the benefits of changes in climate variables [15].
Farmers in Ethiopia consider different options to cope with and/or adapt to climate change. The most common adaptation options include household income source diversification, soil and water conservation, crop diversification, adjusting planting dates, destocking, seasonal migration, crop rotation, and accessing climate information services to determine informed decisions [16]. However, the adaptive capacity of farmers is determined by demographic, socioeconomic, and institutional factors, such as access to market and climate information, education, age, farming experience, gender, access to extension and credit services, off-/nonfarm employment opportunities, water storage facilities, and farm size [17,18,19]. Studies have been conducted on the climate change impacts, adaptation, and determinants of adaptation in the central rift valley of Ethiopia [20,21,22,23]. In the study area, there is a lack of information on the current climate change impacts and the low adaptive capacity of farmers. This study attempted to bridge the gaps among the demographic, socioeconomic, and institutional factors affecting farmers’ choice of climate change adaptation measures (which include selecting new species, cultivars, use of supplemental irrigation, drainage, new methods of land preparations, mulching, intercropping, and changing the type and amount of fertilizer used).
Understanding the degree of climate change, how these changes are perceived by smallholder farmers, and factors influencing smallholder farmers’ adaptation decisions is important in designing appropriate policies to promote effective and location-specific adaptation strategies in the agricultural sector [24]. In this regard, farmers’ adaptation measures towards the changing climate, as well as factors affecting their choice of adaptation strategies at the local level, are important starting points for designing and implementing evidence-based adaptation strategies. Since the extent of farmers’ exposure to climate change stresses and their adaptation strategies are not well documented in central Ethiopia, this study was conducted to examine the perception of households on climate change vis à vis measured climate trends to identify adaptation options employed by farmers and to analyze factors affecting farmers’ choices of adaptation measures to climate change. The remaining sections are structured as follows: Section 2 describes the materials and methods, including the study area, data collected, and approaches used in the data analysis. Section 3 presents and discusses analysis results. Section 4 draws conclusions.

2. Materials and Methods

2.1. Description of the Study Area

The study was conducted in two regional states of Ethiopia using three administrative zones: the North Shewa zone of the Amhara regional state, North Shewa, and West Shewa zones of the Oromia regional state (Figure 1). The North Shewa zone of the Amhara region is located between 8°37′37′’to 10°45′14′’ E and 38°40′13′’ to 40°10′ 8” N at an altitudinal range from 606 to 3831 masl, which receives an average annual rainfall of 920 mm, while average minimum and maximum temperatures vary from 2.4 °C in November to 23.3 °C in June. Likewise, the North Shewa zone of the Oromia region is located between 8°48′32” to 10°23′57” E and 37°30′27” to 39°30′27” N at an altitudinal range from 880 to 3554 masl, which receives an average annual rainfall of 1200 mm with average minimum and maximum temperatures of 6 and 21 °C, respectively. The West Shewa zone is located between 8°11′5” to 9°50′42” E and 37°4′22” to 38°49′25” N at an altitudinal range from 916 to 3602 masl, which receives an average annual rainfall of 1100 mm with average minimum and maximum temperature of 11 and 26 °C, respectively.
Central Ethiopia is characterized by bimodal rainfall patterns (Belg and Kiremt). The majority of the total rainfall happens from June to September. Mixed farming (crops and livestock) is the major economic activity. Almost all field crops are grown under rain-fed conditions during the main season [10]. The central highlands of Ethiopia were selected for this particular study because previous studies were focused only on parts of the central highlands specifically in one administrative region (the Amhara regional state) and on a few meteorological stations where farmers’ perceptions of the changing climate have not been covered equally in a part of the Oromia regional state, which also is a part of the central highlands of Ethiopia. Due to this situation, there was a need to conduct a sound and inclusive study including both administrative regions in adjacent zones, covering different agroecology and representative meteorological stations. Therefore, this study developed an important output that could support the end-users and policymakers as a guideline pertaining to the issues of climate change impacts and adaptation.

2.2. Sampling Design and Sample Size

Both primary and secondary data were collected and used in the analyses. Three stages of sampling with a combination of purposive (to select sample zones, districts, and kebeles) and random sampling (to select sample households) were used. In the first stage, three zones from the two regional states in central Ethiopia were selected purposively to capture variations across the zones, with the assumption that climate change affected agricultural productivity differently at the zonal level. In the second stage, one district from each zone was selected, except from West Shewa where two districts were selected, considering the availability of long-term meteorological observatory stations with the assumption that farm households within each district with different levels of perceptions of climate change were taken from the study previously mentioned in the Introduction. Thirdly, two kebeles (lowest administrative unit in Ethiopia) closer to the meteorology stations were purposively selected from each district (Table 1) based on the assumption that farm households perceptions’ of climate change and determinants of adaptation in each kebele could result in different adaptive capacities among communities. The lists of households available at sample kebeles were used as sampling frames, and the sample size was determined proportionally to the total number of household heads in the selected kebeles. Lastly, individual farm household heads were randomly selected proportional to the size of each kebele (Table 1).
The sample size for the household survey was determined based on the rule of thumb [25] using N ≥ 50 + 8 m to assure that the econometric model could be estimated with sufficient degrees of freedom, where N is the sample size (which was 132, including ten percent allowance) and m is the number of explanatory variables (Table 2) used in the empirical analysis.

2.3. Data Sources and Collection Methods

The survey was conducted from January to March 2017 using structured and semi- structured questionnaires. For an in-depth understanding of the survey data, focus group discussions, key informant interviews, and observations were also used in data collection. The focus group discussions for this study were held with separate groups of elders, youth, and women in each Kebele, comprising 6–10 individuals per group. Data at the household level were collected through a household survey using structured questionnaires. The questionnaires were initially pretested to check their validity and appropriateness. To make data collection as simple as possible, questionnaires were kept simple, conversational, and phrased using the local dialect. Since the questionnaires were developed in English, the back-translation technique was deployed. First, it was translated to Afaan Oromo and Amharic, and then translated back to English to compare the new version with the original one.
Moreover, historical daily climate data (rainfall, maximum and minimum temperatures) for the period of 1980 to 2016 were obtained from the National Meteorological Agency (NMA) of Ethiopia and used for climate trend analysis. Mann–Kendall approach was used to detect climate trends, while rainfall anomaly was calculated using the rainfall anomaly index [26,27].

2.4. Econometric Data Analysis

In this study, the multinomial logit (MNL) model was used to examine factors influencing farmers’ choice of different adaptation measures applied by the farm households in the study area. MNL model is suitable for estimating the likelihood that a given option is more preferred than other available options, with the assumption that the available options are mutually exclusive.
Considering a rational farmer who seeks to maximize the present value of expected benefits of production over a specified time horizon, the farmer chooses a single or combination of adaptation measures from the available sets of M adaptation options. Greene (2003) stated that farmer i decides to use the jth adaptation option if the perceived benefit from option j is greater than the utility obtained from other available options (for example, k) depicted as:
U i j β j X i + ε j > U i k β k X i + ε k ,   k j
where Uij and Uik are the perceived utility by farmer i of adaptation options j and k, respectively; Xi is a vector of explanatory variables that influence the choice of the adaptation option; βj and βk are parameters to be estimated, and εj and εk are the error terms.
The probability that farmer i chooses option j among the set of adaptation options could be defined as follows:
P j = 1 | X = P ( U i j   > U i k | X ) = P ( β j β k X i + ε j ε k > 0 | X ) = P β * X i + ε * > 0 | X = F β * X i
where ε* is a random disturbance term, β* is a vector of unknown parameters that can be interpreted as the net effect of the vector of explanatory variables influencing adaptation, and F (β*Xi) is the cumulative distribution of ε* evaluated at β*Xi.
To describe the MNL model, let Y denote a random variable taking on the values (1, 2, …, M) for M a positive integer, and let X denote a set of conditioning variables. In this case, Y denotes adaptation options or categories and X contains different household, institutional, and environmental attributes [28]. The question is how changes in the elements of X are affected, keeping other factors constant and the response probabilities P (Y = j|X), j = 1, 2, …, M. Since the probabilities must sum to unity, P (Y = j|X) was determined once we knew the probabilities for j = 2, …, M.
Let X be a 1 × K vector with first-element unity. Thus, the probability that household i with characteristic X chooses adaptation option j is specified as follows:
P Y i = j | X = exp X j β j 1 + j = 1 M exp X j β j
where P stands for probability, j stands for adaptation options, X for explanatory variables, and βj = k × 1 is coefficients, j = 1, 2, …, M.
The equation of the multinomial logistic regression model requires the independent irrelevant alternative assumption (IIA) following [29]. It indicates that the probability of using certain adaptation options by a given household needs to be independent of the probability of choosing another adaptation option (that is, Pj/Pk is independent of the remaining probabilities). The MNL adaptation model was run and tested for the IIA assumption using the Hausman specification test. As a result, the test failed to reject the null hypothesis of independence of odds of other alternatives with χ2 ranging from −12.05 up to 9.89 with probabilities almost equal to 1.000, suggesting that there was no evidence against the correct specification for the adaptation model.
The parameter estimates of the MNL model provide only the direction of the effect of the independent variables on the dependent variable, but estimates represent the actual magnitude of neither change nor probabilities. Thus, the marginal effects or marginal probabilities are functions of the probability itself and measure the expected change in the probability of a particular choice determined concerning a unit change in an independent variable from the mean and computed as:
P j X k = P j ( β j k j = 1 j 1 P j     β j k )
The MNL adaptation model was run and tested for the validity of the IIA assumption. The Hausman specification test for multicollinearity problem was verified for the degree of association among the hypothesized continuous explanatory variables. As a result, the test failed to reject the null hypothesis of independence of odds of other alternatives with χ2 ranging from −12.05 up to 9.89, with probabilities almost equal to 1.00 suggesting that there was no evidence against the correct specification for the adaptation model. The variance inflation factor (VIF) technique was employed to detect the problem of multicollinearity for continuous explanatory variables.
V I F = 1 1 R j 2
where VIF is variance inflation factor, R j 2 is the adjusted square of the multiple correlation coefficients that result when one explanatory variable (j) is regressed against all others. If an approximately linear relation exists between the explanatory variables, then multicollinearity is a problem to be expected, with a large value of R2 being at least one of the test regressions. In this study, the results of each variable VIF were less than 10, indicating that there was no multicollinearity problem, which was in accordance with the model assumption of the multicollinearity problem [30]. Moreover, contingency coefficients were checked for all discrete variables, and the results were <0.75, which indicated multicollinearity was not a serious problem in the model estimation [30,31]. Hence, all the hypothesized continuous and categorical explanatory variables were included in the model. The results of the tests showed that both tests failed to reject the null hypothesis of independence of the climate change adaptation options, suggesting that the MNL specification was appropriate to model climate change adaptation practices of smallholder farmers. The contingency coefficients were calculated as:
C = x 2 n x 2
where C is contingency coefficient, x2 is chi-square test, n is total sample size.

3. Results and Discussion

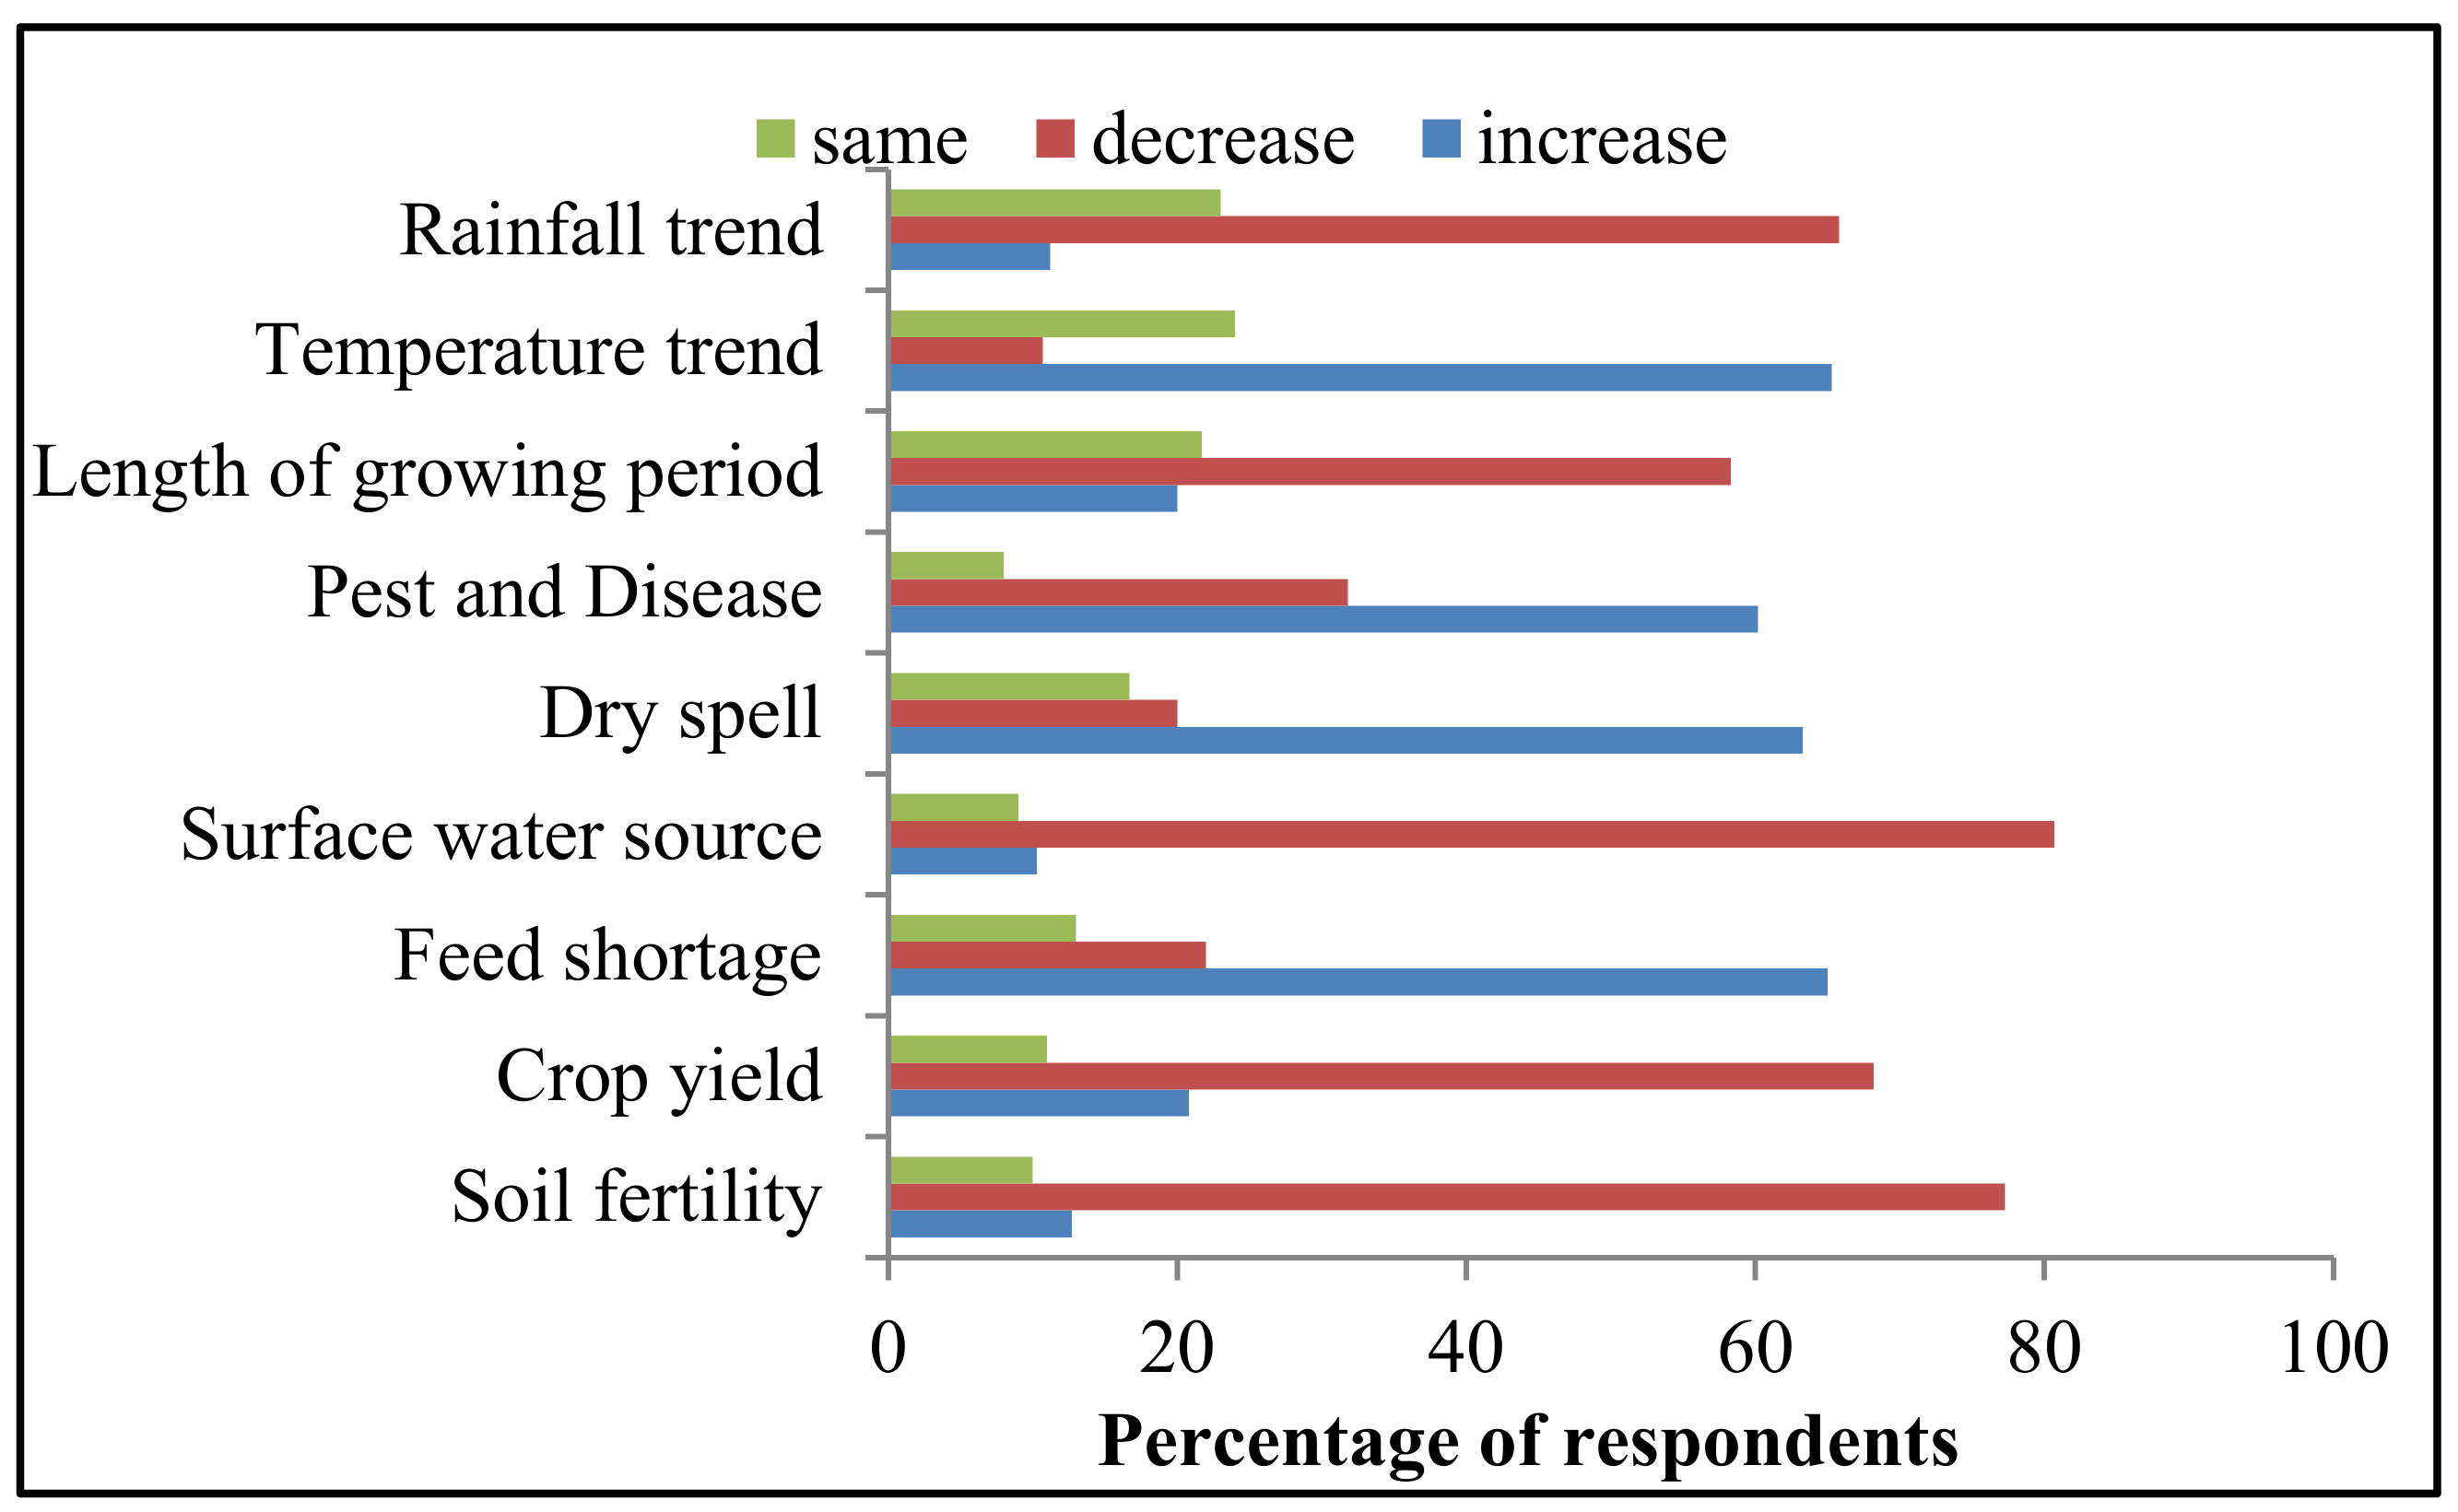
3.1. Farmers’ Perceptions of the Impacts of Climate Change in the Study Area

Farmers in the study area perceived the presence of both climate variability and change and their impacts. Accordingly, households experienced the risk associated with water source availability, depletion in soil fertility, the risk of crop failure, crop yield reduction, and risk associated with livestock feed, respectively (Figure 2). The results of the focus group discussion and key informants emphasized that rain had become more erratic, and whenever it came, it was often in heavy falls that caused floods and little infiltration. Moreover, farmers indicated that climate change had caused irregular droughts and a high incidence of pests and diseases, which negatively affected livestock and crop production. The focus group discussions and key informants acknowledged the significant increase in crop damage by pests and diseases, including weeds.
Dry spells and drought also frequently occurred within the growing season. Respondents (63.3%) claimed to experience dry spells during the rainy season, which sometimes led to the drying and scorching of crop leaves and, ultimately, retarded crop growth and reduced yield. Approximately 16.7% of respondents recalled that whenever a dry spell occurred during the critical periods for crops, it led to a low yield or crop failure. Moreover, a significant number of smallholder farmers perceived those high temperatures particularly at the beginning of the rainy season and during long spells, usually burning germinating seeds. Smallholder farmers also acknowledged the significant increase in crop damage by pests and diseases, including weeds. They related an increase in temperature and decrease in rainfall to the proliferation of pests and diseases. A significant number of them reported experiencing an unpredictable and unreliable onset and cessation of rains and the shrinking of the growing season.
There were differences among sample households in their perception of climate change (Figure 3). Respondents 10, 18, 30, 28, 16, 9, and 6 perceived climate change parameters (rainfall, minimum temperature, and maximum temperature). However, only three respondents did not perceive climate change at all. The majority of those indicated that they had experienced higher temperatures, droughts, changes in planting time, and a decrease in crop yield for the changing climate.
The study focused on understanding if farmer perceptions of climate change matched with historical climate (rainfall and temperature) records for the period from 1980 to 2016, and identifying determinants of adaptation in central Ethiopia. The results of the meteorological data analysis showed that the temperature had increased over the study period. Farmers’ perceptions of temperature trends were consistent with the historical records. These results were in line with studies with smallholder farmers in other parts of Africa [18,32,33,34,35]. Farmers’ perceptions of decreased rainfall over the past 37 years were, however, inconsistent with the results of the observed rainfall data analysis and previous reports [18,36]. The disparity between public opinion on rainfall changes and historical meteorological records may have been attributed to differences in the variation of study periods and the interpretation of droughts, with emphasis on meteorological droughts as opposed to farmers’ considerations of agronomic droughts. Scientists often analyze climate data at different timescales rather than those that are important for farmers and crop growth, resulting in potential variations in farmers’ perceptions and observed data [37]. Most of the technical support necessary for effective farmer adaptation seemed to arrive either too late or in some cases not at all. Thus, this outcome resulted in many farmers’ lacking reliable climate adaptation information, particularly about the onset and cessation of rainfall [38].

3.2. Climate Change Adaptation Practices in Central Ethiopia

Farmers in the study area had, in many cases, adapted their farming to climate change and variability. They used their indigenous knowledge to secure their livelihoods with locally available resources. They developed some adaptation means by diversifying their farming systems. Accordingly, they used different adaptation strategies to reduce the negative impact of climate change. Among adaptation options, shifting to early-maturing crop varieties, household income source diversification, soil and water conservation practices, crop diversification, adjusting planting dates, destocking, seasonal migration, and crop rotation were the major adaptation practices (Table 3). The diversification of crops not only allows farmers to avert risks and maximize harvest security under unpredictable and unreliable climates, but also improves household nutrition.
Among the farmers interviewed, many adapted to the perceived change in shifting to early-maturing crop varieties and adjusted their planting dates to reduce the adverse effect of climate change impacts on their livelihood. Similarly, sample households rotated legumes with cereals as an adaptation strategy. Overall, crop diversification, destocking, the diversification of household income, and seasonal migration adaptation options were used by the farmers. Of the total sample households, 13.3% of them also used soil and water conservation practices as an adaptation strategy to reduce the adverse effect of climate change on their farm (Table 3).

3.3. Barriers to Climate Change Adaptation

The analysis of barriers to adaptation to climate change in central Ethiopia identified five key constraints. These were a lack of capital, limited farm size, unpredictable weather, lack of access to crop season weather information, and lack of access to irrigation water (Table 4). Moreover, rises in temperature during critical crop growth stages, occurrences of dry spells, and sometimes heavy and uncertain rainfall were among other climatic factor barriers to attaining the desired level of adaptation reported by key informants and focus group discussions.
In this study, a lack of liquidity, limited farm size, unpredictable weather, and limited access to seasonal weather information and water resources were identified as the most critical barriers to adoption. Respondents identified that the lack of liquidity was a key constraint for adaptation to climate variability. Although there was access to microcredit facilities, except for a few, most of them had less knowhow on the effective utilization of loans for productive activities rather than paying for other outstanding loans and home consumption. Moreover, high interest rates are one of the reasons for the minimal attraction of farmers to the available credit facilities. Finally, a few of them started to migrate to nearby urban areas to search for off-/nonfarm employment opportunities. Irrigation facilities were also perceived as the main barriers to adaptation. Institutional factors, such as access to extension services in unpredictable weather and access to timely weather information, had a strong positive influence on adaptation practices. Moreover, rises in temperature during anthesis and grain-filling stages, occurrences of dry spells in early crop growth, and the occasional occurrence of heavy and uncertain rainfall that can lead to soil erosion, waterlogging, and deterioration of harvest product were among other climatic factor barriers for reaching the desired level of adaptation in the study area. Accordingly, ref. [39] revealed that farmers in Ethiopia, in general, are very poor and cannot afford to invest in irrigation technology, not only to adapt to climate change, but also to sustain their livelihood during harsh climatic extremes such as drought, which often causes famine. Adaptation to climate change is costly [15], and a lack of liquidity hinders farmers from obtaining the necessary resources and technologies which assist in adapting to climate change. Therefore, if farmers do not have sufficient family labor or the financial means for higher labor, they cannot adapt.

3.4. Determinants (Social Determinants) of Climate Change Adaptation Measures

The multinomial logit model was used to assess determinants of farmers’ choices of adaptation strategies to climate-related shocks. Table 5 presents the estimated coefficients of the MNL model, along with the levels of significance. For the multinomial logit model fit, we used crop rotation as a base category arbitrarily. The likelihood ratio statistics indicated by chi-square statistics were highly significant (p < 0.01), suggesting that the model had a strong explanatory power. It was noted that the parameter estimates of the MNL model provided only the direction of the effect of the independent variables on the dependent variables and did not represent the actual magnitude of change of its probability. Thus, marginal effects, which measure the expected change in the probability of a particular choice being determined with respect to a unit change in an independent variable, were calculated and presented (Table 6). Multinomial logistic regression model results showed coefficient estimates followed the expected signs, as stated in the hypotheses above.
The age of the household head, household size, farm size, education of the household head, access to extensions, farm income, and off-farm income significantly influenced the frequency of farmers using one of the climate change adaptation strategies identified by them. The abovementioned variables that significantly influenced climate change adaptation options were discussed hereunder.

3.4.1. Age of the Household Head

The results of the MNL model showed that the age of the household head was found to be positively and significantly correlated with the most adaptation options, except for seasonal migration and access to climate information, which were affected negatively (Table 5). Older household heads were 0.085 and 0.327 times less likely to adopt seasonal migration and improve their access to climate information than younger ones relative to the base category. An increase in the age of the household head increased the probability of choosing crop diversification, reducing the number of livestock, diversifying household income, and implementing soil and water conservation as an adaptation option. On the other hand, it reduced the probability of choosing a change in planting dates (Table 6).
Climate change adaptation strategy preference was affected by the age of the household head. The results of the MNL model showed that the age of the household head was positively and significantly correlated with the most adaption options. The reason for the positive association was probably due to the fact that age endows farmers with the requisite experience that enables them to determine a better assessment of the risks involved in climate change adaptation investment decisions. Similarly, Atinkut and Mebrat (2016) reported that the age of the household head was found to be positively and significantly correlated with crop diversification at p < 0.05. Moreover, [19,40] also reported that an increase in age does mean an increase in farming experience, which would increase farmers’ indigenous knowledge to respond to the hazards resulting due to climate variability. On the other hand, the age of the household head showed a negative correlation with seasonal migration at p < 0.001, which means that a one-year increase in the age of the household head decreased the probability of using seasonal migration as an option for climate adaptation by 0.085 times less, relative to the base category. This implies that older farmers are less likely to take seasonal migration, which requires more labor. This result is in agreement with the findings in [41] that reported households with an older household head to be less likely to use seasonal migration as an adaptation measure compared with younger ones.

3.4.2. Household Family Size

Estimation results from the multinomial logistic regression model revealed that family size positively and significantly affected household decisions to pursue crop diversification, changing planting dates, reducing the number of livestock, and implementing soil and water conservation as adaptation measures for the perceived climate change. It was statistically significant for changing planting dates and reducing the number of livestock as adaptation options at p < 0.01. A one-person increase in the family could increase the probability of changing planting dates and implementing soil and water conservation as adaptation measures (Table 5).
Households who have a larger family size have an opportunity to practice various adaptation options in the face of climate variability. Thus, its positive and significant sign clearly shows that the larger the family size, the higher the probability for responding to reduce the effects of climate change and variability. Hence, this result agreed with different works of [29,42], who argued that a large family is associated with higher labor endowment, which would enable a household to accomplish various agricultural tasks, especially at peak seasons.

3.4.3. Household Farm Size

Farm size appeared to be positively and significantly correlated with almost all adaptation options. An increase in farm size by one hectare per household would increase the probability of using nearly all adaptation options, except for seasonal migration and household income diversification (Table 5).
Households with larger farm sizes were more probable to diversify their crop production during dry seasons, and allocated their farm to different planting dates to reduce the negative impacts of climatic variability. Similarly, ref. [43] reported that households cultivating a greater size of plots are more likely to adopt different adaptation strategies. This may be because such households are more likely to be in the risk-takers category, be wealthier and more flexible to adopt improved technologies and innovations at least in one of their many plots. Moreover, farm size was negatively associated with seasonal migration, which means that a one-hectare increase in farm size lowered the probability of using seasonal migration as a coping strategy by 0.24 times. Since most of the adaptation measures employed by the rural households in central Ethiopia are agriculturally based, those who do not have land or have a small plot would seasonally migrate to some other places where employment opportunities are available.

3.4.4. Education of the Household Head

The education of the head of the household increased the probability of adapting to climate change. As can be observed in Table 5, relatively better-educated household heads considered changing planting dates, crop diversification, implementing soil and water conservation, and reducing the number of livestock as adaptation methods. A unit increase in the years of education and farm size increased the probability of choosing planting dates and reducing the number of livestock as adaptation options (Table 6).
Almost all of the marginal values of education were positive across all adaptation options, indicating the positive relationship between education and adaptation to climate change. This implies that literate farmers are likely to react to changes through evaluating choices that best fit their knowledge, inclination, and capabilities. Similarly, ref. [41] reported that farmers with a better education are less likely to consider seasonal migration as an adaptation measure to perceive climate change. Hence, education increases the probability of farmers’ uptake adaptation options to climate change and variability. Various authors, e.g., [24,29,44], reported that education increases the probability of adapting to climate change. Better educated farmers are more likely to employ adaptation strategies in response to climate change impacts [43].

3.4.5. Extension Service

Results of the MNL models showed that extension contact had a positive and significant correlation with the likelihood of changing planting dates, household income diversification, and reducing livestock. The more contact farmers had with extension agents, the more the probability that they adopted the two adaptation measures (Table 5). A unit increase in access to extension services increased the probability of selecting changes to planting dates and household income diversification as adaptation options, and decreased the probability of reducing the number of livestock (Table 6).
Farmers who frequently met and discussed issues with extension services were more likely to be aware of climatic conditions. This implies that farmers with better access to information about the changing climate have a higher chance of adopting adaptation measures. This result was in line with many other similar research results that showed the relation that farmers who obtained information through extension workers were likely more informed about the climatic situation and the responses that followed [17,33,43,45].

3.4.6. Household Income

Household income was directly or indirectly related to the household’s financial endowments, and positively influenced farmers’ capacities to cope and adapt to climate variability. The results indicated that farm household income significantly (p < 0.1) impacted crop diversification, changes in planting dates, reduction in herd size, and household income diversification (Table 5). A unit increase in on-farm income increased the probability of choosing a change in planting dates and implementing soil and water conservation as an adaptation option. Conversely, a unit decrease in on-farm income increased the probability of crop and household income diversifications. Likewise, off-farm income had a positive and significant impact on crop diversification. A unit increase in off-farm income increased the probability of selecting the change in planting dates as an adaptation option (Table 6).
Farmers with better financial resources used more adaptation options to climate variability and change. Similarly, ref. [46] pointed out that the choice of a combination of adaptation strategies was higher for farmers with better income through developing the capacity to break down the capital constraint to invest in new technologies. Other studies also supported that wealthier households are better able to act quickly to offset climate risk than poorer households [3,5].
Many farmers used a limited number of adaptation strategies, and the key reason for this was profit maximization. On the other hand, there was limited information about the exact nature and extent of climatic shocks, as farmers were unsure about the timing or occurrence of climatic shocks. Social networks and social capital were found to be important factors influencing farmers’ adaptive decision making. This implies that farmers who interact and network more with other farmers and receive institutional services are more likely to use more climate adaptation measures than those farmers with less access to those services. Liquidity constraints and limited resources are the other key factors that affected the adoption of adaptation measures. Family labor and knowledge were also major factors that affected farmers’ choices of different coping and adaptation measures in central Ethiopia. Although younger heads of farm households are under heavy rural to urban exodus by hating farming under poor practice, farmers with more family labor and better knowledge have more coping and adaptation strategies to alleviate the negative impacts of rainfall and temperature changes and variability on crop productivity. This suggests that farmers need to have access to formal and informal education to increase their coping and adaptation capacities. Finally, it is important to emphasize that smallholder farmers are very susceptible to rainfall variability and increasing temperatures, and there is a need for holistic efforts to build the resilience of those vulnerable farmers.
Generally, this study identified farmers’ perceptions of climate change impacts and adaptation practices currently used by farm households. Likewise, various determinants for climate change adaptation options were measured and local level management options were suggested.

4. Conclusions

Climatic shocks pose serious challenges to farmers in central Ethiopia. This study was conducted under certain limitations, i.e., the sample size of the household survey, the limited number of study areas, and the periods of study. However, promising results were obtained from farmers’ indigenous knowledge regarding perception and adaptation options of climate change impacts that require imprudent support with recent technology. According to the results of the study, the variability of rainfall and increasing temperatures were found to be the most important long-term (1980 to 2016) climatic shocks affecting crop production in the study area. The livelihood of farmers was largely affected by these climatic variables. Farmers observed, understood, experienced, and perceived climate change that negatively affected their crop production. This study identified several adaptation practices, i.e., the increased use of early-maturing crop varieties, household income source diversification, use of soil and water conservation techniques, crop diversification, adjusting planting dates, destocking, seasonal migration, crop rotation, and access to climate information services. However, taking account of such measures was based on previous knowledge and a history of events. Various factors (socioeconomic, demographic, and institutional) influence the choice of climate change adaptation measures. The multinomial regression analysis indicated that the significant determinant variables affecting the choice of respondents were the age, sex, and education of the household head, farm size, family size of the household, farm and nonfarm income, and access to information. The study concludes that the extent of farmers’ exposure to climate change stresses and their adaptation strategies are well documented in central Ethiopia. The study also concludes the need for understanding factors affecting farmers’ choice of climate change adaptation strategies at the local level to enhance farmers’ adaptive capacity and build resilience to the variable and changing climate.

Author Contributions

G.G.M. worked on the data collection, data analysis, and writing of the original draft; M.J.; K.T., T.T., M.G. and B.L. helped in the results interpretation and writing. All authors have read and agreed to the published version of the manuscript.

Funding

Ethiopian Ministry of Education. Funding number is 60000 ETB which is approximately 1140$.

Institutional Review Board Statement

Not applicable.

Informed Consent Statement

Not applicable.

Data Availability Statement

Not applicable to this article, as there were no data created.

Acknowledgments

The authors thank the farmers, agricultural development agents, and local administrators in central Ethiopia, and the National Meteorological Agency (NMA) for providing the information needed for this study.

Conflicts of Interest

The authors declare no conflict of interest.

References

  1. FAO. The State of Food and Agriculture; FAO: Rome, Italy, 2016; Available online: http://www.fao.org/docrep/018/i3300e/i3300e.pdf (accessed on 19 May 2019).
  2. Ghebrezgabher, M.G.; Yang, T.; Yang, X. The long-term trend of climate change and drought assessment in the Horn of Africa. Adv. Meteorol. 2016, 2016, 8057641. [Google Scholar] [CrossRef] [Green Version]
  3. Adger, W.N.; Dessai, S.; Goulden, M.; Hulme, M.; Lorenzoni, I.; Nelson, D.R.; Wreford, A. Are there social limits to adaptation to climate change? Clim. Chang. 2009, 93, 335–354. [Google Scholar] [CrossRef]
  4. Thornton, P.K.; Jones, P.G.; Ericksen, P.J.; Challinor, A.J. Agriculture and food systems in Sub-Saharan Africa in a 4 C+ world. Philos. Trans. R. Soc. A Math. Phys. Eng. Sci. 2011, 369, 117–136. [Google Scholar] [CrossRef] [PubMed] [Green Version]
  5. Adimassu, Z.; Kessler, A. Factors affecting farmers’ coping and adaptation strategies to perceived trends of declining rainfall and crop productivity in the central Rift valley of Ethiopia. Environ. Syst. Res. 2016, 5, 13. [Google Scholar] [CrossRef] [Green Version]
  6. World Bank. Ethiopia A Country Study on the Economic Impacts of Climate Change; World Bank: Washington, DC, USA, 2008; Available online: https://landportal.org/ru/node/34099 (accessed on 21 May 2019).
  7. Weldegebriel, N.W.; Gustavsson, H. Environment pollution and climate change adaptation and mitigation strategies vis- a -vis the agriculture and water sectors in Ethiopia-Case Review/Study of the EPCC Project. Environ. Pollut. Clim. Chang. 2017, 1, 1–8. [Google Scholar] [CrossRef] [Green Version]
  8. EPCC. Ethiopian Panel on Climate Change First Assessment Report, Agriculture and Food Security (Working Group II); EPCC: El Paso, TX, USA, 2015. [Google Scholar]
  9. Wassie, S.B. Natural resource degradation tendencies in Ethiopia: A review. Environ. Syst. Res. 2020, 9, 33. [Google Scholar] [CrossRef]
  10. Asfaw, A.; Simane, B.; Hassen, A.; Bantider, A. Variability and time series trend analysis of rainfall and temperature in northcentral Ethiopia: A case study in Woleka sub-basin. Weather. Clim. Extrem. 2018, 19, 20–28. [Google Scholar] [CrossRef]
  11. Megersa, G.; Kindie, T.; Mezegebu, G.; Tamado, T.; Moti, J.; Berhane, L. Rainfall Variability and its Implications for Wheat and Barley Production in Central Ethiopia. Ethiop. J. Crop Sci. 2019, 7, 89–111. [Google Scholar]
  12. Ademe, D.; Benjamin, F.; Kindie, T.; Belay, S.; Getachew, A.; Enyew, A. Climate trends and variability at adaptation scale: Patterns and perceptions in an agricultural region of the Ethiopian Highlands. Weather. Clim. Extrem. 2020, 29, 100263. [Google Scholar] [CrossRef]
  13. Etana, D.; Snelder, D.J.R.M.; van Wesenbeeck, C.F.A.; de Cock Buning, T. Trends of Climate Change and Variability in Three Agro-Ecological Settings in Central Ethiopia: Contrasts of Meteorological Data and Farmers’ Perceptions. Climate 2020, 8, 121. [Google Scholar] [CrossRef]
  14. Jiri, O.; Mtali-chafadza, L.; Mafongoya, P.L. Influence of smallholder farmers’ perceptions on adaptation strategies to climate change and policy implications in Zimbabwe. Chang. Adapt. Socio-Ecol. Syst. 2017, 3, 47–55. [Google Scholar] [CrossRef]
  15. Ndamani, F.; Watanabe, T. Determinants of farmers’ adaptation to climate change: A micro-level analysis in. Sci. Agric. 2016, 73, 201–208. [Google Scholar] [CrossRef] [Green Version]
  16. Cherinet, A. Community Perception on Climate Change, Its Impacts and Adaptation Strategies: The Case of Ensaro Woreda, North Shewa Zone, Amhara Regional State. Master’s Thesis, Addis Ababa University, Addis Ababa, Ethiopia, 2017. [Google Scholar]
  17. Nhemachena, C.; Hassan, R. Micro-Level Analysis of Farmers’ Adaptation to Climate Change in Southern Africa; IFPRI Discussion Paper 00714; International Food Policy Research Institute (IFPRI): Washington, DC, USA, 2007. [Google Scholar]
  18. Gbetibouo, G.A. Understanding Farmers’ Perceptions and Adaptations to Climate Change and Variability: The Case of the Limpopo Basin, South Africa; IFPRI Discussion Paper 00849, (February); International Food Policy Research Institute (IFPRI): Washington, DC, USA, 2009; Volume 52. [Google Scholar] [CrossRef]
  19. Deressa, T.T.; Hassan, R.M.; Ringler, C. Perception of and adaptation to climate change by farmers in the Nile basin of Ethiopia. J. Agric. Sci. 2011, 149, 23–31. [Google Scholar] [CrossRef] [Green Version]
  20. Kassie, B.T.; Rötter, R.P.; Hengsdijk, H.; Asseng, S.; Ittersum, M.K.V.A.N. Climate variability and change in the Central Rift Valley of Ethiopia: Challenges for rainfed crop production. J. Agric. Sci. 2014, 152, 58–74. [Google Scholar] [CrossRef]
  21. Belay, A.; John, W.R.; Teshale, W.; John, F.M. Smallholder farmers’ adaptation to climate change and determinants of their adaptation decisions in the Central Rift Valley of Ethiopia. Agric. Food Secur. 2017, 6, 24. [Google Scholar] [CrossRef] [Green Version]
  22. Hirpha, H.H.; Mpandeli, S.; Bantider, A. Determinants of adaptation strategies to climate change among the smallholder farmers in Adama District, Ethiopia. Int. J. Clim. Change Strateg. Manag. 2020, 12, 463–476. [Google Scholar] [CrossRef]
  23. Mihiretu, A.; Okoyo, E.N.; Lemma, T. Causes, indicators and impacts of climate change: Understanding the public discourse in Goat based agro-pastoral livelihood zone, Ethiopia. Heliyon 2021, 7, e06529. [Google Scholar] [CrossRef]
  24. Mabe, F.N.; Sienso, G.; Donkoh, S.A. Determinants of choice of climate change adaptation strategies in Northern Ghana. Res. Appl. Econ. 2014, 6, 24. [Google Scholar] [CrossRef] [Green Version]
  25. Green, S.B. How many subjects does it take to do a regression analysis? Multivar. Behav. Res. 1991, 26, 499–510. [Google Scholar] [CrossRef]
  26. Kendall, K. Thin-film peeling-the elastic term. J. Phys. D Appl. Phys. 1975, 8, 1449. [Google Scholar] [CrossRef]
  27. Henry, M.B. Nonparametric tests against trend. Econom. Soc. 1945, 13, 245–259. [Google Scholar]
  28. Greene, W.H. Econometric Analysis, 5th ed.; Prentice Hall: Hoboken, NJ, USA, 2003. [Google Scholar]
  29. Bryan, E.; Deressa, T.T.; Gbetibouo, G.; Ringler, C. Adaptation to climate change in Ethiopia and South Africa: Options and constraints. Environ. Sci. Policy 2009, 12, 413–426. [Google Scholar] [CrossRef]
  30. Gujarati, D. Basic Econometrics, 3rd ed.; McGraw-Hill: New York, NY, USA, 2004. [Google Scholar]
  31. Feleke, F.B.; Berhe, M.; Gebru, G.; Hoag, D. Determinants of adaptation choices to climate change by sheep and goat farmers in Northern Ethiopia: The case of Southern and Central Tigray, Ethiopia. SpringerPlus 2016, 5, 1692. [Google Scholar] [CrossRef] [Green Version]
  32. Maddison, D. The Perception of and Adaptation to Climate Change in Africa; World Bank Publications: Washington, DC, USA, 2007. [Google Scholar] [CrossRef]
  33. Juana, J.S.; Kahaka, Z.; Okurut, F.N. Farmers’ perceptions and adaptations to climate change in Sub-Sahara Africa: A Synthesis of empirical studies and implications for public policy in African Agriculture. J. Agric. Sci. 2013, 5, 121–135. [Google Scholar] [CrossRef] [Green Version]
  34. Amadou, M.L.; Villamor, G.B.; Attua, E.M. Comparing farmers at the perception of climate change and variability with historical climate data in the Upper East Region of Ghana. Ghana J. Geogr. 2015, 7, 47–74. [Google Scholar]
  35. Debela, N.; Mohammed, C.; Bridle, K.; Corkrey, R.; McNeil, D. Perception of climate change and its impact by smallholders in pastoral/agropastoral systems of Borana, South Ethiopia. SpringerPlus 2015, 4, 236. [Google Scholar] [CrossRef] [PubMed] [Green Version]
  36. Waongo, M.; Laux, P.; Kunstmann, H. Adaptation to climate change: The impacts of optimized planting dates on attainable maize yields under rainfed conditions in Burkina Faso. Agric. For. Meteorol. 2015, 205, 23–39. [Google Scholar] [CrossRef] [Green Version]
  37. Limantol, A.M.; Keith, B.E.; Azabre, B.A.; Lennartz, B. Farmers’ perception and adaptation practice to climate variability and change: A case study of the Vea catchment in Ghana. SpringerPlus 2016, 5, 830. [Google Scholar] [CrossRef] [Green Version]
  38. Antwi-agyei, P.; Dougill, A.J.; Evan, D.G.; Stringer, L.C.; No, W.P. Characterizing the nature of vulnerability to climate variability: Empirical evidence from two regions of Ghana. Environ. Dev. Sustain. 2012, 15, 903–926. [Google Scholar] [CrossRef]
  39. Enete, A.A.; Madu, I.I.; Mojekwu, J.C.; Onyekuru, A.N.; Onwubuya, E.A.; Eze, F. Indigenous Agricultural Adaptation to Climate Change: Study of Southeast Nigeria; African Technology Policy Studies Network: Nairobi, Kenya, 2011. [Google Scholar]
  40. Misganaw, A.; Mariam, D.H.; Ali, A.; Araya, T. Epidemiology of major non-communicable diseases in Ethiopia: A systematic review search strategy. J. Health Popul. Nutr. 2014, 32, 1–13. [Google Scholar]
  41. Atinkut, B.; Mebrat, A. Determinants of farmers choice of adaptation to climate variability in Dera woreda, south Gondar zone, Ethiopia. SpringerPlus 2016, 5, 6. [Google Scholar] [CrossRef] [Green Version]
  42. Igbalajobi OFatuase, A.I.; Ajibefun, I. Determinants of Poverty Incidence among Rural Farmers in Ondo State, Nigeria. Am. J. Rural. Dev. 2013, 1, 131–137. [Google Scholar] [CrossRef]
  43. Khanal, U.; Wilson, C.; Lee, B.; Hoang, V. Do climate change adaptation practices improve technical efficiency of smallholder farmers? In Proceedings of the Australian Agricultural & Resource Economics Society 2017 Conference, Brisbane, Australia, 7–10 February 2017; pp. 8–10. [Google Scholar]
  44. Ajao, A.O.; Ogunniyid, L.T.; Acquah, H.G. Farmers’ strategies for adapting to climate change in ogbomoso agricultural zone of Oyo state. Agris-Line Pap. Econ. Inform. 2011, 3, 3–13. [Google Scholar]
  45. Gutu, T.; Bezabih, E.; Mengistu, K. A time series analysis of climate variability and its impacts on food production in north Shewa zone in Ethiopia climate change (CC) manifest in the form of temperature increases, changes in precipitation, and sea-level rise, and the intensification of. Afr. Crop Sci. J. 2012, 20, 261–274. [Google Scholar]
  46. Asayehegn, K.; Temple, L.; Sanchez, B.; Iglesias, A. Perception of climate change and farm level adaptation choices in central Kenya. Cah. Agric. 2017, 26, 1–10. [Google Scholar] [CrossRef] [Green Version]
Figure 1. Map of the survey area.
Sustainability 14 06590 g001
Figure 2. Farmers’ perceptions of climate change impacts from 1980 to 2016.
Sustainability 14 06590 g002
Figure 3. The proportion of farmers’ perceptions of indicators of the local climate.
Sustainability 14 06590 g003
Table 1. District household sizes and selected households for the study area.
ZoneDistrictKebeleTotal Household SizeRandomly Selected Household
Proportion to Size
North Shewa AmharaAngolela TeraXoxose97519.13
Sariti105320.65
North Shewa OromiaGirar JarsoDoyu ganda guda84616.60
Safane warxu70813.89
West ShewaAmboGosu qora81115.91
Badesa70613.85
West ShewaWelmeraWelmera56811.14
Menagesha4508.83
Total 6117120
Table 2. Description of the independent variables.
Explanatory VariablesDescriptionExpected Sign
Sex of the household headDummy: 1 = male; 0 = female±
Age of the household headContinuous (years)±
Education of the household headContinuous (years)+
Household sizeContinuous (number)±
Farming experienceContinuous (years)±
Farm sizeContinuous (hectare)+
Total annual incomeContinuous (ETB)+
Access to climate informationDummy: 1 = yes; 0 = no+
Access to extension serviceDummy: 1 = yes; 0 = no+
Livestock ownershipTropical livestock unit (TLU)+
Table 3. Climate change adaptation strategies perceived by sample farm households.
Adaptation Measures TakenFrequencyPercent
Shifting to early maturing crop varieties2218.3
Adjusting planting dates2016.7
Crop rotation1915.8
Crop diversifications1615
Implementation of soil and water conservation1513.3
Destocking1310.8
Household income source diversification75.8
Seasonal migration54.2
Table 4. Constraints for climate change adaptation.
ConstraintsYes (%)No (%)
Lack of capital74.225.8
Access to cropping season weather information17.582.5
Access to water for irrigation7.592.5
Limited farm size72.527.5
The unpredictability of weather70.829.2
Table 5. Parameter estimates of multinomial logit model for rainfall and temperature.
Explanatory VariablesAdaptation Options
CrdivChplanRenulHoindiImswcSemiAcin
Exp(B)Exp(B)Exp(B)Exp(B)Exp(B)Exp(B)Exp(B)
Age3.48 *4.67 *15.37 ***1.581.4−0.09 *−0.33
Fms1.54.80 *4.20 *0.842.40.240.4
Fmz3.89 *5.60 **11.67 ***1.41.752.60 × 10−81.75
TLU1.41.44.20 **0.70.358.35 × 10−9 0.35
EDUS0.20 **0.13 ***0.07 *0.40.20 *1.20.33
AcEx23.14 *8.67 ***0.18 **0.223.56 × 10−9 3.56 × 10⁻⁹
HHINCO0.89 *3.07 *5.12 *0.24 *0.36.95 × 10−9 0.3
OFFInco1.42 *0.370.21.5344.5
The reference category was:X2 = 113.873No. of observations = 117
Crop rotation
−2 log likelihood = 247.962Pseudo R2 = 0.613 LRp value = 0.000
***, **, and * indicate significance at 1%, 5%, and 10% levels; Age—age of the household; Fms—family size; Fmz—farm size; TLU—tropical livestock unit; EDUS—education status; AcEx—access to extension; HHINCO—household income; OFFInco—off-farm income; Crdiv—crop diversification; Chplan—change in planting date; Renul—reduced number of livestock; Hoindi—household income diversification; Imswc—implemented soil and water conservation; Semi—seasonal migration; Acin—access to climate information.
Table 6. Estimated marginal effects from the multinomial logit model.
PredictorCrdivChplanRenulHoindiImswcSemiAcin
dy/dxdy/dxdy/dxdy/dxdy/dxdy/dxdy/dx
Age0.11 *−0.08 *0.07 **0.070.04−8.60 × 10⁻¹⁰.
Fms−0.090.110.00−0.020.06−7.80 × 10⁻¹⁰ .
Fmz0.110.04 *0.08 *−0.030.04−3.20 × 10⁻¹⁰ 2.10 × 10⁻²³
TLU0.27−0.19 *−0.030.05−0.06−7.40 × 10⁻⁹ .
EDUS−0.01 **0.05 *0.04 *0.050.112.20 × 10−9 5.30 × 10⁻²⁶
AcEx−0.190.04 *−0.05 *0.17 **0.136.20 × 10−10 6.90 × 10⁻³³
HHINCO−0.33 *0.23 *0.05−0.14 *0.015 *6.40 × 10−10 3.60 × 10⁻²³
OFFInco0.30 *−0.06−0.01−0.050.019−6.30 × 10⁻¹⁰ .
** and * indicate significance at 5% and 10% levels; Crdiv—crop diversification; Chplan—change in planting date; Renul—reduced number of livestock; Hoindi—household income diversification; Imswc—implemented soil and water conservation; Semi—seasonal migration; Acin—access to climate information.
Publisher’s Note: MDPI stays neutral with regard to jurisdictional claims in published maps and institutional affiliations.

