Abstract
The scum layer of straw anaerobic digestion significantly impacts biogas production efficiency. The initial floating of straw after entering the reactor is an important reason for scum layer formation. Improving the settleability of straw particles and reducing the initial floating time of straw are crucial to suppressing the scum layer, and accelerating the water absorption rate of straw entering the reactor is the key to reducing the floating time. Therefore, in this study the corn stalks were kneaded and rolled, and the stalk particles were tested for water absorption and aerobic hydrolysis. The results showed that the water absorption rate of the stalks after conditioning was significantly accelerated, and the water absorption rate was 120% higher than that of the untreated stalks after absorbing water for 12 h. Simultaneously, aerobic hydrolysis destroys the lignocellulose structure to a certain extent, increases the porosity of the stalk particles, and further improves the settleability of the stalk particles. In the subsequent anaerobic digestion process, scum decreased significantly: the scum layer volume ratio was 13% lower than untreated stalks. The methane production efficiency of anaerobic digestion was significantly improved, and the optimal hydrolysis time was 12 h. At this time, the cumulative methane production of the milled treated stalks reached the maximum value of 319.64 mL/g VS, which was 26.59% higher than that of the untreated stalks.
1. Introduction
In the process of producing biogas with crop straw as a digestion raw material, naturally air-dried straw particles float on the upper part of the digestion reactor, generally called scum. The slag sticks to each other to form a scum layer, which hinders the release of biogas and seriously affects the stability and gas production efficiency of the digestion system [1]. Simultaneously, the release of biogas through the scum layer will lead to dehydration and crusting of the scum layer. Once the scum layer is crusted, digestion will fail [2,3,4], which has become a bottleneck for developing biogas from straw.
To address the issue of the scum layer in anaerobic digestion, some research has shown that under the same feed concentration and inoculation ratio, the smaller the straw particle size, the thinner the scum layer, and the smaller the breaking strength [5]. Heap retting pre-treatment by Madhukara et al. can reduce the crusting of the reactor [6]. Rao et al. found that, in the case of normal gas production, acidic conditions are more likely to form scum and crusts [7]. They also found that, in the fully mixed continuous stirred-tank reactor (CSTR), the use of high-level discharge, high-level feed, and backflushing or mechanical stirring on the CSTR can reduce the formation of scum and crusts in the digesting raw materials [8]. Previous studies have adopted methods such as raw material pre-treatment, agitation, control of digestion process conditions, and reaction device design to reduce or control the formation of the scum layer. Although the above treatment methods play a certain role in promoting biogas release and preventing crusting, they do not fundamentally solve the problem of the independent settlement of straw in the liquid [9,10].
The main component of straw is lignocellulose, which is a macromolecular organic compound. According to Archimedes’ law, from the viewpoint of molecular mass alone, straw should have sedimentation in water. However, because of the complex pore structure of straw, the overall bulk density of straw is significantly lower than the specific gravity of water, causing the straw to float in the water, and if the pores of the straw are filled with water, the straw will sink. It can be seen that the key to increasing the settleability of the straw is to improve the water absorption and water absorption rate of the straw. Therefore, this paper starts with improving the settleability of stalk particles and conducts a combination of directional milled and aerobic hydrolysis treatment, which effectively destroys the lignocellulosic structure of the stalks and measures the water absorption kinetics and thermodynamic properties of the corn stalks before and after treatment. The influence mechanism of the aerobic hydrolysis method on the absorption and solubilization of the material in the stalks was explored, along with the internal mass transfer law. The issue of stalks self-settling in the digestion liquid was fundamentally addressed. During the process of batch anaerobic digestion gas production, the kinetic characteristics of organic matter degradation gas production and the gas release characteristics were studied to provide technical support and a theoretical basis for breaking through the bottleneck restricting the development of biogas from straw.
2. Materials and Methods
2.1. Experimental Materials
Corn straw conditioning uses mechanical devices to rub and press the corn straw, so that it can be compressed, with broken skin and cracked joints, in order to change its mechanical and physical properties [11]. After the corn straw was collected and dried naturally, the leaves and ears were removed, and the self-developed recanting roller corn stalks adjusting material device (Figure A1) was used to mill. The average diameter of the corn stalks used in the experiment was 18.22–22.05 mm, and the average height was 1850–2250 mm. According to relevant references, the operating parameters of the milled material device were controlled as follows: the straw feeding speed was 3.3–3.9 km/h, the milled roller speed was 88–98 r/min, and the milled gap was 2.5 mm [11]. The corn stalks before and after treatment was cut into 1 cm pieces for reserve, and 10 g was used for initial index detection. The inoculum was taken from the mesophilic cow dung anaerobic digestion reactor of the Material Energy Engineering Technology Research and Development Center of Northeast Agricultural University. Table 1 shows the characteristics of the inoculum and raw materials.

Table 1.
Characteristics of corn stalks and inoculum.
2.2. Experimental Design
2.2.1. Water Absorption Test of Corn Stalks
A certain amount of corn stalks was weighed before and after treatment and kept in a 100-mesh nylon filter bag. The filter bag was sealed and pressed into distilled water. The temperature of the distilled water was set to 25 °C, 30 °C, 35 °C, 40 °C, 45 °C, and 50 °C and stirred once every 1 h for 15 s. The stalks were taken out regularly, and the surface moisture was dried with filter paper. It was weighed accurately to 0.0001 g and repeated three times. The water absorption rate of the corn stalks during the water absorption process was calculated, and the water absorption kinetics and thermodynamic characteristics of the stalks were fitted using a mathematical model.
Corn stalks were quantitatively weighed before and after the treatment and pressed into a beaker filled with distilled water. A water adsorption test was conducted at 45 °C. First, water was absorbed for 30 min, and the liquid water was taken out and weighed. The free induction decay signal and transverse relaxation time T2 were measured using a low-field nuclear magnetic resonance (NMR) analyser with a magnetic field strength and proton resonance frequency of 0.47 T and 20 MHz, respectively, and the application programme Carr–Purcell–Meiboom–Gill (CPMG). The T2 distribution spectrum was obtained by inverting the T2 data using the Contin algorithm until the weight change remained constant for two consecutive times. NMR analysis was used to determine the water existing state and the migration process in the process of water absorption of the corn straw before and after treatment.
2.2.2. Aerobic Hydrolysis and Anaerobic Digestion Experiments
The aerobic hydrolysis reactor used a 2500 mL wide-mouth bottle (height–diameter ratio of 1:2) with the effective volume of 1750 mL. The experiment was divided into two groups: untreated stalks and milled stalks particles. Each group consisted of 12 treatments. Corn stalks (35 g) and inoculum (580 g) were kept in the reactor, and the total solid (TS) of the hydrolysed digestion broth was milled to 8%. The hydrolysis temperature was set to 25 °C, 35 °C, and 45 °C according to the water absorption experiment, and the hydrolysis time was 4 h, 8 h, 12 h, and 16 h. An aerator (continuous oxygen supply) was put into each reactor with an air supply of 0.5 mL/L, and then the bottle mouth was covered with plastic film for the aerobic hydrolysis experiment. Stirring was conducted once every 1 h (JJ-1H digital display constant speed electric mixer, 200 r/min) for 30 s each time to ensure uniform dissolved oxygen in the liquid phase. After reaching the hydrolysis time, pH value, soluble sugar, volatile fatty acids (VFAs), lignocellulose, infrared spectrum, and changes in the internal structure of stalks were measured.
According to the effect of aerobic hydrolysis, 35 °C was selected as the hydrolysis temperature. After reaching the hydrolysis time, an appropriate amount of inoculum (1100 g) fluid was added to each reactor, and the pH was milled to ensure a suitable environment for anaerobic bacteria. Nitrogen (N2) was then purged for 5 min to ensure an anaerobic environment. After purging, the stalks were sealed with a rubber stopper and placed in a constant temperature (37 °C ± 1 °C) water bath for anaerobic digestion experiments. The reactor was shaken manually twice every morning and evening for 15 s each time during the experiment. The gas volume and composition were measured once a day, and the thickness of the scum layer was measured every day until the end of the experiment.
2.3. Measurement Method
Low-field nuclear magnetic resonance (mq-20) was used to measure the state and migration of water in the process of the water absorption of the corn stalks. The TS, volatile solids (VS), and pH values were determined according to the standard method for the detection of water and wastewater (APHA, 2005). The contents of hemicellulose, cellulose, and lignin were determined by a semi-automatic cellulose analyser [12]. The reducing sugars were analysed using anthrone colourimetry. The gas volume was measured using the water displacement method and converted uniformly to the standard temperature and pressure state (273 K, 1.01 bar) [13,14]. The gas composition, VFAs, and ethanol were analysed by gas chromatograph (GC-6890N, Agilent Inc., Santa Clara, CA, USA). The functional groups of the samples were characterized by Fourier transform infrared spectroscopy and spectrometers [15].
In an anaerobic digestion experiment, the volume ratio of the scum layer is used to determine the existence of scum. This index represents the ratio of the volume of the scum layer to the total volume of the digestion feed and liquid. The anaerobic digestion reactor used in this experiment was a cylinder, the bottom area was eliminated in the numerator and denominator, and the height ratio was used to represent the volume ratio. The formula is as follows:
where h is the scum layer thickness (mm) and H is the total height of the digestion system.
Volume ratio of scum layer (%) = h/H
2.4. Mathematical Model and Data Analysis
2.4.1. Peleg Mathematical Model
In 1988, Peleg proposed two empirical equations with non-exponential parameters [16]. The model was used to fit the water absorption dynamic characteristics of stalks.
2.4.2. Arrhenius Equation
The Arrhenius equation is an empirical formula reflecting the chemical reaction rate constant with temperature [17].
Equation (4) is deformed to obtain Equation (5). Taking 1/T as the independent variable and ln(1/K1) as the dependent variable, the linear equation, activation energy E, and frequency factor K0 of the stalks’ water absorption process can be obtained.
where K0 is the frequency factor (h−1), e is the activation energy (kJ/mol), R is the gas constant (8.3145 kJ/(mol·K)), and t is the absolute temperature (k).
2.4.3. Methane Production Model
The Gompertz model has been widely used in methane production [18,19] and was also adopted in this study to predict the methane production process. The Gompertz model is shown in Formula (6):
Where P(t) is the cumulative gas yield at time t (mL g−1 VS); P∞ is the maximum cumulative gas yield (mL g−1 VS); Rm is the maximum gas production rate (mL g−1 VS day); λ is the lag period (d); t is the digestion time; and e is the Euler constant (2.718282).
3. Results
3.1. Effect of Corn Stalks Conditioning
The corn stalks were placed in the gap between the upper and lower rollers of the mechanical equipment, and the continuous milled operations such as rolling, cracking, and breaking of the husks were realized through the coordination of the gear pair of the upper and lower rollers and the floating pressing device. After being milled, the average spreading rate and pressing rate of the corn stalks reached 29.58% and 18.58%, respectively After being milled, the water content of the stalks decreased to 6.94% after drying, indicating that, after milling, the hard and dense structure of the stalks was effectively destroyed, increasing their porosity and leading to further evaporation of internal water and water loss [20].
Figure 1 shows that the sponge tissue of untreated stalks is arranged neatly, the pore structure is complete, and the surface is smooth and compact. The solid texture structure also greatly reduces the contact area between the cellulase secreted by bacteria and stalks. Furthermore, it inhibits the smooth start of stalks’ anaerobic digestion and gas production, resulting in poor gas production in the digestion process and low gas production efficiency. After the stalks are milled, the internal structure changes after being rolled and rubbed by an external force. Around the spongy tissue was crushed, porosity cracks were reported in parts of the organization, and some cell surface was damaged and exposed part of the cellulose; the subsequent hydrolysis-digestion process can increase the contact area of the microorganism with cellulose and is more conducive to the fibrous material degradation. At the same time, due to the destruction of the stem structure, the internal porosity increases, which is conducive to increasing the water absorption of the stem itself, so as to improve the settlement performance.
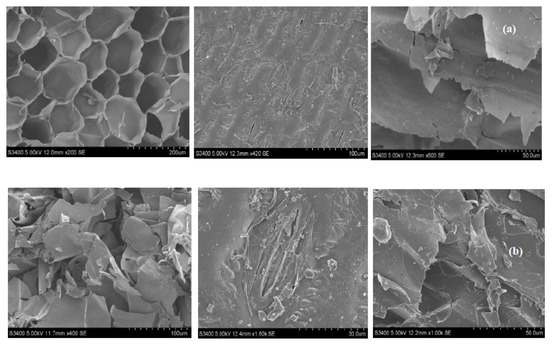
Figure 1.
SEM imaging of corn stalks. (a) represents untreated stalks and (b) represents milled treated stalks.
3.2. Water Absorption Characteristics of Corn Stalks
3.2.1. Changes of the Water Absorption Rate of Corn Stalks
Figure A2 shows that the water absorption rate of corn stalks increases steadily with increasing water absorption time. During the water absorption period of 0–2 h, the water absorption rate was fast, showing a straight-line upward trend. After 2 h, the water absorption rate decreased with the time extension and showed a slowly increasing trend. The untreated stalks reached a balance after 24 h of water absorption, while the conditioned stalks reached a water absorption balance after about 12 h with a water absorption rate of 1017.51%, which is 120% higher than that of the untreated stalks in the same time. At the same time, the figure shows that the higher the temperature, the greater the water absorption of stalks. Under the water absorption conditions of different temperatures, the water absorption rate of 0–5 h was faster than that of the untreated stalks. When the water absorption temperature was 50 °C, the water absorption rate was 665.99%, 102.48% higher than that of the untreated stalks.
3.2.2. Establishment and Analysis of Water Absorption Kinetic Parameters of Corn Stalks
The water absorption process of corn stalks at different temperatures can be well fitted using the Peleg equation. The R2 of the untreated stalks was greater than 0.98 and the relative error was 0.332–3.069%, while the R2 of the conditioned stalks was greater than 0.99 and the relative error was 0.013–0.089%, indicating that the fitting effect of the dynamic equation of the water absorption process of the conditioned stalks was better than that of the untreated stalks. In addition, K1 and K2 showed a downward trend with the increase in temperature. Taking the temperature as the independent variable and the two water absorption parameters of the quenched and tempered stalks as the dependent variable, the linear curve (Figure 2) and linear equation (Equations (7) and (8)) of K1 and K2 with respect to temperature can be obtained.
y = −0.0010x + 0.0123 (R2 = 0.8091)
y = −0.0009x + 0.0125 (R2 = 0.9019)
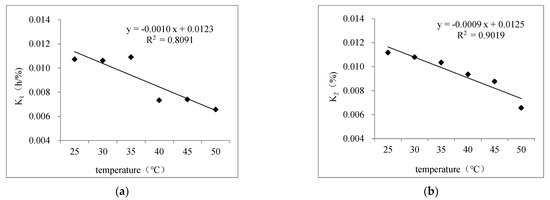
Figure 2.
Variation relationship between parameters K1 (a) and K2 (b) of Peleg equation of quenched and tempered stalks and temperature.
The formulas show that the conditioned stalks K1 and K2 have a negative correlation with temperature, indicating that under the condition of 25–50 °C, with the increase of temperature, the higher the water absorption rate of the stalks, the greater the moisture content of the stalks when reaching equilibrium. Bringing Formulas (7) and (8) into Formula (2), the water absorption kinetic equation of the conditioned stalks at 25–50 °C can be obtained: Mt = 6.94 + t/[0.0123 − 0.001T + (0.0125 − 0.0009t) t], where 6.94 is the initial water content of the conditioned stalks M0 (%), T is the temperature (°C), and t is the time (H). This equation reflects the relationship between the water content of the conditioned stalks and the temperature and time in the process of water absorption. Additionally, it can predict the water content at any time under the water absorption temperature of 25–50 °C.
3.2.3. Fitting of the Arrhenius Equation and Activation Energy
The Arrhenius equation reflects the relationship between the rate constant K1 and temperature. The equation expressed 1/T × 103 as the independent variable and ln(1/K1) as the dependent variable. Figure 3 shows the fitting curve. The linear equation with a good fitting degree was obtained, and the correlation coefficient was 0.8218. Therefore, the activation energy E of stalks during soaking was 0.9345 kJ/mol, and the frequency factor K0 was 77.3 h−1. Thus, the Arrhenius equation of modified corn stalks was obtained: 1/K1 = 77.3 × exp(−0.9345/T), from which the relationship between the rate constant K1 and temperature can be further obtained.
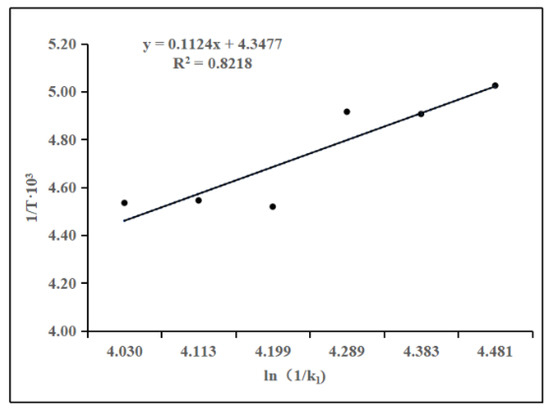
Figure 3.
Parameter fitting of Arrhenius equation of stalks after conditioning treatment.
3.2.4. Water Existing State and the Migration Process of Corn Stalks in the Process of Water Absorption
Figure 4 shows the water distribution of the untreated and conditioned stalks at different time points during 0–7 h of water absorption. The figure shows that, in the initial state, the internal water of the untreated and conditioned stalks exists in three forms: combined, non-flowing, and free water. Among them, the relaxation time of the combined and non-flowing water of the untreated stalks was shorter than that of conditioned stalks, indicating that the combination between water and matter in untreated stalks was closer than that of the conditioned stalks. The calculation of their peak areas shows that the combined water signal amplitude of the untreated stalks was 0.135 AU more than that of the conditioned stalks. The signal amplitude of water that does not easily flow was 0.415 AU less than that of the conditioned stalks. In addition, in the initial state, the free water signal amplitude of the untreated stalks was 2.728 AU, while there was no free water in the conditioned stalks.
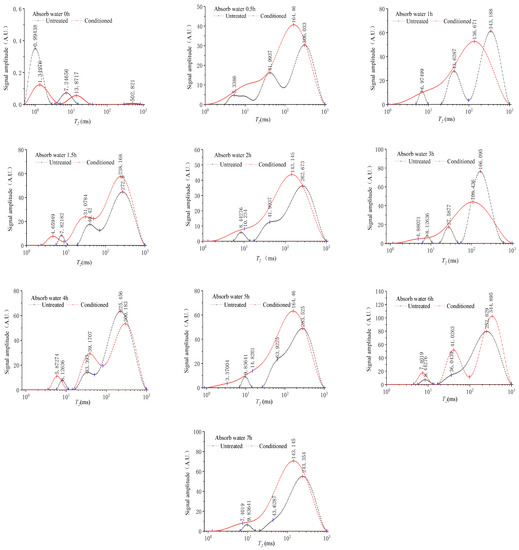
Figure 4.
Water distribution of corn stalks during water absorption. The relaxation time (T2) of 1–10 ms refers to bound water, 10–100 ms represents non-flowing water, and 100–1000 ms represents free water.
Figure 4 shows that when water absorption is 0.5 h, the internal water of the untreated and conditioned stalks changed significantly, and the free water content of both stalks increased significantly. Among them, the relaxation time of the three forms of water of the untreated stalks was longer than that of the conditioned stalks. Except for free water, the water content of the other two forms was higher than that of the conditioned stalks, with the signal amplitude reaching 45.63 AU and 872.047 AU, respectively. However, the total content signal amplitude of the three forms of water was 2957.46 AU lower than that of the conditioned stalks, indicating that in the early stage of the water absorption process, the water absorption rate of the conditioned stalks was faster than that of the untreated stalks, and the combination of water and matter was closer. With the increase in water absorption time, the bound water content of the untreated stalks was lower than 0.5 h, and the bound water content of the conditioned stalks reached the maximum value at 6 h, which was 78.454 AU. The free water content of the two reached the maximum at 6 h, being 37,714.373 AU and 48,341.522 AU, respectively. In the whole water absorption process, three forms of water in the untreated stalks always exist. There was no obvious boundary at 1, 2, 3, and 7 h, while the conditioned stalks were not easy to flow and free water. This may be due to the destruction of the internal structure of the quenched and tempered stalks, which increases the surface area and porosity of the stalks, making it easier for the absorbed water to be in a free state inside the stalks and not bound by the complex internal structure of the stalks. When the water absorption of the untreated and conditioned stalks reached 6 h, the water content reached the maximum, that is, 37,905.367 and 50,746.436 AU, indicating that the water absorption of the conditioned stalks was higher than that of untreated stalks at the same time.
3.3. Aerobic Hydrolysis Stage
3.3.1. pH and VFAs
Figure 5 shows that the pH of the untreated stalks at the hydrolysis temperature of 35 °C and 45 °C gradually increased between 4 and12 h and reached the highest point at 12 h, then decreased slightly with the increase in hydrolysis time. The variation range of pH in the whole hydrolysis process was 7.232–7.529 and 7.232–7.621, respectively. The conditioned stalks were hydrolysed at 25 °C, 35 °C, and 45 °C. The pH change was the same in the whole process, which increased slightly in the stage of 0–4 h, and the pH value reached 7.277, 7.370, and 7.357, respectively. The pH decreased between 4 and 12 h and showed an upward trend from 12 to 16 h.
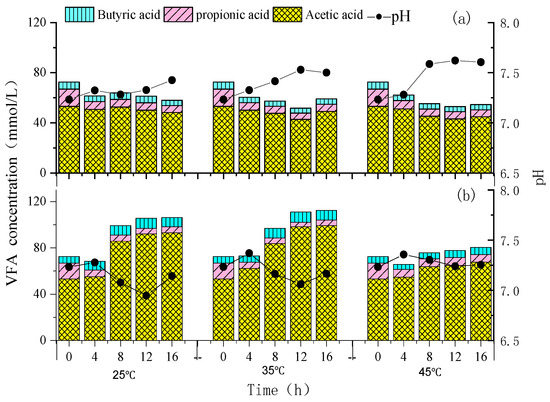
Figure 5.
Variation of pH and VFAs with hydrolysis time. (a) represents untreated stalks and (b) represents milled treated stalks.
The transformation rules of the total VFAs content of the untreated stalks (a) at different temperatures with the increase in hydrolysis time were similar, showing a downward trend. The difference was that, when the hydrolysis time was 8 h at 25 °C, the accumulation of acetic acid increased to 52.66 mmol/L, and when the hydrolysis time was 16 h at 35 °C, the accumulation of acetic acid increased to 49.12 mmol/L. The content of propionic acid decreased significantly after hydrolysis for 4 h. With the increase in hydrolysis time at different temperatures, the accumulation of total VFAs content increased continuously, but the increase rate differed. As shown in Figure 5, at 4 h, the acetic acid content produced by the hydrolysis of the conditioned stalks at 25 °C, 35 °C, and 45 °C was 55.14, 62.13, and 54.76 mmol/L respectively, which was 3.80%, 16.96%, and 3.09% higher than the initial acetic acid content. This indicates that the rate of hydrolysis at 35 °C to produce VFAs is faster at the same time. During the hydrolysis process at 25 °C and 35 °C, the content of VFAs reached saturation in 12 h; at 45 °C, it reached saturation in 8 h. With the increase in hydrolysis time, the content of VFAs did not significantly change. At this time, the acetic acid content was 92.14, 98.2, and 63.78 mmol/L. The propionic acid content decreased significantly in the hydrolysis process, indicating that most of the propionic acid was consumed in the hydrolysis process. The propionic acid content increased slightly after hydrolysis for 12 h, indicating that the appropriate hydrolysis time is conducive to the subsequent methanogenic digestion.
3.3.2. Lignocellulose
Figure 6 shows the change in lignocellulose degradation rate with the increase in hydrolysis time at different temperatures of the untreated stalks (a) and quenched and tempered stalks (b). The figure shows that, with the extension of hydrolysis time, the degradation rate of lignocellulose gradually increased, but there were certain differences in the degradation rates of the three structures. The degradation rates of cellulose and hemicellulose were significantly higher than that of lignin, which is due to the higher utilisation of cellulose and hemicellulose by microorganisms in the hydrolysate than lignin. The degradation rates of hydrolysed lignocellulose from the untreated stalks at 35 °C were higher than those at the other two temperatures. The degradation rates of lignocellulose reached 38.32%, 53.35%, and 41.18% at 25 °C, 35 °C, and 45 °C, respectively, for 16 h. Komemoto found that the degradation rate and gas production of lignocellulose after 35 °C treatment were both higher than 45 °C, similar to the results of this study [21]. As shown in the figure, under the same temperature and hydrolysis time, the degradation rate of lignocellulose of the conditioned stalks was higher than that of the untreated stalks. After hydrolysis for 16 h, the degradation rate of lignocellulose was 61.53%, 81.02%, and 68.37%, respectively, which was 23.21%, 27.67%, and 27.19% higher than that of the untreated stalks.
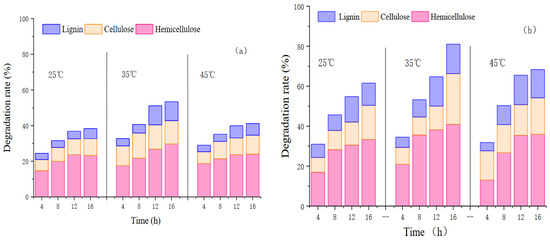
Figure 6.
Variation of lignocellulose degradation rate with hydrolysis time. (a) represents untreated stalks and (b) represents milled treated stalks.
3.3.3. Fourier Transform Infrared Analysis
In the analysis of stalks’ fibre composition, qualitative analysis can be conducted with the help of the infrared spectrum [22]. Figure 7 shows that the shapes of the infrared absorption peaks of corn stalks treated at different times are similar, and there is no obvious change in the properties of functional groups, but there are some differences in the intensity of some characteristic absorption peaks [23]. The structural changes of the corn stalks during hydrolysis mainly passed through the range of 500 to 4000 cm−1, showing strong absorption bands at 3404 and 1054 cm−1. In contrast, the relative intensity of the absorption peaks of the quenched and tempered stalks at these two wavenumbers was significantly lower than that of the untreated stalks, indicating that the destruction degree of the hydrogen bond between the cellulose molecules of the quenched and tempered stalks was higher than that of the untreated stalks, and the water molecules were more easily absorbed, causing the cellulose to swell. At the same time, the long-chain fatty acid structure on the surface of the stalks was damaged by aerobic hydrolysis. The lattice structure of lignocellulose also changed, promoting microorganisms to degrade the corn stalks more quickly. At 1732 and 1426 cm−1, the characteristic peaks gradually weakened with the increase in hydrolysis time. The peak value of milled stalks at 1732 cm−1 disappeared. With the increase in hydrolysis time, the absorption peak disappeared more clearly, indicating that a large amount of hemicellulose in the stalks was de-acetylated, and external factors easily destroyed hemicellulose due to its unstable structure. Then, degradation occurs. The intensity of the 1245 cm−1 absorption peak decreased gradually during the hydrolysis process, indicating that the C–O bond of lignin also breaks during the hydrolysis process.
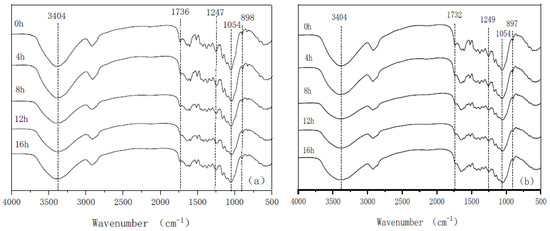
Figure 7.
FTIR diagram of corn stalks at different hydrolysis times. (a) represents untreated stalks and (b) represents milled treated stalks.
3.3.4. Microstructure
Figure A3 shows that after 12 h of hydrolysis of the untreated stalks, the surface structure of the stalks was broken, the texture became rough, and the regular arrangement was broken. Cracks appeared in some vascular tissues, exposing the secondary wall of the vascular bundle conduit. Some small holes were formed on the surface of some rod-shaped tissues, and many uneven faults appeared. These pores may result from the enzymatic hydrolysis of organic matter degradation in less lignified areas, through which soluble substances (easily degradable nutrients), water, and signal molecules diffuse between cells. Through comparison, it was found that after 12 h of hydrolysis, the surface of the adjusted stalks changed from smooth and flat to slightly lead toothed. Additionally, the damage to sponge tissue was more serious. The structure was loose, the folds increased, the pores expanded, some leaf hairs were broken, and cavities appeared. This may be due to the swelling phenomenon of water absorption, and the tissue structure is easier to destroy under hydrolytic microorganisms. By observing the microstructure of the hydrolysed stalks, it was found that there were large cracks in the fibre structure of the stalks, and the internal and external structure of the wood fibre changed in varying degrees, from a smooth and flat, orderly arrangement to the increase of broken marks, the increase of holes, and the fibre bundle becoming scattered and fluffy. In a certain form, this change is more conducive to the contact between the stalks and the digestion liquid; thus, it is beneficial to the more efficient resource transformation of stalks.
3.4. Anaerobic Digestion Stage
3.4.1. Change of Stalks’ Scum Layer
Figure 8 shows the change process of the scum layer volume ratio during the anaerobic digestion of the untreated stalks (a) and conditioned stalks (b). The figure shows that, after aerobic hydrolysis, there was a certain difference in the volume ratio of the scum layer between the untreated and conditioned stalks before digestion. The volume ratio of the scum layer of the conditioned stalks at different hydrolysis times was about 5% lower than that of the untreated stalks. Overall, with the extension of digestion time, the volume ratio of the scum layer decreased gradually. Within 0–2 days of anaerobic digestion, the volume ratio of the scum layer decreased rapidly. At this time, the untreated and conditioned stalks scum layer hydrolysed for 8 h and reached the lowest values of 48.1% and 36.6%, respectively, indicating that the original dense structure of corn stalks is further damaged after aerobic hydrolysis. Additionally, as anaerobic digestion microorganisms and water molecules can more easily enter the structure of stalks, the sedimentation of the corn stalks was further enhanced. After 2 days of anaerobic digestion, the reduction rate of the volume ratio of the scum layer was relatively slow, which may be because the gas produced by digestion squeezes out the pore water between stalk particles. At the same time, the smaller stalk particles have a large accessible surface area, and the enhanced water absorption capacity increases their density. When their gravity is quite buoyant, they seem suspended or sinking, which continuously reduces the thickness of the scum layer. Figure 8 shows that the volume ratio of the scum layer of the untreated stalks reached an equilibrium state after digestion for about 18 days. With the extension of digestion time, the volume ratio of the scum layer changed little. After hydrolysis for 12 h at 24 days of digestion, the volume of the stalks’ scum layer reached the minimum value of 28.6%. In contrast, the volume ratio of the scum layer of the conditioned stalks was balanced after about 15 days of digestion. The lowest volume ratio of the scum layer was 15.6% after 24 days of digestion, which was 13% lower than that of the untreated stalks. Some studies have found that more than 90% of the scum layer in stalks is composed of pulp. The pulp of corn stalks is fully extruded and crushed into small particles after conditioning treatment; because the particles are small and can be in full contact with the digestion broth, it is easier to reach the water absorption saturation state to increase the sedimentation of stalks. At the same time, the extension of hydrolysis time can also increase the water saturation of stalks to achieve the purpose of sedimentation.
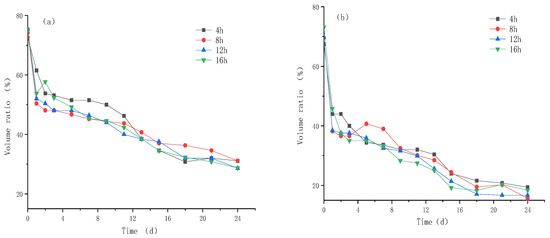
Figure 8.
Volume ratio of scum layer during anaerobic digestion of corn stalks. (a) represents untreated stalks and (b) represents milled treated stalks.
3.4.2. Cumulative Methane Production and Volumetric Methane Production Rate
Table 2 shows the fitting of the cumulative methane production. The goodness of fit R2 of the Gompertz model was higher than 0.986. The maximum cumulative methane yield of the untreated and conditioned stalks occurred under the condition of hydrolysis for 12 h. The fitting results are consistent with reality and can accurately reflect the change of cumulative methane yield in the digestion process.
Table 2.
Fitting table of cumulative methane production.
Figure 9 show the changes in cumulative methane production, volumetric methane production rate, and volumetric methane production rate during the anaerobic digestion of the untreated stalks (a) and conditioned stalks (b) at different hydrolysis times. The figure shows that different hydrolysis times greatly impact the cumulative methane yield of anaerobic digestion. The cumulative methane yield reached the maximum at 12 h of aerobic hydrolysis. The untreated and conditioned stalks were 252.5 and 319.64 mL/g VS, respectively. The cumulative methane yield at 4 and 16 h of hydrolysis was significantly lower. At the same time, it can be seen that under the conditions of 4 h, 8 h, and 12 h hydrolysis of the untreated stalks, the volumetric methane production rate increased rapidly 7 days before digestion, and the maximum rates were 25.95 mL/g VS·d, 39.37 mL/g VS·d, and 40.93.14 mL/g VS·d, respectively; under the condition of hydrolysis for 16 h, the methane production rate of VS reached the highest point on the 9th day of digestion, which was 31.60 mL/g VS·d, then it decreased gradually with the extension of digestion time. Under the conditions of 4 h, 8 h, 12 h, and 16 h hydrolysis, the volumetric methane production rate of the conditioned stalks increased rapidly two days before digestion, and the maximum rates were 41.47 mL/g VS·d, 43.70 mL/g VS·d, 41.61 mL/g VS·d, and 42.82 mL/g VS·d, respectively. As shown in Figure 9, the volumetric methane production rate of the untreated and conditioned stalks increased first and then decreased with the extension of digestion time. After hydrolysis for 12 h, the volumetric methane production rate of the untreated stalks reached the maximum value of 2.154 mL/mL·d on the 9th day of digestion, while the conditioned stalks reached the maximum value of 4.208 mL/mL·d 4 days earlier than the untreated stalks. From the above analysis, it can be deduced that the methane production process of conditioned stalks digestion is faster than that of untreated stalks, which can shorten the time of anaerobic digestion. Additionally, the cumulative methane production (hydrolysis for 12 h) was 26.5% higher than that of the untreated stalks at the end of digestion. This may be because after a certain conditioning treatment, the particle size of the corn stalks is reduced and the dense structure of the internal lignocellulose is destroyed. This further makes it quickly absorb water in the aerobic hydrolysis process, quickly reach the saturation state, precipitates the available substances conducive for digestion and gas production, increases the sedimentation performance of the stalks, and increases the contact area between microbial secretions and the stalks [24].
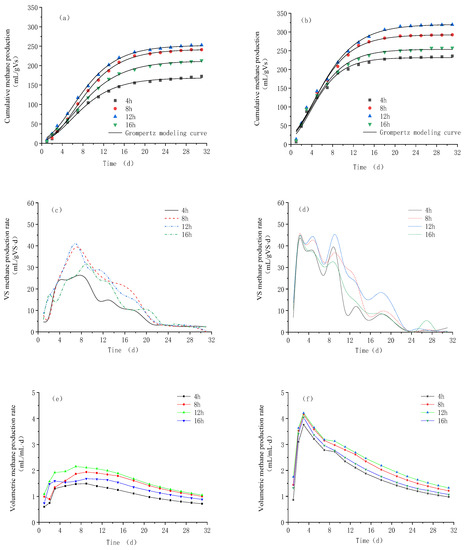
Figure 9.
Changes of cumulative methane production, volumetric methane production rate, and volumetric methane production rate during anaerobic digestion of corn stalks. (a,c,e) represents untreated stalks and (b,d,f) represents milled treated stalks.
4. Discussion
The water movement direction in a plant body flows from the ground with high water potential to the place with low water potential, while the water potential of distilled water is 0/MPa and the water potential inside the stalks is <−0.9/MPa. Therefore, water molecules enter into the stalks through capillary transport, and the higher the temperature is, the more intensely the water molecules move [25]. The analysis shows that in the process of water absorption, the water potential difference between the inside and outside of the stalks gradually decreases, and the movement rate of water molecules also gradually decreases, so that the water absorption rate decreases. When the water absorption reaches a certain time, the flow process of water in the straw presents a dynamic balance.
The principle of low-field NMR technology is to use the spin characteristics of the 1H nucleus in the magnetic field. Hydrogen protons mainly come from water molecules. Therefore, the characteristics of material water distribution and water migration can be analysed by measuring the change in the transverse relaxation time of hydrogen protons in the process of changing from a high-energy to a low-energy state [26]. It can be seen from the analysis of the above results that the conditioning treatment of corn stalks can destroy its internal structure to a certain extent, resulting in less bound water in the stalks and higher water freedom. At the same time, after the structure is damaged, it also speeds up the process of water evaporation and volatilises the free water in the free state. This is consistent with the conclusion that the conditioning treatment of corn stalks accelerates water evaporation, as studied by Li Wenzhe and others [20]
Macromolecular organics are raw materials for wood fibre and their proportion in stalks is high. Hydrolysis is the process of transforming macromolecules into small molecule organics. Among small molecule organics, VFAs are an important kind which are important substrates for methanogens. The research shows that acetate is the only VFA that can be used by methanogens as a substrate; propionic acid cannot be used directly. If propionic acid is accumulated, it will be unfavourable to the anaerobic digestion process and even lead to the failure of anaerobic digestion [27]. The above analysis shows that stalks absorb water rapidly in the initial hydrolysis stage. Cellulose swelling causes cell wall rupture and dissolves or precipitates some matrix processes that easily degrade sugars. At this time, the protein precipitation makes protein ammoniating bacteria proliferate gradually, and the cultivation and reproduction of acid-producing microbial strains need a certain time, resulting in a small increase in pH [28]. With the increase of hydrolysis time, the acid-producing bacteria in the matrix gradually reproduce and decompose the dissolved or precipitated substances into acids, resulting in the rapid decline of pH [29,30]. Among them, the untreated stalks decreased slightly after 16 h of hydrolysis, indicating that the tissue structure of untreated stalks has a high lignification intensity and the degree of hemicellulose destruction is weak. Hence, it is not easy to precipitate easily degradable substances in a short time, resulting in a slow hydrolysis rate. However, due to the destruction of the internal structure of quenched and tempered stalks, it is easier to dissolve easily degradable products such as sugars during 0–4 h of hydrolysis. More substances were precipitated at 35 °C, and the pH increased to 7.370. After hydrolysis for 4 h, the pH showed a downward trend. In addition, the acid accumulation of conditioned stalks in the aerobic hydrolysis stage is higher than that of untreated stalks. This is because the relatively solid fibre structure of stalks is destroyed after conditioning treatment so that aerobic microorganisms can enter the stalks more quickly with the inhalation of water and quickly decompose the soluble organic matter in the stalks. However, it is more conducive for anaerobic digestion in the later stage. Simultaneously, with the increase of hydrolysis time, the easily used cellulose and hemicellulose gradually decrease, the degradation rate begins to slow down, and the accumulation of VFAs also decreases [31].
Due to the compactness of the wood fibre structure in the stalks, it is difficult to react directly with the anaerobic digestion bacteria, which not only reduce the methane production rate but also fail to absorb water and settle, resulting in scum floating on the surface of the digestion liquid [32,33]. The results confirmed that under the same temperature and hydrolysis time, the degradation rate of lignocellulose of conditioned stalks is higher than that of untreated stalks. This may be due to the destruction of the structure of lignocellulose in the process of stalks conditioning; the compactness of cellulose and hemicellulose is reduced, which is more conducive to being degraded by hydrolytic microorganisms. At the same hydrolysis time, the degradation rate of lignin was lower than that of cellulose and hemicellulose. Under the same hydrolysis conditions at 35 °C, the lignocellulose degradation rate of quenched and tempered stalks hydrolysed for 8 h is close to that of untreated stalks for 16 h. It can be seen that the aerobic hydrolysis process can effectively improve the degradation rate of lignocellulose and reduce the hydrolysis time after a certain milled treatment [12]. Analysis of the FTIR results showed that the peak value of the quenched and tempered stalks changed more obviously, indicating that the internal structure of the stalks was changed after a certain amount of conditioning; the dense structure of lignin was destroyed, which made it easier for microorganisms to enter the stalks for full degradation.
By changing the hydrophobicity of plants and the water surface tension on them, promoting the hydration of plant tissues, the water is adsorbed to the hydrophilic polysaccharides such as pectin and cellulose in epidermal cells, which will produce a “water polarity hole”, as a channel for water to enter the stratum corneum. This promotes the absorption of water; at the same time, when the cell water absorption volume increases, the cell fluid is diluted and the water potential increases. When the cell is saturated with water, the water potential will turn to zero; as a result, the speed of water in and out of the cell is equal, reaching a dynamic equilibrium state. Through the above comprehensive analysis, it can be seen that after conditioning and conditioning treatment, the physical morphology of corn stalks changes, and the fibre structure of the cell wall is destroyed to a certain extent. When the treated corn stalks absorb water, they can absorb more water due to the lack of cell wall support and restriction, and this water mostly exists in the form of free water, which is the solvent of material absorption and transportation. At the same time, the stalk conditioning changes the hydrophobicity and the water on its surface tension, making the water more easily adsorbed on the polysaccharide components such as lignocellulose throughout the digestion stage, which, after milled treatment of the stalks, quickly reach water saturation, making the solution in the interior in dynamic equilibrium, thus improving the settleability of stalks in a solution. At the same time, as water is adsorbed on lignocellulosic microorganisms, the degradation rate is accelerated, the start-up speed of anaerobic digestion is improved, the scum layer is effectively reduced, and the formation of crusts in the process of digestion is greatly reduced, so as to improve the efficiency of gas production.
5. Conclusions
After adjustment, the water absorption of corn stalks was significantly improved, and the water distribution changed in the process of water absorption. The combination of water and matter was closer. Under the condition of water absorption saturation, the total content signal amplitude was 12841.07 AU higher than that of the untreated stalks. At the same time, it effectively improved the degradation rate of lignocellulose, reduced the volume of the scum layer in the digestion process, and increased the cumulative methane production. The content of VFAs hydrolysed for 12 h at 35 °C reached saturation, and the degradation rate of lignocellulose was 27.67% higher than that of untreated stalks. In these conditions, the volume ratio of the milled stalks’ scum layer decreased by 46.8% and the maximum cumulative methane yield was 319.64 mL/g VS. This paper only explores the mechanism of milled stem water absorption and the characteristic changes of micro fibre structure; for determining the improvement mechanism of adjustment treatment on the mass transfer characteristics of stems, it provides technical support and a theoretical basis for breaking through the bottleneck restricting the development of straw biogas. In the follow-up, we can continue to study the influence of the precipitated state of reactants on the rheological properties of liquid and the floating movement of particles during straw soaking, so as to obtain the basic conditions for the stem slow down ascent rate in the liquid, establishing the principle and threshold of straw particle floating.
Author Contributions
H.J. (Hao Jiao): conceptualization, supervision, writing—original draft, funding acquisition, and project administration. W.L.: conceptualization, supervision, writing—original draft, funding acquisition, project administration, and investigation. H.J. (Hongjing Jing): data curation and formal analysis. M.W.: validation, visualization, supervision, conceptualization, project administration, and methodology. P.L.: validation, visualization, and supervision. Y.S.: conceptualization, supervision, funding acquisition, project administration, and resources. All authors have read and agreed to the published version of the manuscript.
Funding
This work was supported by the National Natural Science Foundation of China (52076034), the National Key Research and Development Program Strategic Key Special Subject of International Science and Technology Innovation Cooperation (2018YFE0206600), and the National Key R&D Program of China (2019YFD1100603).
Institutional Review Board Statement
Not applicable.
Informed Consent Statement
Not applicable.
Data Availability Statement
The data presented in this study are available upon request from the corresponding author.
Conflicts of Interest
The authors declare that they have no known competing financial interests or personal relationships that could have appeared to influence the work reported in this paper.
Appendix A
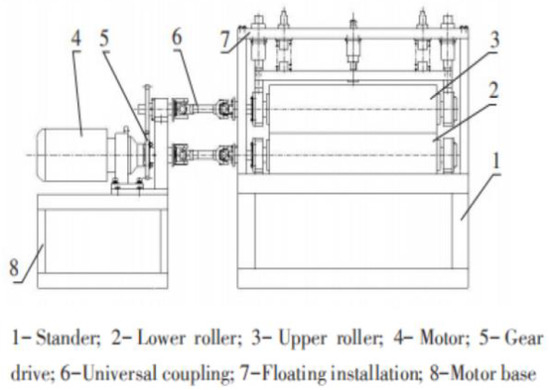
Figure A1.
Structure of adjusting material device [11].
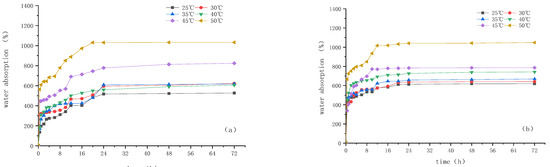
Figure A2.
The variation of water absorption of various corn stovers. (a) represents untreated stalks and (b) represents milled treated stalks.
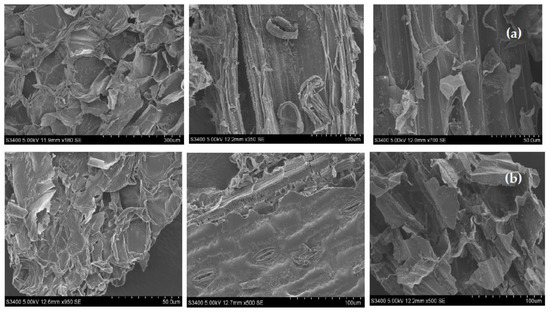
Figure A3.
SEM imaging of corn stalks. (a,b) are SEM images of untreated stalks and adjusted stalks hydrolysed for 12 h at 35 ± 1 °C.
References
- Yang, Q.; Ju, M.; Li, W. Research progress of anaerobic digestion of straw for methane production. J. Agric. Eng. 2016, 32, 232–242. [Google Scholar]
- Su, Y.; Chen, X.; Ma, H. Effect of stirring on biogas digestion. Anhui Agron. 2007, 35, 8961–8962. [Google Scholar]
- Xiong, X.; Shi, G.; Luo, T.; Kong, C. Causes and Countermeasures of scum crusting in straw biogas digestion. Biogas China 2014, 32, 51–54. [Google Scholar]
- Cui, W.; Liang, J.; Du, L.; Zhang, K. Current situation and existing problems of large-scale straw biogas project in China. Bull. Chin. Agron. 2013, 29, 121–125. [Google Scholar]
- Li, X. Study on Biogas Production by Anaerobic Digestion of Straw and Its Crusting Characteristics; Agricultural University: Zhengzhou, China, 2013. [Google Scholar]
- Madhukara, K.; Srilatha, H.; Srinath, K.; Bharathi, K.; Nand, K. Production of methane from green peashells in floating dome digesters. Process Biochem. 1997, 32, 509–513. [Google Scholar] [CrossRef]
- Rao, M. Bioenergy conversion studies of organic fraction of MSW: Kinetic studies and gas yield-organic loading relationships for process optimization. Bioresour. Technol. 2004, 95, 173–185. [Google Scholar] [CrossRef]
- Song, B.; Deng, L.; Liu, C.; Pu, X.; Zhang, G.; Lei, Y.; Shi, G. Review on the effect of stirring on biogas production by anaerobic digestion. Renew. Energy 2009, 27, 110–112. [Google Scholar]
- Chu, X.; Cheng, Q.; Xu, Y.; Luo, L.; Wang, M.; Zheng, G.; Zhang, H.; Yi, W.; Liu, X.; Sun, Y.; et al. Anaerobic digestion of corn straw pretreated by ultrasonic combined with aerobic hydrolysis. Bioresour. Technol. 2021, 341, 125826. [Google Scholar] [CrossRef]
- Abraham, A.; Mathew, A.K.; Park, H.; Choi, O.; Sindhu, R.; Parameswaran, B.; Pandey, A.; Park, J.H.; Sang, B.-I. Pretreatment strategies for enhanced biogas production from lignocellulosic biomass. Bioresour. Technol. 2020, 301, 122725. [Google Scholar] [CrossRef]
- Dong, X.; Wang, X.N.; Li, Z.H.; Song, L.Y. Parameters optimization experiment of corn straw adjusting material device based on horizontal roller. J. Northeast. Agric. Univ. 2013, 44, 95–100. [Google Scholar]
- Zhang, B. Study on Sedimentation and Gas Production Characteristics of Corn Straw during Anaerobic Digestion; Northeast Agricultural University: Harbin, China, 2019. [Google Scholar]
- Kafle, G.K.; Kim, S.-H. Kinetic Study of the Anaerobic Digestion of Swine Manure at Mesophilic Temperature: A Lab Scale Batch Operation. J. Biosyst. Eng. 2012, 37, 233–244. [Google Scholar] [CrossRef]
- Zhang, Q.G.; Jin, P.; Li, Y.M.; Zhang, Z.P.; Zhang, H.; Ru, G.M.; Jiang, D.P.; Jing, Y.Y.; Zhang, X.T. Analysis of the characteristics of paulownia lignocellulose and hydrogen production potential via photo digestion. Bioresour. Technol. 2021, 344, 126361. [Google Scholar] [CrossRef] [PubMed]
- Sun, Y.; Zhang, Z.Z.; Sun, Y.M.; Yang, G.X. One-pot pyrolysis route to Fe−N-Doped carbon nanosheets with outstanding electrochemical performance as cathode materials for microbial fuel cell. Int. J. Agric. Biol. Eng. 2020, 13, 207–214. [Google Scholar] [CrossRef]
- Peleg, M. An empirical model for the description of moisture sorp-tion curves. J. Food Sci. 1998, 53, 1216–1219. [Google Scholar] [CrossRef]
- Pal, D.B.; Srivastava, N.; Pal, S.L.; Kumar, M.; Syed, A.; Elgorban, A.M.; Singh, R.; Gupta, V.K. Lignocellulosic composition based thermal kinetic study of Mangiferaindica Lam, Artocarpus Heterophyllus Lam and Syzygium Jambolana seeds. Bioresour. Technol. 2021, 341, 125891. [Google Scholar] [CrossRef]
- Benbelkacem, H.; Bayard, R.; Abdelhay, A.; Zhang, Y.; Gourdon, R. Effect of leachate injection modes on municipal solid waste degradation in anaerobic bioreactor. Bioresour. Technol. 2010, 101, 5206–5212. [Google Scholar] [CrossRef]
- Díaz, I.; Donoso-Bravo, A.; Fdz-Polanco, M. Effect of microaerobic conditions on the degradation kinetics of cellulose. Bioresour. Technol. 2011, 102, 10139–10142. [Google Scholar] [CrossRef]
- Li, W.; Dong, X.; Wang, D. Performance test of spiral toothed roller type straw conditioning device. J. Agric. Mach. 2011, 42, 143–147. [Google Scholar]
- Komemoto, K.; GLim, Y.; Nagao, N. Effect of temperature on VFA’s and biogas production in anaerobic solubilization of food waste. Waste Manag. 2009, 29, 2950–2955. [Google Scholar] [CrossRef]
- Deng, X.; Chang, J.; Hong, Y. Effects of different pretreatment methods on the structure and degradation of cellulose from corn and rice straw. J. Yunnan Agric. Univ. 2013, 25, 148–157. [Google Scholar]
- Sun, Y.; Cheng, J.J. Dilute acid pretreatment of rye straw and bermudagrass for ethanol production. Bioresour. Technol. 2005, 96, 1599–1606. [Google Scholar] [CrossRef] [PubMed]
- Wang, C.; Zhang, J.; Hu, F.; Zhang, S.; Lu, J.; Liu, S. Bio-pretreatment promote hydrolysis and acidification of oilseed rape straw: Roles of digestion broth and micro-oxygen. Bioresour. Technol. 2020, 308, 123272. [Google Scholar] [CrossRef] [PubMed]
- Li, H. Modern Plant Physiology; Higher Education Press: Beijing, China, 2006. [Google Scholar]
- Pu, C.; Liu, H.; Ding, G.; Sun, Y.; Yu, X.; Chen, J.; Ren, J.; Gong, X. Impact of directapplication of biogas slurry and residue in fields: In situ analysis ofantibiotic resistance genes from pig manure to fields. J. Ofhazardous Mater. 2017, 344, 441–449. [Google Scholar] [CrossRef]
- Rajagopal, R.; Lim, J.W.; Mao, Y.; Chen, C.-L.; Wang, J.-Y. Anaerobic co-digestion of source segregated brown water (feces-without-urine) and food waste: For Singapore context. Sci. Total Environ. 2013, 443, 877–886. [Google Scholar] [CrossRef] [PubMed]
- Hill, D.T.; Bolte, J.P. Methane production from low solid concentration liquid swine waste using conventional anaerobic digestion. Bioresour. Technol. 2000, 74, 241–247. [Google Scholar] [CrossRef]
- Ma, Y.; Li, W.; Luo, L.; Zhang, H.; Li, P.; Zhang, X.; Xu, X.; Zhang, B. Effects of Aerobic Pre-Treatment on Anaerobic Batch Digestion of Corn Straw. J. Biobased Mater. Bioenergy 2017, 11, 622–628. [Google Scholar] [CrossRef]
- Wainaina, S.; Awasthi, M.K.; Sarsaiya, S.; Chen, H.; Singh, E.; Kumar, A.; Ravindran, B.; Awasthi, S.K.; Liu, T.; Duan, Y.; et al. Resource recovery and circular economy from organic solid waste using aerobic and anaerobic digestion technologies. Bioresour. Technol. 2020, 301, 122778. [Google Scholar] [CrossRef]
- Long, X.; Wang, H.; Wang, C.; Li, X. The synergistic effect of biophoto anode for the enhancement of current generation and degradation. Environ. Technol. 2019, 41, 3420–3430. [Google Scholar] [CrossRef]
- Xu, X. Effects of Pretreatment on Scum Layer and Gas Production Characteristics of Anaerobic Digestion of Corn Straw; Northeast Agricultural University: Harbin, China, 2019. [Google Scholar]
- Wang, F.-Q.; Xie, H.; Chen, W.; Wang, E.T.; Du, F.-G.; Song, A.-D. Biological pretreatment of corn stover with ligninolytic enzyme for high efficient enzymatic hydrolysis. Bioresour. Technol. 2013, 144, 572–578. [Google Scholar] [CrossRef]
Publisher’s Note: MDPI stays neutral with regard to jurisdictional claims in published maps and institutional affiliations. |
© 2022 by the authors. Licensee MDPI, Basel, Switzerland. This article is an open access article distributed under the terms and conditions of the Creative Commons Attribution (CC BY) license (https://creativecommons.org/licenses/by/4.0/).