
Two Sides of the Same Coin: A Theoretical Framework for Strong Sustainability in Marine Protected Areas

 ,
,  , ,
, , 
Abstract
: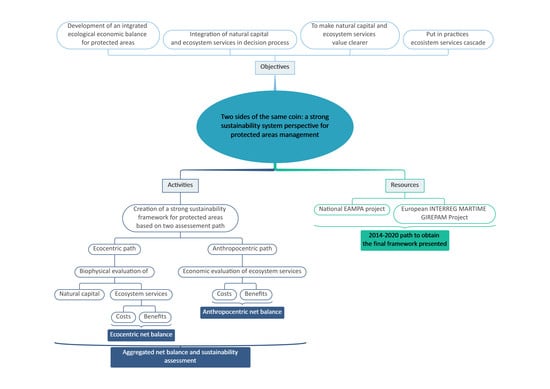
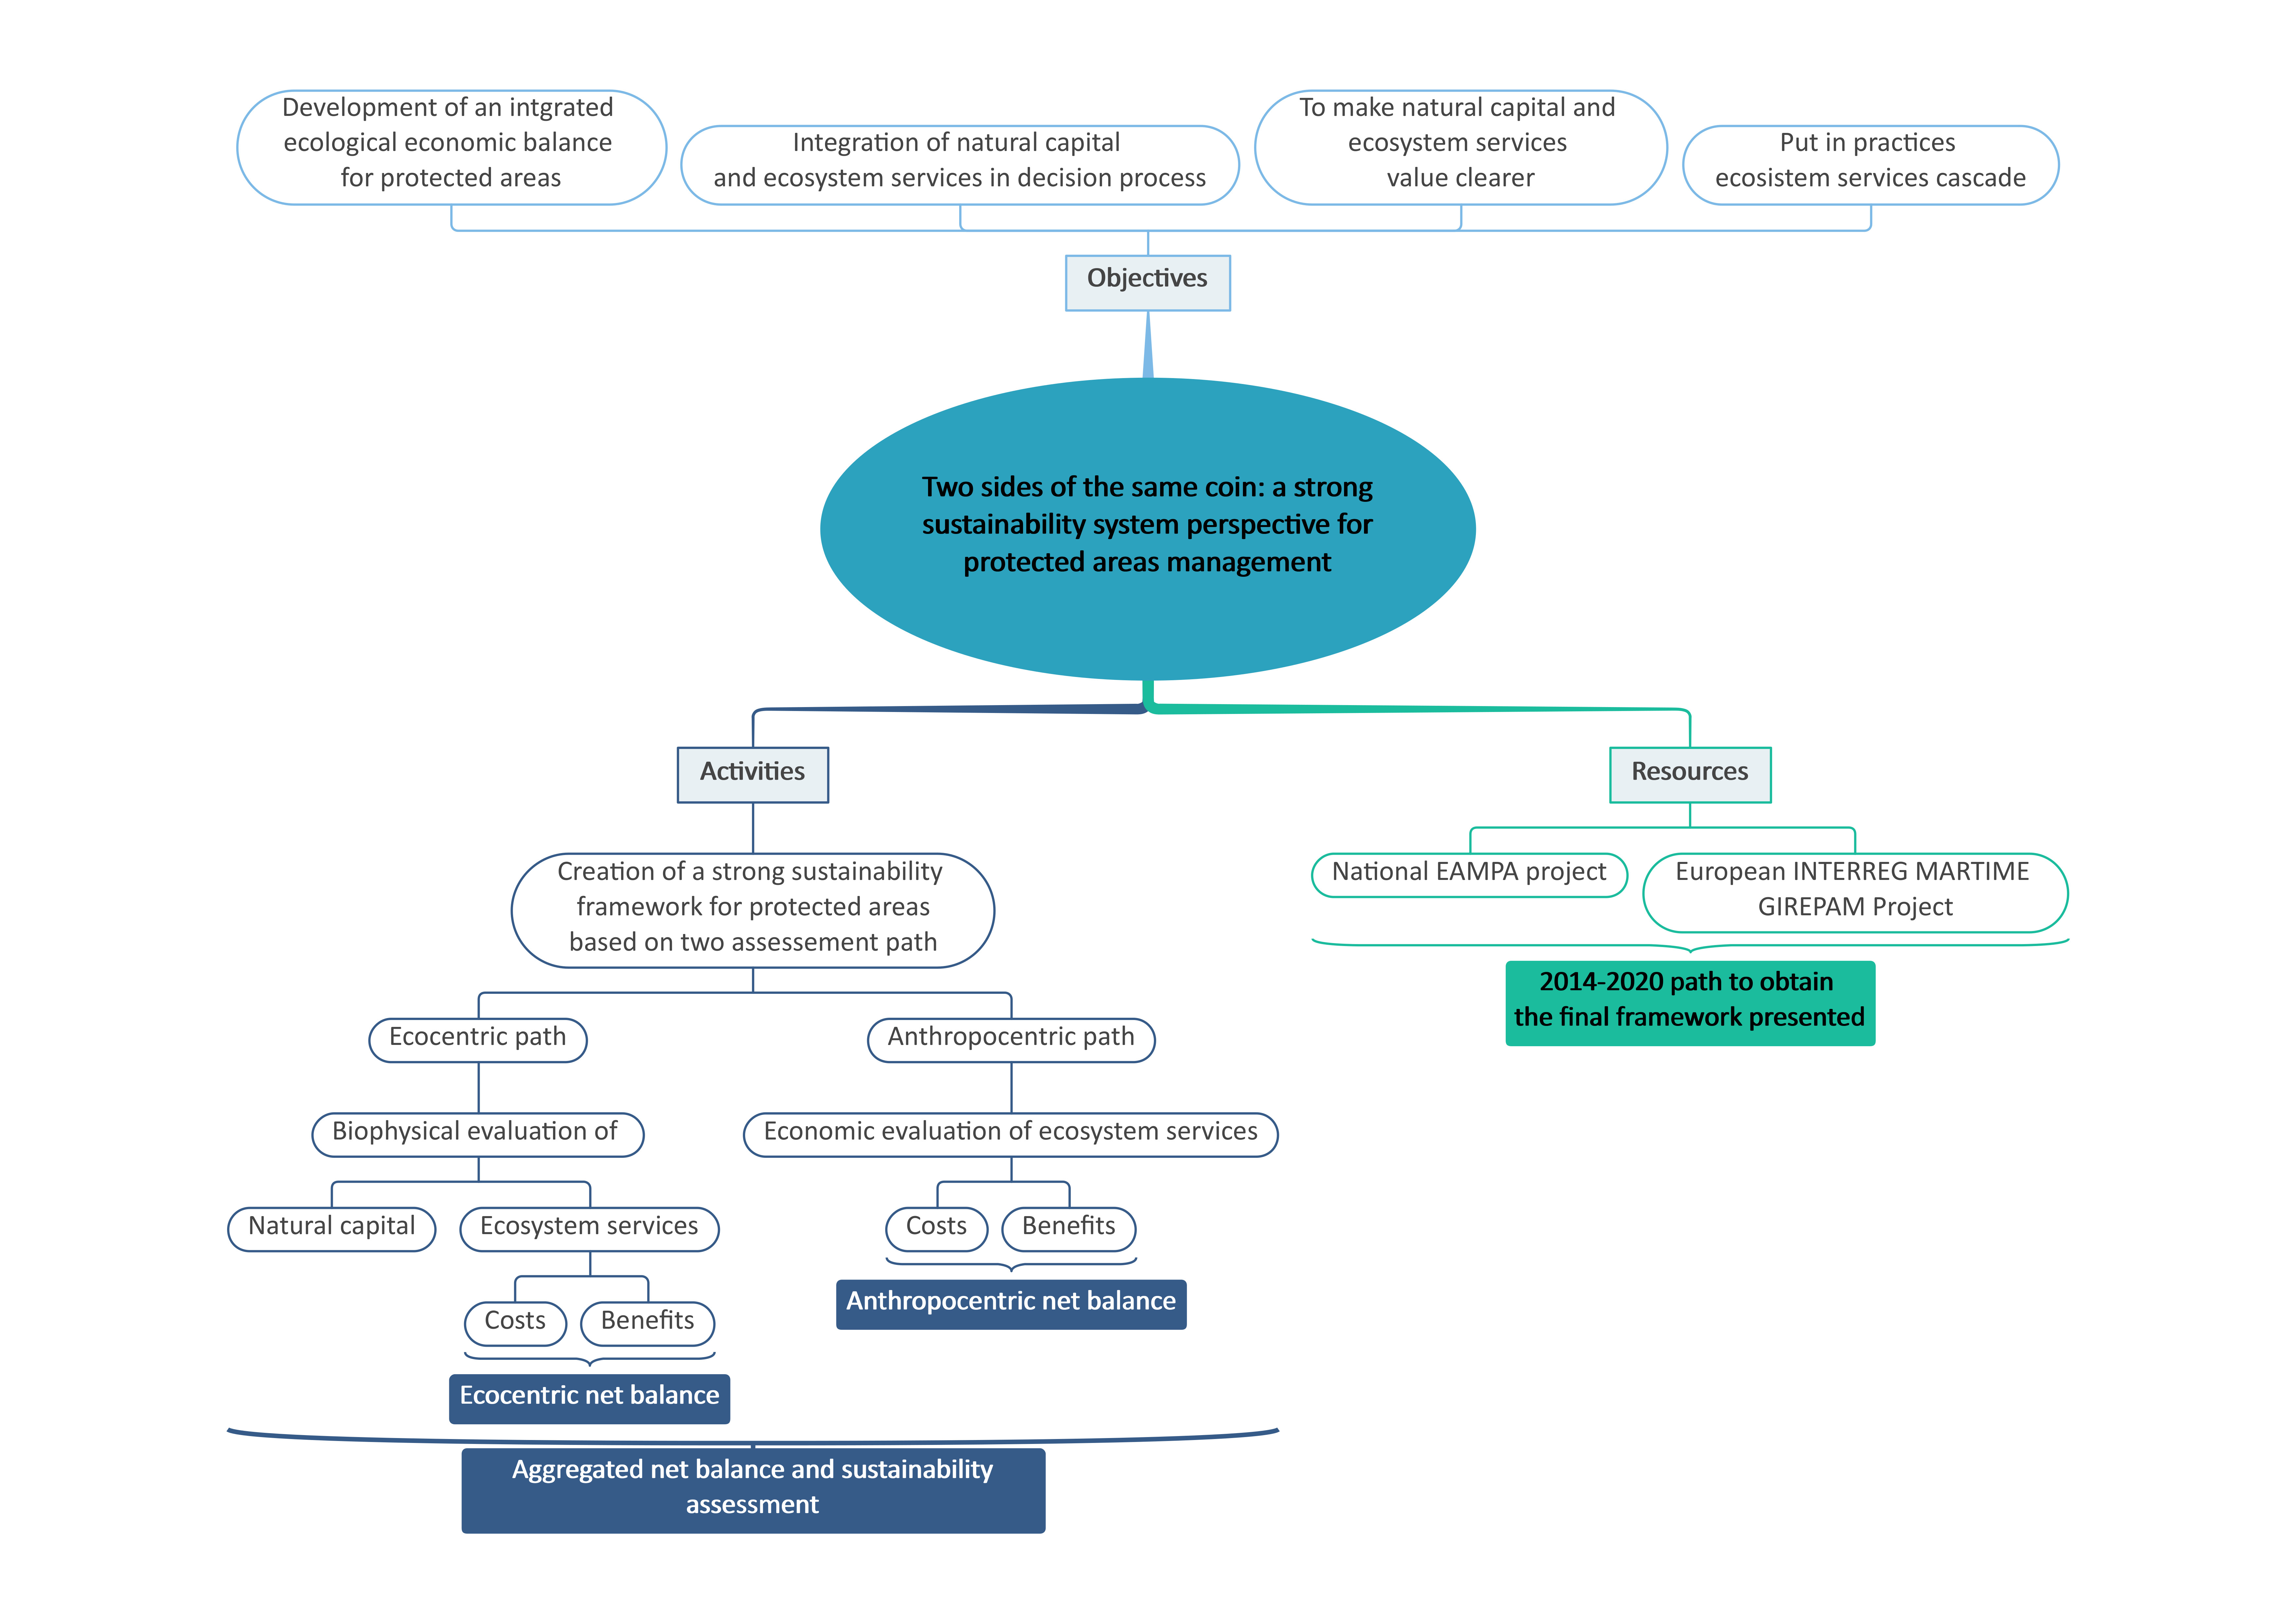
1. Introduction
- Supply services: tangible and marketable goods (materials and energies) directly consumed by humans and produced by ecosystems;
- Maintenance and regulation services: those functions that control and modify the abiotic and biotic compartments of ecosystems and from which environments suitable for human life originate;
- Cultural and social services: all non-material outputs of ecosystems with symbolic, cultural and intellectual importance.
2. The EAMPA and GIREPAM Projects
3. Natural Capital Assessment
3.1. Data Availability Inventory
- The collection and management of data through computerized platforms that allow for simpler and more rational dynamic management of the collection phase;
- The rationalization and alignment of the existing cartography relating to basic cartography (e.g., perimeter, bathymetry and type of biocoenosis), anthropic activity maps or maps regarding specific issues of the MPA;
- The identification and subsequent calculation of the surface of each biocoenosis of the MPA;
- The analysis of fish fauna data obtained through visual census projects;
- The preliminary quantification of the biomass values (through bibliographic research and/or consultation of in situ studies) of the different taxa considered as representative of the benthic communities associated with biocoenosis.
3.2. Benthic and Fish Community Natural Capital Assessment
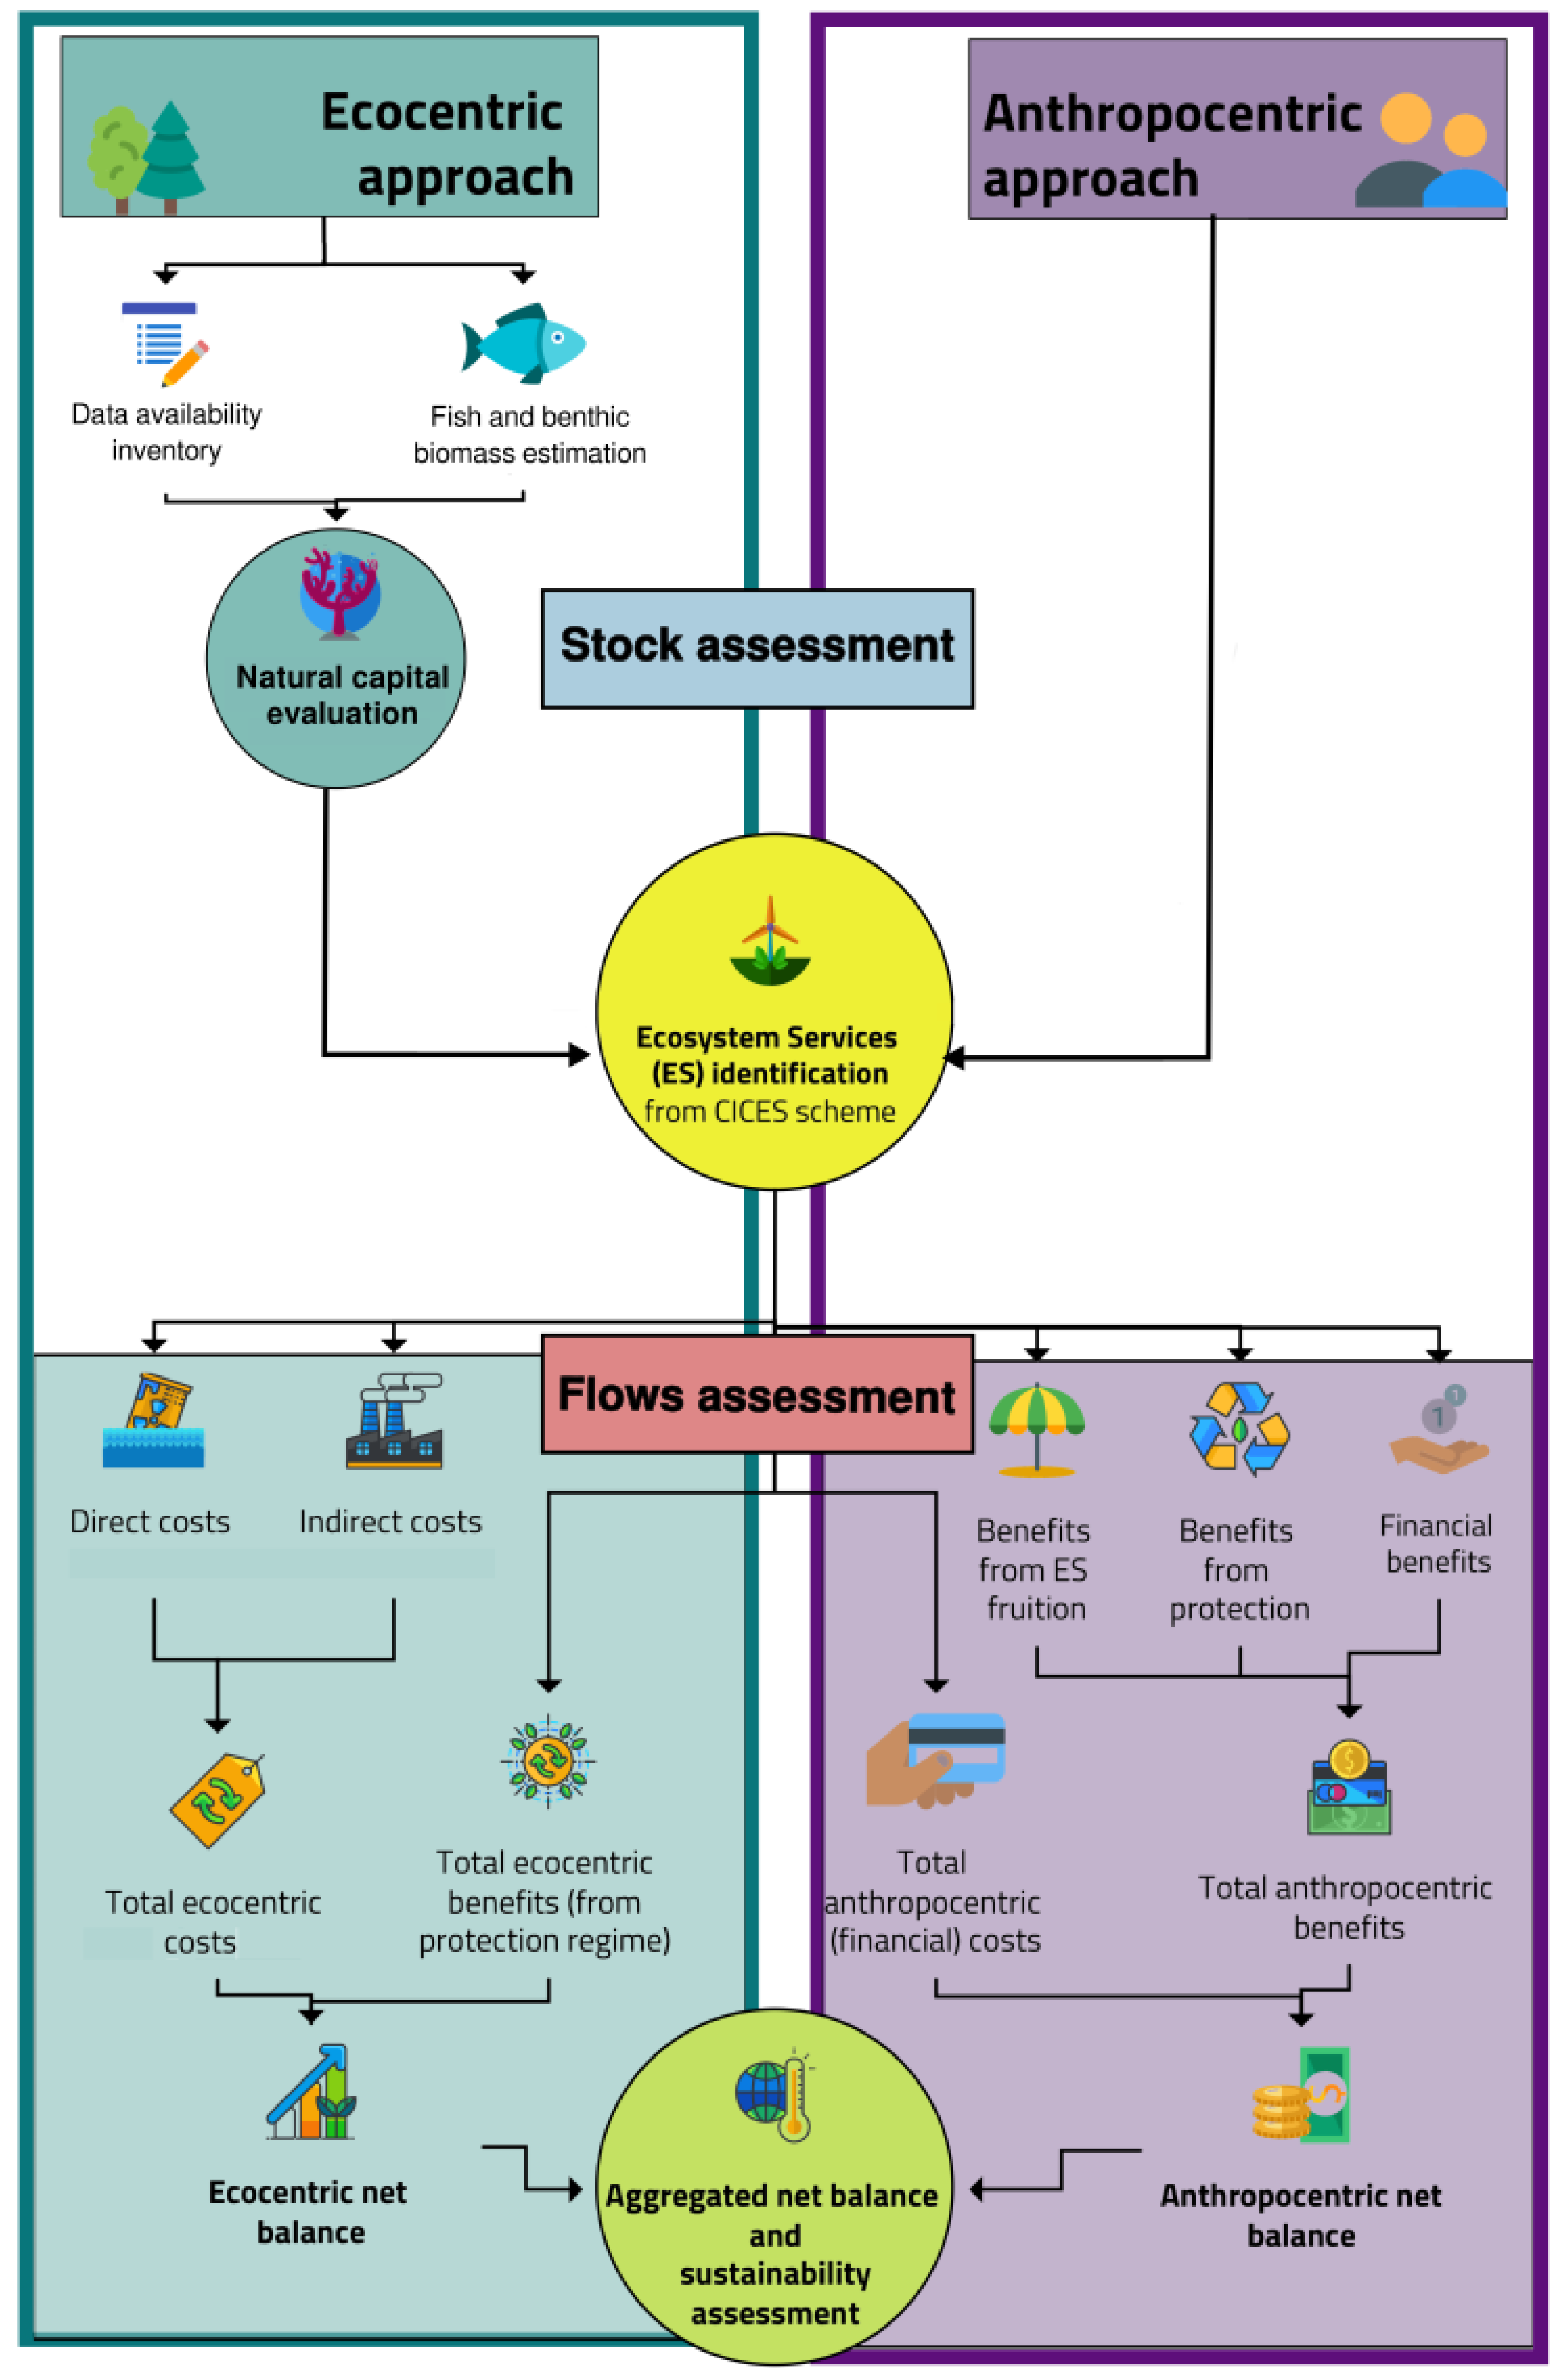
4. Ecosystem Services Identification
5. Balance Assessment
5.1. Ecocentric and Anthropocentric Costs
5.1.1. Ecocentric Costs
- (a)
- Direct ecocentric costs
- (b)
- Indirect ecocentric costs
5.1.2. Anthropocentric Costs (Financial Costs)
5.2. Ecocentric and Anthropocentric Benefits
5.2.1. Ecocentric Benefits
5.2.2. Anthropocentric Benefits
- (a)
- Ecosystem services fruition benefits
- (b)
- Protection benefits
- (c)
- Financial benefits
5.3. Costs and Benefits Comparison and Net Balance Assessment
- Aggregated net balance = B − A;
- Ecocentric net balance = B1 − A1;
- Anthropocentric net balance = B2 − A2
6. Concluding Remarks
Author Contributions
Funding
Institutional Review Board Statement
Informed Consent Statement
Conflicts of Interest
References
- Costanza, R.; Daly, H.E. Natural Capital and Sustainable Development. Conserv. Biol. 1992, 6, 37–46. [Google Scholar] [CrossRef]
- Ekins, P. Real-Life Economics: Understanding Wealth Creation: A Four-Capital Model of Wealth Creation; Routledge: London, UK; New York, NY, USA, 1992; pp. 147–155. [Google Scholar]
- Jansson, A.M.; Hammer, M.; Folke, C.; Costanza, R. Investing in Natural Capital: The Ecological Economics Approach to Sustainability; Island Press: Washington, DC, USA, 1994. [Google Scholar]
- Faber, M.; Manstetten, R.; Proops, J. On the conceptual foundations of ecological economics: A teleological approach. Ecol. Econ. 1995, 12, 41–54. [Google Scholar] [CrossRef]
- Faucheux, S.; O’Connor, M. (Eds.) Valuation for Sustainable Development: Methods and Policy Indicators; Edward Elgar: Cheltenham, UK, 1998. [Google Scholar]
- Lutz, E. (Ed.) Toward Improved Accounting for the Environment; World Bank: Washington, DC, USA, 1993. [Google Scholar]
- Natural Capital Committee. Improving Natural Capital: An Assessment of Progress; Natural Capital Committee: London, UK, 2017.
- De Groot, R.S. Functions of Nature: Evaluation of Nature in Environmental Planning, Management and Decision Making; Wolters-Noordhoff: Groningen, The Netherlands, 1992. [Google Scholar]
- Costanza, R.; D’Arge, R.; De Groot, R.; Farber, S.; Grasso, M.; Hannon, B.; Limburg, K.; Naeem, S.; O’Neill, R.V.; Paruelo, J.; et al. The Value of the World’s Ecosystem Services and Natural Capital. Nature 1997, 387, 253–260. [Google Scholar] [CrossRef]
- MEA. Ecosystems and Human Well-Being: Synthesis, Island; Millennium Ecosystem Assessment: Washington, DC, USA, 2005. [Google Scholar]
- De Groot, R.S.; Wilson, M.A.; Boumans, R.M.J. A typology for the classification, description and valuation of ecosystem functions, goods and services. Ecol. Econ. 2002, 41, 393–408. [Google Scholar] [CrossRef] [Green Version]
- TEEB. The Economics of Ecosystems and Biodiversity: Ecological and Economic Foundations; Routledge: Abingdon, UK, 2010. [Google Scholar]
- Sukhdev, P.; Wittmer, H.; Schröter-Schlaack, C.; Nesshöver, C.; Bishop, J.; Brink, P.T.; Haripriya, G.; Pushpam, K.; Simmons, B. The Economics of Ecosystems and Biodiversity: Mainstreaming the Economics of Nature: A Synthesis of the Approach, Conclusions and Recommendations of TEEB (No. 333.95 E19); UNEP: Nairobi, Kenya, 2010. [Google Scholar]
- Maes, J.; Teller, A.; Erhard, M.; Liquete, C.; Braat, L.; Berry, P.; Egoh, B.; Puydarrieux, P.; Fiorina, C.; Santos-Martin, F.; et al. Mapping and Assessment of Ecosystems and Their Services: An Analytical Framework for Ecosystem Assessments under Action 5 of the EU Biodiversity Strategy to 2020; European Commission: Brussels, Belgium, 2013; pp. 1–53. [Google Scholar] [CrossRef]
- Maes, J.; Teller, A.; Erhard, M.; Condé, S.; Vallecillo, S.; Barredo, J.I.; Paracchini, M.L.; Abdul Malak, D.; Trombetti, M.; Vigiak, O.; et al. Mapping and Assessment of Ecosystems and Their Services: An EU Ecosystem Assessment, EUR 30161 EN; Publications Office of the European Union: Ispra, Italy, 2020; ISBN 978-92-76-17833-0. [CrossRef]
- De Groot, R.; Brander, L.; Van Der Ploeg, S.; Costanza, R.; Bernard, F.; Braat, L.; Christie, M.; Crossman, N.; Ghermandi, A.; Hein, L.; et al. Global estimates of the value of ecosystems and their services in monetary units. Ecosyst. Serv. 2012, 1, 50–61. [Google Scholar] [CrossRef]
- Turner, R.K. (Ed.) Sustainable Environmental Economics and Management. Principles and Practice; Belhaven Press: London, UK, 1993. [Google Scholar]
- van den Bergh, J.C.J.M. Externality or sustainability economics? Ecol. Econ. 2010, 69, 2047–2052. [Google Scholar] [CrossRef]
- Chiesura, A.; de Groot, R. Critical natural capital: A socio-cultural perspective. Ecol. Econ. 2003, 44, 219–231. [Google Scholar] [CrossRef]
- Jasch, C. The use of Environmental Management Accounting (EMA) for identifying environmental costs. J. Clean. Prod. 2003, 11, 667–676. [Google Scholar] [CrossRef]
- Jørgensen, S.E. Ecosystem services, sustainability and thermodynamic indicators. Ecol. Complex. 2010, 7, 311–313. [Google Scholar] [CrossRef]
- Müller, F.; Burkhard, B. The indicator side of ecosystem services. Ecosyst. Serv. 2012, 1, 26–30. [Google Scholar] [CrossRef] [Green Version]
- Odum, H.T. Self organization, transformity and information. Science 1988, 242, 1132–1139. [Google Scholar] [CrossRef] [PubMed] [Green Version]
- Wackernagel, M.; Onisto, L.; Bello, P.; Linares, A.C.; Falfán, I.S.L.; García, J.M.; Guerrero, A.I.S.; Guerrero, M.G.S. National natural capital accounting with the ecological footprint concept. Ecol. Econ. 1999, 29, 375–390. [Google Scholar] [CrossRef]
- Vassallo, P.; Paoli, C.; Rovere, A.; Montefalcone, M.; Morri, C.; Bianchi, C.N. The value of the seagrass Posidonia oceanica: A natural capital assessment. Mar. Pollut. Bull. 2013, 75, 157–167. [Google Scholar] [CrossRef] [PubMed]
- Vassallo, P.; Turcato, C.; Rigo, I.; Scopesi, C.; Costa, A.; Barcella, M.; Dapueto, G.; Mariotti, M.; Paoli, C. Biophysical Accounting of Forests’ Value under Different Management Regimes: Conservation vs. Exploitation. Sustainability 2021, 13, 4638. [Google Scholar] [CrossRef]
- Burgos, E.; Montefalcone, M.; Ferrari, M.; Paoli, C.; Vassallo, P.; Morri, C.; Bianchi, C.N. Ecosystem functions and economic wealth: Trajectories of change in seagrass meadows. J. Clean. Prod. 2017, 168, 1108–1119. [Google Scholar] [CrossRef]
- Turcato, C.; Paoli, C.; Scopesi, C.; Montagnani, C.; Mariotti, M.; Vassallo, P. Matsucoccus bast scale in Pinus pinaster forests: A comparison of two systems by means of emergy analysis. J. Clean. Prod. 2015, 96, 539–548. [Google Scholar] [CrossRef]
- Pulselli, F.M.; Coscieme, L.; Bastianoni, S. Ecosystem services as a counterpart of emergy flows to ecosystems. Ecol. Model. 2011, 222, 2924–2928. [Google Scholar] [CrossRef]
- De Groot, R.S.; Alkemade, R.; Braat, L.; Hein, L.; Willemen, L. Challenges in integrating the concept of ecosystem services and values in landscape planning, management and decision making. Ecol. Complex. 2010, 7, 260–272. [Google Scholar] [CrossRef]
- Beaumont, N.; Austen, M.; Atkins, J.; Burdon, D.; Degraer, S.; Dentinho, T.; Derous, S.; Holm, P.; Horton, T.; van Ierland, E.; et al. Identification, definition and quantification of goods and services provided by marine biodiversity: Implications for the ecosystem approach. Mar. Pollut. Bull. 2007, 54, 253–265. [Google Scholar] [CrossRef]
- Moberg, F.; Folke, C. Ecological goods and services of coral reef ecosystems. Ecol. Econ. 1999, 29, 215–233. [Google Scholar] [CrossRef]
- Townsend, M.; Thrush, S.; Carbines, M. Simplifying the complex: An ‘Ecosystem Principles Approach’ to goods and services management in marine coastal ecosystems. Mar. Ecol. Prog. Ser. 2011, 434, 291–301. [Google Scholar] [CrossRef] [Green Version]
- Muntadas, A.; de Juan, S.; Demestre, M. Integrating the provision of ecosystem services and trawl fisheries for the management of the marine environment. Sci. Total Environ. 2015, 506–507, 594–603. [Google Scholar] [CrossRef] [PubMed]
- Duarte, C.M.; Middelburg, J.J.; Caraco, N. Major role of marine vegetation on the oceanic carbon cycle. Biogeosciences 2005, 2, 1–8. [Google Scholar] [CrossRef] [Green Version]
- Ohde, S.; Van Woesik, R. Carbon dioxide flux and metabolic processes of a coral reef, Okinawa. Bull. Mar. Sci. 1999, 65, 559–576. [Google Scholar]
- Orth, R.J.; Carruthers, T.J.B.; Dennison, W.C.; Duarte, C.M.; Fourqurean, J.W.; Heck, K.L.; Hughes, A.R.; Kendrick, G.A.; Kenworthy, W.J.; Olyarnik, S.; et al. A Global Crisis for Seagrass Ecosystems. Bioscience 2006, 56, 987–996. [Google Scholar] [CrossRef] [Green Version]
- UNEP. Marine and Coastal Ecosystems and Human Well-Being: A Synthesis Report Based on the Findings of the Millennium Ecosystem Assessment; UNEP: Nairobi, Kenya, 2006; 76p. [Google Scholar]
- Ferreira, A.M.; Marques, J.C.; Seixas, S. Integrating marine ecosystem conservation and ecosystems services economic valuation: Implications for coastal zones governance. Ecol. Indic. 2017, 77, 114–122. [Google Scholar] [CrossRef] [Green Version]
- Fortes, M.D. Mangrove and seagrass beds of East Asia: Habitats under stress. Ambio 1988, 17, 207–213. [Google Scholar]
- Ilman, M.; Dargusch, P.; Dart, P.; Onrizal. A historical analysis of the drivers of loss and degradation of Indonesia’s mangroves. Land Use Policy 2016, 54, 448–459. [Google Scholar] [CrossRef]
- Montefalcone, M.; Vassallo, P.; Gatti, G.; Parravicini, V.; Paoli, C.; Morri, C.; Bianchi, C.N. The exergy of a phase shift: Ecosystem functioning loss in seagrass meadows of the Mediterranean Sea. Estuarine, Coast. Shelf Sci. 2015, 156, 186–194. [Google Scholar] [CrossRef]
- Parravicini, V.; Micheli, F.; Montefalcone, M.; Morri, C.; Villa, E.; Castellano, M.; Povero, P.; Bianchi, C.N. Conserving Biodiversity in a Human-Dominated World: Degradation of Marine Sessile Communities within a Protected Area with Conflicting Human Uses. PLoS ONE 2013, 8, e75767. [Google Scholar] [CrossRef] [Green Version]
- Pauly, D.; Christensen, V.; Dalsgaard, J.; Froese, R.; Torres, F., Jr. Fishing Down Marine Food Webs. Science 1998, 279, 860–863. [Google Scholar] [CrossRef] [PubMed]
- Short, F.T.; Wyllie-Echeverria, S. Natural and human-induced disturbance of seagrasses. Environ. Conserv. 1996, 23, 17–27. [Google Scholar] [CrossRef]
- Waycott, M.; Duarte, C.M.; Carruthers, T.J.B.; Orth, R.J.; Dennison, W.C.; Olyarnik, S.; Calladine, A.; Fourqurean, J.W.; Heck, K.L., Jr.; Hughes, A.R.; et al. Accelerating loss of seagrasses across the globe threatens coastal ecosystems. Proc. Natl. Acad. Sci. USA 2009, 106, 12377–12381. [Google Scholar] [CrossRef] [PubMed] [Green Version]
- Campbell, M.L.; Hewitt, C.L. A hierarchical framework to aid biodiversity assessment for coastal zone management and marine protected area selection. Ocean. Coast. Manag. 2006, 49, 133–146. [Google Scholar] [CrossRef]
- NRC. Marine Protected Areas, Tools for Sustaining Ocean Ecosystems; The National Academies Press: Washington, DC, USA, 2001; 272p. [Google Scholar]
- Pita, C.; Pierce, G.; Theodossiou, I.; Macpherson, K. An overview of commercial fisher’s attitudes towards marine protected areas. Hydrobiologia. 2011, 670, 289–306. [Google Scholar] [CrossRef]
- Angulo-Valdés, J.A.; Hatcher, B.G. A new typology of benefits derived from marine protected areas. Mar. Policy 2010, 34, 635–644. [Google Scholar] [CrossRef]
- Badalamenti, F.; Sanchez Lizaso, J.; Mas, J.; Voultsiadou, E.; D’Anna, G.; Pipitone, C.; Ramos Espla, A.; Ruiz, J.; Riggio, S. Cultural and socioeconomic effects of marine reserves in the Mediterranean. Environ. Conserv. 2000, 27, 110–125. [Google Scholar] [CrossRef] [Green Version]
- Boncoeur, J.; Alban, F.; Guyader, O.; Thebaud, O. Fish, fishers, seals and tourists, economic consequences of creating a marine reserve in a multi-species multi-activity context. Nat. Res. Model. 2002, 15, 387–411. [Google Scholar] [CrossRef] [Green Version]
- Hoskin, M.G.; Coleman, R.A.; Von Carlshausen, E.; Davis, C.M. Variable population responses by large decapod crustaceans to the establishment of a temperate marine no-take zone. Can. J. Fish. Aquat. Sci. 2011, 68, 185–200. [Google Scholar] [CrossRef]
- Sanchirico, J.N.; Cochran, K.A.; Emerson, P.M. Marine protected areas, economic and social implications. In Resources for the Future; Discussion Paper 02–26; Resources for the Future: Washington, DC, USA, 2002. [Google Scholar]
- Lindenmayer, D.B.; Likens, G.E. The science and application of ecological monitoring. Biol. Conserv. 2010, 143, 1317–1328. [Google Scholar] [CrossRef]
- Franzese, P.P.; Buonocore, E.; Paoli, C.; Massa, F.; Stefano, D.; Fanciulli, G.; Miccio, A.; Mollica, E.; Navone, A.; Russo, G.F.; et al. Environmental accounting in marine protected areas: The EAMPA project. J. Environ. Account. Manag. 2015, 3, 324–332. [Google Scholar] [CrossRef]
- Vassallo, P.; Paoli, C.; Buonocore, E.; Franzese, P.P.; Russo, G.F.; Povero, P. Assessing the value of natural capital in marine protected areas: A biophysical and trophodynamic environmental accounting model. Ecol. Model. 2017, 355, 12–17. [Google Scholar] [CrossRef]
- Paoli, C.; Vassallo, P.; Pozzi, M.; Massa, F.; Rigo, I.; Fanciulli, G.; Cappanera, V.; Merotto, L.; Venturini, S.; Lavarello, I. Towards strong sustainability: A framework for economic and ecological management of marine protected areas. Vie Milieu/Life Environ. 2020, 70, 209–223. [Google Scholar]
- Buonocore, E.; Picone, F.; Donnarumma, L.; Russo, G.F.; Franzese, P.P. Modeling matter and energy flows in marine ecosystems using emergy and eco-exergy methods to account for natural capital value. Ecol. Model. 2019, 392, 137–146. [Google Scholar] [CrossRef]
- Buonocore, E.; Appolloni, L.; Russo, G.F.; Franzese, P.P. Assessing natural capital value in marine ecosystems through an environmental accounting model: A case study in Southern Italy. Ecol. Model. 2020, 419, 108958. [Google Scholar] [CrossRef]
- Buonocore, E.; Donnarumma, L.; Appolloni, L.; Miccio, A.; Russo, G.F.; Franzese, P.P. Marine natural capital and ecosystem services: An environmental accounting model. Ecol. Model. 2020, 424, 109029. [Google Scholar] [CrossRef]
- Buonocore, E.; Russo, G.F.; Franzese, P.P. Assessing natural capital value in the network of Italian marine protected areas: A comparative approach. Ecol. Quest. 2020, 31, 1–17. [Google Scholar] [CrossRef]
- Paoli, C.; Povero, P.; Burgos, E.; Dapueto, G.; Fanciulli, G.; Massa, F.; Scarpellini, P.; Vassallo, P. Natural capital and environmental flows assessment in marine protected areas: The case study of Liguria region (NW Mediterranean Sea). Ecol. Model. 2018, 368, 121–135. [Google Scholar] [CrossRef]
- Franzese, P.P.; Buonocore, E.; Donnarumma, L.; Russo, G.F. Natural capital accounting in marine protected areas: The case of the Islands of Ventotene and S. Stefano (Central Italy). Ecol. Model. 2017, 360, 290–299. [Google Scholar] [CrossRef]
- Picone, F.; Buonocore, E.; D’Agostaro, R.; Donati, S.; Chemello, R.; Franzese, P.P. Integrating natural capital assessment and marine spatial planning: A case study in the Mediterranean sea. Ecol. Model. 2017, 361, 1–13. [Google Scholar] [CrossRef]
- De La Fuente, G.; Asnaghi, V.; Chiantore, M.; Thrush, S.; Povero, P.; Vassallo, P.; Petrillo, M.; Paoli, C. The effect of Cystoseira canopy on the value of midlittoral habitats in NW Mediterranean, an emergy assessment. Ecol. Model. 2019, 404, 1–11. [Google Scholar] [CrossRef]
- Vassallo, P.; Paoli, C.; Addis, P.; Atzori, F.; Burgos-Juan, E.; Campodonico, P.; Cappanera, V.; Dapueto, G.; Deiana, A.; Fanciulli, G.; et al. Natural capital assessment of six Italian Marine Protected Areas. In Proceedings of the Congresso della Società Italiana di Biologia Marina, Roma, Italy, 7–9 June 2017. [Google Scholar]
- Odum, H.T. Environmental Accounting. Emergy and Environmental Decision Making; John Wiley and Sons: New York, NY, USA, 1996. [Google Scholar]
- Lou, B.; Ulgiati, S. Identifying the environmental support and constraints to the Chinese economic growth—An application of the Emergy Accounting method. Energy Policy 2013, 55, 217–233. [Google Scholar] [CrossRef]
- Brown, M.T.; Ulgiati, S. Energy quality, emergy, and transformity: HT Odum’s contributions to quantifying and understanding systems. Ecol. Model. 2004, 178, 201–213. [Google Scholar] [CrossRef]
- Haines-Young, R.; Potschin, M. Common International Classification of Ecosystem Services (CICES): Consultation on Version 4, August–December 2012; European Environment Agency: Copenhagen, Denmark, 2013. Available online: http://cices.eu (accessed on 16 May 2022).
- Comitato Capitale Naturale. Secondo Rapporto sullo Stato del Capitale Naturale in Italia; Comitato Capitale Naturale: Rome, Italy, 2018.
- Marangon, F.; Spoto, M.; Visintin, F. Assigning economic value to natural protected areas: An environmental accounting model. Management for protection and sustainable development. In Proceedings of the Fourth International Conference on Monitoring and Management of Visitor Flows in Recreational and Protected Areas, Montecatini Terme, Italy, 14–19 October 2008. [Google Scholar]
- Visintin, F.; Marangon, F.; Spoto, M. Assessing the value for money of protected areas. Riv. Studi Sulla Sostenibilita 2016, 1, 49–69. [Google Scholar] [CrossRef]
- Visintin, F. Modello di contabilità ambientale per il Sistema delle aree naturali tutelate del Friuli Venezia Giulia, Progetto; Rapporto Interno; S.A.R.A. Sistema Aree Regionali Ambientali—Costituzione Sistema Regionale Delle Aree Naturali, CETA: Gorizia, Italy, 2008. [Google Scholar]
- Visintin, F.; Marangon, F. Tourist Function and Environmental Accounting Model in Protected Areas. In Proceedings of the Tourist Function and Environmental Accounting Model in Protected Areas, Monza, Italy, 7–9 November 2009; pp. 175–182. [Google Scholar]
- Visintin, F.; Marangon, F. RNM di Miramare e Sistema Aree Regionali Ambientali FVG: Un modello di contabilità ambientale dei servizi ecosistemici. In Proceedings of the Riunione del Gruppo di Lavoro Sulla Contabilità Ambientale, Roma, Italy, 15 April 2014. [Google Scholar]
- Visintin, F.; Tomasinsig, E.; Marangon, F.; Troiano, S.; Spoto, M.; de Franco, F.; Ciccolella, A.; Guidetti, P.; Samec, D. Environmental Accounting for assessing the Value for Money of Torre Guaceto Marine Protected Area. In Proceedings of the ESP Europe 2018 Regional Conference—Ecosystem Services in a Changing World: Moving from Theory to Practice, San Sebastian, Spain, 15–19 October 2018. [Google Scholar] [CrossRef]
- Dapueto, G.; Paoli, C.; Vassallo, P.; Pozzi, M.; Massa, F.; Rigo, I.; Fanciulli, G.; Venturini, S.; Merotto, L.; Cappanera, V.; et al. A spatial decision support system for the sustainable management of fishing in marine protected areas. Vie Milieu/Life Environ. 2020, 70, 183–195. [Google Scholar]
- Cattaneo Vietti, R.; Valentina, C.; Castellano, M.; Povero, P. Yield and catch changes in a Mediterranean small tuna trap: A warming change effect? Mar. Ecol. 2015, 36, 155–166. [Google Scholar] [CrossRef] [Green Version]
- Dapueto, G.; Massa, F.; Pergent-Martini, C.; Povero, P.; Rigo, I.; Vassallo, P.; Venturini, S.; Paoli, C. Sustainable management accounting model of recreational boating anchoring in Marine Protected Areas. J. Clean. Prod. 2022, 342, 130905. [Google Scholar] [CrossRef]
- Pauly, D.; Christensen, V. Primary production required to sustain global fisheries. Nature 1995, 374, 255–257. [Google Scholar] [CrossRef]
- Francour, P.; Ganteaume, A.; Poulain, M. Effects of boat anchoring in Posidonia oceanica seagrass beds in the Port—Cros National Park (nort–western Mediterranean Sea). Aquat. Conserv. Mar. Freshw. Ecosyst. 1999, 9, 391–400. [Google Scholar] [CrossRef]
- Lloret, J.; Zaragoza, N.; Caballero, D.; Font, T.; Casadevall, M.; Riera, V. Spearfishing pressure on fish communities in rocky coastal habitats in a Mediterranean marine protected area. Fish. Res. 2008, 94, 84–91. [Google Scholar] [CrossRef]
- Milazzo, M.; Chemello, R.; Badalamenti, F.; Camarda, R.; Riggio, S. The Impact of Human Recreational Activities in Marine Protected Areas: What Lessons Should Be Learnt in the Mediterranean Sea? Mar. Ecol. 2002, 23, 280–290. [Google Scholar] [CrossRef]
- Milazzo, M.; Badalamenti, F.; Ceccherelli, G.; Chemello, R. Boat anchoring on Posidonia oceanica beds in a marine protected area (Italy, western Mediterranean): Effect of anchor types in different anchoring stages. J. Exp. Mar. Biol. Ecol. 2004, 299, 51–62. [Google Scholar] [CrossRef]
- Rigo, I.; Dapueto, G.; Paoli, C.; Massa, F.; Oprandi, A.; Venturini, S.; Merotto, L.; Fanciulli, G.; Cappanera, V.; Montefalcone, M.; et al. Changes in the ecological status and natural capital of Posidonia oceanica meadows due to human pressure and extreme events. Vie Milieu/Life Environ. 2020, 70, 137–148. [Google Scholar]
- Rigo, I.; Paoli, C.; Dapueto, G.; Pergent-Martini, C.; Pergent, G.; Oprandi, A.; Montefalcone, M.; Bianchi, C.N.; Morri, C.; Vassallo, P. The Natural Capital Value of the Seagrass Posidonia oceanica in the North-Western Mediterranean. Diversity 2021, 13, 499. [Google Scholar] [CrossRef]
- Lamb, J.; True, J.D.; Piromvaragorn, S.; Willis, B.L. Scuba diving damage and intensity of tourist activities increases coral disease prevalence. Biol. Conserv. 2014, 178, 88–96. [Google Scholar] [CrossRef]
- Betti, F.; Bavestrello, G.; Fravega, L.; Bo, M.; Coppari, M.; Enrichetti, F.; Cappanera, V.; Venturini, S.; Cattaneo-Vietti, R. On the effects of recreational SCUBA diving on fragile benthic species: The Portofino MPA (NW Mediterranean Sea) case study. Ocean Coast. Manag. 2019, 182, 104926. [Google Scholar] [CrossRef]
- Di Franco, A.; Bussotti, S.; Navone, A.; Panzalis, P.; Guidetti, P. Evaluating effects of total and partial restrictions to fishing on Mediterranean rocky-reef fish assemblages. Mar. Ecol. Prog. Ser. 2009, 387, 275–285. [Google Scholar] [CrossRef] [Green Version]
- Hammerton, Z. Low-impact diver training in management of SCUBA diver impacts. J. Ecotourism 2017, 16, 69–94. [Google Scholar] [CrossRef]
- Luna, B.; Pérez, C.V.; Lizaso, J.L.S. Benthic impacts of recreational divers in a Mediterranean Marine Protected Area. ICES J. Mar. Sci. 2009, 66, 517–523. [Google Scholar] [CrossRef]
- IPCC. Climate Change 2007: Synthesis Report; IPCC: Geneva, Switzerland, 2007; p. 104. [Google Scholar]
- Paoli, C.; Vassallo, P.; Dapueto, G.; Fanciulli, G.; Massa, F.; Venturini, S.; Povero, P. The economic revenues and the emergy costs of cruise tourism. J. Clean. Prod. 2017, 166, 1462–1478. [Google Scholar] [CrossRef]
- Vassallo, P.; Paoli, C.; Tilley, D.R.; Fabiano, M. Energy and resource basis of an Italian coastal resort region integrated using emergy synthesis. J. Environ. Manag. 2009, 91, 277–289. [Google Scholar] [CrossRef] [PubMed]
- Paoli, C.; Povero, P.; Burgos-Juan, E.; Campodonico, P.; Dapueto, G.; Fanciulli, G.; Gazale, V.; Lavarello, I.; Massa, F.; Pozzi, M.; et al. Recreational users in Portofino, Cinque Terre and Asinara MPAs: Preferences and WTP in the context of environmental accounting. In Proceedings of the Congresso della Società Italiana di Biologia Marina, Roma, Italy, 7–9 June 2017. [Google Scholar]
- EPA. The Social Cost of Carbon: Estimating the Benefits of Reducing Greenhouse Gas Emissions; United States Environmental Protection Agency: Washington, DC, USA, 2017.
- Alla, A.A.; Gillet, P.; Deutsch, B.; Moukrim, A.; Bergayou, H. Response of Nereis diversicolor (Polychaeta, Nereidae) populations to reduced wastewater discharge in the polluted estuary of Oued Souss, Bay of Agadir, Morocco. Estuarine, Coast. Shelf Sci. 2006, 70, 633–642. [Google Scholar] [CrossRef]
- Ambrogi, R. Secondary production ofPrionospio caspersi (Annelida: Polychaeta: Spionidae). Mar. Biol. 1990, 104, 437–442. [Google Scholar] [CrossRef]
- Bănaru, D.; Mellon-Duval, C.; Roos, D.; Bigot, J.-L.; Souplet, A.; Jadaud, A.; Beaubrun, P.; Fromentin, J.-M. Trophic structure in the Gulf of Lions marine ecosystem (north-western Mediterranean Sea) and fishing impacts. J. Mar. Syst. 2013, 111–112, 45–68. [Google Scholar] [CrossRef] [Green Version]
- Barausse, A.; Duci, A.; Mazzoldi, C.; Artioli, Y.; Palmeri, L. Trophic network model of the Northern Adriatic Sea: Analysis of an exploited and eutrophic ecosystem. Estuarine, Coast. Shelf Sci. 2009, 83, 577–590. [Google Scholar] [CrossRef]
- Bayle-Sempere, J.T.; Arreguín-Sánchez, F.; Sanchez-Jerez, P.; Salcido-Guevara, L.A.; Fernandez-Jover, D.; Zetina-Rejón, M.J. Trophic structure and energy fluxes around a Mediterranean fish farm. Ecol. Model. 2013, 248, 135–147. [Google Scholar] [CrossRef] [Green Version]
- Christensen, V.; Pauly, D. Trophic models of aquatic ecosystems. ICLARM Conf. Proc. 1993, 26, 390. [Google Scholar]
- Coll, M.; Palomera, I.; Tudela, S.; Sardà, F. Trophic flows, ecosystem structure and fishing impacts in the South Catalan Sea, Northwestern Mediterranean. J. Mar. Syst. 2006, 59, 63–96. [Google Scholar] [CrossRef]
- Coll, M.; Shannon, L.J.; Moloney, C.L.; Palomera, I.; Tudela, S. Comparing trophic flows and fishing impacts of a NW Mediterranean ecosystem with coastal upwellings by means of standardized ecological models and indicators. Ecol. Model. 2006, 198, 53–70. [Google Scholar] [CrossRef]
- Coll, M.; Santojanni, A.; Palomera, I.; Tudela, S.; Arneri, E. An ecological model of the Northern and Central Adriatic Sea: Analysis of ecosystem structure and fishing impacts. J. Mar. Syst. 2007, 67, 119–154. [Google Scholar] [CrossRef]
- Coll, M.; Palomera, I.; Tudela, S.; Dowd, M. Food-web dynamics in the South Catalan Sea ecosystem (NW Mediterranean) for 1978–2003. Ecol. Model. 2008, 217, 95–116. [Google Scholar] [CrossRef]
- Coll, M.; Palomera, I.; Tudela, S. Decadal changes in a NW Mediterranean Sea food web in relation to fishing exploitation. Ecol. Model. 2009, 220, 2088–2102. [Google Scholar] [CrossRef]
- Corrales, X.; Coll, M.; Tecchio, S.; Bellido, J.M.; Fernández, M.; Palomera, I. Ecosystem structure and fishing impacts in the northwestern Mediterranean Sea using a food web model within a comparative approach. J. Mar. Syst. 2015, 148, 183–199. [Google Scholar] [CrossRef]
- Daas, T.; Younsi, M.; Daas-Maamcha, O.; Gillet, P.; Scaps, P. Reproduction, population dynamics and production of Nereis falsa (Nereididae: Polychaeta) on the rocky coast of El Kala National Park, Algeria. Helgol. Mar. Res. 2011, 65, 165–173. [Google Scholar] [CrossRef] [Green Version]
- De Souzal, J.R.B.; Borzone, C.A. Population dynamics and secondary production of Euzonus furciferus Ehlers (Polychaeta, Opheliidae) in an exposed sandy beach of Southern Brazil. Rev. Bras. Zool. 2007, 24, 131–143. [Google Scholar]
- López, B.D.; Bunke, M.; Shirai, J.A.B. Marine aquaculture off Sardinia Island (Italy): Ecosystem effects evaluated through a trophic mass-balance model. Ecol. Model. 2008, 212, 292–303. [Google Scholar] [CrossRef]
- Gillet, P. Impact de l’implantation d’un barrage sur la dynamique des populations de Nereis diversicolor (annélide polychète) de l’estuaire du Bou Regreg Maroc. J. Rech. Océanographique 1993, 18, 15–18. [Google Scholar]
- Heymans, J.J.; Sumaila, U.R.; Christensen, V. Policy options for the northern Benguela ecosystem using a multispecies, multifleet ecosystem model. Prog. Oceanogr. 2009, 83, 417–425. [Google Scholar] [CrossRef]
- Hotchkiss, E.; Hall, O.R., Jr. Linking Exotic Snails to Carbon Cycling in Kelly Warm Springs, Grand Teton National Park. UW Natl. Park. Serv. Res. Stn. Annu. Rep. 2006, 30, 3–16. [Google Scholar] [CrossRef]
- Lassalle, G.; Lobry, J.; Le Loc’h, F.; Bustamante, P.; Certain, G.; Delmas, D.; Dupuy, C.; Hily, C.; Labry, C.; Le Pape, O.; et al. Lower trophic levels and detrital biomass control the Bay of Biscay continental shelf food web: Implications for ecosystem management. Prog. Oceanogr. 2011, 91, 561–575. [Google Scholar] [CrossRef] [Green Version]
- Le Quesne, W.J.; Arreguín-Sánchez, F.; Heymans, S.J. INCOFISH ecosystem models: Transiting from Ecopath to Ecospace. Fish. Cent. Res. Rep. 2007, 15, 1–188. [Google Scholar] [CrossRef]
- Liu, P.-J.; Shao, K.-T.; Jan, R.-Q.; Fan, T.-Y.; Wong, S.-L.; Hwang, J.-S.; Chen, J.-P.; Chen, C.-C.; Lin, H.-J. A trophic model of fringing coral reefs in Nanwan Bay, southern Taiwan suggests overfishing. Mar. Environ. Res. 2009, 68, 106–117. [Google Scholar] [CrossRef] [PubMed] [Green Version]
- Ménard, F.; Gentil, F.; Dauvin, J.-C. Population dynamics and secondary production of Owenia fusiformis Delle Chiaje (Polychaeta) from the Bay of Seine (eastern English Channel). J. Exp. Mar. Biol. Ecol. 1989, 133, 151–167. [Google Scholar] [CrossRef]
- Okey, T.A.; Banks, S.; Born, A.F.; Bustamante, R.H.; Calvopiña, M.; Edgar, G.J.; Espinoza, E.; Fariña, J.M.; Garske, L.E.; Reck, G.K.; et al. A trophic model of a Galápagos subtidal rocky reef for evaluating fisheries and conservation strategies. Ecol. Model. 2004, 172, 383–401. [Google Scholar] [CrossRef]
- Okey, T.A.; Vargo, G.A.; Mackinson, S.; Vasconcellos, M.; Mahmoudi, B.; Meyer, C.A. Simulating community effects of sea floor shading by plankton blooms over the West Florida Shelf. Ecol. Model. 2004, 172, 339–359. [Google Scholar] [CrossRef]
- Opitz, S. Trophic Interactions in Caribbean Coral Reefs; Tech. Rep. 43; ICLARM International Center for Living Aquatic Resources Management: Makati City, Philippine, 1996; 341p. [Google Scholar]
- Kroon, D.; Alexander, I.; Darling, K. Planktonic and benthic foraminiferal abundances and their ratios (P/B) as expressions of middle-late Quaternary changes in water mass distribution and flow intensity on the northeastern Australian margin. Proc. Ocean. Drill. Program Sci. Results 1993, 133, 181–189. [Google Scholar]
- Palomares, M.L.D.; Provost, P.; Pitcher, T.J.; Pauly, D. Modeling Antarctic marine ecosystems. Fish. Cent. Res. Rep. 2005, 13, 1–98. [Google Scholar] [CrossRef]
- Pedersen, T.; Nilsen, M.; Nilssen, E.M.; Berg, E.; Reigstad, M. Trophic model of a lightly exploited cod-dominated ecosystem. Ecol. Model. 2008, 214, 95–111. [Google Scholar] [CrossRef]
- Pinnegar, J.; Polunin, N.V. Predicting indirect effects of fishing in Mediterranean rocky littoral communities using a dynamic simulation model. Ecol. Model. 2004, 172, 249–267. [Google Scholar] [CrossRef]
- Pinkerton, M.; Lundquist, C.; Duffy, C.; Freeman, D. Trophic modelling of a New Zealand rocky reef ecosystem using simultaneous adjustment of diet, biomass and energetic parameters. J. Exp. Mar. Biol. Ecol. 2008, 367, 189–203. [Google Scholar] [CrossRef]
- Piroddi, C.; Bearzi, G.; Christensen, V. Effects of local fisheries and ocean productivity on the northeastern Ionian Sea ecosystem. Ecol. Model. 2010, 221, 1526–1544. [Google Scholar] [CrossRef]
- Prado, P.; Ibáñez, C.; Caiola, N.; Reyes, E. Evaluation of seasonal variability in the food-web properties of coastal lagoons subjected to contrasting salinity gradients using network analyses. Ecol. Model. 2013, 265, 180–193. [Google Scholar] [CrossRef]
- Rouhi, A.; Gillet, P.; Deutsch, B. Reproduction and population dynamics of Perinereis cultrifera (Polychaeta: Nereididae) of the Atlantic coast, El Jadida, Morocco. Cah. Biol. Mar. 2008, 49, 151–160. [Google Scholar]
- Selleslagh, J.; Lobry, J.; Amara, R.; Brylinski, J.-M.; Boët, P. Trophic functioning of coastal ecosystems along an anthropogenic pressure gradient: A French case study with emphasis on a small and low impacted estuary. Estuarine, Coast. Shelf Sci. 2012, 112, 73–85. [Google Scholar] [CrossRef]
- Tecchio, S.; Coll, M.; Christensen, V.; Company, J.B.; Ramírez-Llodra, E.; Sardà, F. Food web structure and vulnerability of a deep-sea ecosystem in the NW Mediterranean Sea. Deep Sea Res. Part I: Oceanogr. Res. Pap. 2013, 75, 1–15. [Google Scholar] [CrossRef]
- Torres, M.A.; Coll, M.; Heymans, J.J.; Christensen, V.; Sobrino, I. Food-web structure of and fishing impacts on the Gulf of Cadiz ecosystem (South-western Spain). Ecol. Model. 2013, 265, 26–44. [Google Scholar] [CrossRef]
- Vetter, E. Secondary production of a Southern California Nebalia (Crustacea:Leptostraca). Mar. Ecol. Prog. Ser. 1996, 137, 95–101. [Google Scholar] [CrossRef]
- Wolff, W.J.; Wolff, L. Biomass and production of zoobenthos in the Grevelingen Estuary, The Netherlands. Estuar. Coast. Mar. Sci. 1977, 5, 1–24. [Google Scholar] [CrossRef]
- Charnov, E.L. Life History Invariants: Some Explorations of Symmetry in Evolutionary Ecology; Oxford University Press: New York, NY, USA, 1993. [Google Scholar]
- Jensen, A.L. Beverton and Holt life history invariants result from optimal trade-off of reproduction and survival. Can. J. Fish. Aquat. Sci. 1996, 53, 820–822. [Google Scholar] [CrossRef]
- Then, A.Y.; Hoenig, J.M. Database on Natural Mortality Rates and Associated Life History Parameters, Version 1.0. 2015. Available online: http://bit.ly/vims_mort (accessed on 16 May 2022).
- Then, A.Y.; Hoenig, J.M.; Hall, N.G.; Hewitt, D. Evaluating the predictive performance of empirical estimators of natural mortality rate using information on over 200 fish species. ICES J. Mar. Sci. 2015, 72, 82–92. [Google Scholar] [CrossRef]
- Whitehead, J.C.; Pattanayak, S.K.; Van Houtven, G.L.; Gelso, B.R. Combining revealed and stated preference data to estimate the nonmarket value of ecological services: An assessment of the state of the science. J. Econ. Surv. 2008, 22, 872–908. [Google Scholar] [CrossRef] [Green Version]
- Freeman, D. Revealed Preference Foundations of Expectations-Based Reference-Dependence; Department of Economics, Simon Fraser University: Burnaby, BC, Canada, 2013; Available online: http://www.sfu.ca/~dfa19/EBRD.pdf (accessed on 16 May 2022).
- Hoevenagel, R. A comparison of economic valuation methods. In Valuing the Environment: Methodological and Measurement Issues; Springer: Dordrecht, Germany, 1994; pp. 251–270. [Google Scholar]
- Hoevenagel, R. An assessment of the contingent valuation method. In Valuing the Environment: Methodological and Measurement Issues; Springer: Dordrecht, Germany, 1994; pp. 195–227. [Google Scholar]
- Adamowicz, W.L. Valuation of Environmental Amenities. Can. J. Agric. Econ. Can. D’Agroeconomie 1991, 39, 609–618. [Google Scholar] [CrossRef]
- Marzetti, S.; Disegna, M.; Koutrakis, E.; Sapounidis, A.; Marin, V.; Martino, S.; Roussel, S.; Rey-Valette, H.; Paoli, C. Visitors’ awareness of ICZM and WTP for beach preservation in four European Mediterranean regions. Mar. Policy 2016, 63, 100–108. [Google Scholar] [CrossRef] [Green Version]
- Bishop, R.C.; Heberlein, T.A. The contingent valuation method. In Economic Valuation of Natural Resources; Johnson, R.L., Johnson, G.V., Eds.; Westview Press: Boulder, CO, USA, 1990. [Google Scholar]
- Fodranova, I.; Kubičková, V.; Michalková, A. Measuring societal value of tourism: A new approach. Tour. Int. Interdiscip. J. 2015, 63, 423–434. [Google Scholar]
- Rusu, S. Tourism multiplier effect. J. Econ. Bus. Res. 2011, 17, 70–76. [Google Scholar]
- Pascariu, G.C.; Ibanescu, B.-C. Determinants and Implications of the Tourism Multiplier Effect in EU Economies. Towards a Core-Periphery Pattern? Amfiteatru Econ. 2018, 20, 982–997. [Google Scholar] [CrossRef]
- Brundtland Commission. Our Common Future: The Report of the Brundtland Commission; Oxford University Press: Oxford, UK, 1987. [Google Scholar]
- Fath, B.D. Quantifying economic and ecological sustainability. Ocean Coast. Manag. 2015, 108, 13–19. [Google Scholar] [CrossRef]
- Chen, A.J.; Boudreau, M.; Watson, R.T. Information systems and ecological sustainability. J. Syst. Inf. Technol. 2008, 10, 186–201. [Google Scholar] [CrossRef]
- Starik, M.; Rands, G.P. Weaving an integrated web: Multilevel and multisystem perspectives of ecologically sustainable organizations. Acad. Manag. Rev. 1995, 20, 908–935. [Google Scholar] [CrossRef]
- Castro, C.J. Sustainable development: Mainstream and critical perspectives. Organ. Environ. 2004, 17, 195–225. [Google Scholar] [CrossRef]
- Purvis, B.; Mao, Y.; Robinson, D. Three pillars of sustainability: In search of conceptual origins. Sustain. Sci. 2019, 14, 681–695. [Google Scholar] [CrossRef] [Green Version]
- Maler, K.G. Environmental Economics: A Theoretical Inquiry; RFF Press: Washington, DC, USA, 2013. [Google Scholar]
- Dasgupta, P.S.; Heal, G.M. Economic Theory and Exhaustible Resources; Cambridge University Press: Cambridge, UK, 1979. [Google Scholar]
- Hardisty, P.E. Environmental and Economic Sustainability; CRC Press: Boca Raton, FL, USA, 2010. [Google Scholar]
- Roebeling, P.C.; Costa, L.; Magalhães-Filho, L.; Tekken, V. Ecosystem service value losses from coastal erosion in Europe: Historical trends and future projections. J. Coast. Conserv. 2013, 17, 389–395. [Google Scholar] [CrossRef]
- Paprotny, D.; Terefenko, P.; Giza, A.; Czapliński, P.; Vousdoukas, M.I. Future losses of ecosystem services due to coastal erosion in Europe. Sci. Total Environ. 2021, 760, 144310. [Google Scholar] [CrossRef] [PubMed]
- Turnhout, E.; McElwee, P.; Chiroleu-Assouline, M.; Clapp, J.; Isenhour, C.; Kelemen, E.; Jackson, T.; Miller, D.C.; Rusch, G.M.; Spangenberg, J.H.; et al. Enabling transformative economic change in the post—2020 biodiversity agenda. Conserv. Lett. 2021, 14, e12805. [Google Scholar] [CrossRef]
- Sarkodie, S.A.; Strezov, V. A review on Environmental Kuznets Curve hypothesis using bibliometric and meta-analysis. Sci. Total Environ. 2019, 649, 128–145. [Google Scholar] [CrossRef]
- Akbas, Y.E.; Lebe, F. Poverty, income inequality, and energy consumption based on EKC hypothesis: Evidence from developed and developing countries. Res. Sq. 2021. [Google Scholar] [CrossRef]
- Dasgupta, P. Trust as a commodity. In Trust: Making and Breaking Cooperative Relations; Blackwell: Hoboken, NJ, USA, 2000; Volume 4, pp. 49–72. [Google Scholar]


| Component of Natural Capital | Ecosystem Function | Ecosystem Good or Service |
|---|---|---|
| Ecosystems | habitats for all species | recreation for humans |
| Grass | food production for herbivores | meat production for humans |
| Rain | freshwater availability for all species | production of water for human consumption |
| Section | Division | Group | Class | Simple Descriptor | Specific Service Evaluated |
|---|---|---|---|---|---|
| Provisioning (biotic) | Biomass | Wild animals (terrestrial and aquatic) for nutrition, materials or energy | Wild animals (terrestrial and aquatic) used for nutritional purpose | Food from wild animals | Professional artisanal fishing |
| Cultural | Direct, in situ and outdoor interactions with living systems that depend on presence in the environmental setting | Physical and experiential interactions with natural environment | Characteristics of living systems that enable activities promoting health, recuperation or enjoyment through passive or observational interactions | Watching plants and animals where they live; using nature to destress | Tourist use as direct benefits and economic impacts from: bathing tourism; pleasure boating; recreational diving; sport and recreational fishing |
| Intellectual and representative interactions with natural environment | Characteristics of living systems that enable scientific investigation or the creation of traditional ecological knowledge | Researching nature | Scientific activity | ||
| Characteristics of living systems that enable education and training | Studying nature | Educational activity | |||
| Regulation and maintenance | Regulation of physical, chemical, biological conditions | Atmospheric composition and conditions | Regulation of chemical composition of atmosphere and oceans | Regulating global climate | Climate regulation through carbon storage by autotrophs |
| Ecosystem Service | (A) Costs | (B) Benefits | |||||
|---|---|---|---|---|---|---|---|
| (A1) Ecocentric | (A2) Anthropocentric | (B1) Ecocentric | (B2) Anthropocentric | ||||
| Direct | Indirect | Financial | Protection | ES Fruition | Protection | Financial | |
| Wildlife exploitation for food | professional artisanal fishing | professional artisanal fishing | current expenditures + capital expenditures + reallocation of funds | fish secondary production | professional artisanal fishing | current revenues + capital revenues + reallocation of funds | |
| Tourist use | sport and recreational fishing | sport and recreational fishing | fish secondary production | sport and recreational fishing | |||
| pleasure boating | pleasure boating | pleasure boating | |||||
| recreational diving | recreational diving | coralligenous secondary production | recreational diving | ||||
| bathing | bathing | ||||||
| Scientific activity | MPA functioning | studies and projects | |||||
| Educational activity | students activities | ||||||
| Climate regulation | CO2 sink | ||||||
| Total Costs (A1 + A2) | |||||||
| Total benefits (b1 + b2) | |||||||
| Aggregated net balance (b − a) | |||||||
| Ecocentric net balance (B1 − A1) | |||||||
| Anthropocentric net balance (b2 − a2) | |||||||
| Group | Formula | Parameters |
|---|---|---|
| Benthos | Mi = 0.082 + 0.925 (Pi/Bi) | Pi/Bi = production/biomass ratio |
| Fishes | Maximum value between:
| ki = von Bertalanffy’s growth coefficient for the considered species i tmax = maximum age of the considered species i linf = lower length of the considered species i |
Publisher’s Note: MDPI stays neutral with regard to jurisdictional claims in published maps and institutional affiliations. |
© 2022 by the authors. Licensee MDPI, Basel, Switzerland. This article is an open access article distributed under the terms and conditions of the Creative Commons Attribution (CC BY) license (https://creativecommons.org/licenses/by/4.0/).
Share and Cite
Paoli, C.; Povero, P.; Rigo, I.; Dapueto, G.; Bordoni, R.; Vassallo, P. Two Sides of the Same Coin: A Theoretical Framework for Strong Sustainability in Marine Protected Areas. Sustainability 2022, 14, 6332. https://doi.org/10.3390/su14106332
Paoli C, Povero P, Rigo I, Dapueto G, Bordoni R, Vassallo P. Two Sides of the Same Coin: A Theoretical Framework for Strong Sustainability in Marine Protected Areas. Sustainability. 2022; 14(10):6332. https://doi.org/10.3390/su14106332
Chicago/Turabian StylePaoli, Chiara, Paolo Povero, Ilaria Rigo, Giulia Dapueto, Rachele Bordoni, and Paolo Vassallo. 2022. "Two Sides of the Same Coin: A Theoretical Framework for Strong Sustainability in Marine Protected Areas" Sustainability 14, no. 10: 6332. https://doi.org/10.3390/su14106332
APA StylePaoli, C., Povero, P., Rigo, I., Dapueto, G., Bordoni, R., & Vassallo, P. (2022). Two Sides of the Same Coin: A Theoretical Framework for Strong Sustainability in Marine Protected Areas. Sustainability, 14(10), 6332. https://doi.org/10.3390/su14106332