Article

Land Cover and Land Use Changes between 1986 and 2018, and Preliminary Carbon Footprint Implications for Manoka Island (Littoral Region of Cameroon)

by
Claude Tatuebu Tagne
1,*,
Denis Jean Sonwa
2,
Abdon Awono
2,
Moustapha Njayou Mama
3,
Evariste Fongnzossie
4,
Riddley Ngala Mbiybe
1,
Lydie Flora Essamba à Rim
2 and
Rufin Dominique Ntja
5
1
Department of Geography, Faculty of Arts, Letters and Social Sciences, The University of Yaoundé 1, Yaoundé P.O. Box 755, Cameroon
2
Center for International Forestry Research (CIFOR), Messa, Yaoundé P.O. Box 16 317, Cameroon
3
Fondation Pour le Tri-National de la Sangha, Yaoundé P.O. Box 35 372, Cameroon
4
Advanced Teacher’s Training School for Technical Education, The University of Douala, Douala P.O. Box 1872, Cameroon
5
Cameroon Ecology, Edea P.O. Box 791, Cameroon
*
Author to whom correspondence should be addressed.
Sustainability 2022, 14(10), 6301; https://doi.org/10.3390/su14106301
Submission received: 23 February 2022 / Revised: 5 May 2022 / Accepted: 9 May 2022 / Published: 22 May 2022
(This article belongs to the Special Issue Mangrove Ecosystem Ecology, Conservation and Sustainability)

Abstract

:
Land and resource use patterns in coastal areas play a key role in the resilience of ecosystems and populations to climate change. Knowing their spatiotemporal dynamics therefore constitutes a strategic tool to help decision-makers. Based on documentary research, geographic information system (GIS), image processing, and field work, this article maps land use on Manoka Island between 1986 and 2018 and identifies the drivers of change and avenues for intervention with a view to strengthening climate change mitigation. The results show a decrease of 4% in forest area on Manoka Island, representing an average of 112 ha of inland forest and 267 ha of mangrove converted between 1986 and 2018. This increases the degraded forest area by 268% (degraded mangrove and degraded inland forest) and exposes some camps to erosion and flooding. Reduction in forest area is mainly linked to the harvesting of fuelwood and the conversion of forests into farmland and residential areas. Settlements have increased in area from 15 ha in 1986 to 90.4 ha in 2018 to the detriment of natural spaces.

1. Introduction

The sustainable management of coastal ecosystems has aroused considerable interest in recent decades and occupies a prominent space in international debates relating to climate and development. Due to their varied and coveted resources, the various activities taking place herein have rendered coastal ecosystems much more attractive [1]. They are therefore densely populated and centers for economic activities in many countries. This concentration of population and activities is the root cause of rapid urbanization in coastal regions. Urban sprawl is known to be a significant anthropogenic vector of land cover and landscape change [2]. Changes in landscape patterns linked to urbanization are critical drivers of climatic and ecological changes at local, regional, and even global levels [3]. In the coastal belt, land cover changes, along with population explosion and overexploitation of resources, have become a significant environmental issue [4,5].
Anthropogenic impacts, particularly land use change and deforestation, as well as coastal development, various forms of pollution, illegal timber exploitation, and charcoal production play a major role in mangrove loss [6,7]. Alongi [8] argues that deforestation and hydrological changes are the most devastating factors for soil nutrient–plant relations and mangrove productivity. Sustainable management of coastal ecosystems and the Earth’s surface including land cover and land use changes in general and at different levels by stakeholders remains a critical environmental challenge that society must address [9]. Land cover and land use changes are major determinants of global environmental change with potentially severe impacts on human livelihoods [10]. Such changes are advocated as climatological, hydrological, and biodiversity responses.
According to Alongi [8], land use changes can result in positive and negative impacts on mangroves. Although mangrove forests have the ability to provide protection against certain climate-related risks in coastal areas, namely erosion and flooding, climate change is a major threat to mangrove ecosystems worldwide [11]. Climate change impacts mangrove forest health and expansion through rising sea levels, cyclone activity, temperature, and precipitation changes [12,13,14]. According to Sato et al. [15], mangroves protect coastal lands against rising seas and tidal surges, while inland forests moderate temperature fluctuations and stabilize the water supply. Protecting these ecosystems against global warming is among the most readily available mitigation strategies that can help avoid future emissions over the next three decades and play a critical role in limiting global temperature rise to 1.5 °C [16].
Yet, already, 25–50% of these ecosystems have been lost since the 1940s [16]. Deforestation and conversion of mangroves have been shown to contribute 0.08–0.48 Pg CO2 e yr−1, or 10% of the total global emissions from tropical deforestation [17]. In Cameroon, mangrove forests since the 1980s have undergone deforestation and accelerated degradation. Almost 70,000 ha of mangrove forests were radically decimated between 1980 and 2006 [18]. This implies almost half of the Cameroonian mangroves areas were lost in 30 years [19,20]. This disappearance has recently taken place at an exponential rate in the Wouri estuary [19]. Several factors are responsible for this land cover dynamics: urbanization, population growth, industrialization, pollution, the development of invasive species, and more particularly, deforestation for fuelwood and the construction of infrastructure. Land use and land cover are essential components of the terrestrial ecosystem, influencing various fundamental characteristics and processes such as the hydrological cycle, geomorphological processes, land productivity, and animal species [21,22]. According to the Intergovernmental Panel on Climate Change (IPCC), change in forest cover, for example through afforestation, reforestation, and deforestation, directly affects regional surface temperature. Additionally, changes in land conditions, either from land use or climate change, affect global and regional climate [23].
Manoka Island, headquarters of Douala 6th subdivision, is part of this vast assembly of mangrove forests in the Wouri estuary. This island is home to several human groups and has seen its urban space expand in recent years. The establishment of human groups and the development of their activities have subjected the natural space to various pressures due to the perceptions inherent in each social group. In addition to its development needs and its position as one of Cameroon’s maritime gateways, much infrastructure has been developed there. Its mangrove forests, which serve as natural barriers to some risk, are razed each year to meet the wood-energy needs of its population and the demands of the city of Douala [19,24,25]. Manoka Island is therefore not exempt from the problems that coastal areas face around the world. It faces threats of various kinds, including coastal erosion, the reduction of its mangrove forests area, climate change, etc. However, for sustainable management of this coastal area and to have a better idea of its resilience to climate change, it becomes imperative to study the different land uses and their evolution, in order to forecast and manage the possible risks related to climate change. Our study is intended to furnish useful knowledge and quantitative data on land use and land cover in mangrove ecosystems. To achieve this objective, we used remote sensing data and GIS techniques to map and assess the spatial dynamics of land use/occupation. This choice is justified by the possibilities it offers in mapping at various spatial and temporal scales [26,27,28]. Moreover, these tools and techniques provide accurate and timely means of tracking and studying spatiotemporal land cover trends to assess critical ecological processes in coastal ecosystems and at various scales [29,30,31]. When remote sensing systems are used wisely, including complementary combinations of different satellite sensors, they can provide data that enhance the research and management of coastal ecosystems [32].
The hypothesis of the study is that Manoka Island, like other localities of Douala 6th subdivision and its mangrove forests, is under natural and anthropogenic influences [24,25,33,34,35,36], which reduce the carbon storage potential and exacerbate the vulnerability of this ecosystem and populations to climate change [37,38,39]. To help provide a database on the subject, it is necessary to study the dynamics of land use on Manoka Island using remote sensing in order to better understand its vulnerability to climate change. Thus, the general objective of the study is to map the land use and identify the drivers of land use changes [40,41] in order to propose some avenues for intervention with a view to strengthening climate change mitigation.

2. Methodology

To carry out this study, we made use of documentary research, analyzed satellite images, and collected data in the field. These data cover the period from 1986 to 2018.

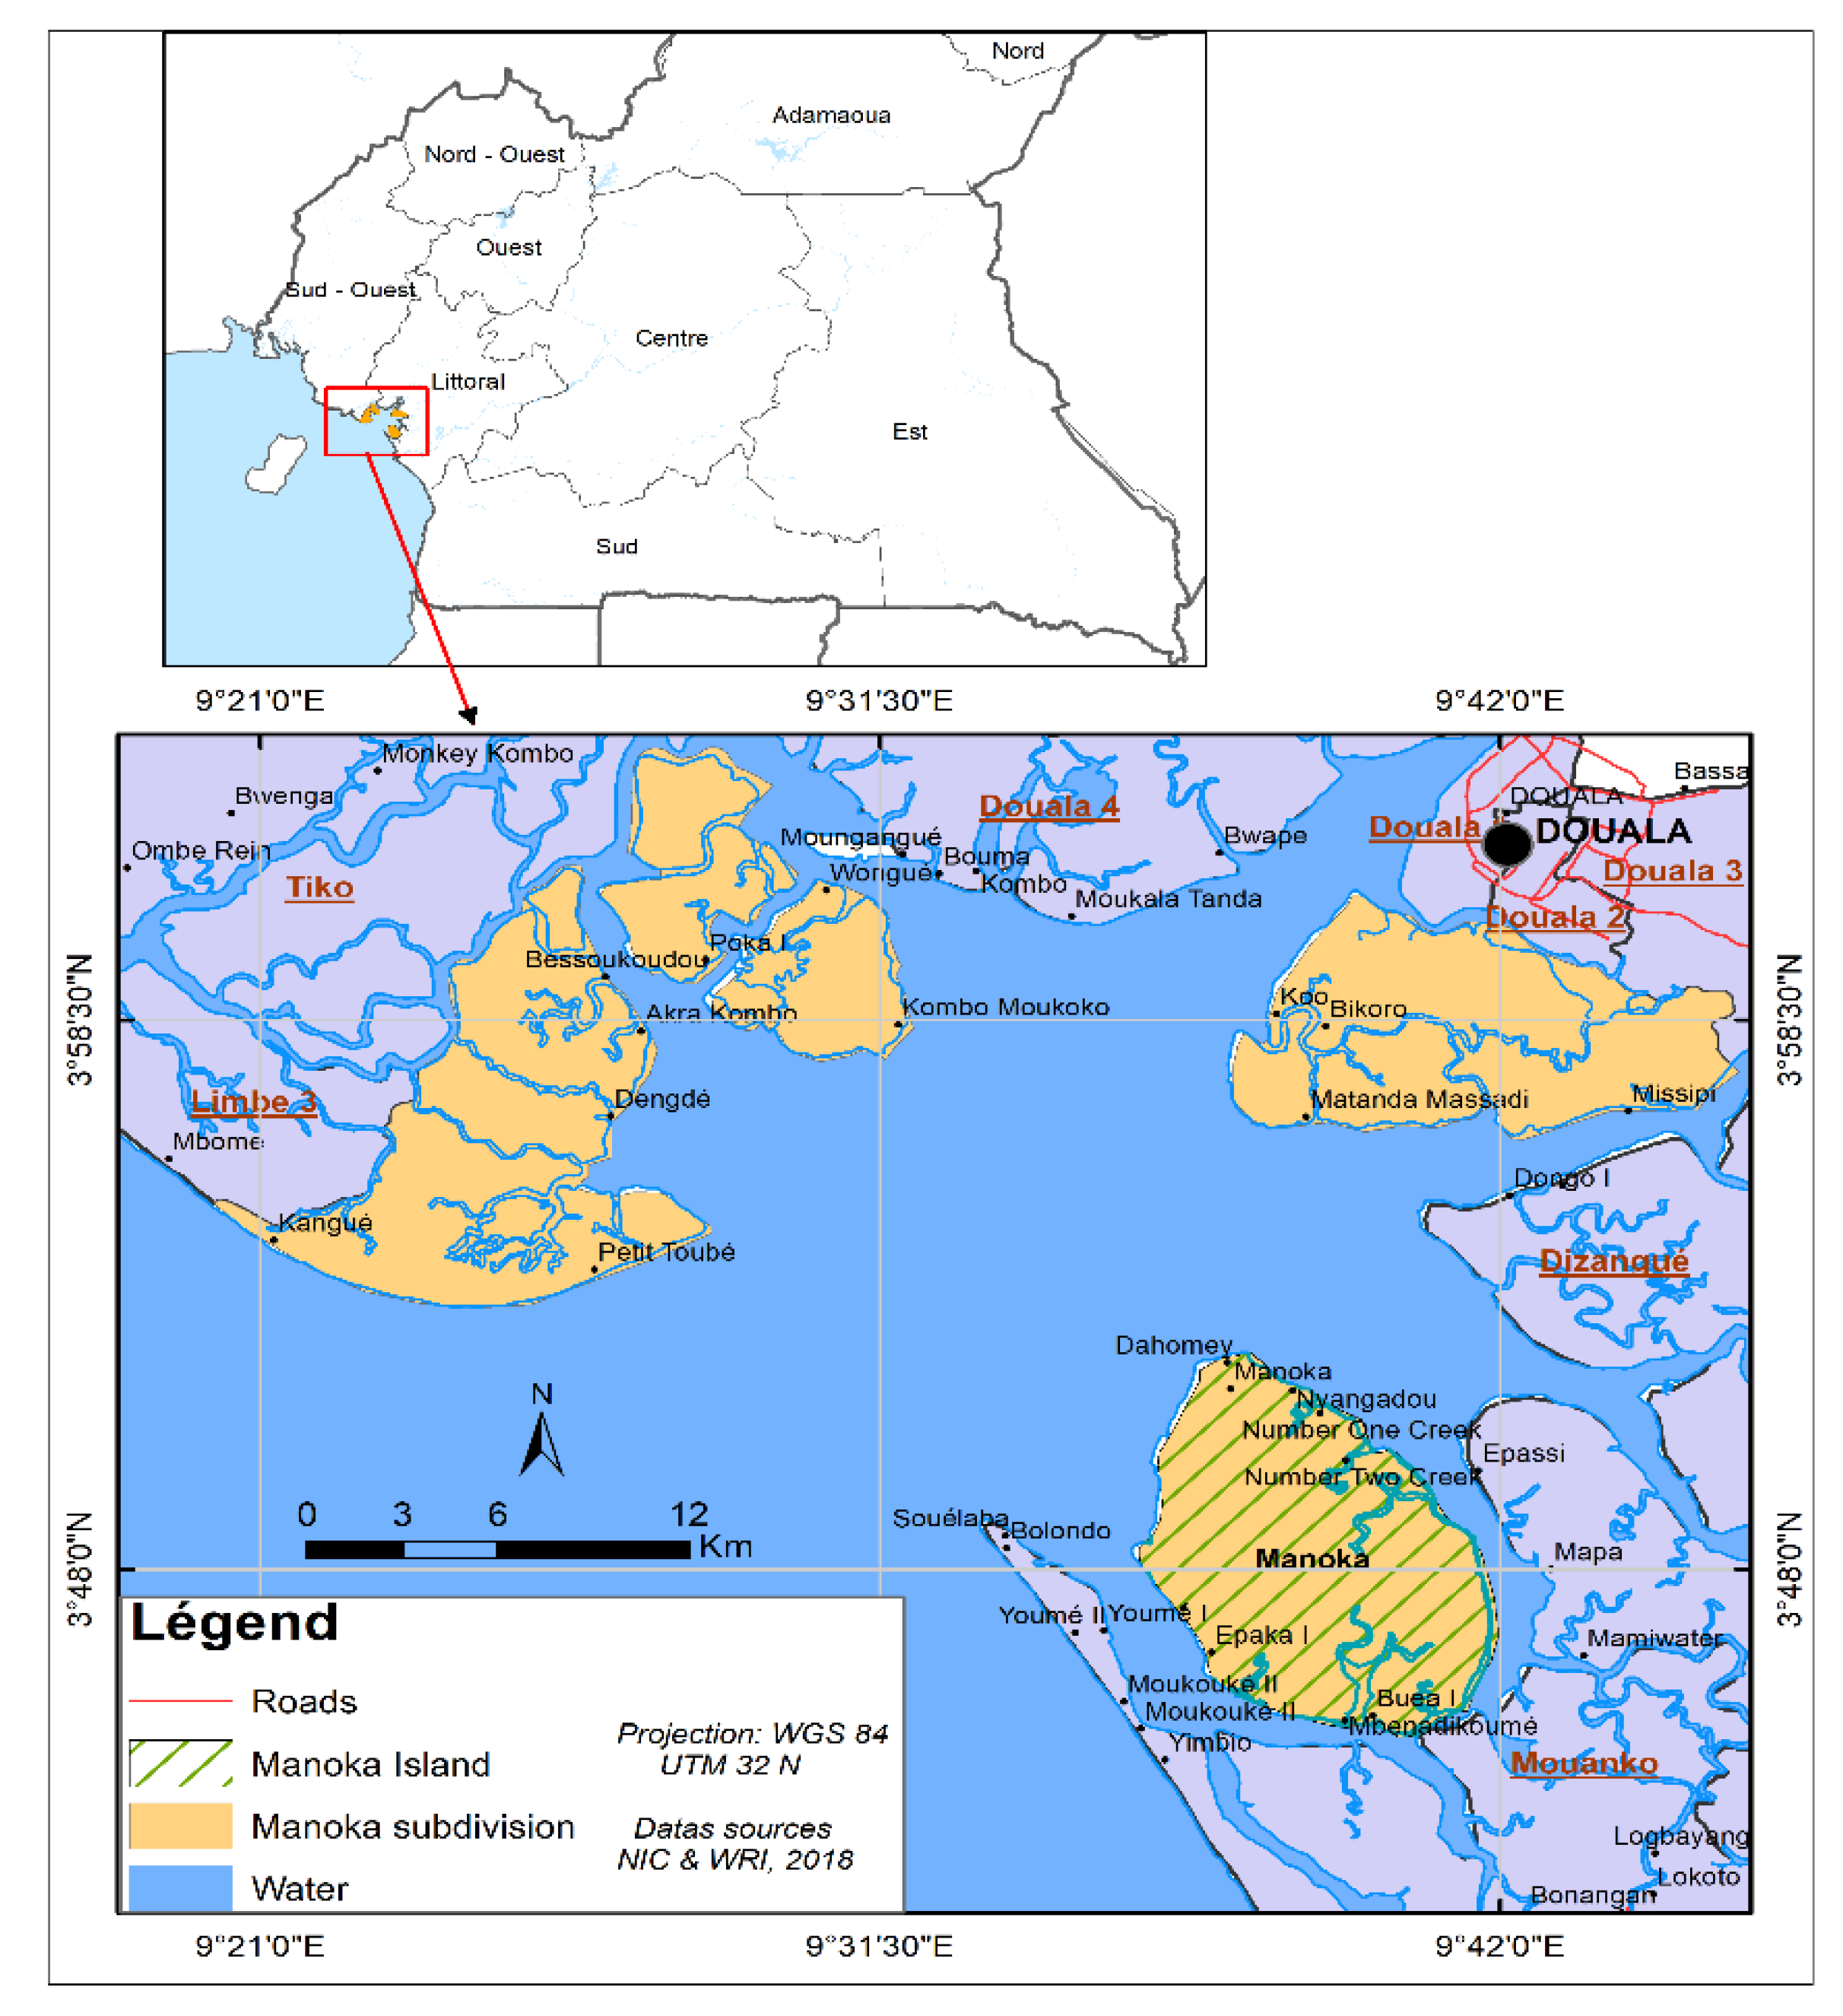
2.1. Spatial Framework of the Study

Manoka Island is located in the Cameroon estuary (Figure 1). It is one of the 24 islands that make up the Douala 6th municipality.
Manoka lies in the maritime equatorial climate zone. Rainfall varies in the range of 4000–5000 mm per year, with an average temperature of 24.4 °C. Its relief is characterized by coastal plain, particularly that of the Wouri estuary which is the outlet of rivers flowing from the high-relief continental shelf. Almost 70% of its territory has altitudes below 10 m above sea level. The slopes are very low or even zero in some areas. Its vegetation is not very varied and consists of two large vegetative entities: mangrove forests (65%) and terrestrial forests (25%). Occupying 55% of the area is the Douala-Edéa Wildlife Reserve, the Manoka community forest covers 30%, and 15% is unclassified forest (residential area and other land use) [25].
The population of Manoka Island consists of Cameroonians, Nigerians, and Ghanaians, with Nigerians outnumbering Cameroonian nationals. Fishing is the main activity of the inhabitants while other activities include sand mining, logging, and commercial activities. Illegal logging of Rhizophora racemosa, Rhizophora harrisonii, and Avicennia germinans for timber and poles is one of the most important factors for forest degradation. Worse still, some Douala city dwellers enter the island’s mangrove forests and loot them of some vital species irrespective of their heights. On the other hand, urbanization is one of the most important factors influencing these forests by transforming vast areas into settlements.

2.2. Preliminary Contacts with Stakeholders to Understand the Dynamics of the Island

As part of this study, a preliminary step made it possible to contact actors such as Cameroon Ecology, representatives of “Association de femmes fumeuses de poisson” (AFFUMA), traditional authorities, and community forest managers to understand the spatial dynamics on the island. These exchanges made it possible to collect the available documentation relating to the area and to identify certain direct and indirect factors of deforestation and forest degradation.

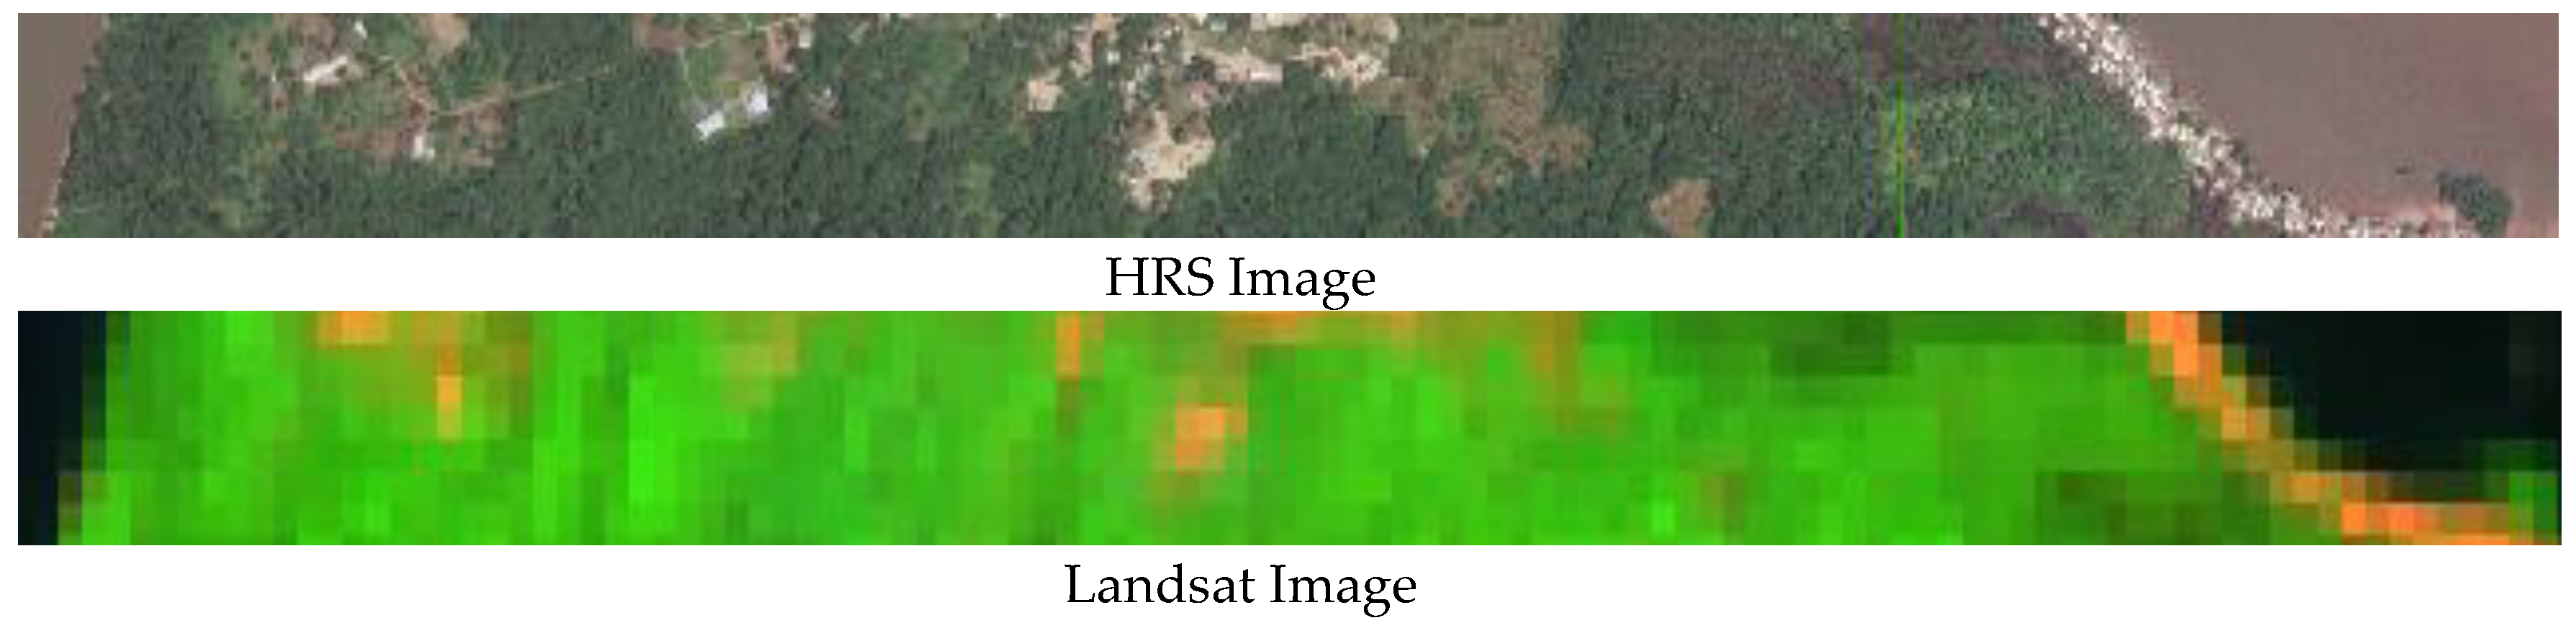
2.3. Remote Sensing and GIS Procedure for the Study

The satellite images we used were Landsat images sourced from the United States Geological Survey (USGS) website combined with very high spatial resolution (HRS) images (Google Earth and GeoEye) available from online map servers. Two criteria guided the choice of images to be used for this study:
Satellite images that made it possible to carry out multi-date mapping that met the aims of the study;
Spectral characteristics that made it possible to distinguish land cover classes.
According to Howard et al. [32], for regional assessments, the use of moderate (<30 m) spatial resolution optical (e.g., Landsat) data has been successfully demonstrated and is generally recommended [42,43]. Exploiting the dense time series of Landsat sensor data can also increase the level of change detected. The Landsat time-series data are those most widely used for monitoring blue carbon changes on larger scales [44].
Given that the coastal zone in which Manoka Island is found is an area where cloud cover often limits the availability of usable images [19], the USGS site has made it possible to carry out multi-criteria searches to select suitable images that best meet the needs of the study. These criteria were the cloud cover of the images < 10% and the period of the year (dry season, December–March). This facilitated comparisons because the spectral responses were similar (see Table 1, which presents the characteristics of the Landsat images used).
Given the concerns raised in relation to the quality and availability of Landsat images, we used those for the years 1986, 1999, 2013, and 2018 (Figure 2). This Landsat coverage was used to develop the various land use maps. High-resolution images for 2018 available in the Google Earth database were used to enrich, improve interpretation, and formalize our results and the classification of Landsat images.
Preclassification operations making radiometric and geometric corrections using ENVI software served to improve the quality of the images before processing. The processing was done in three ways: supervised classification, manual postprocessing, and evaluation of the accuracy of classification results. The creation of new channels using the normalized difference vegetation index (NDVI) showed the dynamism of the vegetation on the island [45]. The NDVI has the advantage of determining the rate of change of ground vegetation cover and biomass and also helps to distinguish and classify land cover [46].
For supervised classification, the colored compositions (bands 3-4-2 (Thematic Mapper) or bands 7-5-3 (Enhanced Thematic Mapper Plus (ETM+)) and Operational Land Imager (OLI)) were used to identify land cover classes. The extraction of the areas of interest was done based on knowledge of the terrain facilitated by the spectral data. The classes selected were undisturbed inland forest, degraded inland forest, settlement, water, undisturbed mangroves, degraded mangroves, and bare surface (Table 2). The maximum likelihood algorithm was used for the classification of these images and to produce maps of class distributions. The maximum likelihood method is widely used [26,41,47,48,49] because of its ability to classify pixels on a probabilistic basis by highlighting the standard margin of error between pixel values and those of different areas of interest [50].
Inland forest is vegetation located at altitudes of >10 m. Mangroves are forest formations under the permanent influence of salt water and are prevalent on Manoka Island. Degraded mangroves correspond to areas where human settlements have replaced natural vegetation, characterized by the presence of small home gardens, small Rhizophora trees, nipa palms, and herbaceous plants. Settlements contain buildings and infrastructure, while bare surfaces comprise beaches and bare ground.
We evaluated the accuracy of the classification maps obtained in two ways. First, a qualitative interpretation of HRS images was carried out to verify the conformity of the land use map obtained (Figure 3). This enabled us to correct misclassified pixels and to confirm and/or reclassify them in some areas.
The second method is quantitative and concerns the relationship between the number of reference points for each occupancy class and those belonging to other classes. Thus, the confusion matrix and the calculation of the kappa index of each image generated were performed (Table 3). The indices obtained confirmed that the classifications made on the image generations are valid.
The overall analysis of the image generation confusion matrices used shows:
-
The dominant land use classes (inland forest, mangrove, and water) have high precision, i.e., greater than 97.5% for all years studied.
-
Classes with a characteristic response and a limited spatial spread such as bare surface, settlement area, and degraded forest for which the determination of the occupancy class on the images was sometimes difficult, have high precision (i.e., >80%) for each of these classes and for the different years.

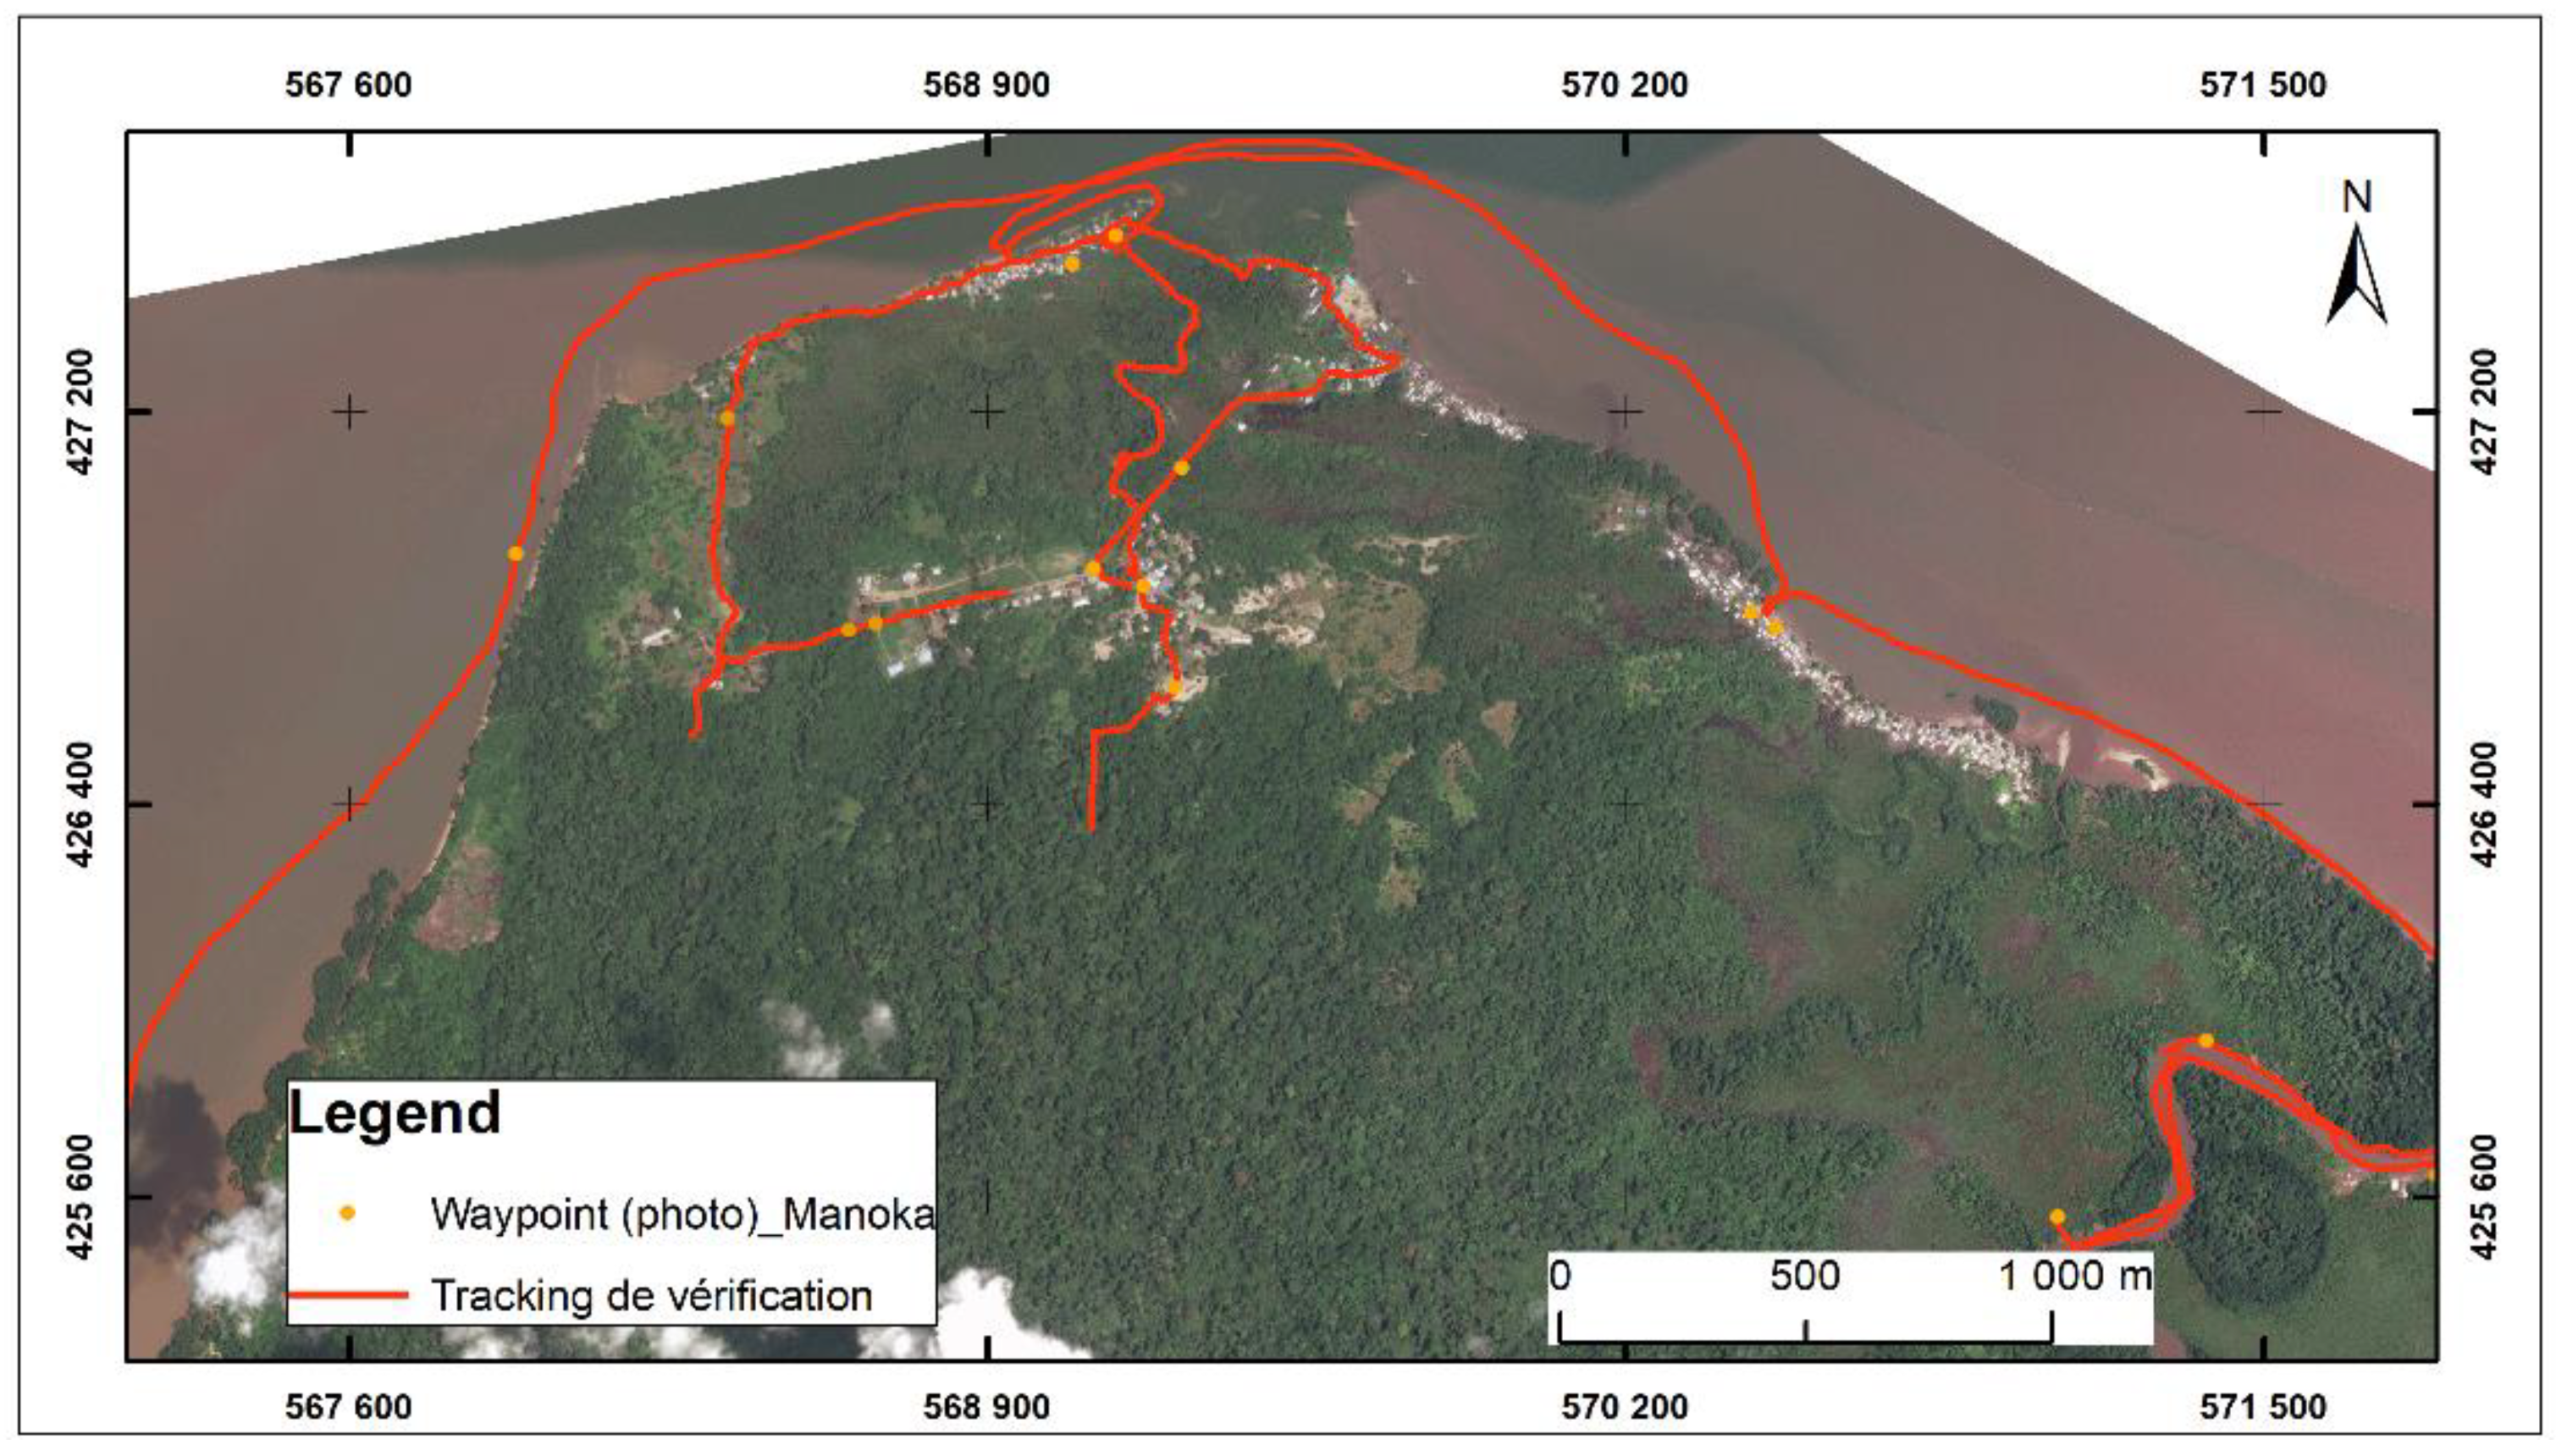
2.4. Field Data Collection

To make use of remote sensing data for inventories, and in particular, to relate land cover to land use, it is good practice to complement the remotely sensed data with ground reference data (often called ground truth data) [32]. For this reason, in December 2019, a sampling campaign was carried out for Manoka Island. The period used has the advantage that it was also close to the period when the images from 2018 were acquired, making it easier to interpret the images. This field work had two main objectives: the collection of reference points for the classification and validation of land use, and the collection of information on the climate change vulnerability and drivers of deforestation and forest degradation on the island. Information was obtained through interviews with twelve fish smokers, four officials of the La Mangrove Association, eight fishers, three traditional authorities, and some selected informants. Direct observation of land uses and other factors of forest degradation were also made on this occasion. The data collected during the interviews provided information related to the changes noticed and equally made it possible to highlight the dynamics of land use and to take this into consideration during image classification. Thirty-two reference points were collected and used for validation. Figure 4 is an example of tracking a segment that was visited in the field to record land cover information and to validate the classification of the image.

2.5. Carbon Stock and Flux Assessment

The assessment of carbon production in mangrove ecosystems in this study builds on the work of Ajonina et al. [51], Murdiyarso et al. [40], and MINEPDED [19], who evaluated carbon production in mangrove ecosystems. Based on Ngoufo et al. [52] on carbon production in inland forests, we have estimated the amount of carbon stored by forests on the island. Rates of carbon sequestration in forests vary depending on forest conditions (Table 4) and the carbon pool involved (biomass above and below the soil surface). The soil reservoirs (soil and roots) have a higher carbon sequestration rate (65% per ha) than the aerial parts (35.0% per ha) [19]. The estimate of carbon stocks was based on the approaches of these authors but mainly on the state of the forest: greatly exploited, moderately exploited, and undisturbed. Undisturbed forests sequester more carbon than very degraded areas. The average stand density of mangrove forests in Cameroon is 3255.6 trees/ha in virgin stands, with 80% of trees in the size class of >10 cm, and a stand volume of 427.5 m3/ha corresponding to an aboveground biomass of 305.7 Mg/ha [19].
To calculate the carbon stock of each land use type, the area of that land use type is multiplied by its emission factor: carbon stock = EF × A (EF: emission factor and A: area).

3. Results

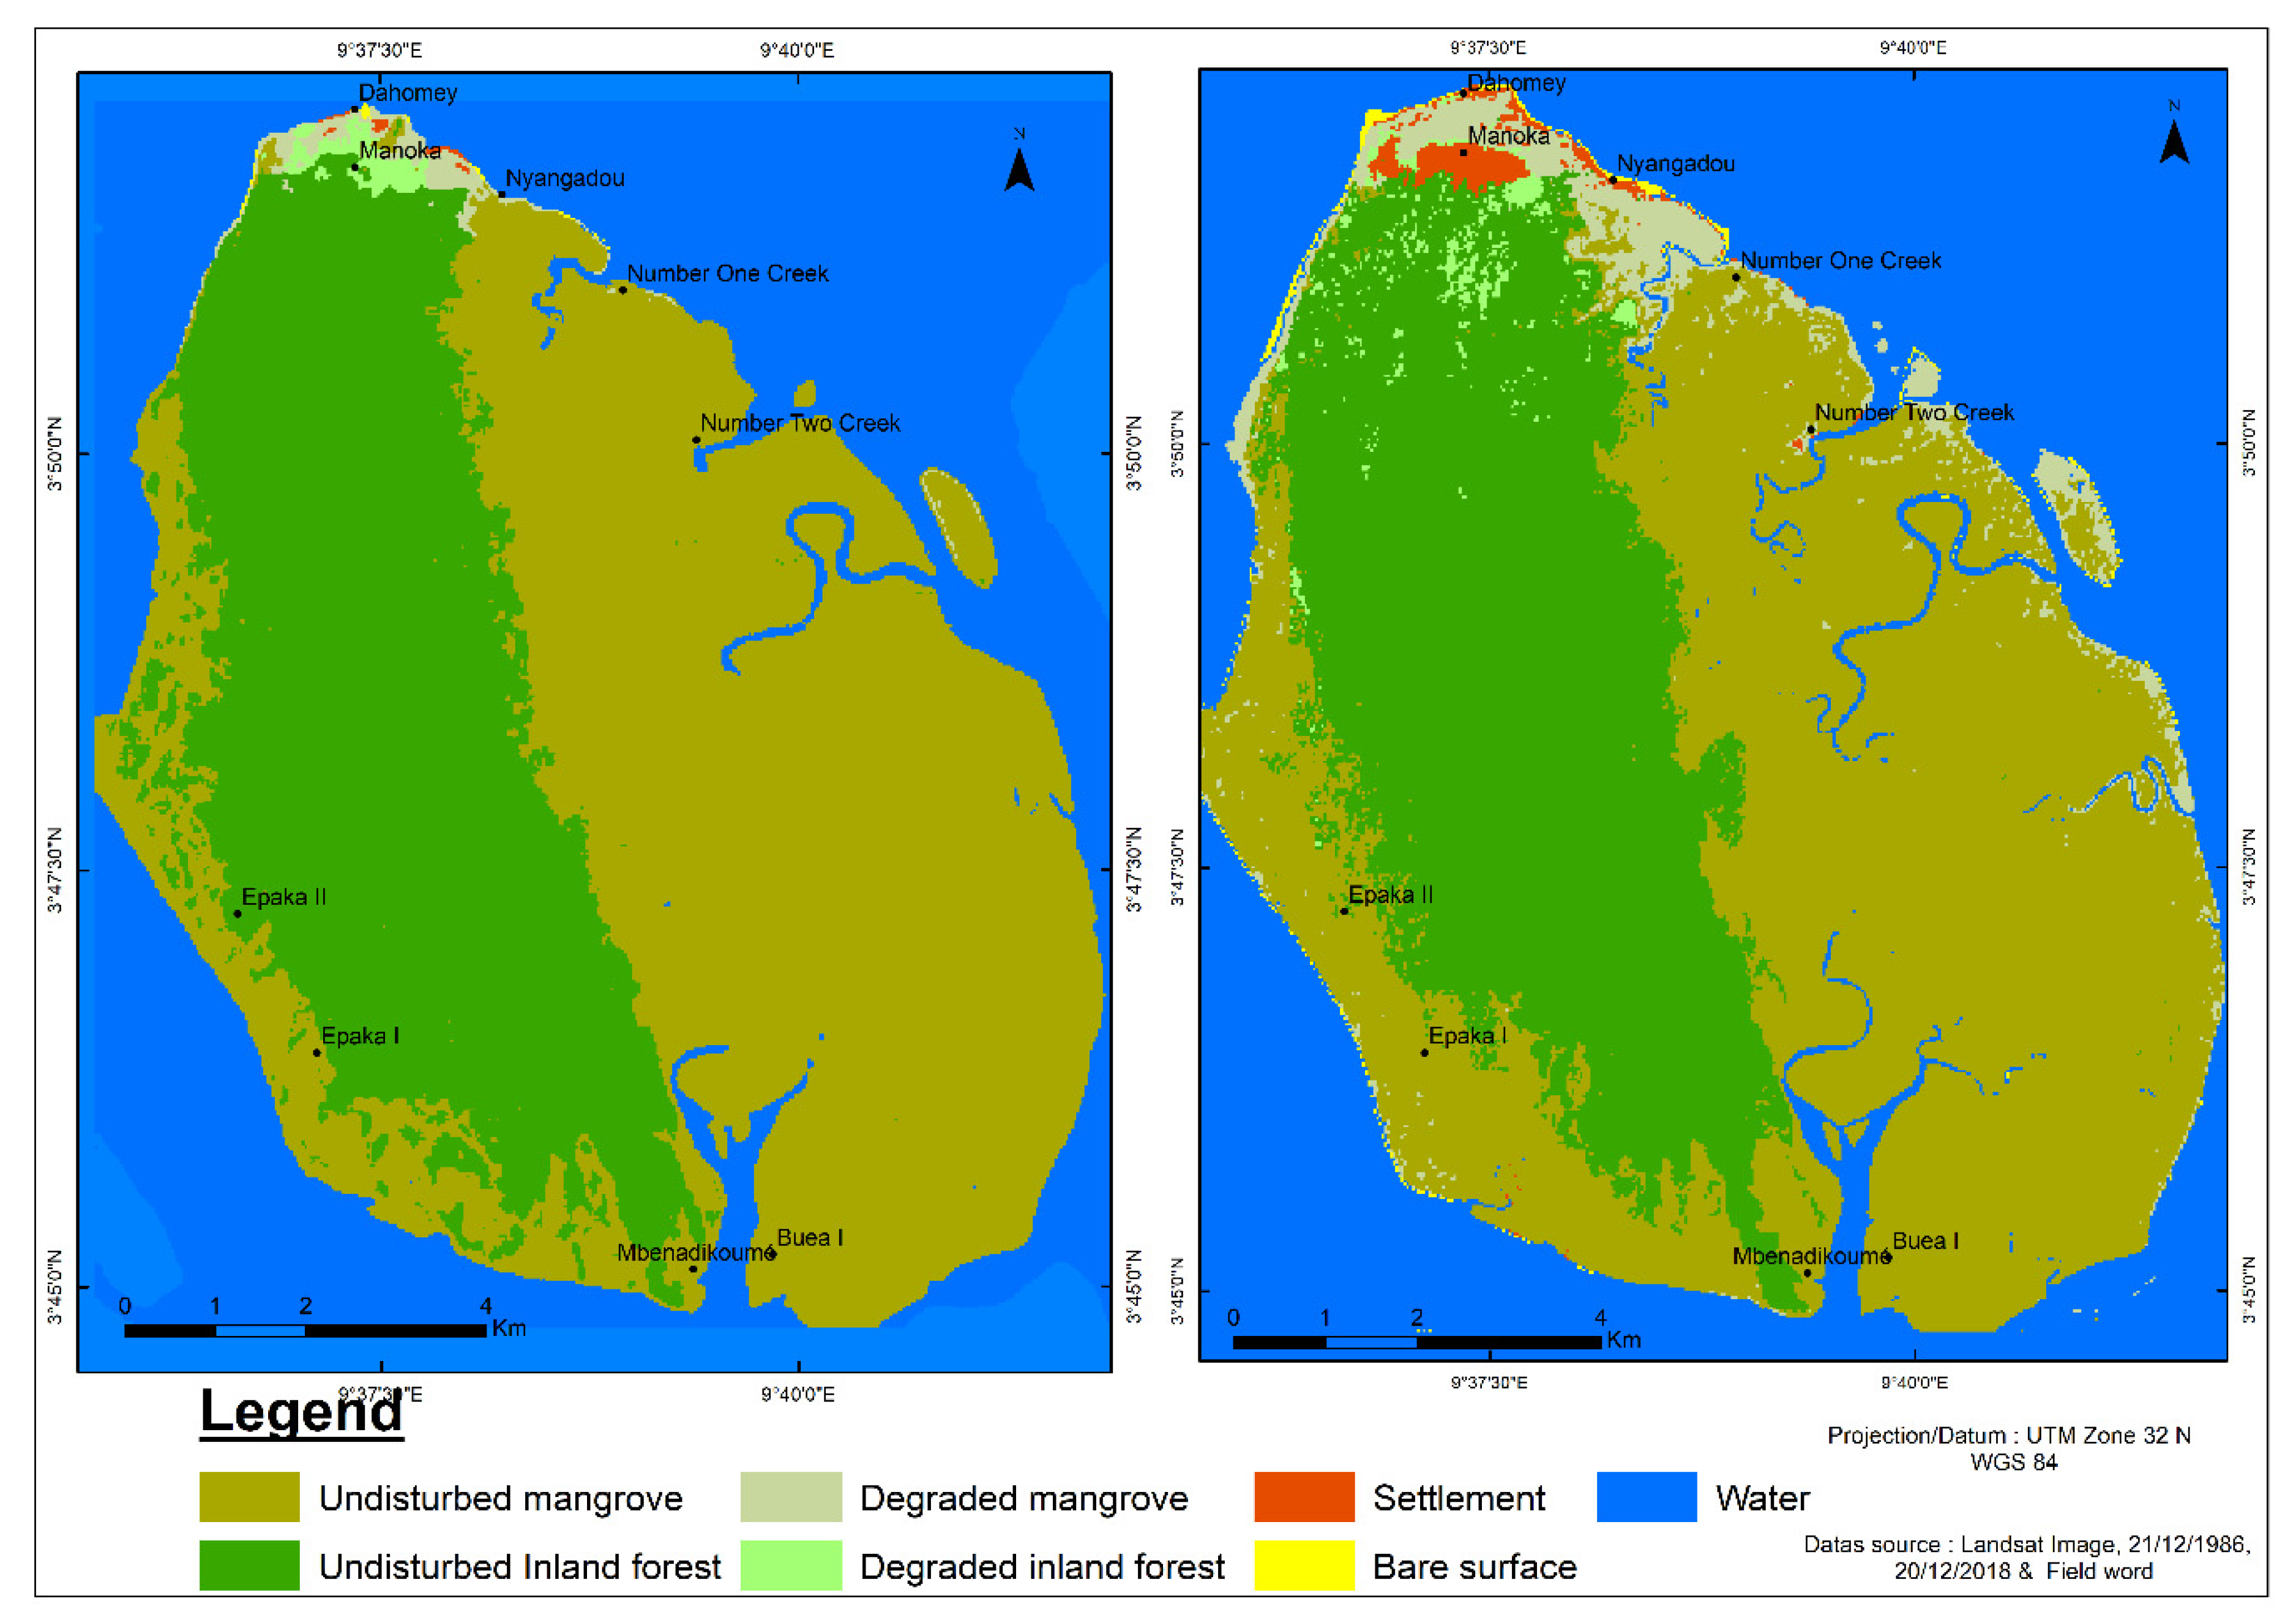
3.1. Main Land Cover and Land Uses Currently Found on Manoka Island

The analysis and processing of the different images show a very strong variation in land use classes in the far north of the island. It is where Manoka city is located, the headquarters of Douala 6th subdivision, and where human settlement dates from the pre-colonial period. Here, plant species and their related vegetation are highly anthropized and grow in the vicinity of a high concentration of buildings. In the southern part, relatively undisturbed mangrove forests and inland forests dominate. The different land cover classes identified on Manoka Island and their area in December 2018 are presented in Table 5.
In December 2018, mangrove forests occupied more than half (53.33%) of the island’s area (5740.48 ha). Inland forests represent the second occupancy class after mangroves with 3814.85 ha, or 35.44% of the total area. Other areas should not be neglected because they reflect the impact of human activities, among others, on the plant cover: settlement 0.84%, degraded mangroves 4.1%, and degraded inland forest 0.94%. Water constitutes an area of 4.96% and bare surface, 0.36%

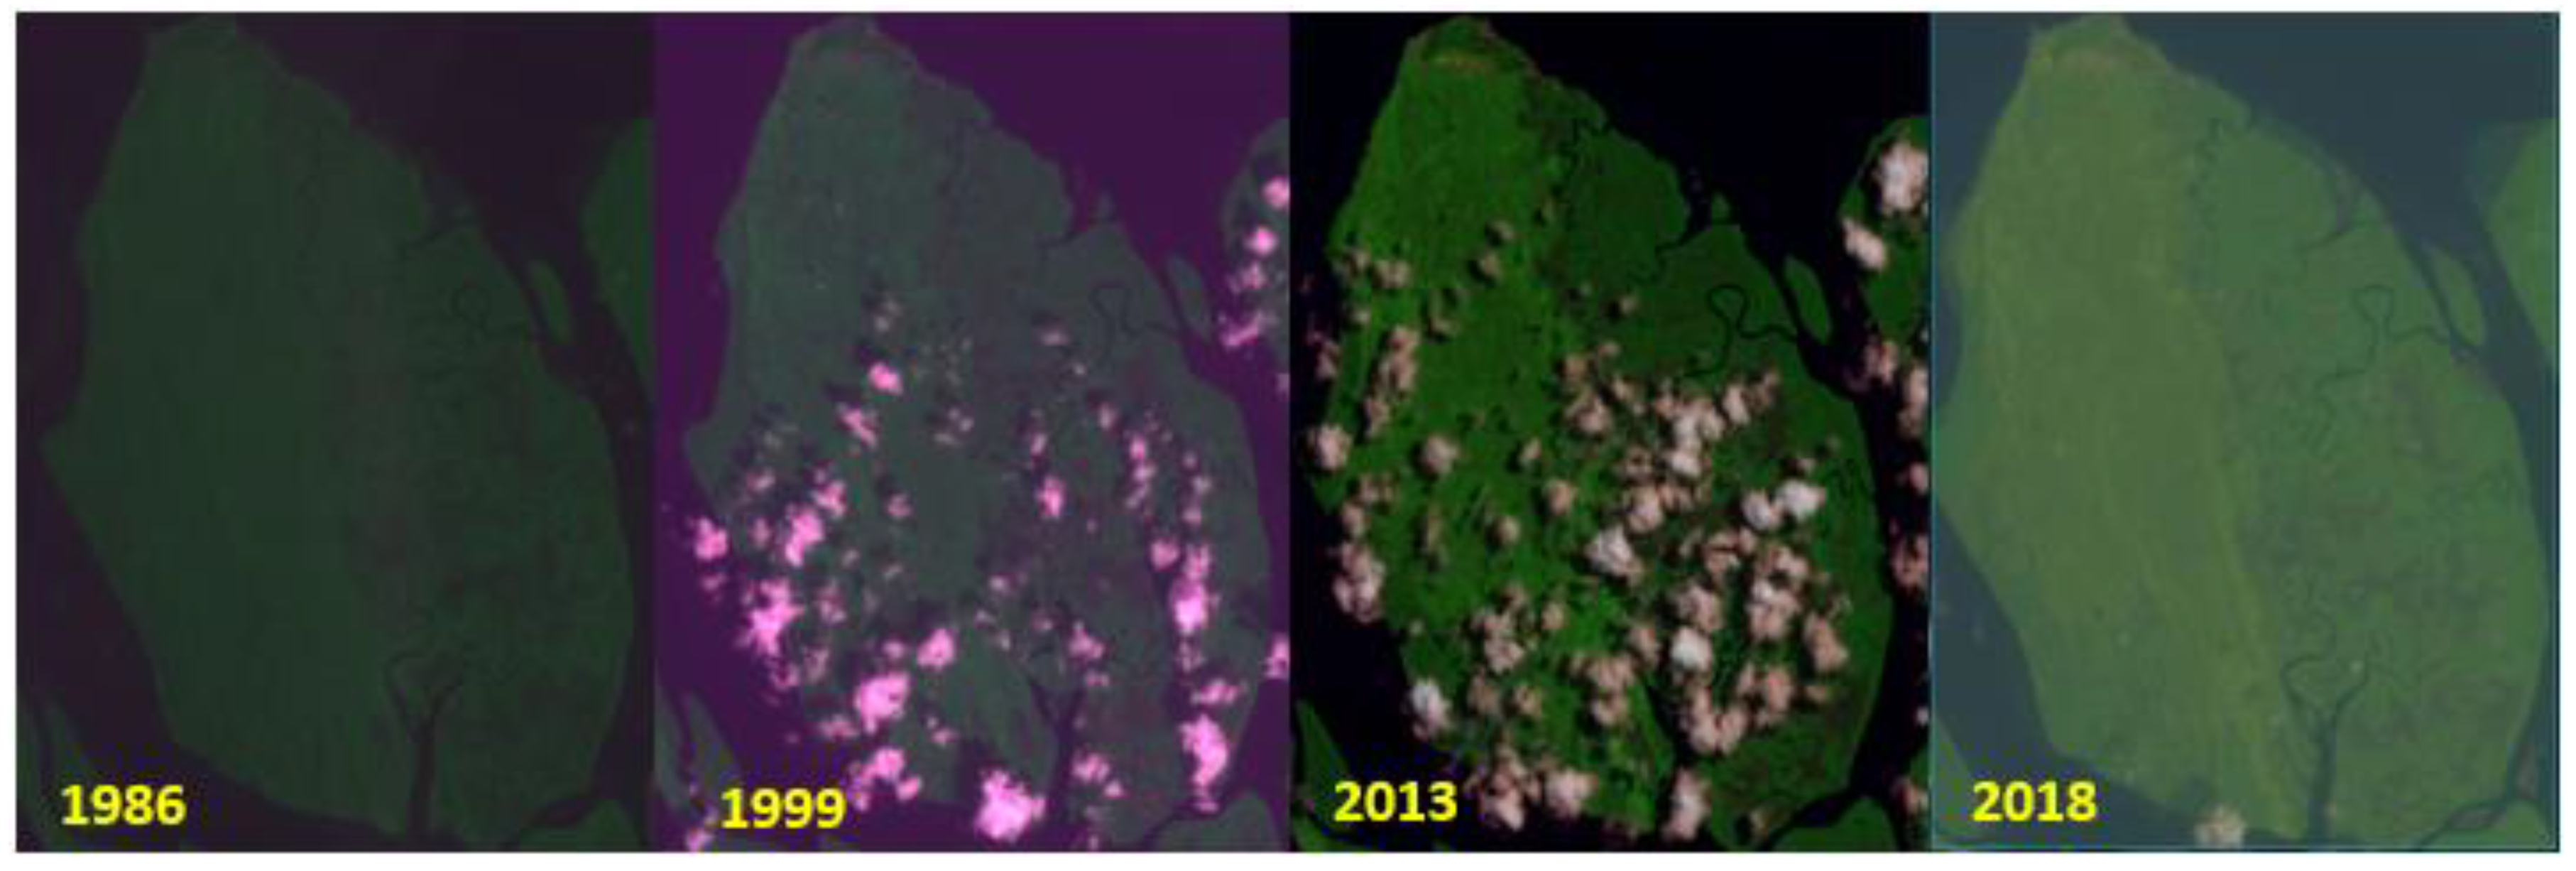
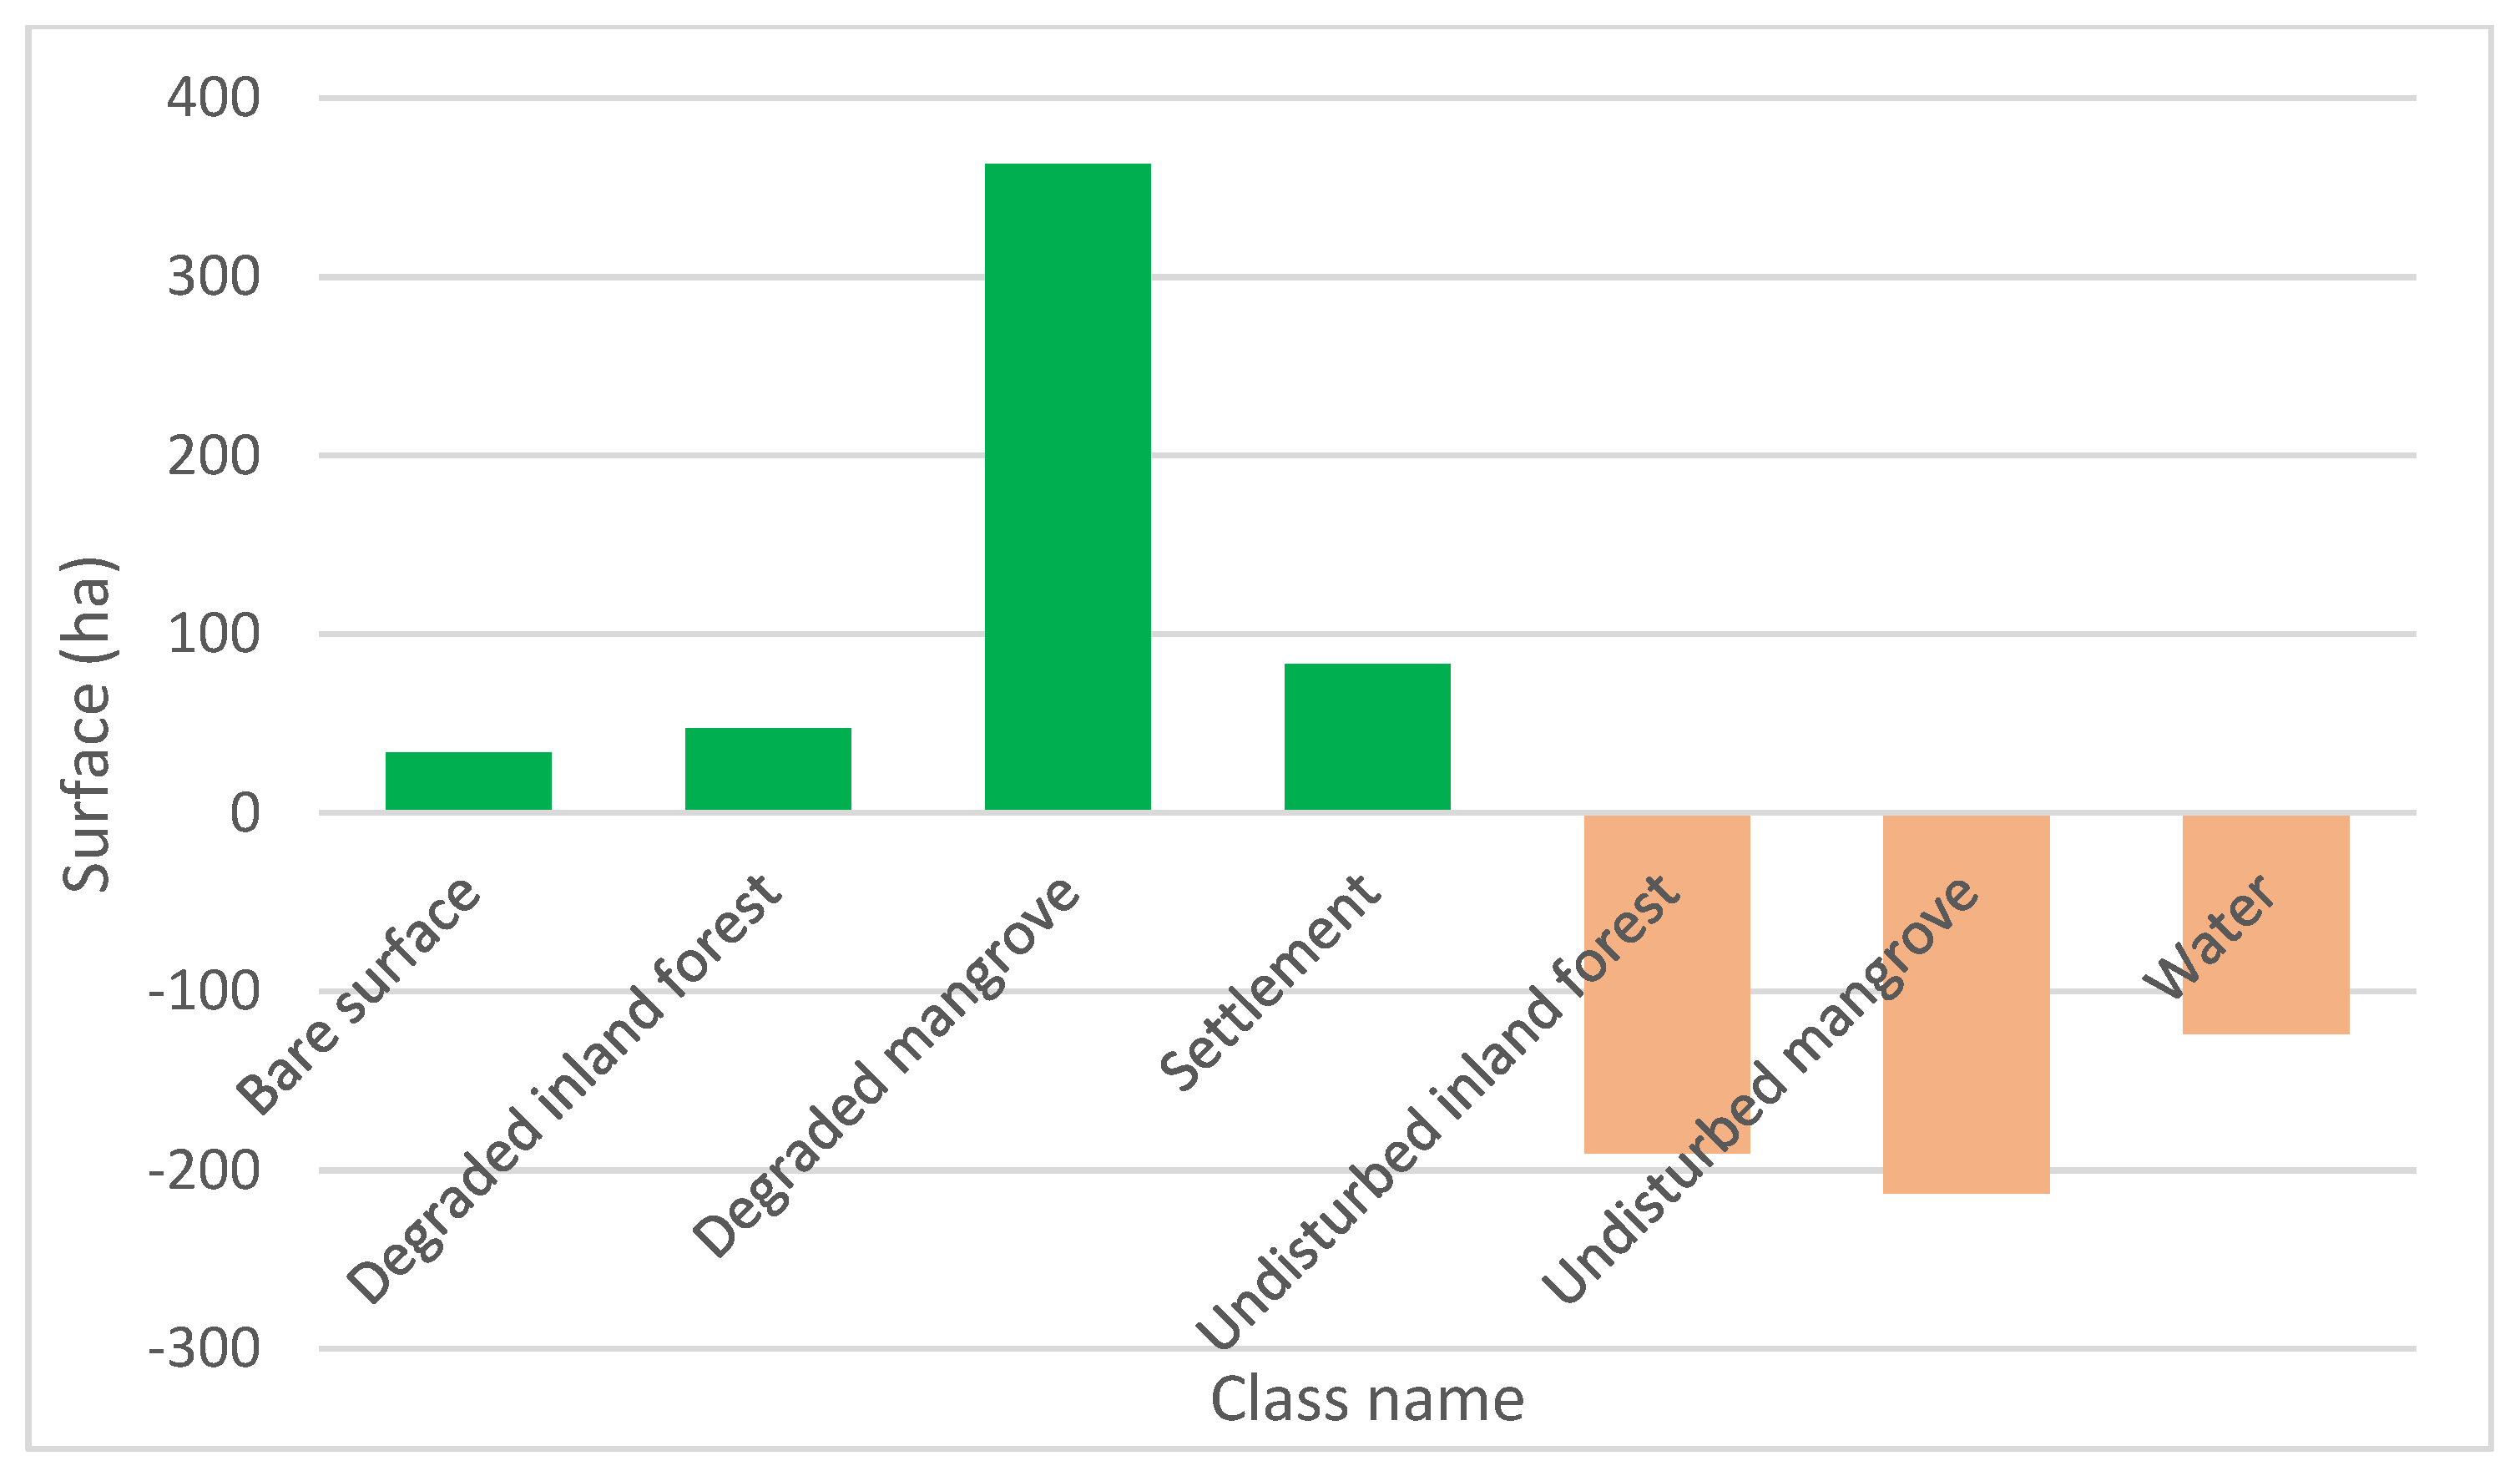
3.2. Land Use and Land Cover Change between 1986 and 2018

Between 1986 and 2018, land use classes on Manoka Island underwent profound changes in land cover and land use (Figure 5). All land cover/land use classes defined in this study were impacted. Although the changes are negative for undisturbed mangroves and undisturbed inland forests, degraded mangroves and settlement areas are significantly increased over the same period.
Figure 5 shows the evolution of the different land use classes between 1986 and 2018. It illustrates considerable changes in the environment when comparing the 1986 and 2018 maps. The maps show fewer dynamics of land cover in the southern part of the island and many changes in the northern part. Changes in the northern part include the increases in built-up areas, degraded mangroves, and degraded inland forests. In fact, some parts of undisturbed mangrove cover and undisturbed inland forest are increasingly being replaced by housing, while other areas of these classes of land cover are evolving towards degraded stages. For example, degraded mangrove areas have increased by about 325% between 1986 and 2018. The evolution in areas of degraded inland forests, degraded mangroves, and settlement illustrates the impacts of human pressure on the forests of this island, as can be seen in Figure 6.
The change matrix analysis highlights the different land use classes observed during this period that have been converted into other land uses. These reflect the evolution of occupancy classes such as settlement, inland forest, and degraded forest. The conversion of certain occupancy classes to other units or land use categories between 1986 and 2018 is summarized in Table 6.
According to the results of the change matrix inTable 6, the changes that were more important during this period are the conversion of mangroves to degraded mangroves, and the conversion of 31.57 ha of inland forest and 17.8 ha of degraded mangrove to built-up space. The surface area of degraded inland forest space increased between 1986 and 2018 to the detriment of inland forests. In fact, nearly 80.18 ha of undisturbed inland forest was transformed into degraded inland forests and 270 ha of undisturbed forest mangroves became degraded forest mangroves. This led to an increase in degraded forest areas during the study period. The regressive evolution of these two occupation classes, namely undisturbed inland forest and undisturbed mangrove in favor of a more degraded plant formation confirms the degradation of the plant cover observed in the far north of the island and thus reduces carbon storage.
The evolution of settlement areas was also noticed during the study period. It increased from 15 ha to 90 ha. Each occupancy class lost portions of its land to the benefit of the settlement. In fact, 17.8 ha of degraded mangrove was converted into built-up space, as was 21.77 ha of degraded inland forest and 31.57 ha of inland forest. This explains the increase of settlement classes by 75 ha more, compared with 1986, confirming that urban dynamics are on the rise on the island. This also makes it possible to classify the built area as one of the main factors of deforestation on the island.

3.3. Carbon Stock and Flux (Spatial and Temporal Considerations)

The carbon stocks stored in biomass and flux are closely linked to environmental conditions and human dynamics. Aerial biomass values were obtained by processing Landsat images from the years 1986 and 2018 using ENVI and were processed using the Advanced Spaceborne Thermal Emission and Reflection Radiometer (ASTER) digital elevation model (DTM) and ArcGIS software. These tools were used to estimate carbon stocks.
The average rate of carbon sequestration in the mangrove forest is presented in Table 6 according to data activities of the current study and the emission factors from Ajonina et al. [51]. Manoka Island with a forest area of 9645.14 ha (GIS area) could sequestrate nearly 3,890,040.77 tc (Table 7). With regard to inland forests, we estimated, using the activities data of the current study and the emission factor from Ngoufo et al. [52,53], that 164.2 tons of carbon per hectare were sequestrated for undisturbed forests and 85.38 tons per hectare for highly degraded inland forests. From Table 7, between 1986 and 2018, −119,267.54 tc had been lost as a result of land cover and uses changes in Manoka Island.

4. Discussion

4.1. Direct and Indirect Drivers of Deforestation and Forest Degradation on the Island

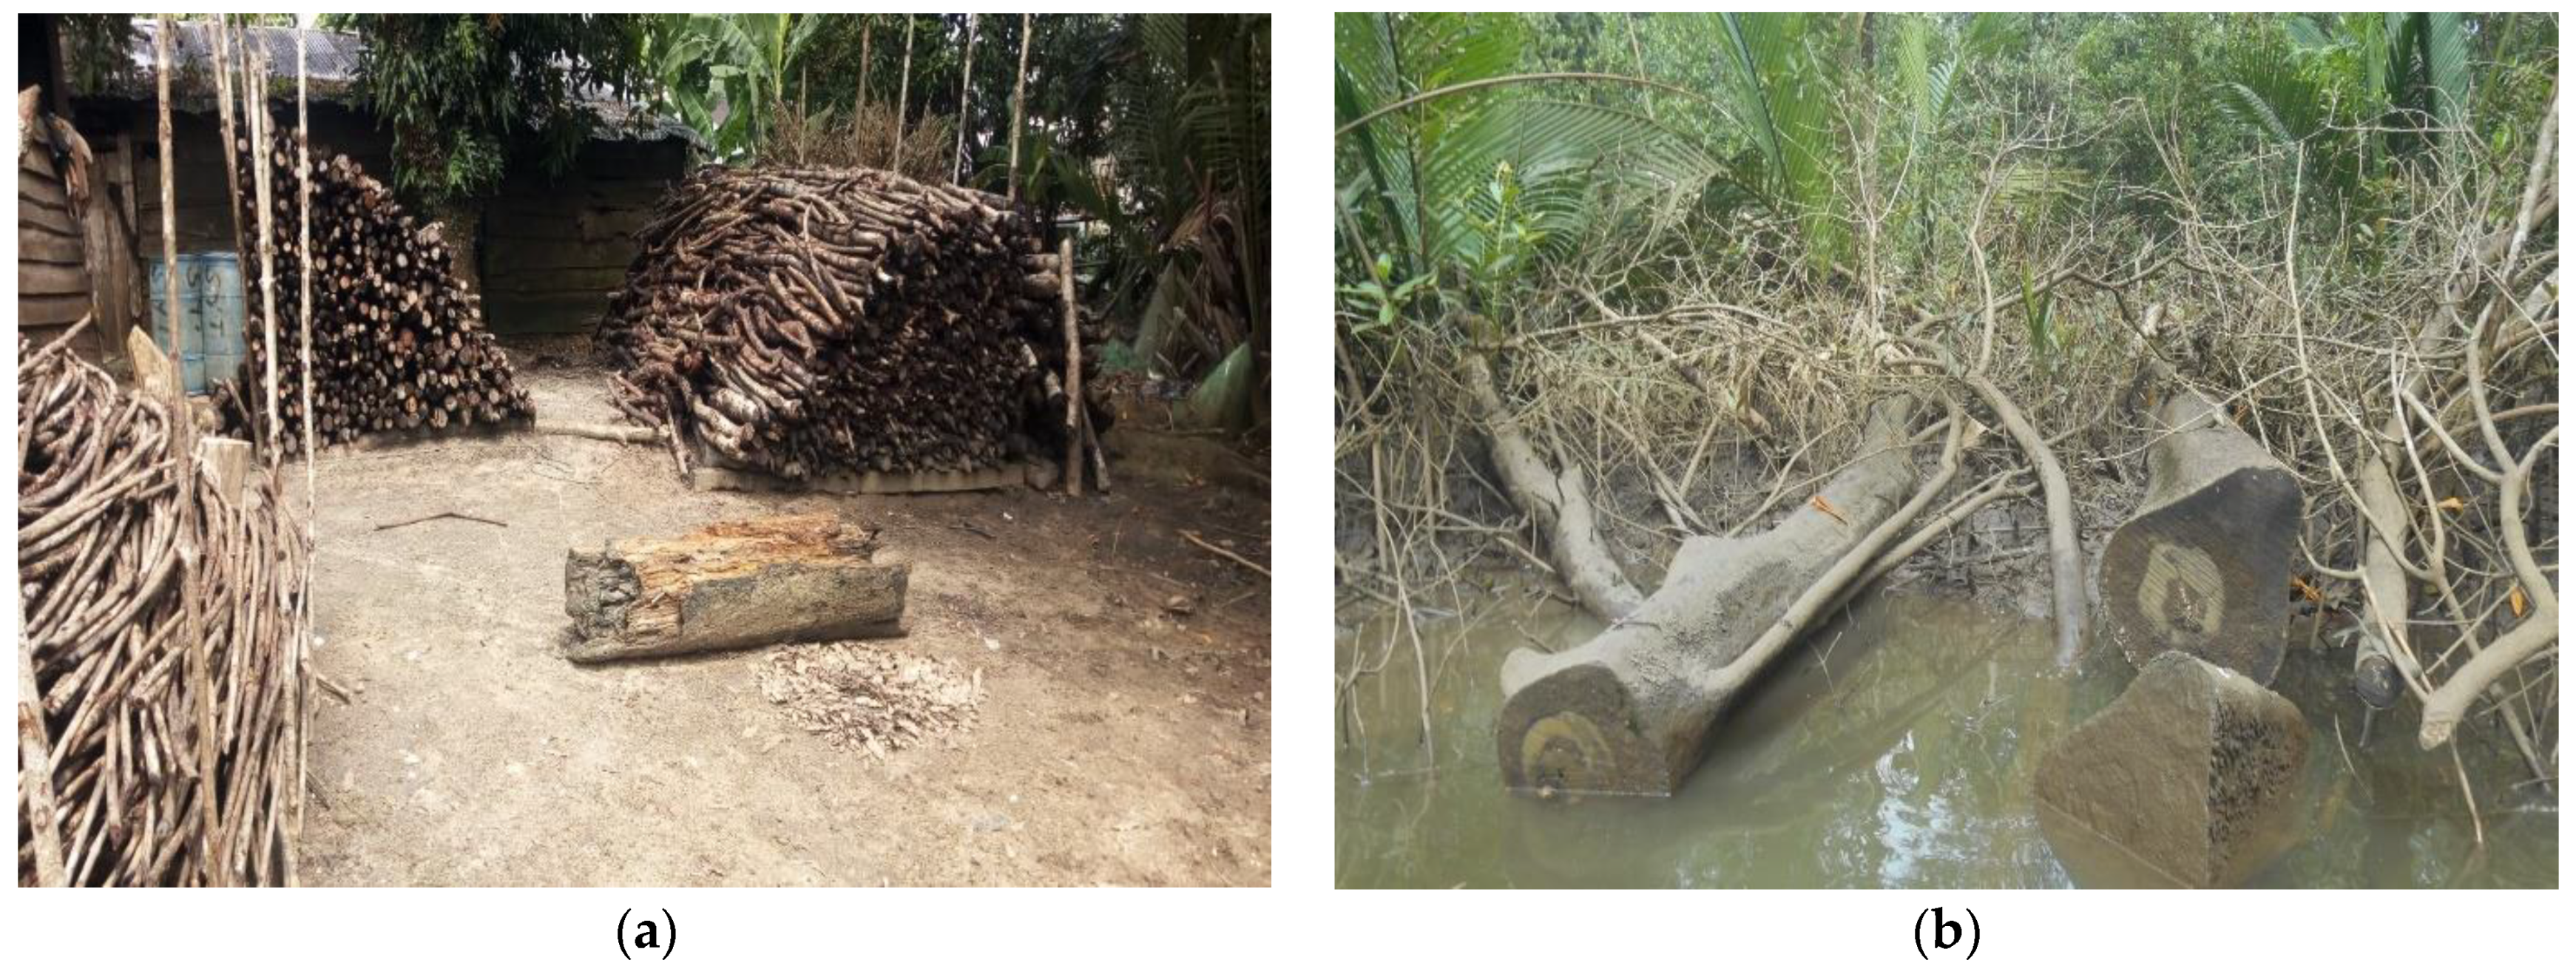
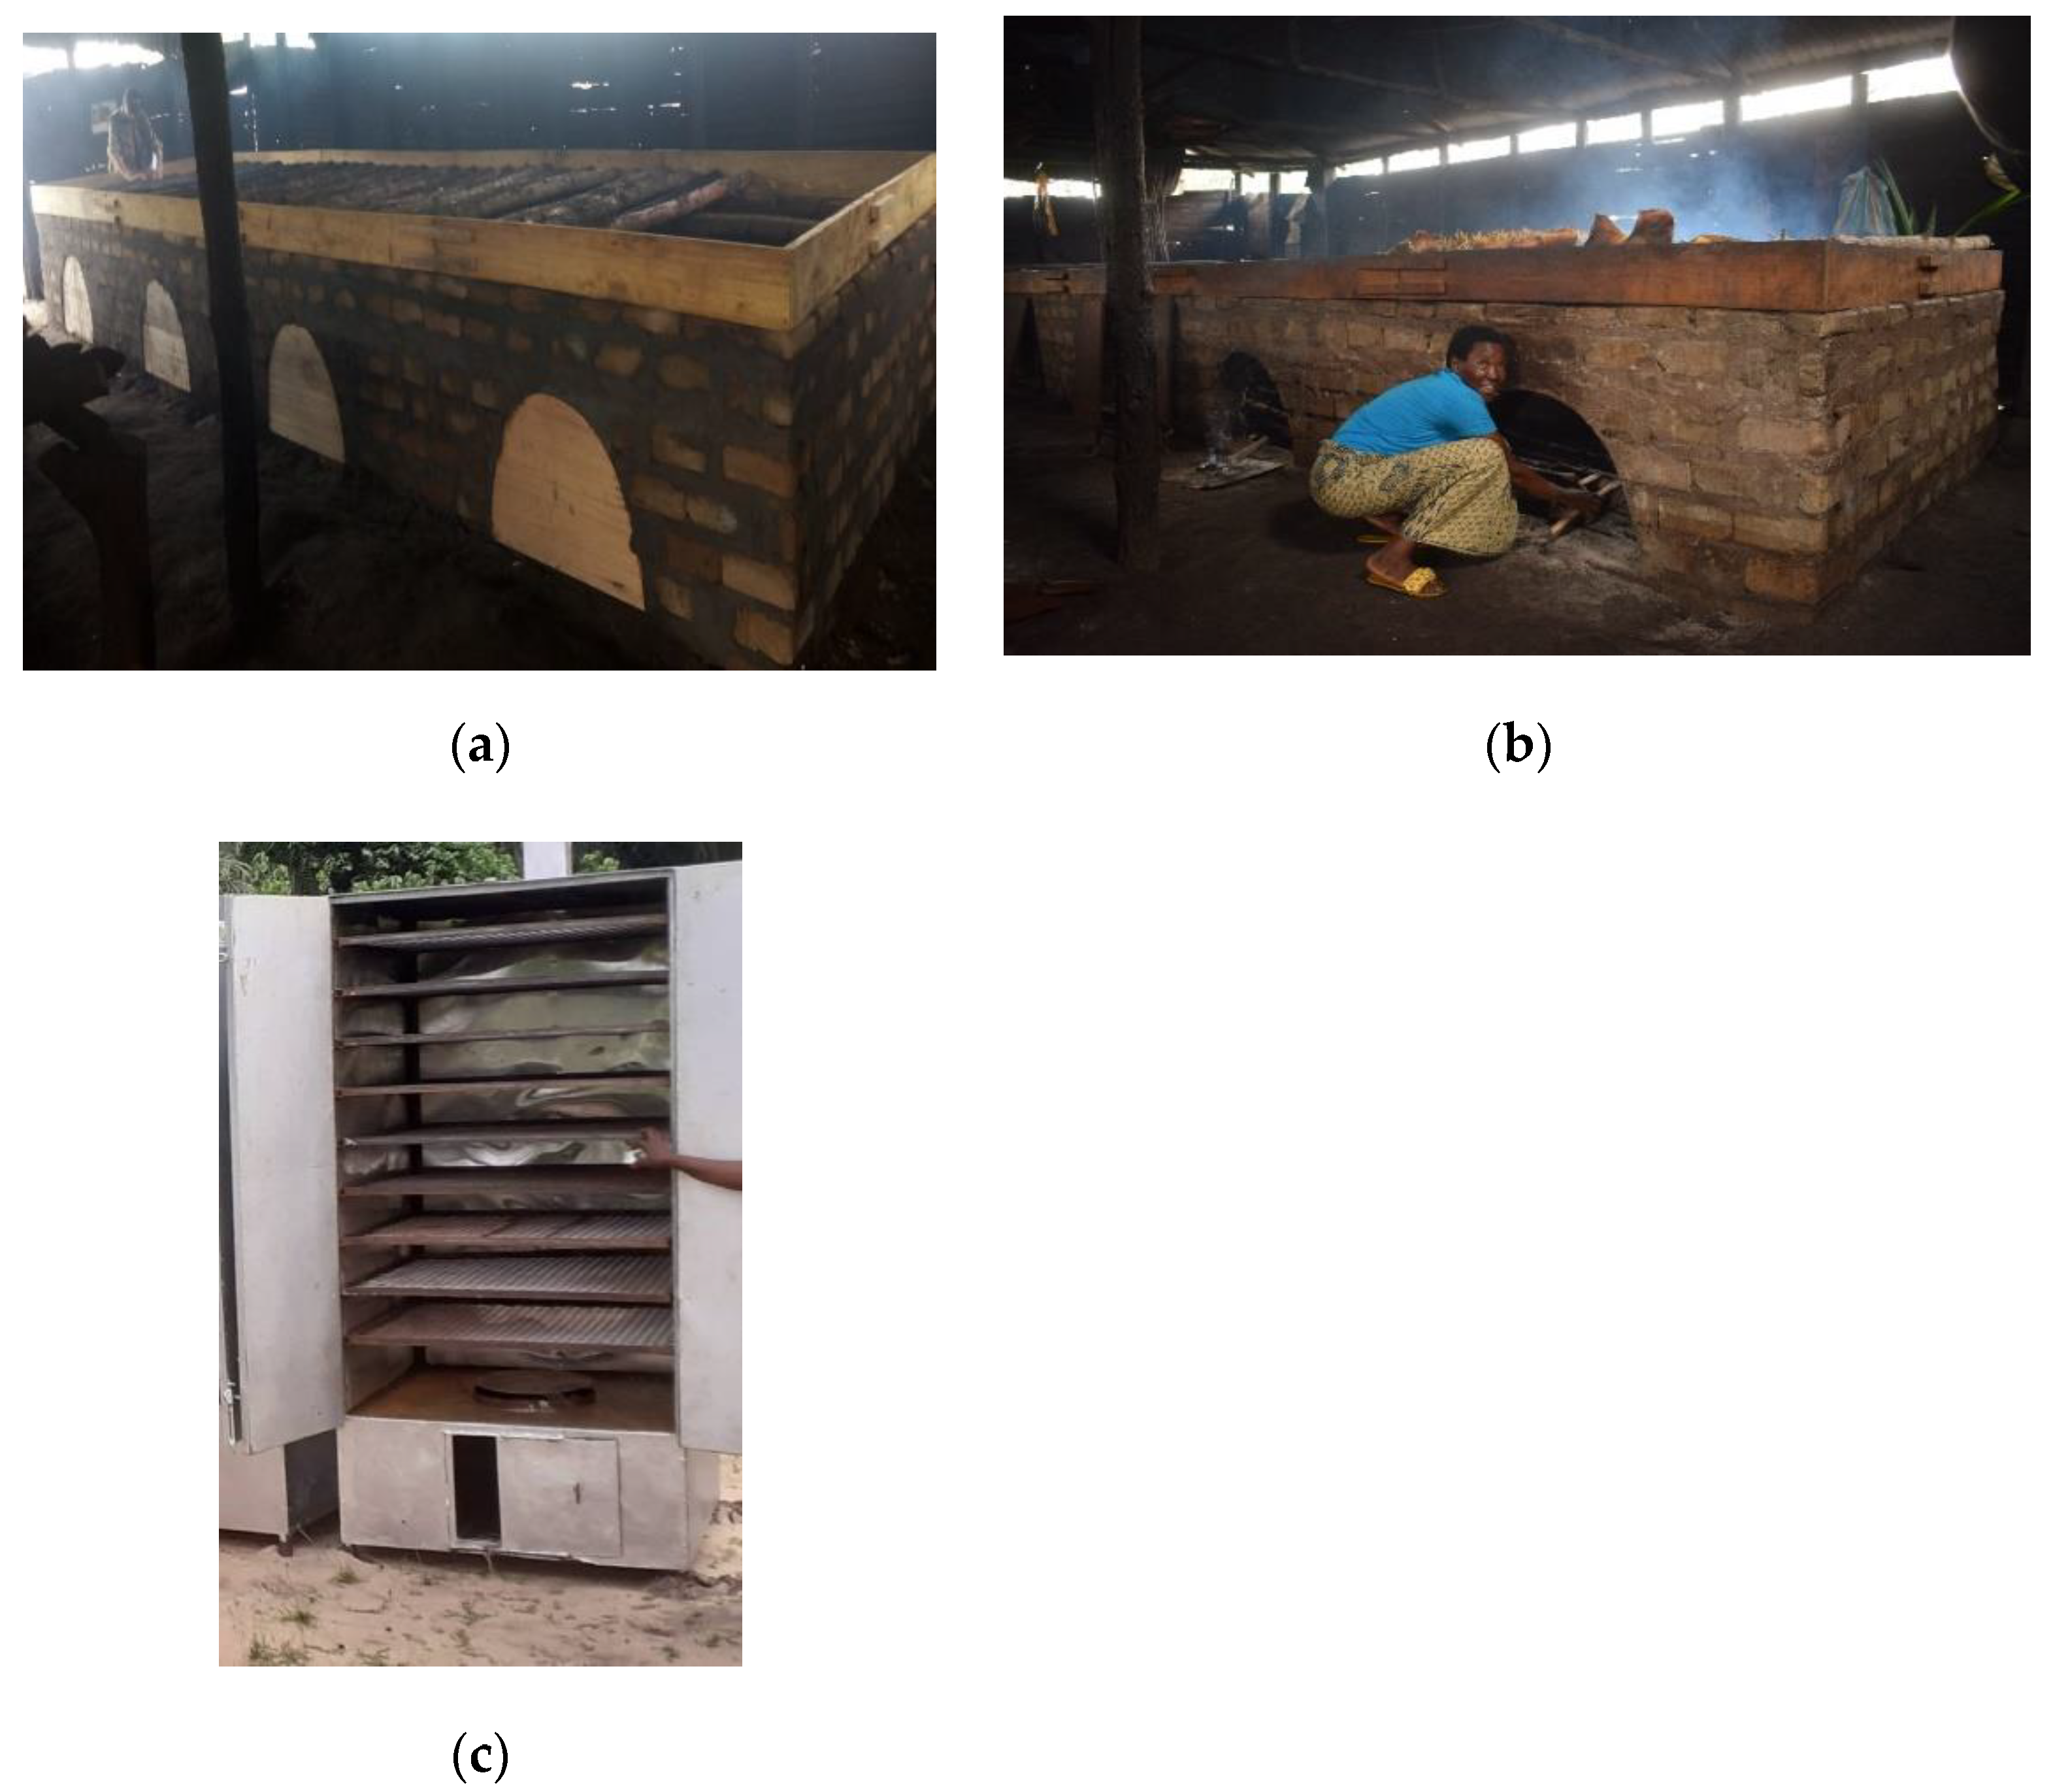
4.1.1. Fuelwood Harvesting and Low Energy Efficiency

The harvesting of fuelwood is one of the primary causes of mangrove forest degradation in the Douala-Edéa zone [14,54,55,56] in general and in particular on Manoka Island [24]. Fuelwood is the main source of energy used by the island’s inhabitants. This wood is mainly fetched from mangroves, particularly red “palétuviers” (Rhizophora mangle). It is exploited illegally in the form of poles mainly by women fish smokers and in the form of logs by illegal operators to meet demand in the city of Douala. For fish smokers, it is a selective harvest (young Rhizophora plants). They are not replanted. Gradually these harvests reduce the ability to renew degraded spaces. Efforts by civil society organizations to use improved ovens for smoking fish to reduce pressure on mangroves have not borne fruit. Fish smokers continue to cut considerable quantities of wood. Several large storage depots of wood exist in the fishing settlements (Figure 7).
Mangrove wood is an important source of energy and livelihood for coastal communities of West-Central Africa and beyond [57]. According to CAM-ECO [24], the volume of wood used by fish smokers per year is estimated at 10 m3 per year per smoker. The results also revealed that nearly 5670 m3/year of mangrove wood is cut from the Wouri estuary and that 60% of the wood comes from Manoka Island giving an estimate of 3969 m3/year. However, given the fact that a great portion of this wood is exported out of Manoka and sold in Douala, only around 10% i.e., 396.9 m3/year of wood is consumed in Manoka. The demand for fuelwood is high in these fishing camps, while production has dropped considerably due to overexploitation. The exploitation of wood from mangrove forests for use as fuel is a significant factor contributing to deforestation and degradation of mangroves and other forest types [22,58].

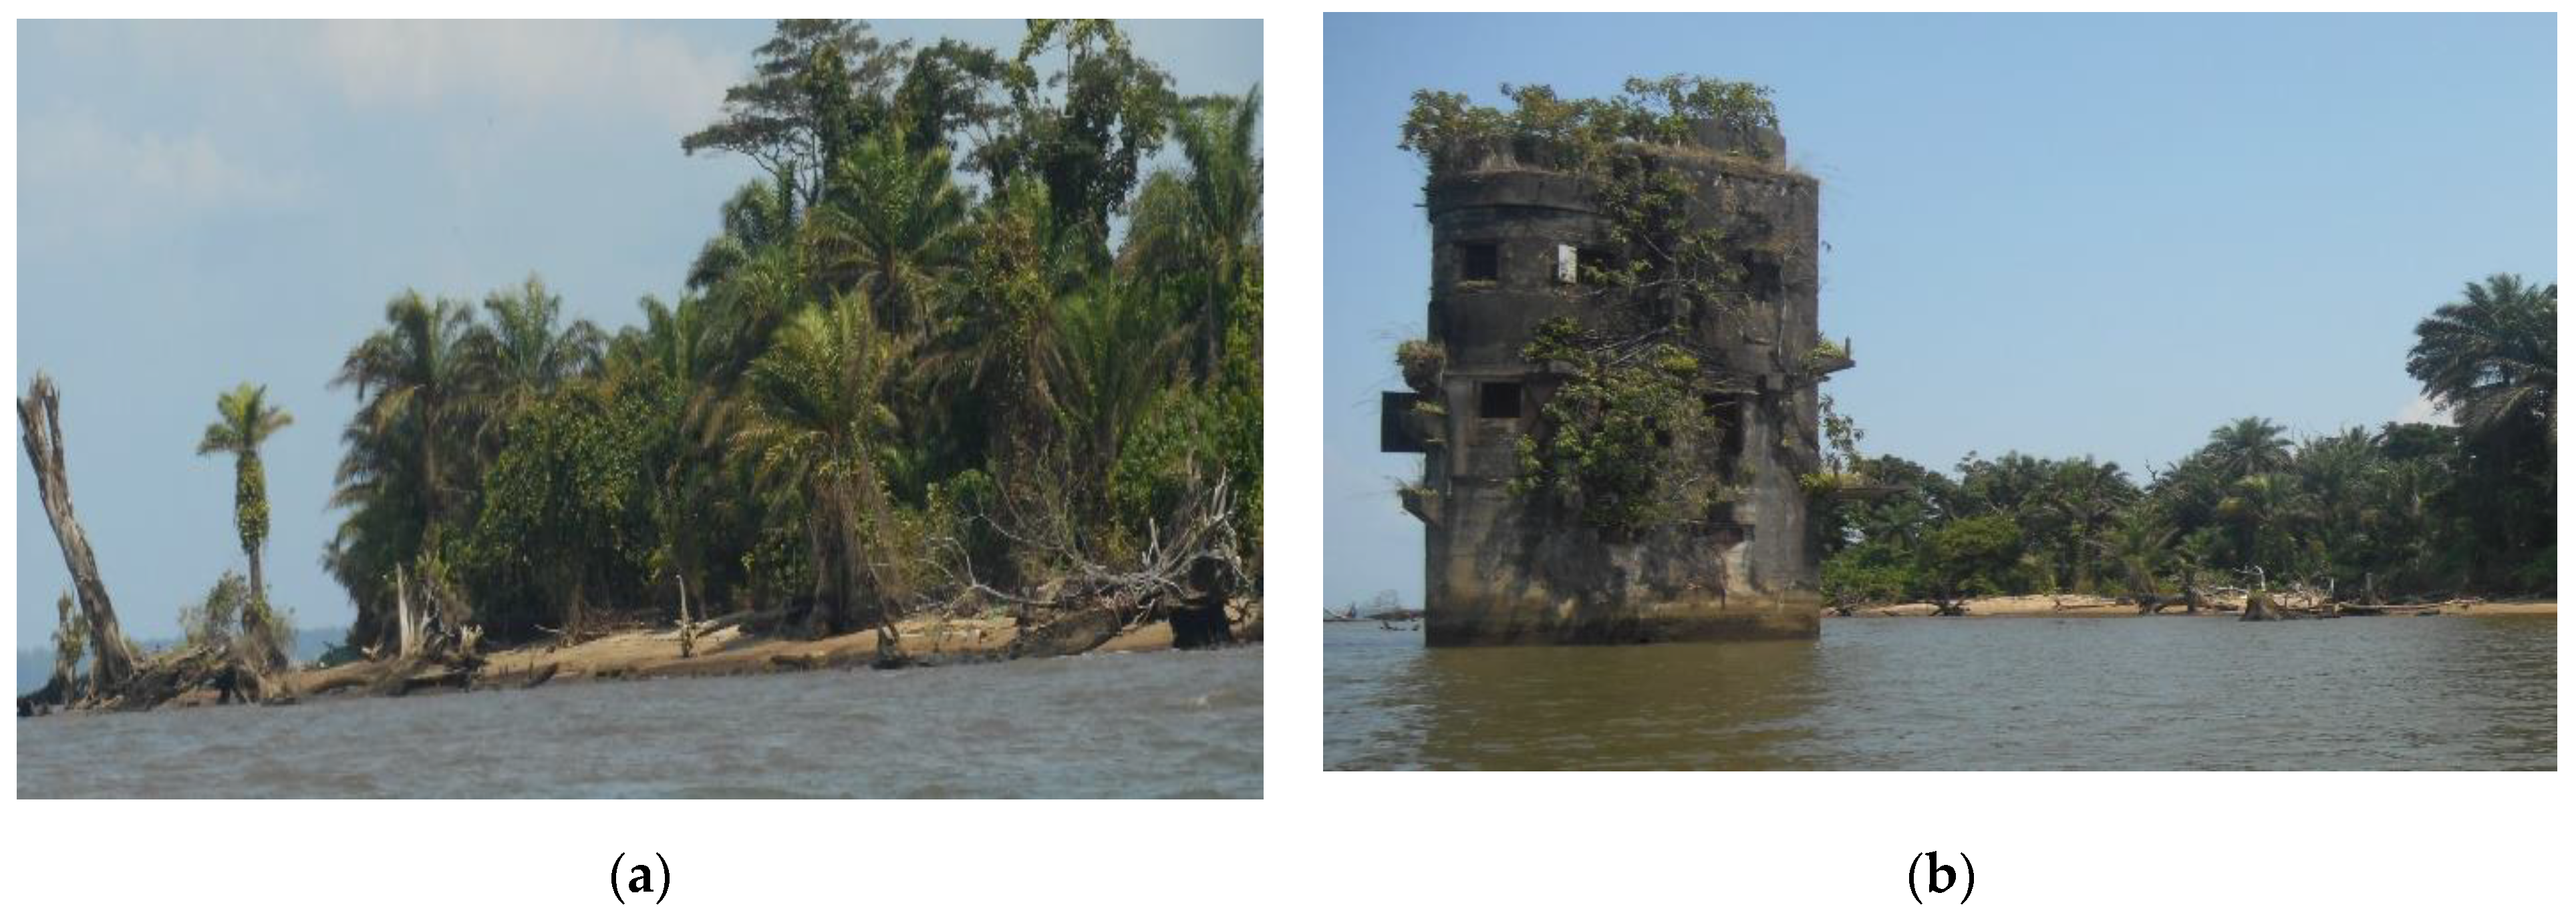
4.1.2. Urban Development and Infrastructure

In this study, our results regarding the dynamics of land use between 1986 and 2018 show strong anthropization in the northern part of the island. Acute urban growth over the last three decades in Cameroon’s cities is an important factor in deforestation and forest degradation. Land use changes linked to urbanization and the construction of infrastructure are one of the driving factors of deforestation on Manoka Island. Douala lies nearby and experiences high urbanization. However, while this may have stifled Manoka’s own urbanization process somewhat, particularly the construction of public buildings and residential housing, settlement areas in the north of Manoka have increased. Indeed, the state has initiated the construction of some appropriate buildings to improve the attractiveness of Manoka city to enhance the proper functioning of its services. In addition, being a gateway to the country, Manoka city is host to one of Cameroon’s military bases, the Rapid Intervention Battalion (BIR), which has numerous installations. This infrastructure, in conjunction with the residential habitat, has increased urban space. The increase in the settlement class, which replaces the undisturbed and degraded forest areas in 2018, confirms this trend toward the conversion of mangroves and inland forests near large cities. Indeed, the evolution of built-up areas clearly allows urbanization to be considered the main factor in the deforestation and land cover change. Several research studies follow the same logic [2,56,59,60,61].

4.1.3. Noncompliance with Forestry Legislation and Uncontrolled Logging

Law No. 94/01 of 20 January 1994 on forestry, wildlife and fishing and Decree No. 95/531/PM of 23 August 1995 setting the terms of application of the forest regime set the framework for forest resources exploitation and the involvement of adjacent populations in management. The absence of Ministry of Forestry and Wildlife (MINFOF) services in the field justify the fact that people cut wood illegally without fear of reprisals. Some drivers of the degradation of mangrove ecosystems in this area are thus due to a lack of supervision by public authorities. In addition, the presence of several nationalities (Cameroonians, Nigerians, Ghanaians, Beninese, etc.) with different issues and perceptions makes it difficult to apply the law and ensure its sustainable management. Numerous illegal logging sites of mangroves have been identified on the island.

4.1.4. Human Pressure Due to Population Growth

Pressure on forests increases with population growth. The need for service and fuel wood, agricultural land, and buildings is at the heart of the multifaceted pressures on forests and land cover change. Population growth appears to be the main factor in the degradation of mangroves [50,56]. On Manoka Island, the population in 1976 was 750 inhabitants but it was 1399 in 2005, while that of the city of Douala increased from 458,426 inhabitants to 1,907,479 inhabitants in the same period [62]. This population growth is the cause of urban sprawl and land cover change. The high rate of population growth on the island, combined with the low income of the population and especially its proximity to the city of Douala significantly contributes to increasing the rate of fuelwood fetching and reduced carbon storage. In Douala, high urban growth has provoked increased demand for firewood, resulting in a reduction in forest cover on the island. In addition, as in many other cities in developing countries, urbanization in the city of Douala is often spontaneous. The absence of a policy around occupying space pushes people to destroy mangroves to build houses, even when they are regularly victims of flooding.

4.1.5. Political and Institutional Factors

The political and institutional factors that affect the degradation of Manoka’s forests are the insufficiency of forest control teams and the difficulties encountered in law enforcement. The forestry law of 1994 (Law No. 94/01 of 20 January 1994 on forestry, wildlife and fishing) seems to ignore the wood-energy sector which constitutes the main factor of forest degradation in fishing camps in the Wouri estuary. There is no law governing the mangrove wood-energy value chain and no regulations exist for forestry taxation in terms of mangrove wood energy.
In addition, Zogning Lontsi et al. [56] think that the main strategies for the sustainable management of Cameroon’s mangrove ecosystems are difficult to apply. This is due to the diversity of actors and decision-makers who are defined as responsible for the management of the canopy (Ministry of Forests and Wildlife, Ministry of the Environment, Nature Protection and Sustainable Development, Ministry of Fisheries and Animal Industries, etc.), who do not always act in concert. The mangrove ecosystem faces conflicts over the attribution of responsibilities, resulting in a lack of supervision by public authorities.

4.1.6. Economic Factors

The main drivers of land use/land cover change are socioeconomic development, population expansion, and pressures for land to be used in agriculture [63]. The development of Manoka Island relies for the most part on extractive activities, the main one being fishing. Diversification activities are mostly focused on mangrove resources. In the Wouri estuary, the trade of mangrove wood now flourishes. In the fishing camps, mangrove wood is cut at an alarming daily rate and in huge quantities to construct plank huts and above all for fuel used in smoking fish. These findings had already prompted Feka [64] to say that, in the coastal communities of West-Central Africa, more than 8 million people depend on fishing and/or fish smoking as a means of livelihood sustenance.
A combination of these factors is at the heart of the diminishing mangrove areas on Manoka Island and this decrease leads to a reduction in carbon storage potential.

4.2. Climatic Implication of Deforestation and Forest Degradation on Manoka Island (Green House Gas Emission and Vulnerability)

Land use changes and the development of numerous human activities on the island have subjected the natural space to a variety of risks which exacerbate the vulnerability of populations to climate change. With deforestation and the degradation of mangroves, the role of a natural green barrier that prevents coastal erosion and limits the propagation of invasive plants is broken. People on the coast of Manoka Island are increasingly exposed to climate change risks such as coastal erosion and flooding. In fact, in the villages of the far north of the island (Nyangadou and Dahomey), coastal erosion is causing considerable damage to buildings and an influx of anthropogenic vegetation. Many villages and camps on Manoka Island are situated on the shoreline with no safe distance between the sea and homes, making them vulnerable to flooding. This exposure combined with coastal erosion aggravates flooding during high tides.
Figure 8a shows an example of the advancement of coastal erosion materialized by the uprooting of trees. Figure 8b shows the current location of a building that was a prison during the German colonial area (1890–1916). Marine waters nowadays surround this building.
The livelihoods of 85% of the population of Manoka Island revolve around fishing, and livelihood diversification is low for households on this island. Deforestation and degradation of mangrove forests thus have a noticeable impact on the livelihoods of populations. In fact, it is the reason for the destruction of spawning grounds and the habitats of coastal and marine fauna. Over time, this reduces resource provision and the means of subsistence of the population.
In the fight against climate change, mangrove forests play a major role. In fact, field observations show that the impacts of climate change such as flooding and heavy coastal erosion are most often observed in places such as Dahomey and Nyangadou where the coastal mangrove strip has been replaced by houses. Forest mangroves play a role in mitigation and adaptation to climate change. Their carbon storage potential is four times greater than that of terrestrial forests per unit area. Deforestation of mangroves not only reduces storage potential but also increases greenhouse gases and reduces the adaptation possibilities of local populations [40]. The conversion of coastal wetlands and mangrove forests limits their capacity to sequester carbon, but for mangrove forests specifically, exposure of their waterlogged soils to the air also oxidizes soil carbon and releases it as CO2 [65]. Globally, the conversion and degradation of these ecosystems emit an estimated 0.15–1.02 GtCO2 annually [66].

4.3. Measures to Reverse the Deforestation and Forest Degradation Trends on the Island

The Government of Cameroon, civil society, and local actors are implementing several initiatives with the aim of reducing pressure and promoting integrated and sustainable management of mangrove forest ecosystems.
The government has upgraded the Douala-Edéa Wildlife Reserve created in 1932 to a National Park and Manoka Island is part of this protected area. The creation of this protected area strengthens the conservation of the resources of this ecosystem and contributes to more participatory management. The project “Sustainable community management and conservation of mangrove ecosystems in Cameroon” (2012–2018) of FAO and its partners (MINEPDED, MINFOF, COMIFAC, Cam-Eco, OPED, and CWCS) have
  • created dialogue and intersectoral coordination platforms for a Sustainable Management of Mangroves and Coastal Ecosystems;
  • developed a specific protocol for environmental and social impact studies;
  • set up a mangrove monitoring system to obtain data with statistical details.
We also note the sensitization of the inhabitants of the targeted communities in the sustainable management of mangroves, and support for the development of income-generating activities with low impact on mangroves (sustainable fishing, improved smoking, shrimp farming, packaging, among others). These initiatives could reduce pressure and fund sustainable management of forest mangroves if they are implemented. They should be strengthened and capitalized on with the consultation of all stakeholders.
At the local level, the actions and initiatives undertaken by civil society organizations and local populations to limit the degradation of mangroves on the island of Manoka have led to the creation of the first community mangrove forest in Cameroon on Manoka Island called “La Mangrove”. Actions such as sensitization to the impacts of forest degradation and monitoring of this forest are carried out by officials of the entity that manages the community forest. Rational and judicious exploitation of these resources will contribute to the improvement of the living conditions of the populations of this community, as well as to the preservation of the forest and wildlife stands of the area.
Efficient energy management through the promotion of economical smokehouses (Figure 9) using little wood has been initiated by CIFOR, Cam-Eco, Tankeu Green Energy and other civil society organizations. It aims to reduce the quantity of wood used to smoke fishery products and thus limit deforestation of mangroves while fighting against climate change.
Participatory mangrove reforestation activities were carried out by the CWCS in degraded mangrove areas of the Douala-Edéa Wildlife Reserve. In Manoka, La Mangrove (community forest association) with the support of Cam-Eco have identified reforestation areas, but they face financial difficulties to implement their activities.

5. Conclusions

The main objective of this article was to map land use on Manoka Island and to identify the drivers of change and avenues for intervention with a view to strengthening climate change mitigation. The methodology used combined documentary research, satellite image processing, GIS, and field work (observation and interviews) in Manoka. The results show that the forests of Manoka Island, like those of the entire Wouri estuary, have been undergoing degradation and deforestation for several decades, leading to a decline in forest area. There was a 4% decrease in forest area between 1986 and 2018. This decrease is linked to fuelwood harvest to meet the needs of the population and forest conversion into settlement areas. Converting mangrove areas to other forms of land use reduces the potential for climate change mitigation and exposes populated areas to the hazards of coastal erosion, flooding, and reduced livelihoods. Various actions aimed at more inclusive management and conservation of this ecosystem have been identified in this study. Different actors are still working in synergy to reverse the current trend of this ecosystem’s degradation.

Author Contributions

C.T.T. and D.J.S. designed the study and the methodology. C.T.T. analyzed the data and prepared the first draft of the manuscript with contributions from D.J.S. and all authors commented on previous versions of the manuscript. All authors have read and agreed to the published version of the manuscript.

Funding

This research was funded by the Center for International Forestry Research (CIFOR) project titled EURU-1613: Governing Multifunctional landscapes in Sub-Saharan Africa: Managing Trade-Offs between Social and Ecological Impacts. (GML) within his component 6.3: Knowledge, policy options and engagement for more sustainable woodfuel value chains”. The analysis of data, paper writing, and publication of this study are also supported by CIFOR project titled USAD-1651: Mainstreaming Wetlands into the Climate Agenda: A multi-level approach (SWAMP-II).

Acknowledgments

The authors wish to acknowledge all the resource persons who provided information for this research. They also thank the staff of Cameroon Ecology (Cam-Eco) for documentation and technical support in the realization of this paper. The three reviewers are thanked for their constructive suggestions during the publication process.

Conflicts of Interest

The funders had no role in the design of the study; in the collection, analyses, or interpretation of data; in the writing of the manuscript, or in the decision to publish the results.

References

  1. IPCC. Climate adaptation and mitigation options. In Climate Change 2007: Synthesis; IPCC; Cambridge University Press: Cambridge, UK, 2007. [Google Scholar]
  2. Obiefuna, J.N.; Okolie, C.J.; Atagbaza, A.O.; Nwilo, P.C.; Akindeju, F.O. Spatio-temporal land cover dynamics and emerging landscape patterns in western part of Lagos State, Nigeria. Environ. Socio-Econ. Stud. 2021, 9, 53–69. [Google Scholar] [CrossRef]
  3. Weng, Q.; Hua, L.; Dengsheng, L. Assessing the effects of land use and land cover patterns on thermal conditions using landscape metrics in city of Indianapolis, United States. Urban Ecosyst. 2007, 10, 203–219. [Google Scholar] [CrossRef]
  4. Amosu, A.O.; Bashorun, O.W.; Babalola, O.O.; Olowu, R.A.; Togunde, K.A. Impact of climate change and anthropogenic activities on renewable coastal resources and biodiversity in Nigeria. J. Ecol. Nat. 2012, 4, 201–211. [Google Scholar] [CrossRef]
  5. United Nations (UN)—Habitat. Urban Development, Biodiversity and Wetland Management—Expert Workshop Report; Expert Workshop, 16–17 November 2009; Kenya Wildlife Service Training Institute: Naivasha, Kenya; Bioscan (UK) Ltd.: Oxford, UK, 2010. [Google Scholar]
  6. Hamilton, S.E.; Casey, D. Creation of a high spatio-temporal resolution global database of continuous mangrove forest cover for the 21st century (CGMFC-21). Glob. Ecol. Biogeogr. 2016, 25, 729–738. [Google Scholar] [CrossRef]
  7. Mafi-Gholami, D.; Zenner, E.K.; Jaafari, A.; Bui, D.T. Spatially explicit predictions of changes in the extent of mangroves of Iran at the end of the 21st century. Estuar. Coast. Shelf Sci. 2020, 237, 106644. [Google Scholar] [CrossRef]
  8. Alongi, D.M. Impact of global change on nutrient dynamics in mangrove forests. Forests 2018, 9, 596. [Google Scholar] [CrossRef] [Green Version]
  9. Mustard, J.; DeFries, R.; Fisher, T.; Moran, E.F. Land use and land cover change pathways and impacts. In Land Change Science: Observing, Monitoring, and Understanding Trajectories of Change on the Earth’s Surface; Cochrane, M.A., Ed.; Springer: Dordrecht, The Netherlands, 2004. [Google Scholar]
  10. Olson, J.M.; Alagarswamy, G.; Andresen, J.A.; Campbell, D.J.; Davis, A.Y.; Ge, J.; Huebner, M.; Lofgren, B.M.; Lusch, D.P.; Moore, N.J.; et al. Integrating diverse methods to understand climate and interactions in East Africa. Geoforum 2008, 39, 898–911. [Google Scholar] [CrossRef]
  11. Etemadi, H.; Smoak, J.M.; Karami, J. Land use change assessment in coastal mangrove forests of Iran utilizing satellite imagery and CA–Markov algorithms to monitor and predict future change. Environ. Earth Sci. 2018, 77, 208. [Google Scholar] [CrossRef]
  12. Breithaupt, J.L.; Hurst, N.; Steinmuller, H.E.; Duga, E.; Smoak, J.M.; Kominoski, J.S.; Chambers, L.G. Biogeo-chemical impacts of storm surge sediments in coastal wetlands: Hurricane Irma and the Florida Everglades. Estuaries Coast. 2019, 43, 1090–1103. [Google Scholar] [CrossRef]
  13. Sanders, C.J.; Maher, D.T.; Tait, D.R.; Williams, D.; Holloway, C.; Sippo, J.Z.; Santos, I.R. Are global mangrove carbon stocks driven by rainfall? J. Geophys. Res. Biogeosci. 2016, 121, 2600–2609. [Google Scholar] [CrossRef]
  14. Smoak, J.M.; Breithaupt, J.L.; Smith, T.J.; Sanders, C.J. Sediment accretion and organic carbon burial relative to sea-level rise and storm events in two mangrove forests in Everglades National Park. Catena 2013, 104, 58–66. [Google Scholar] [CrossRef]
  15. Sato, I.; Langer, P.; Stolle, F. Enhancing NDCs: Opportunities in the Forest and Land-Use Sector. 2019. Available online: https://www.wri.org/research/ndc-enhancement-opportunities-forest-and-land-use-sector (accessed on 21 February 2022).
  16. Boehm, S.; Lebling, K.; Levin, K.; Fekete, H.; Jaeger, J.; Waite, R.; Nilsson, A.; Thwaites, J.; Wilson, R.; Geiges, A.; et al. State of Climate Action 2021: Systems Transformations Required to Limit Global Warming to 1.5 °C; World Resources Institute: Washington, DC, USA, 2021. [Google Scholar] [CrossRef]
  17. Murdiyarso, D.; Purbopuspito, J.; Kauffman, J.B.; Warren, M.W.; Sasmito, S.D.; Donato, D.C.; Manuri, S.; Krisnawati, H.; Taberima, S.; Kurnianto, S. The potential of Indonesian mangrove forests for global climate change mitigation. Nat. Clim. Chang. 2015, 5, 1089–1092. [Google Scholar] [CrossRef]
  18. UNEP. Mangroves of Western and Central Africa; UNEP-Regional Seas Programme/UNEP–WCMC, 2007; p. 88. Available online: https://books.google.cm/books?id=xdrMCcDQaaoC (accessed on 21 February 2022).
  19. MINEPDED. Les Mangroves du Cameroun: État des Lieux et Gestion, 2nd ed.; MINEPDED, 2018; 234p, Available online: https://cm.chm-cbd.net/la-biodiversite-au-cameroun/ecosystemes/ecosysteme-marin-et-cotier/mangrove/les-mangroves-au-cameroun-etat-des-lieux-et-gestion-2nde-edition/download/fr/1/Rapport%20Etat%20des%20lieux%20mangroves%20%20%20%20%20%20Cameroun_Final%20Report_OK-2-R.pdf?action=view (accessed on 21 February 2022).
  20. MINEPDED-RCM. Les Mangroves du Cameroun: État de Lieux et Gestion; MINEPDED-RCM: Cameroun, 2017; 191p, Available online: https://www.cbd.int/doc/c/a797/8a83/de47bf12e80acf95e215e96b/soiws-2018-01-rapport-etat-fr.pdf (accessed on 21 February 2022).
  21. Hamilton, L.S.; Snedaker, S.C. (Eds.) Handbook for Mangrove Area Management; UNEP/East West Centre Environment and Policy Institute: Gland, Switzerland; Honolulu, HI, USA, 1984; Available online: https://wedocs.unep.org/20.500.11822/29409 (accessed on 21 February 2022).
  22. Dahdouh–Guebas, F.; Mathenge, J.; Kairo, J.; Koedem, N. Utilization of mangrove wood products around Mida Creek (Kenya) amongst subsistence and commercial users. Econ. Bot. 2000, 54, 513–527. [Google Scholar] [CrossRef]
  23. IPCC; Shukla, P.R.; Skea, J.; Buendia, E.C.; Masson-Delmotte, V.; Pörtner, H.-O.; Roberts, D.C.; Zhai, P.; Slade, R.; Connors, S.; et al. Climate Change and Land: An IPCC Special Report on Climate Change, Desertification, Land Degradation, Sustainable Land Management, Food Security, and Greenhouse Gas Fluxes in Terrestrial Ecosystems; IPCC: Geneva, Switzerland, 2019; Available online: https://www.ipcc.ch/srccl/ (accessed on 26 March 2022).
  24. CAM-ECO. Rapport de L’étude de Base sur L’utilisation du Bois Énergie de Mangrove; CAM-ECO: Edéa, Cameroon, 2019; 59p. [Google Scholar]
  25. Tatuebu Tagne, C. Cartographie de L’occupation/Utilisation des sols en vue de Réduire L’empreinte Carbone du Combustible Énergie sur l’île de Manoka (Cameroun); Rapport D’étude; CIFOR: Yaounde, Cameroon, 2020; 54p. [Google Scholar]
  26. Yagoub, Y.E.; Bo, Z.; Ding-min, J.; Jahelnabi, A.E.; Fadoul, S.M. Land Use and Land cover change in Northeast Gadarif State: Case of El Rawashda Forest, Sudan. J. Geogr. Inf. Syst. 2015, 7, 140–157. [Google Scholar] [CrossRef] [Green Version]
  27. Mbevo Fendoung, P. Vulnérabilité et adaptation des populations de cap Cameroun aux risques naturels. In Construire la Ville Portuaire de Demain en Afrique Atlantique; Tchindjang, M., Steck, B., Bopda, A., Eds.; EMS: Havre, France, 2019; pp. 583–625. Available online: http://hdl.handle.net/2268/236530 (accessed on 9 January 2022).
  28. Tiako Tchanga, A. Caractérisation des Paysages de Mangroves de L’estuaire du Wouri et suivi de Leur Dynamique de 1986 à 2016. Master’s Thesis, Professionnel en Cartographie, Télédétection et SIG, Département de géographie, Université de Yaoundé, Yaoundé, Cameroon, 2019; 103p. [Google Scholar]
  29. Jensen, J.R. Remote Sensing of the Environment: An Earth Resource Perspective, 2nd ed.; Pearson Prentice Hall: Upper Saddle River, NJ, USA, 2007. [Google Scholar]
  30. Olaleye, J.B.; Abiodun, O.E.; Igbokwe, Q.C. Land Use Change Detection and Analysis Using Remotely Sensed Data in Lekki Peninsula Area of Lagos Nigeria. TS8B. SIM in Planning and Development, FIG Working Week 2009. Surveyors Key Role in Accelerated Development, Eliat, Israel, 3–8 May 2009. Available online: www.fig.net/pub/fig2009/papers/ts08b (accessed on 26 March 2022).
  31. Klemas, V. Remote Sensing Techniques for Studying Coastal Ecosystems: An Overview. J. Coast. Res. 2011, 27, 2–17. [Google Scholar]
  32. Howard, J.; Hoyt, S.; Isensee, K.; Pidgeon, E.; Telszewski, M. (Eds.) Coastal Blue Carbon: Methods for Assessing Carbon Stocks and Emissions Factors in Mangroves, Tidal Salt Marshes, and Seagrass Meadows; Conservation International, Intergovernmental Oceanographic Commission of UNESCO, International Union for Conservation of Nature: Arlington, VA, USA, 2014; 184p. [Google Scholar]
  33. Fossi Fotsi, Y.; Pouvreau, N.; Brenon, I.; Onguene, R.; Etame, J. Evolution du trait de côte de la façade sud de l’ile de Cap Cameroun dans l’estuaire du Wouri (Cameroun). In Proceedings of the Atelier Climat et Impacts à l’Université de Paris-Sud (Orsay), Paris, France, 29–30 November 2018. [Google Scholar]
  34. Dzalla Ngangué, G.C. Mangrove de L’estuaire du Wouri: Enjeux de L’anthropisation D’un Écosystème Humide Tropical et Impacts Environnementaux. Ph.D. Thesis, Université de Douala, Douala, Cameroon, 2013; 446p. [Google Scholar]
  35. CAM-ECO. Rapport des Enquêtes Socio-Économiques et Environnementales Réalisées dans la Foret Communautaire de Mangroves de Manoka; CAM-ECO: Douala Edéa, Cameroun, 2016; 27p. [Google Scholar]
  36. Molua, E.L. Accommodation of Climate Change in Coastal Areas of Cameroon: Selection of Household-Level Protection Options. Mitig. Adapt. Strateg. Glob. Chang. 2009, 14, 721. [Google Scholar] [CrossRef]
  37. Fongnzossie, F.E.; Sonwa, D.J.; Kemeuze, V.; Mengelt, C. Assessing climate change vulnerability and local adaptation strategies in adjacent communities of the Kribi-Campo coastal ecosystems, South Cameroon. Urban Clim. 2018, 24, 1037–1051. [Google Scholar]
  38. Mbevo Fendoung, P. Analyse de la Vulnérabilité et des Stratégies D’adaptation aux Changements Climatiques en zone Côtière Camerounaise: Cas de Cap Cameroun Dans L’arrondissement de Douala 6e mémoire. Master’s Thesis, University Yaoundé, Yaoundé, Cameroon, 2016; 173p. [Google Scholar]
  39. Mbevo Fendoung, P. Gestion des Risques Naturels sur le Littoral Camerounais: Cas de L’érosion Côtière à Cap Cameroun et à Kribi. Master’s Thesis, Spécialisation en Gestion des Risques et Catastrophes, Université de Liège/Belgique, Liège, Belgique, 2019; 119p. [Google Scholar]
  40. Murdiyarso, D.; Sasmito, S.D.; Sillanpää, M.; MacKenzie, R.; Gaveau, D. Mangrove selective logging sustains biomass carbon recovery, soil carbon, and sediment. Sci. Rep. 2021, 11, 12325. [Google Scholar] [CrossRef]
  41. Tsayem Demaze, M. Caractérisation et Suivi de la Déforestation en Milieu Tropical par Télédétection. Application aux Défrichements Agricoles en Guyane Française et au Brésil. Ph.D. Thesis, Université d’Orléans, New Orleans, France, 2002; 242p. [Google Scholar]
  42. Spalding, M.; Blasco, F.; Field, C. World Mangrove Atlas; The International Society for Mangrove Ecosystems: Okinawa, Japan, 1997; p. 178. [Google Scholar]
  43. Giri, C.; Ochieng, E.; Tieszen, L.; Zhu, Z.; Singh, A.; Loveland, T.; Masek, J.; Duke, N. Status and distribution of mangrove forests of the world using earth observation satellite data. Glob. Ecol. Biogeogr. 2011, 20, 154–159. [Google Scholar] [CrossRef]
  44. Pham, T.D.; Xia, J.; Ha, N.T.; Bui, D.T.; Le, N.N.; Tekeuchi, W. A review of remote sensing approaches for monitoring blue carbon ecosystems: Mangroves, seagrasses and salt marshes during 2010–2018. Sensors 2019, 19, 1933. [Google Scholar] [CrossRef] [Green Version]
  45. Etemadi, H.; Smoak, J.M.; Abbasi, E. Spatiotemporal pattern of degradation in arid mangrove forests of the Northern Persian Gulf. Oceanologia 2021, 63, 99–114. [Google Scholar] [CrossRef]
  46. Patakamuri, S.K.; Agrawal, S.; Krishnaveni, M. Time-series analysis of MODIS NDVI data along with ancillary data for land use/land cover mapping of Uttarakhand. Int. Arch. Photogramm. Remote Sens. Spat. Inf. Sci.-ISPRS Arch. 2014, 40, 1491–1500. [Google Scholar] [CrossRef] [Green Version]
  47. Chesneau, C. Éléments de Classification; Université de Caen, 2016; p. 81. Available online: https://cel.archives-ouvertes.fr/cel-01252973 (accessed on 21 February 2022).
  48. Jones, T.G.; Ratsimba, H.R.; Ravaoarinorotsihoarana, L.; Glass, L.; Benson, L.; Teoh, M.; Carro, A.; Cripps, G.; Giri, C.; Gandhi, S.; et al. The dynamics, ecological variability and estimated carbon stocks of mangroves in Mahajamba Bay, Madagascar. J. Mar. Sci. Eng. 2015, 3, 793–820. [Google Scholar] [CrossRef] [Green Version]
  49. Ajonina, G.N.; Kairo, J.; Grimsditch, G.; Sembres, T.; Chuyong, G.; Diyouke, E. Assessment of mangrove carbon stocks in Cameroon, Gabon, the Republic of Congo (RoC) and the Democratic Republic of Congo (DRC) including their potential for reducing emissions from deforestation and forest degradation (REDD+). In The Land/Ocean Interactions in the Coastal Zone of West and Central Africa; Springer: Dordrecht, The Netherlands, 2014; pp. 177–189. [Google Scholar]
  50. Fousseni, F.; Andrianamenoso, R.M.; Kperkouma, W.; Agbelessessi, W.Y.; Madjouma, K.; Hodabalo, P.; Aniko, P.-A.; Komlan, B.; Koffi, A. Écologie et dynamique spatio-temporelle des mangroves au Togo. VertigO 2017, 17, 3. [Google Scholar] [CrossRef]
  51. Ajonina, G.; Kairo, J.G.; Grimsditch, G.; Sembres, T.; Chuyong, G.; Mibog, D.E.; Nyambane, A.; FitzGerald, C. Carbon Pools and Multiple Benefits of Mangroves in Central Africa: Assessment for REDD+; 2014; 72p, Available online: https://www.uncclearn.org/wp-content/uploads/library/reddcarbon_lowres_954607.pdf (accessed on 21 February 2022).
  52. Ngoufo, R.; Zapfack, L.; Tiomo Dongfack, E.; Tsafack Ngoufo, L.; Matsaguim Guimdo, C. Évaluation et spatialisation du carbone stocké dans le massif forestier de Ngog-Mapubi (Cameroun). In Proceedings of the Conférence OSFACO: Des images Satellites pour la Gestion Durable des Territoires en Afrique, Cotonou, Bénin, 13–15 March 2019. [Google Scholar]
  53. Nasi, R.; Mayaux, P.; Devers, D.; Bayol, N.E.; Mugnier, A.; Cassagne, B.; Billand, A.; Sonwa, D.J. Un aperçu des stocks de carbone et leurs variations dans les forêts du bassin du Congo. In Les forêts du bassin du Congo: État des forêts 2008; De Wasseige, C., Devers, D., de Marcken, P., Eba’a Atyi, R., Nasi, R., Mayaux, P., Eds.; Office des Publications de l’Union Européenne: Luxembourg, 2009; pp. 199–216. Available online: https://www.cifor.org/knowledge/publication/2888 (accessed on 21 February 2022).
  54. Feka, N.Z.; Chuyong, G.B.; Ajonina, G.N. Sustainable utilization of mangroves using improved fish smoking systems: A management perspective from the Douala-Edea wildlife reserve, Cameroon. Trop. Conserv. Sci. 2009, 2, 450–468. [Google Scholar] [CrossRef] [Green Version]
  55. Din, N.; Saenger, P.; Priso, R.J.; Siegfried, D.D.; Blasco, F. Logging activities in mangrove forests: A case study of Douala Cameroon. Afr. J. Environ. Sci. Technol. 2008, 2, 22–30. [Google Scholar]
  56. Zogning Lontsi, F.R.; Tchawa, P.; Happy, J.Y. Mangrove dynamics near Douala International Airport (Cameroon Coastal). Open Access Libr. J. 2021, 8, e8184. [Google Scholar] [CrossRef]
  57. Diop, S. (Ed.) Conservation and Sustainable Utilization of Mangrove Forests in Latin America and Africa Regions; Mangrove Ecosystems Technical Report 3. Part II Africa; ISME/UNESCO: Paris, France, 1993. [Google Scholar]
  58. Gabche, C.E. An Appraisal of Fisheries Activities and Evaluation of Economic Potentials of the Fish Trade in the Douala-Edea Reserve, Cameroon; Cameroon Wildlife Conservation Society: Yaoundé, Cameroon, 1997. [Google Scholar]
  59. Bassene, A.O.; Cubizolle, H.; Cormier-Salem, M.C.; Boubou, A.S. L’impact des changements démographiques et socio-économiques sur la perception et la gestion de la mangrove en basse Casamance (Sénégal). Géocarrefour 2013, 88, 299–315. [Google Scholar] [CrossRef]
  60. Orekan, V.; Plagbeto, H.; Edea, E.; Sossou, M. Évolution Actuelle des Écosystèmes de Mangrove Dans le Littoral Béninois; HAL: 2019; 16p. Available online: https://archives-ouvertes.fr/ (accessed on 27 March 2022).
  61. Kana, C.E.; Chrétien, N.; Alexandra, C.T.T.; René, B.J.T. Potentiel de l’imagerie multi-capteur dans le suivi des mangroves de l’estuaire du Wouri-Cameroun. In Proceedings of the Conférence OSFACO: Des Images Satellites Pour la Gestion Durable des Territoires en Afrique, Cotonou, Benin, 13–15 March 2019; 25p. [Google Scholar]
  62. BUCREP. Troisième Recensement Général de la Population: Rapport de Présentation des Résultats Définitifs; BUCREP: Yaoundé, Cameroon, 2005; 65p. [Google Scholar]
  63. Lambin, E.; Geist, H.; Lepers, E. Dynamics of land-use and land-cover change in tropical regions. Annu. Rev. Environ. Resour. 2003, 28, 205–241. [Google Scholar] [CrossRef] [Green Version]
  64. Feka, N.Z. Socio-Economic and Cultural Benefits of Coastal Habitats and Marine Protected Areas in West-Central Africa; UNEP-WCMC, Biodiversity Chevening Programme Protected Areas Unit: Cambridge, UK, 2007. [Google Scholar]
  65. Hiraishi, T.; Krug, T.; Tanabe, K.; Srivastava, N.; Jamsranjav, B.; Fukuda, M.; Troxler, T. (Eds.) 2013 Supplement to the 2006 IPCC Guidelines for National Greenhouse Gas Inventories: Wetlands—Methodological Guidance on Lands with Wet and Drained Soils, and Constructed Wetlands for Wastewater Treatment; Intergovernmental Panel on Climate Change: Geneva, Switzerland, 2014; Available online: https://www.ipcc.ch/publication/2013-supplement-to-the-2006-ipcc-guidelines-fornational-greenhouse-gas-inventories-wetlands/ (accessed on 28 March 2022).
  66. Pendleton, L.; Donato, D.C.; Murray, B.C.; Crooks, S.; Jenkins, W.A.; Sifleet, S.; Craft, C.; Fourqurean, J.W.; Kauffman, J.B.; Marba, N.; et al. Estimating Global ‘Blue Carbon’ Emissions from Conversion and Degradation of Vegetated Coastal Ecosystems. PLoS ONE 2012, 7, e43542. [Google Scholar] [CrossRef] [Green Version]
Figure 1. Location of Manoka Island.
Sustainability 14 06301 g001
Figure 2. Overview of Landsat images used.
Sustainability 14 06301 g002
Figure 3. Segment comparison showing the color composition of the Landsat image and the HRS image.
Sustainability 14 06301 g003
Figure 4. Overview of the verification/validation tracking segments of the classification.
Sustainability 14 06301 g004
Figure 5. Spatiotemporal dynamics of land use on Manoka Island (1986–2018).
Sustainability 14 06301 g005
Figure 6. Land use class dynamics between 1986 and 2018.
Sustainability 14 06301 g006
Figure 7. Collection of poles for smoking fish. (Photos by Tatuebu, 2019). Photo (a): mangrove wood piles used to smoke fish during the fishing season. Photo (b): illegal timber harvesting in Epassi.
Sustainability 14 06301 g007
Figure 8. Coastal erosion after mangrove loss in Dahomey. (Photos by Tatuebu, 2019). Photo (a) shows an overview of the advancement of coastal erosion materialized with the uprooting of trees. Photo (b) shows the current location of the building which was the prison during the German colonial area (1890–1916).
Sustainability 14 06301 g008
Figure 9. Improved smokehouses developed by CIFOR, Cam-Eco, the University of Douala and Tankeu Green Energy. (Photos by Tatuebu, 2019). Photo (a) shows the improved smokehouse made up of blocks. Photo (b) shows a woman fish smoker in Manoka using the smokehouse made up of blocks. Photo (c) shows the smokehouse made up of metal.
Sustainability 14 06301 g009
Table 1. Characteristics of Landsat images used in monitoring land use dynamics.
ID ScenesSatellite SensorAltitudeSpatial
Resolution
Number of Bands Cloud Cover LevelDate
L11XXX1173032090101_HDF. 181171701MSS705 km60 m4Medium1 February 1973
LT05_L1TP_186057_19861221_ 20170215_01_T1TM705 km30 m6Low21 December 1986
LE07_L1TP_186057_19991217_
20170215_01_T1
ETM+705 km30 m7Medium17 December 1999
LC81860572013109LGN01OLI705 km30 m7Medium6 March 2013
LC08_L1TP_187057_20181220_
20181227_01_T1
OLI705 km30 m7Low20 December 2018
Table 2. Typology of landscape elements drawn from the analysis of satellite images between 1986 and 2018.
Occupancy ClassField OverviewImage PreviewCoordinates
Undisturbed mangrove Sustainability 14 06301 i001 Sustainability 14 06301 i002Lat: 3°49′19′′
Long: 9°36′11′′
Degraded mangrove Sustainability 14 06301 i003 Sustainability 14 06301 i004Lat: 3°51′51′′
Long: 9°37′29′′
Settlement Sustainability 14 06301 i005 Sustainability 14 06301 i006Lat: 3°51′41′′
Long: 9°38′02′′
Bare surface Sustainability 14 06301 i007 Sustainability 14 06301 i008Lat: 3°52′04′′
Long: 9°37′18′′
Inland forest Sustainability 14 06301 i009 Sustainability 14 06301 i010Lat: 3°50′45′′
Long: 9°36′34′′
Water Sustainability 14 06301 i011 Sustainability 14 06301 i012Lat: 3°51′33′′
Long: 9°38′26′′
Table 3. Summary of the detailed image classification of Manoka.
Classification AccuracyKappa IndexClass with More Errors
198692.90%0.89Mangrove, water
199998.82%0.98Inland forest, mangrove
201398.98%0.98Settlement, degraded forest
201899.15%0.98Settlement, degraded forest, bare surface
Table 4. Land use type and emission factors.
Forest TypeLand Use Type Emission Factors
(Aboveground Live Biomass) tc/ha
Sources
Mangrove forestGreatly exploited41.60[19,51]
Moderately exploited126.24
Undisturbed557.3
Inland forest Greatly exploited85.38[52,53]
Moderately exploited89.86
Undisturbed 164.20
Table 5. Land cover and land uses on Manoka Island in December 2018.
Class NameArea (Ha)Percentage (%)
Bare surface39.380.3658668
Degraded inland forest101.440.94244612
Degraded mangrove442.114.10750055
Settlement90.470.84052741
Undisturbed inland forest3814.8535.4425335
Undisturbed mangrove5740.4853.3329369
Water534.754.96818873
Total10,763.48100
Table 6. Change matrix of land use in Manoka Island from 1986 to 2018 (ha).
1986Bare SurfaceDegraded
Inland Forest
Degraded MangroveSettlementUndisturbed Inland ForestUndisturbed MangroveWaterTotal Total (%)
2018
Bare surface0.71 1.44 0.6336.639.380.36
Degraded inland forest0.0917.65 3.4380.18 0.09101.440.94
Degraded
mangrove
6.53 77.0610.234.56270.2873.45442.114.10
Settlement2.2421.7717.81.2631.578.37.5390.470.84
Undisturbed
inland forest
0.274.26 3810.32 3814.8535.44
Undisturbed mangrove0.27 4.41 5648.6587.155740.4853.33
Water0.45 3.260.09 79.84451.11534.754.96
Total 10.5643.68103.9715.013926.636007.7655.9310,763.48
Total (%)0.0980.400.960.1336.4855.816.09 100
Table 7. Carbon stock and flux between 1986 and 2018 on Manoka Island (Cameroon).
Forest TypeLand Use Type Emission Factors (Aboveground Live Biomass) tc/haArea 1986 (ha)Carbon Stock (tc) in 1986Area 2018 (ha)Carbon Stock (tc) in 2018Carbon Stock, Difference between 1986 and 2018 (tc)
Mangrove forestModerately exploited126.24103.9713,125.172442.1155,811.96
Undisturbed557.36007.73,347,701.15740.483,199,169.50
Inland forest Intensely
exploited
85.3843.683729.40101.448660.94
Moderately exploited89.86 //
Undisturbed 164.203926.63644,752.643814.85626,398.37
Total 4,009,308.319645.143,890,040.77−119,267.54
Legend of the table: activity data are from the current study. Sources of emission factor: Ajonina et al. [51], Ngoufo et al. [52], Nasi et al. [53].
Publisher’s Note: MDPI stays neutral with regard to jurisdictional claims in published maps and institutional affiliations.

