Article

Quantitative Study on Road Traffic Environment Complexity under Car-Following Condition

1
Transportation College, Jilin University, Changchun 130022, China
2
China FAW Group Corporation Co., Ltd., No. 1, Honaqi Street, Changchun 130013, China
*
Author to whom correspondence should be addressed.
Sustainability 2022, 14(10), 6251; https://doi.org/10.3390/su14106251
Submission received: 14 April 2022 / Revised: 18 May 2022 / Accepted: 19 May 2022 / Published: 20 May 2022

Abstract

:
With the development of the drive of electronic communication technology, the driving assistance system that perceives the external traffic environment has developed rapidly. However, when quantifying the complexity of the road traffic environment without fully considering the driving characteristics and subjective feelings, the false alarm rate of the driving warning system increases and affects the early warning effect. In order to more accurately quantify the complexity of the road traffic environment, we analyzed the impact of road traffic environment changes on drivers under the condition of car-following. Firstly, we selected the influencing factors of the traffic environment complexity, such as the driving operation indicators, the vehicle driving status indicators and the road environmental indicators. The weight calculation model of each influence factor is established based on the principal component analysis method. Secondly, the driver’s reaction time during car-following is used as the quantitative index of road traffic environment complexity. The quantitative model of road traffic environment complexity is constructed combined with the weight of road traffic environment complexity. Finally, the driving simulation experiment is designed to verify the complexity quantification model of the road traffic environment. The road traffic environment complexity value calculated in our study is better than the TTC, and the early-warning threshold is raised by 2–5%. The research conclusion can provide a basis for the design of the car alarm system.

1. Introduction

1.1. Background

The traffic environment of urban roads is particularly complex. Drivers driving on the road are vulnerable to the complex road traffic environment, therefore, interfering with their control of vehicles, and have road traffic safety risks [1]. There are several driving states of vehicles on the road, which are car-following, overtaking, lane change and turning. The car-following behavior is a common state of vehicles in urban roads [2]. In the process of driving on the road, the driving behavior of the rear vehicle following the adjacent front vehicle in the lane and restricted by the front vehicle is called car-following behavior. In the process of car-following, vehicles show restraint, delay and transmission [3]. Once the front car brakes and decelerates, the rear car follows too fast or the following distance is too small to make a timely response to complete the braking measures, and the rear-end accident will occur [4].
With the continuous development of computer technology and electronic information technology, a driving assistance system that perceives the external traffic environment and provides early warning information to drivers has gradually become an important part of vehicle active safety technology [5]. However, due to the current driver assistance systems’ failure to fully consider the factors affecting the complexity of the road traffic environment, as well as the driver’s driving behavior in different complex road traffic environments, inaccurate quantification of the complexity of the traffic environment results, thereby increasing the false alarm rate of the early warning system [6]; excessive dependence by some drivers on the driver assistance system leads to delayed response [7]. Therefore, we study the complexity of the road traffic environment in the car-following scenario, and analyze the influence of the road traffic environment in different complex situations on drivers. Study results provide theoretical support for the development of the driving warning system.
At present, there are many target detection technologies and algorithms for the road traffic environment. Vehicle peripheral data are acquired by lidar and target detection by Monte Carlo method [8]. Target recognition in the traffic environment is achieved by dual-mode image quality aware deep neural network based on image RGB and laser radar sensing data [9]. Target recognition in the road traffic environment is based on video target detection technology YOLOv4 and improved recognition accuracy by cutting-edge network model [10]. In our study, YOLOv5 is selected for target detection of the road traffic environment, and the target object data are extracted through the target object feature RGB.

1.2. Literature Review

1.2.1. Influence of Road Traffic Environment on Drivers

The road traffic environment is the sum of all external influences and forces acting on road traffic participants, including road conditions, transport facilities, topography, weather conditions and other traffic participants in traffic activities [11]. There are two main research methods for measuring the influence of the road traffic environment on drivers. One is driving simulation research, and the other is real vehicle test research [12]. The driver obtains the road traffic environment information mainly through vision during driving. Visual behavior is the external manifestation of the driver’s selective attention and processing of road traffic environment information. The influence of the road traffic environment on the driver can be analyzed by analyzing the driver’s pupil diameter, blink frequency and annotation time [13,14,15,16,17]. Different road traffic environments have different degrees of influence on drivers. Some scholars have conducted relevant studies using cardiovascular system indicators, and used heart rate growth rate and heart rate variability (HRV) indicators to characterize the degree of influence on drivers [18,19,20]. Some scholars studied the colors of the road traffic landscape, and analyzed the influence of RGB change of the road landscape on drivers [21,22]. Some scholars use the concept of information entropy to establish a complexity index to measure the driver’s perception of the driving environment. The results show that the complexity index is a qualitative index that can truly reflect the driver’s perception of the driving environment, and can be used as a supplement to traditional traffic measures [23]. Some scholars have designed driver distraction driving tests under different complex traffic environments, and established risk identification models through reasonable traffic environment data and driving data. The results show that when the complexity of the traffic environment is high, some vehicle information systems need to be prohibited [24]. We selected target recognition and image processing to extract road traffic environmental factors, and built a link between road traffic environmental factors and driver response to analyze the impact of the road traffic environment on drivers.

1.2.2. Influence of Car-Following on Drivers

The research on the influence of car-following driving on drivers mainly focuses on the driving state of car-following vehicles, driver’s vehicle control and driver’s physiological data. The selected indicators are vehicle speed, vehicle distance, steering wheel operation, brake pedal treading frequency, fixation time, skin electricity, electrical activity of heart, etc. [25,26,27]. The driver’s interference in the car-following stage will lead to lane departure, that is, the greater the interference is, the greater the accident risk caused by lane departure is [28]. In the process of car-following, when the driver is affected by the front car, he will take the way of frequent operation of throttle, brake pedal and increasing the braking amplitude to compensate for the impact of interference. The compensation behavior increases with the increase of interference, which is an overcompensation behavior, leading to the decrease of vehicle longitudinal position fluctuation and the improvement of vehicle longitudinal lane keeping safety [29].

1.3. Study Aim

In order to quantify the complexity of the road traffic environment caused by vehicle state and road environment to drivers in car-following scenarios, this paper firstly constructs the weight calculation model of influencing factors of the road traffic environment complexity under car-following condition based on principal component analysis. Secondly, combined with the improved car-following model and the weight of road traffic environment factors, the road traffic environment complexity model is constructed. Finally, the driving simulation test is carried out based on the driving simulator. At the same time, the road traffic environment factors are extracted by YOLOv5 target recognition and image processing. All the obtained data are preprocessed and brought into the model for calculation, and the road environment complexity calculation results are obtained. The model algorithm in our study can quantify the complexity of the road traffic environment in real time according to the real-time changes of the road traffic environment in the process of car-following, and the quantitative results can provide design basis for the development of a vehicle early warning system.

2. Materials and Methods

2.1. Model Construction

The road traffic environment is the sum of all external influences and forces acting on road traffic participants. Complexity is defined as a complex state or an attribute used to describe a complex state. The result of complexity factor interaction is also determined by the degree of complexity factor interaction. The complexity of the road traffic environment is a comprehensive concept. All behaviors of drivers during driving are determined by the road traffic environment, which is limited by the road traffic environment. Most traffic accidents are caused by drivers’ inadaptability to the complexity of the road traffic environment. Therefore, it is very important for drivers to understand their relationship with the complexity of the road traffic environment.
The road traffic environment is divided into four levels, namely, the meaning layer, the movement layer, the physical layer and the landscape layer. The meaning layer includes signs and markings with indicative significance, the motion layer includes vehicles and pedestrians, the physical layer includes road traffic infrastructure and the landscape layer includes trees and sky. For drivers, the area of traffic elements in the driver’s vision is mainly analyzed [30]. In this study, the road traffic environment complexity index selection is divided into three parts, vehicle state parameters, driver operating parameters and road traffic environment parameters. In order to fully consider the model construction of the car-following process, the vehicle state parameters selected are as follows: the vehicle speed, the front vehicle speed and the front and rear vehicle distance [31]. In order to fully consider the driver’s control of the vehicle in the driving process, the driver’s operating parameters are selected as the steering wheel operation volume and throttle opening [32]. In the car-following scene of urban roads, the landscape layer and the physical layer are relatively simple and have little change, thus this paper does not consider them. The meaning layer parameters of road traffic environment select the visual area of road route, speed limit sign and traffic signal lamp. The motion layer parameters of the road traffic environment select the visual area of automobile, bus, pedestrian and bicycle [30].
The road traffic complexity model is divided into two parts, the first one is constructed according to the driving state of the two vehicles in the following lane, parameters selected are X1–X6 in Table 1; the other is constructed according to the change of visual area of other lanes and surrounding road traffic environment, parameters selected are X7–X13 in Table 1.
E = ω 0 E 1 + i = 1 7 ω i E 2 p
where E is the complexity of the road traffic environment, E1 is the complexity caused by the change of the distance between the front and rear vehicles and the driver’s control of the car, E2 is the complexity caused by the change of the surrounding road traffic landscape, ω i is the weight coefficient, calculated by principal component analysis and p i is the extracted pixel area. Among them, ω 0 is the weight of vehicle state and driver operation in the process of following, and ω 1 , , ω 7 is the weight of visual area change of road traffic environmental factors.

2.1.1. Weight Calculation of Road Traffic Environmental Impact Factors

In order to comprehensively consider the impact factors of the road traffic environment, there are many indicators selected in our study, and there is a certain coupling relationship between indicators, and it is difficult to quantify the weight of indicators. In this study, the principal component analysis method is selected to calculate the index weight. The purpose of principal component analysis is to find a small number of factors that can reflect the internal relationship and play a leading role among many variables that are mutually related. Through the study of these factors, not only does it not damage the original information of multiple variables, but it also facilitates their classification and interpretation.
Firstly, the index is standardized. Secondly, the data dimension is reduced by principal component analysis, and the linear correlation principal component load matrix is obtained. Finally, the index weight is calculated according to the load matrix and the principal component contribution rate.
Step 1: Due to the different dimensions of the 13 indicators, the initial indicator data are inconsistent with the content of this study. Therefore, it is necessary to deal with the indicators. Taking the bus pixel area as an example, the larger the bus pixel area, the closer the bus is to the car, the greater the complexity of the road traffic environment generated by the driver, thus the bus pixel area index is smaller and better. The 13 indicators were standardized according to practical significance. The processing is as can be seen below.
The greater the value, the better the indicators are handled as follows:
g ( l ) = 0 l < α l α β α             α l β 1 l > β
where l is the actual index, g(l) is deterioration degree and α , β is the upper and lower limit of the index.
The smaller the value, the better the index is handled as follows:
g ( l ) = 1 l < α β l β α             α l β 0 l > β
For intermediate indicators, the treatment is as follows:
g ( l ) = 1 l < α 1 β 1 l β 1 α 1             α 1 l β 1 0 β 1 l α 2 l α 2 β 2 α 2             α 2 l β 2 1 l > β 2
where the β 2 , α 1 is the upper and lower limit of the index.
Step 2: The driving influence index matrix is standardized.
Assuming that there are m indicators using principal component analysis: x 1 , x 2 , , x m , the data corresponding to the evaluation indicators are n, and the j indicator corresponding to the i data is x i j . Each x i j is transformed into standard indicator x ˜ i j .
s j = 1 n 1 i = 1 n x i j x ¯ i j 2 ,     j = 1 , 2 , , m
x ¯ j = 1 n i = 1 n x i j ,     j = 1 , 2 , , m
x ˜ i j = x i j x ¯ j s j ,     i = 1 , 2 , , n , j = 1 , 2 , m
Step 3: The correlation coefficient matrix of standardized data matrix R = r i j m × m :
r i j = k = 1 n x ˜ k i x ˜ k j n 1 ,     i , j = 1 , 2 , , m
Step 4: Finding the eigenvalues and eigenvectors of correlation coefficient matrix R.
The eigenvalue λ 1 , λ 2 , λ m of the correlation coefficient matrix R is calculated, and according to λ 1 , λ 2 , , λ m and the corresponding eigenvector u 1 , u 2 , u m , m new index variables are composed of eigenvectors:
y 1 = u 11 x ˜ 1 + u 12 x ˜ 2 + + u 1 n x ˜ n y 1 = u 21 x ˜ 1 + u 22 x ˜ 2 + + u 2 n x ˜ n y 1 = u m 1 x ˜ 1 + u m 2 x ˜ 2 + + u m n x ˜ n
The load matrix is W = u i j m × n , y is the cumulative contribution rate. For further calculation, the first load vector w ( 1 ) needs to satisfy:
w ( 1 ) = arg   max w = 1   X w 2   = arg   max w = 1   w T X T X w  
The maximum amount in brackets in the formula is Rayleigh entropy. The corresponding w is the maximum feature vector of X T X .
The matrix can be obtained by subtracting k − 1 principal components from X.
X ^ k = X s = 1 k 1 X w ( s ) w T ( s )
Based on the above calculation process, the optimization problem of principal component calculation of driving influence degree can be expressed as:
max w   F w , λ = max w w T X X T w + λ 1 w T w F w i = 2 X X T w i 2 λ w i = 0   X X T w = λ w
The characteristic roots and eigenvectors can be obtained by solving the above equations, and then the load matrix can be obtained.
Step 5: Index weight is calculated according to load coefficient matrix and cumulative variance percentage.
q i = j = 1 k μ i j s j i = 1 m μ i j j = 1 m s j i = 1 k j = 1 m μ i j s j i = 1 m μ i j j = 1 m s j 1
where m is the number of indicators, k is the number of principal components, u i is the calculated load value, s j is the variance percentage of the eigenvalue of the principal component and qi is the index weight.
Equations (2)–(4) are normalized functions constructed to consider the actual situation of the road traffic environment. Equations (5)–(12) are the main component analysis formulas. Equation (13) is the weight formula calculated according to the load matrix and the contribution rate of principal component.

2.1.2. Construction of Road Traffic Complexity Model under Car-Following

Step 1: The road traffic environment complexity model of the vehicle following in the following lane is constructed.
The concept of model construction is: The model is input to the actual data of the car and the front car at a certain time, such as acceleration, vehicle speed and vehicle distance data. Assuming that the front and rear vehicles maintain this driving state, the vehicle following process is divided into three stages.
In the first stage, the two cars are far away from each other, and the running state of the car is not restricted by the front car. In the second stage, the speed of the self-propelled vehicle is greater than that of the front vehicle, and the distance between the front and rear vehicles is gradually shortened. When the distance between the two vehicles reaches the shortest safe distance, the self-propelled vehicle brakes at the maximum braking deceleration. In the third stage, after deceleration, the speed of the two cars is equal, and the deceleration of the car is greater than that of the front car. At this time, the two cars will not collide. The following scene of the three stages is shown in Figure 1.
In the figure, μ g is the maximum braking deceleration, D is the distance between the car and the front car when the car starts braking and d is the shortest distance that the driver can accept car-following. The first stage of the following movement state, for the vehicle free to follow the driving state, the front and rear vehicle belongs to the safe car-following distance.
S 1 = t 0 t 1 V 0 + t 0 t a 0 t dt
S 2 = t 0 t 1 V 1 + t 0 t a 1 t dt
where it is assumed that the driving vehicle starts to follow the front vehicle at moment t 0 , t 1 represents the timings for braking vehicles; self-driving speed is V 1 t , front vehicle speed is V 2 t , drive at a 0 t accelerations, the front car always runs at a 1 t accelerations, S 1 is self-driving distance and S 2 is the driving distance of the front vehicle.
In the third stage of car-following, the driving vehicle brakes at the maximum braking deceleration— μ g . The speed of the self-driving vehicle is equal to that of the front vehicle, and the vehicle does not collide after the braking. The displacement of the two vehicles before and after the third stage of car-following is:
S 1 = t 1 t 2 V 0 + t 0 t 1 a 0 t dt + t 1 t μ g dt dt
S 2 = t 1 t 2 V 1 + t 1 t a 1 t dt dt
where t 2 is the time when the two vehicles will not collide, S 1 is self-driving distance, S 2 for the front car running distance and μ g for braking deceleration.
The two vehicles have the same speed at time t 2 :
S 1 = t 1 t 2 V 0 + t 0 t 1 a 0 t dt + t 1 t μ g dt dt
S 2 = t 1 t 2 V 1 + t 1 t a 1 t dt dt
where V 0 is the self-driving speed and V 1 is the speed of the front car.
The equation is constructed according to the position relationship between the front and rear vehicles.
t 0 t 1 V 0 + t 0 t a 0 t dt + D = S 0 + t 0 t 1 V 1 + t 0 t a 1 t dt
D + t 1 t 2 V 1 + t 1 t a 1 t dt dt = t 1 t 2 V 0 + t 0 t 1 a 0 t dt + t 1 t μ g dt dt + d
Equations (14)–(21) are established to solve the kinematic equation, and the maximum operating time, t m , reserved by the driver in the car-following phase is calculated. The maximum operating time, t m , reserved by the driver in the first phase of the car-following is:
t m = t 1 t 0
The larger the maximum operating reservation time is, the smaller the complexity of road traffic environment is, and the smaller the complexity of road traffic environment is. When the maximum operating reservation time is greater than or equal to 20 s, the road traffic environment is not complex, and the driver has sufficient time to respond to the unexpected situation and take corresponding measures [33]. The complexity of the road traffic environment for vehicle following in the following lane is:
E 1 = 20 t m 20
Step 2: Then according to the change of road traffic environment landscape, the model of other lanes and the surrounding road traffic environment area change is constructed.
Firstly, the extracted road traffic environment factors are standardized.
E 2 ( p i ) = g ( l i )
Secondly, weighted summation of indexes is performed.
E b = i = 1 7 ω i E 2 p i
Step 3: Computing complexity of integrated road traffic environment.
The calculation formulas of two parts of the road traffic complexity model are completed. One part is the model of the driving state of the two vehicles in the following lane, and the calculation formulas are Equations (14)–(23).The other part is the visual area change model of other lanes and surrounding road traffic environment, and the calculation formulas are Equations (2)–(4), (24) and (25). Two models can be improved by Equation (1), the final road traffic environment complexity calculation formula is obtained by integration:
E = ω 0 20 t m 20 + i = 1 7 ω i E 2 p

2.2. Device and Driving Simulation Scenario

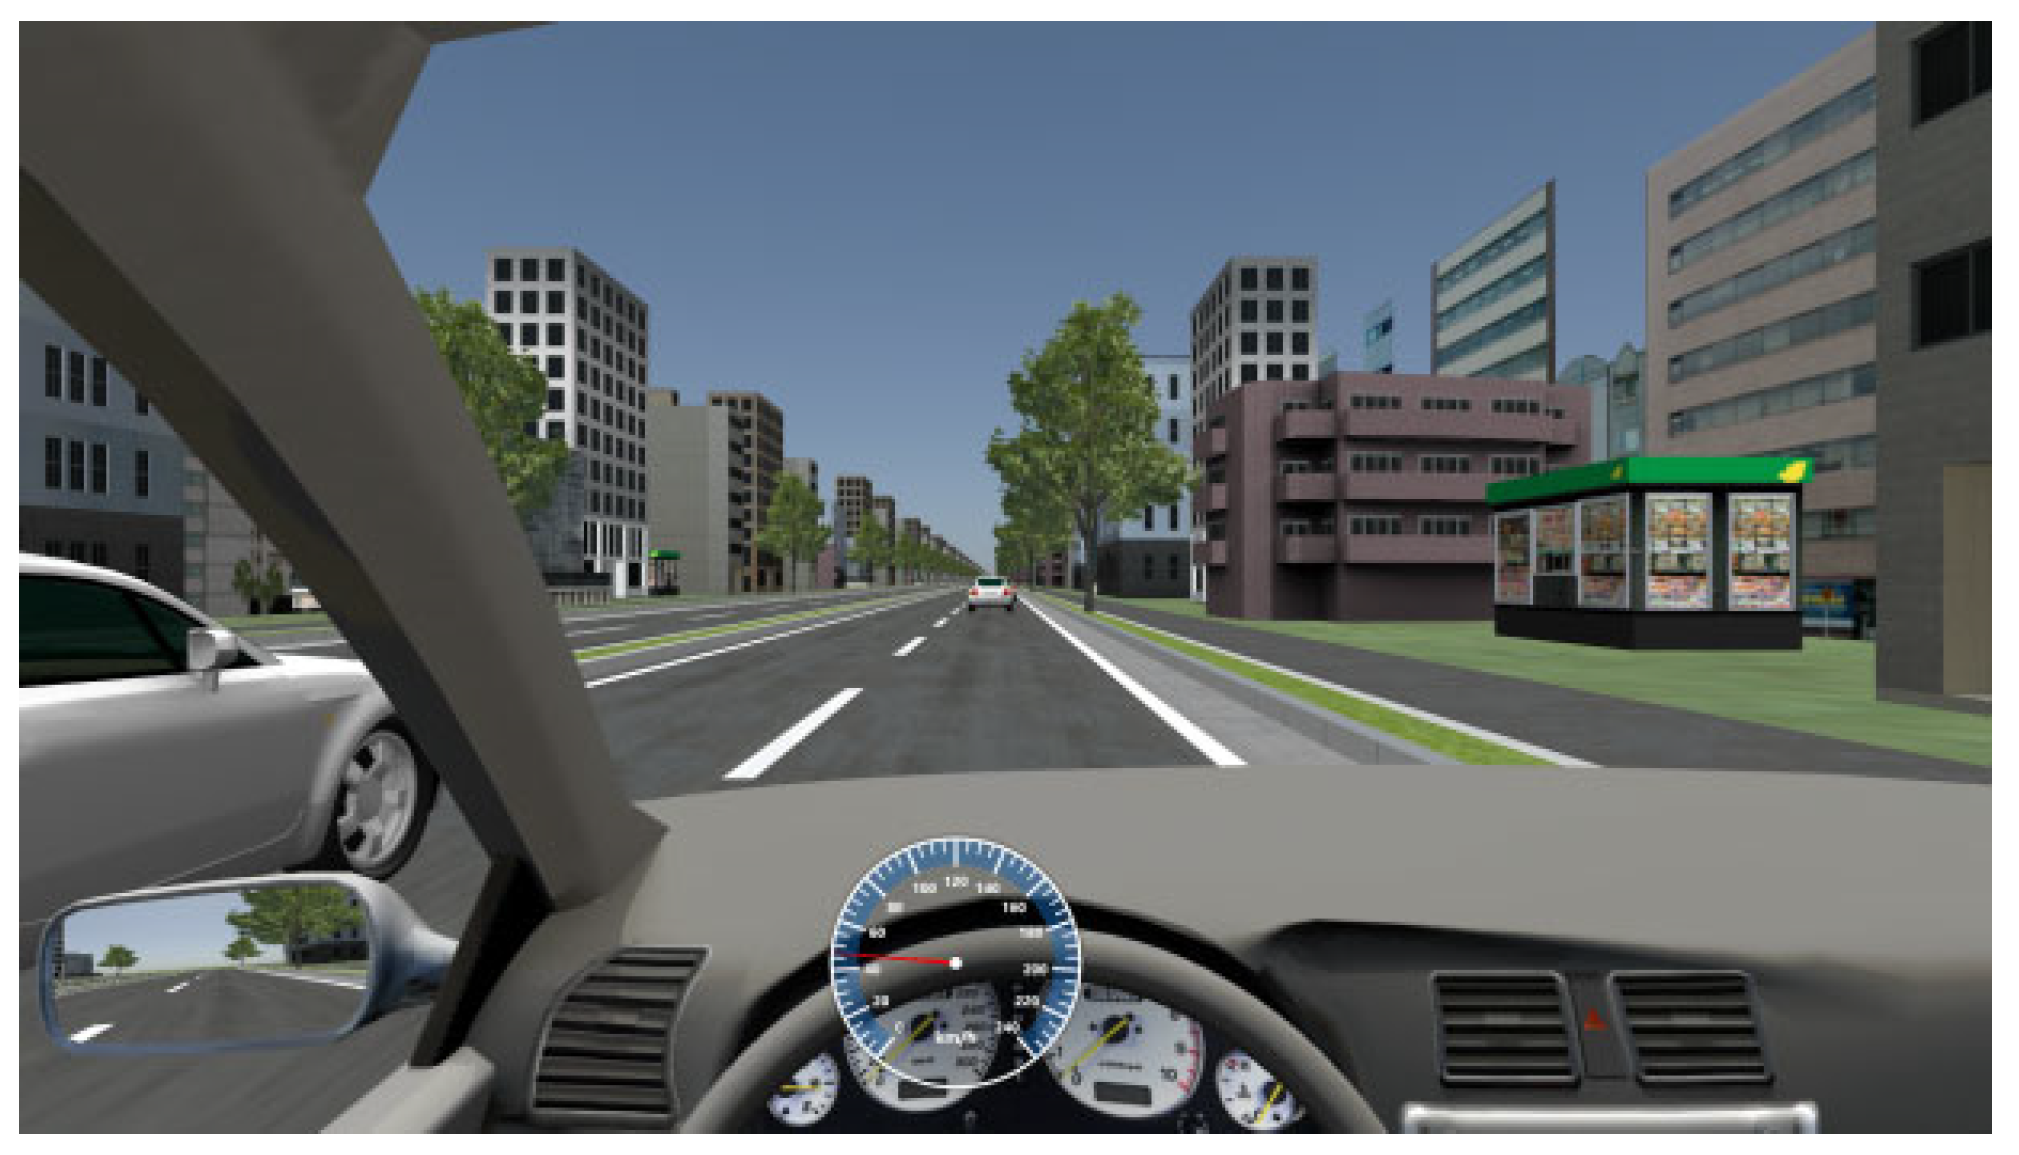
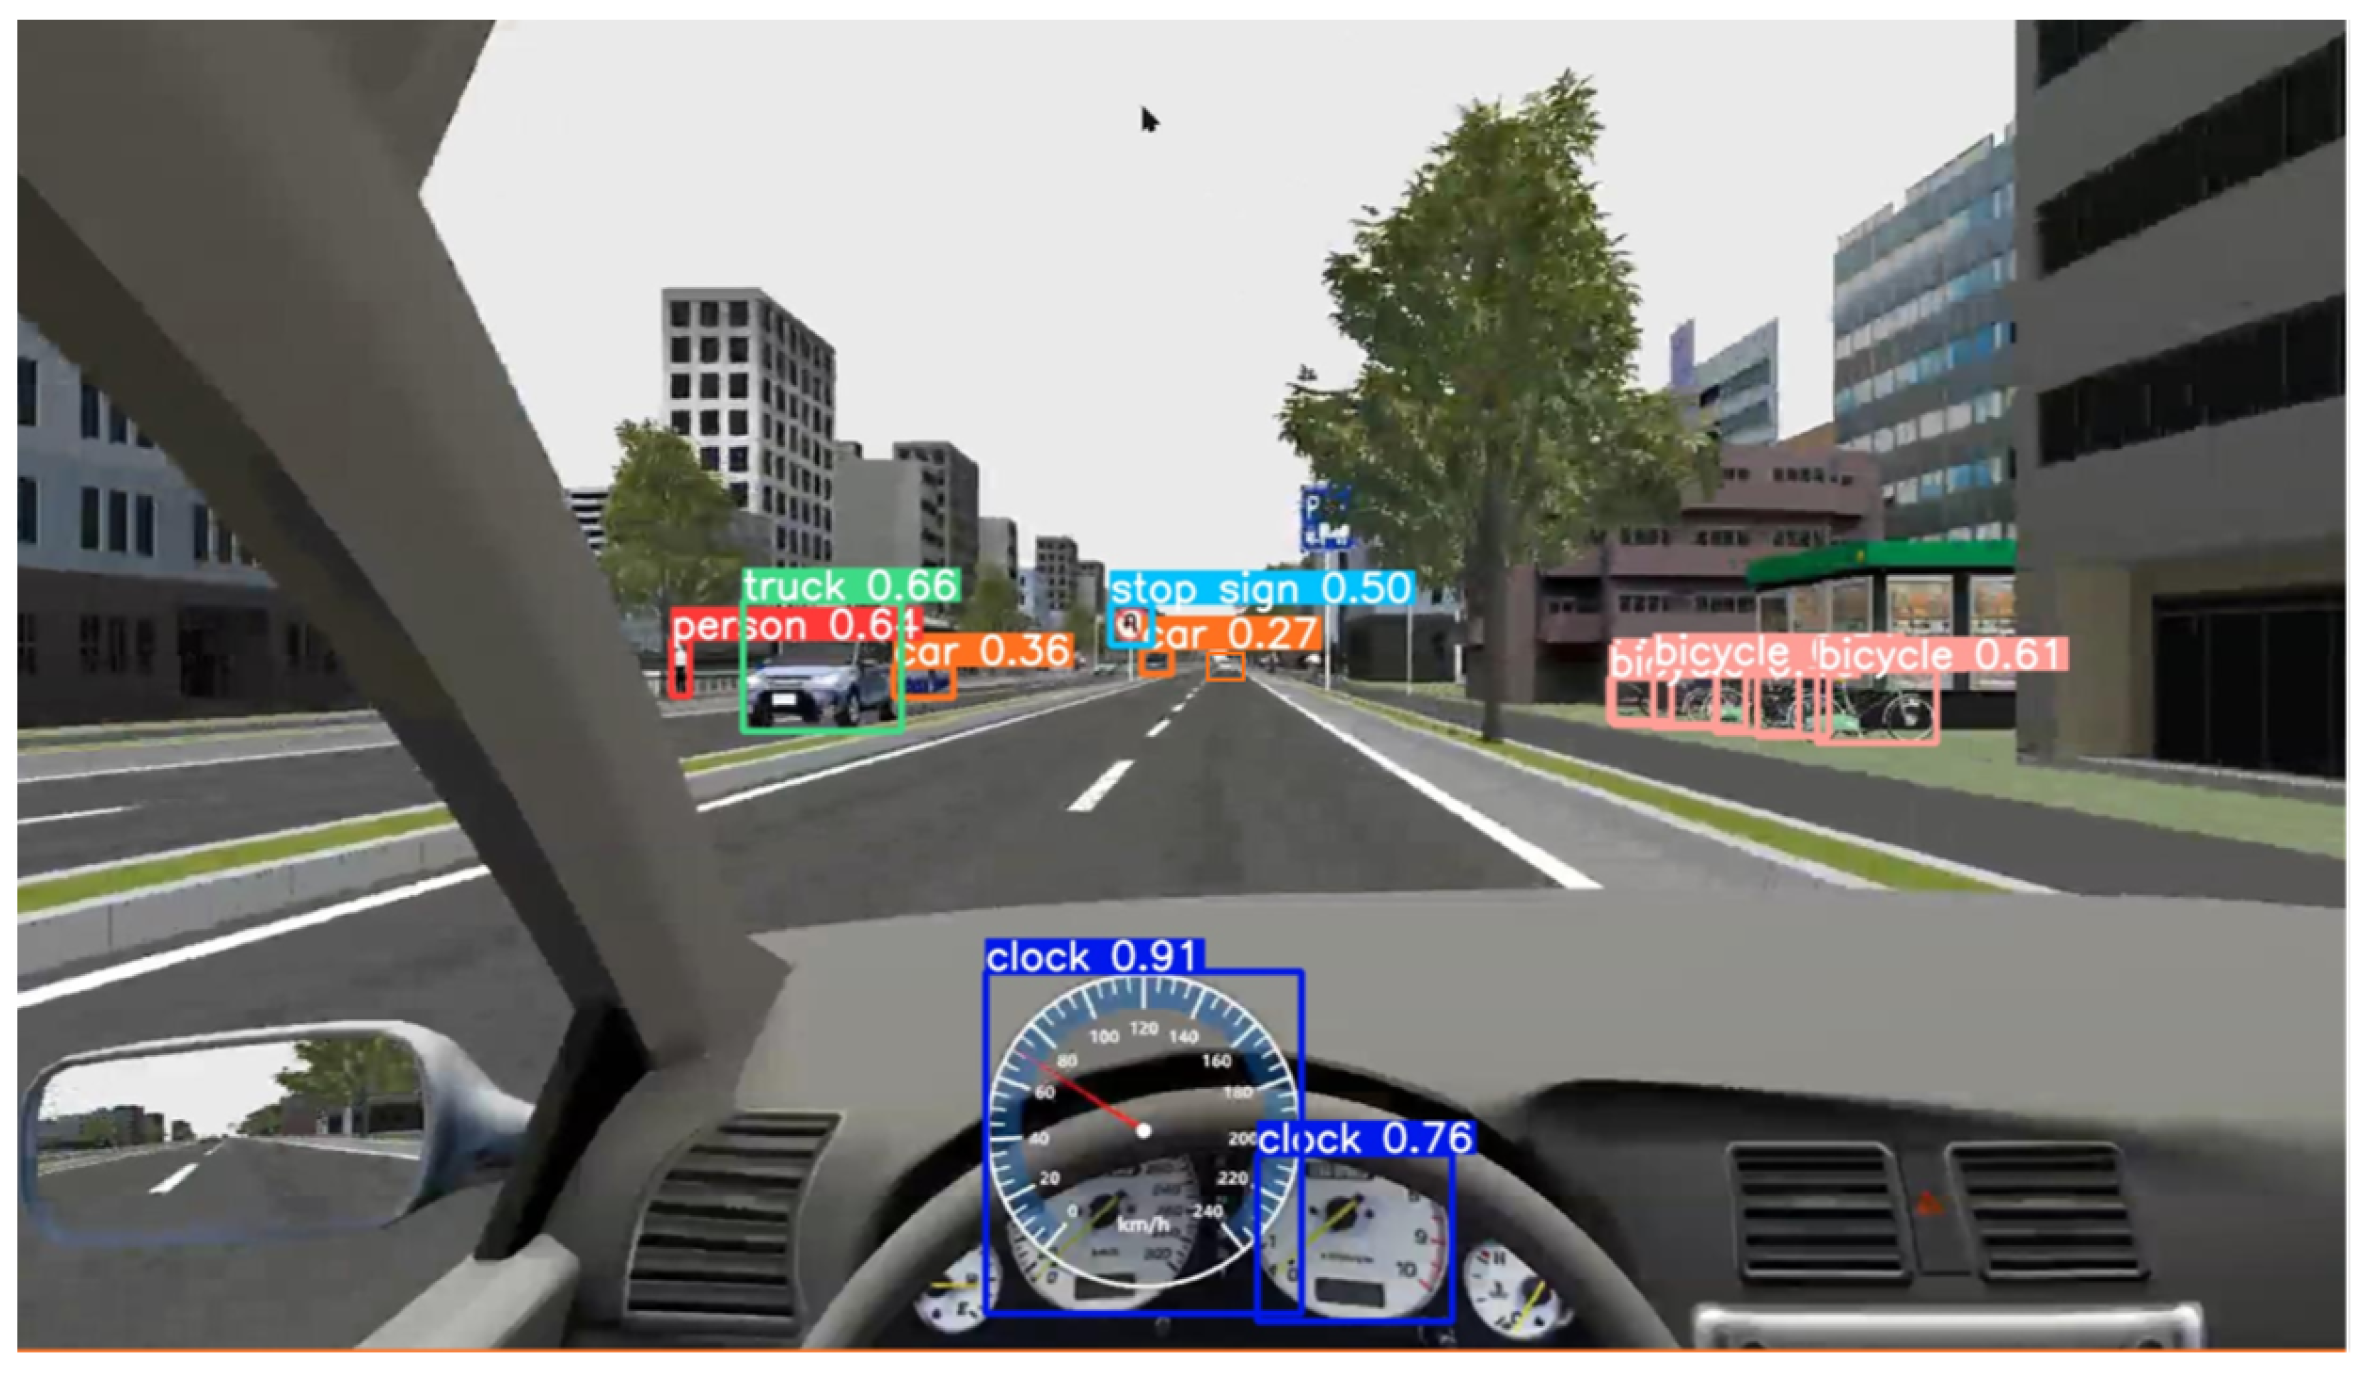
In this study, it is necessary to obtain the speed of the front vehicle and the distance between the car and the front vehicle in real time. The real vehicle test data are not easy to obtain. Therefore, the driving simulator is selected to simulate the network scene to realize the collection of the running data of the front vehicle. The test scenario is shown in Figure 2.
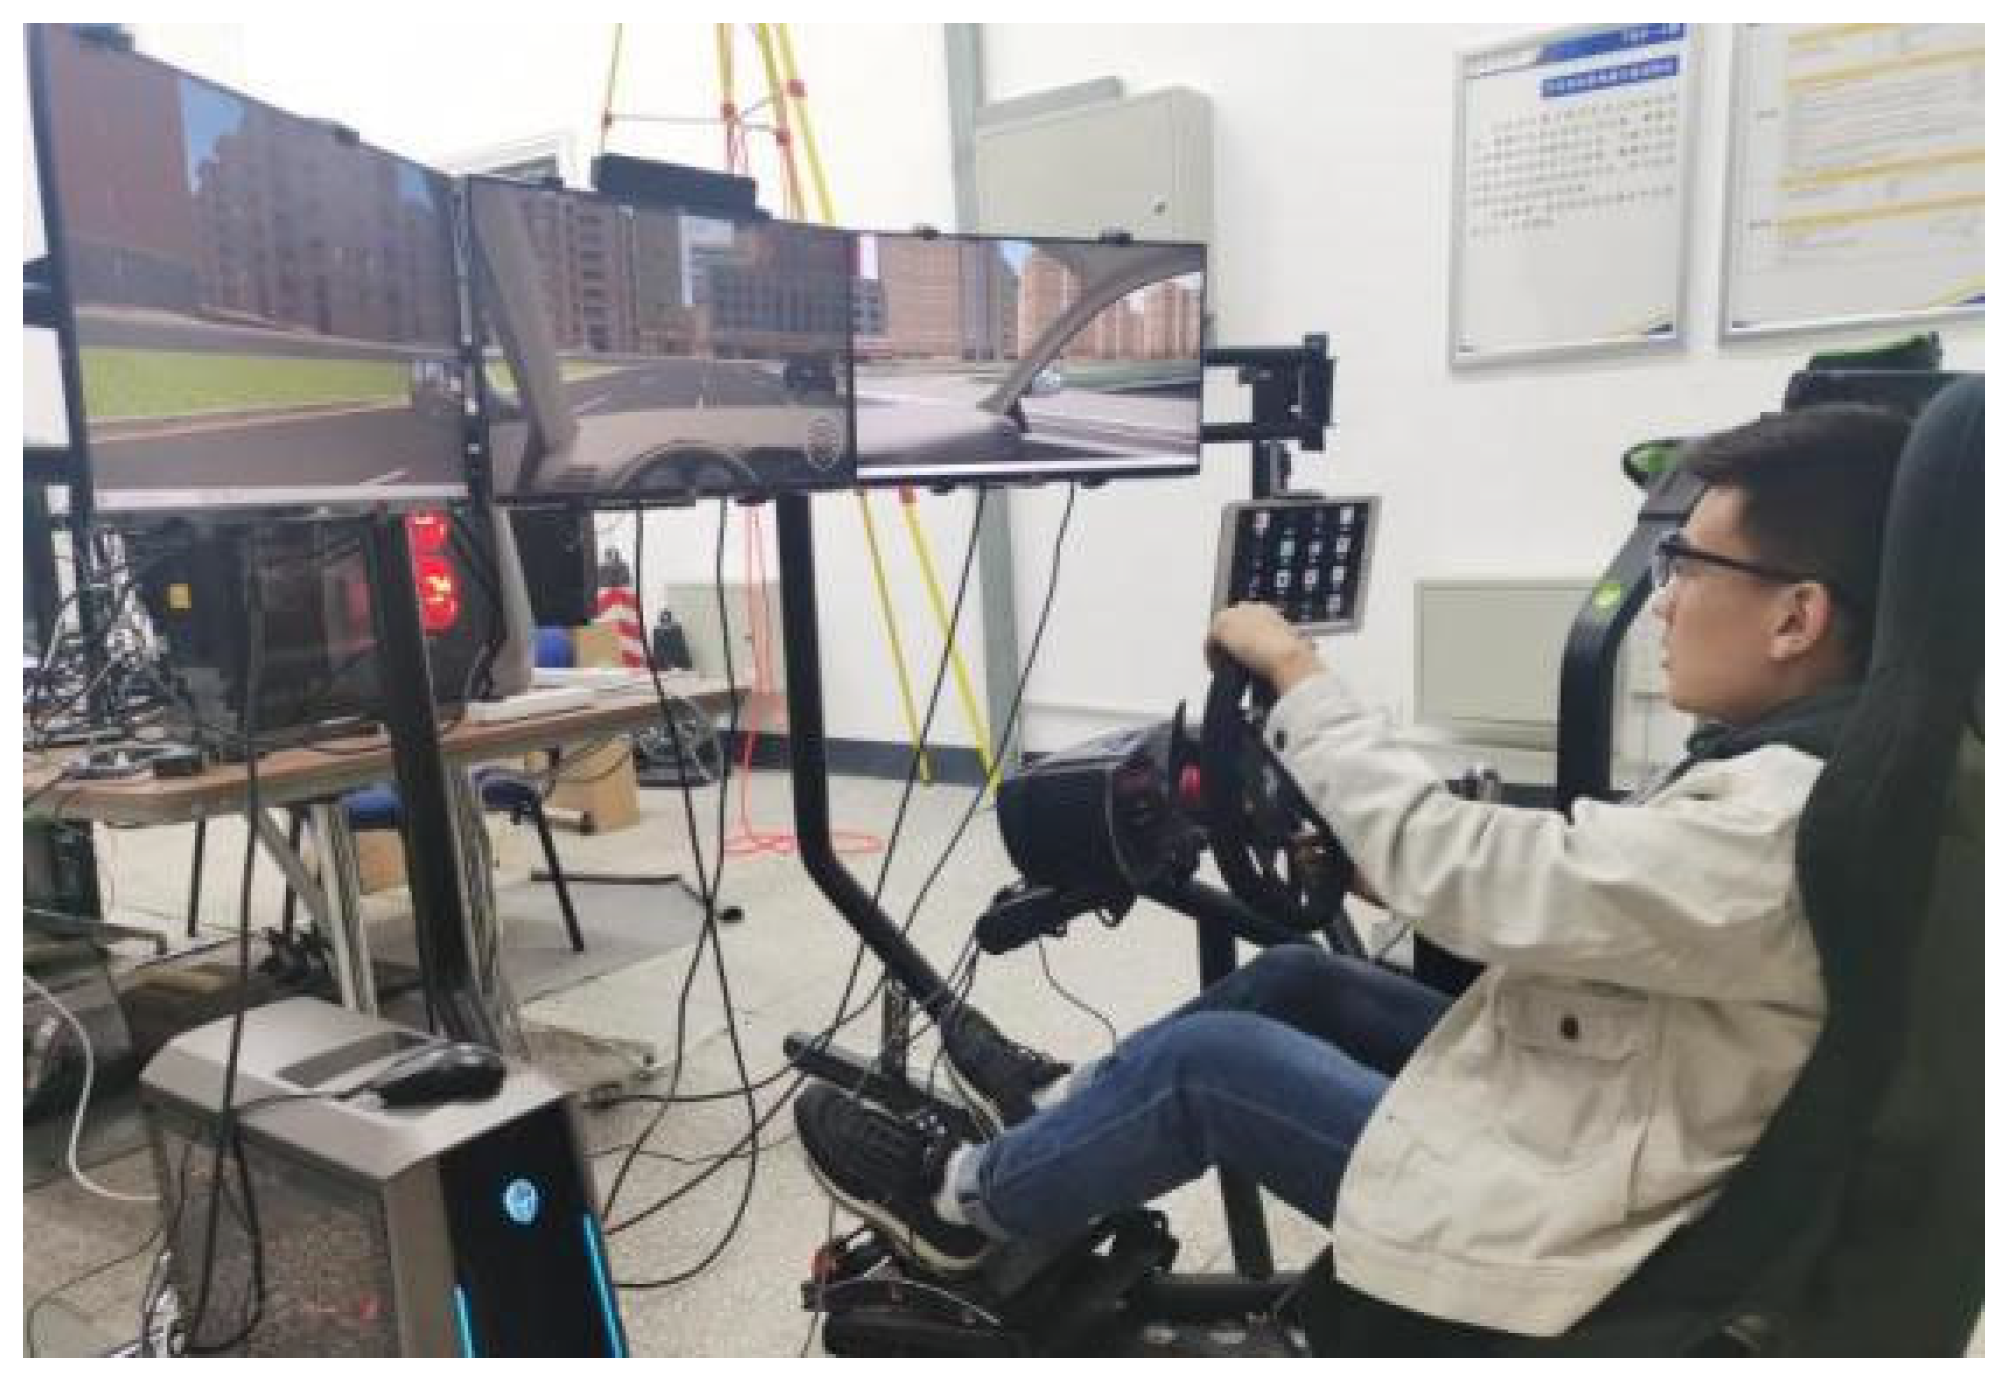
This experiment is a driving system based on UC-win/Road driving simulation software. The hardware part includes: seat, triple screen display, steering wheel and throttle brake power system and sound output system, which can realize the driving scene more realistically.

2.3. Experimental Design

We designed and built a scene that is consistent with the actual road traffic conditions. The road type in the test scene is urban roads, and the total length of the road is 10 km. The road traffic flow is set to 200 pcu/h except the car-following lane, and the average speed of the traffic flow is 60 km/h. The traffic flow in each lane is evenly distributed. Driving simulation tests are shown in Figure 3.
Personnel were trained and tested before the test to ensure that the test personnel could drive the vehicle normally. At the beginning of the experiment, the staff needed to record the driving simulation process on the screen. During the experiment, the subjects followed the front car while ensuring driving safety. After the experiment, the staff saved the driving simulation data and arranged for the subjects to exit the test site in an ordered manner.
A total of 30 testers participated in the experiment, including 11 female testers and 19 male testers. The age range of the participants was between 20 and 40 years old. The mean age was 26.8 years old and the standard deviation was 5.9 years.

2.4. Data Acquisition

2.4.1. Driving Simulation Data Acquisition

The driving simulation test was carried out based on UC-win/Road driving simulation software. The sampling frequency of the simulator was set to 1 Hz. The indexes related to the driving influence degree were extracted, including the vehicle speed, the position coordinates of the vehicle on the road, the front vehicle speed, the position coordinates of the front vehicle on the road, the steering wheel operation, the brake pedal opening and closing degree and the throttle pedal opening and closing degrees.

2.4.2. Data Collection of Road Traffic Elements

This study needed to identify the elements appearing in the road traffic. YOLOv5 is an advanced target recognition algorithm in the existent technology, which can identify all the targets in the same image and box the recognition results. Many physical objects in the road traffic environment have corresponding labels in YOLOv5, such as vehicles, bicycles, pedestrians, road signs, buses, traffic lights and road routes. The target recognition using this algorithm meets the specific requirements of this study [34].
After the test, the video recorded during the test was processed, and the recorded video was processed into a picture with the same sampling frequency as the driving simulator, and YOLOv5 was used to identify the objects in the picture. After YOLOv5 processing, all the identified target objects will be framed, the identified images will be saved to the folder and the color of each target object is different. By determining the RGB value range of different target objects, the target identified by YOLOv5 is extracted. The pixel coordinates of the target object in the image and the pixel length and width of the target box are extracted and saved as a table document. The color RGB value ranges of the target objects are shown in Table 2.
According to the range of RGB, the target object is extracted. The original image size is 1080 px multiplied by 1960 px, and the target object is extracted with the abscissa [0 px, 1960 px] and the ordinate [0 px, 1080 px]. The extracted data includes the four endpoints of the object, and the corresponding extraction of the target name and the pixel length and width of the target object in the image. The extraction results are shown in Figure 4.

3. Results

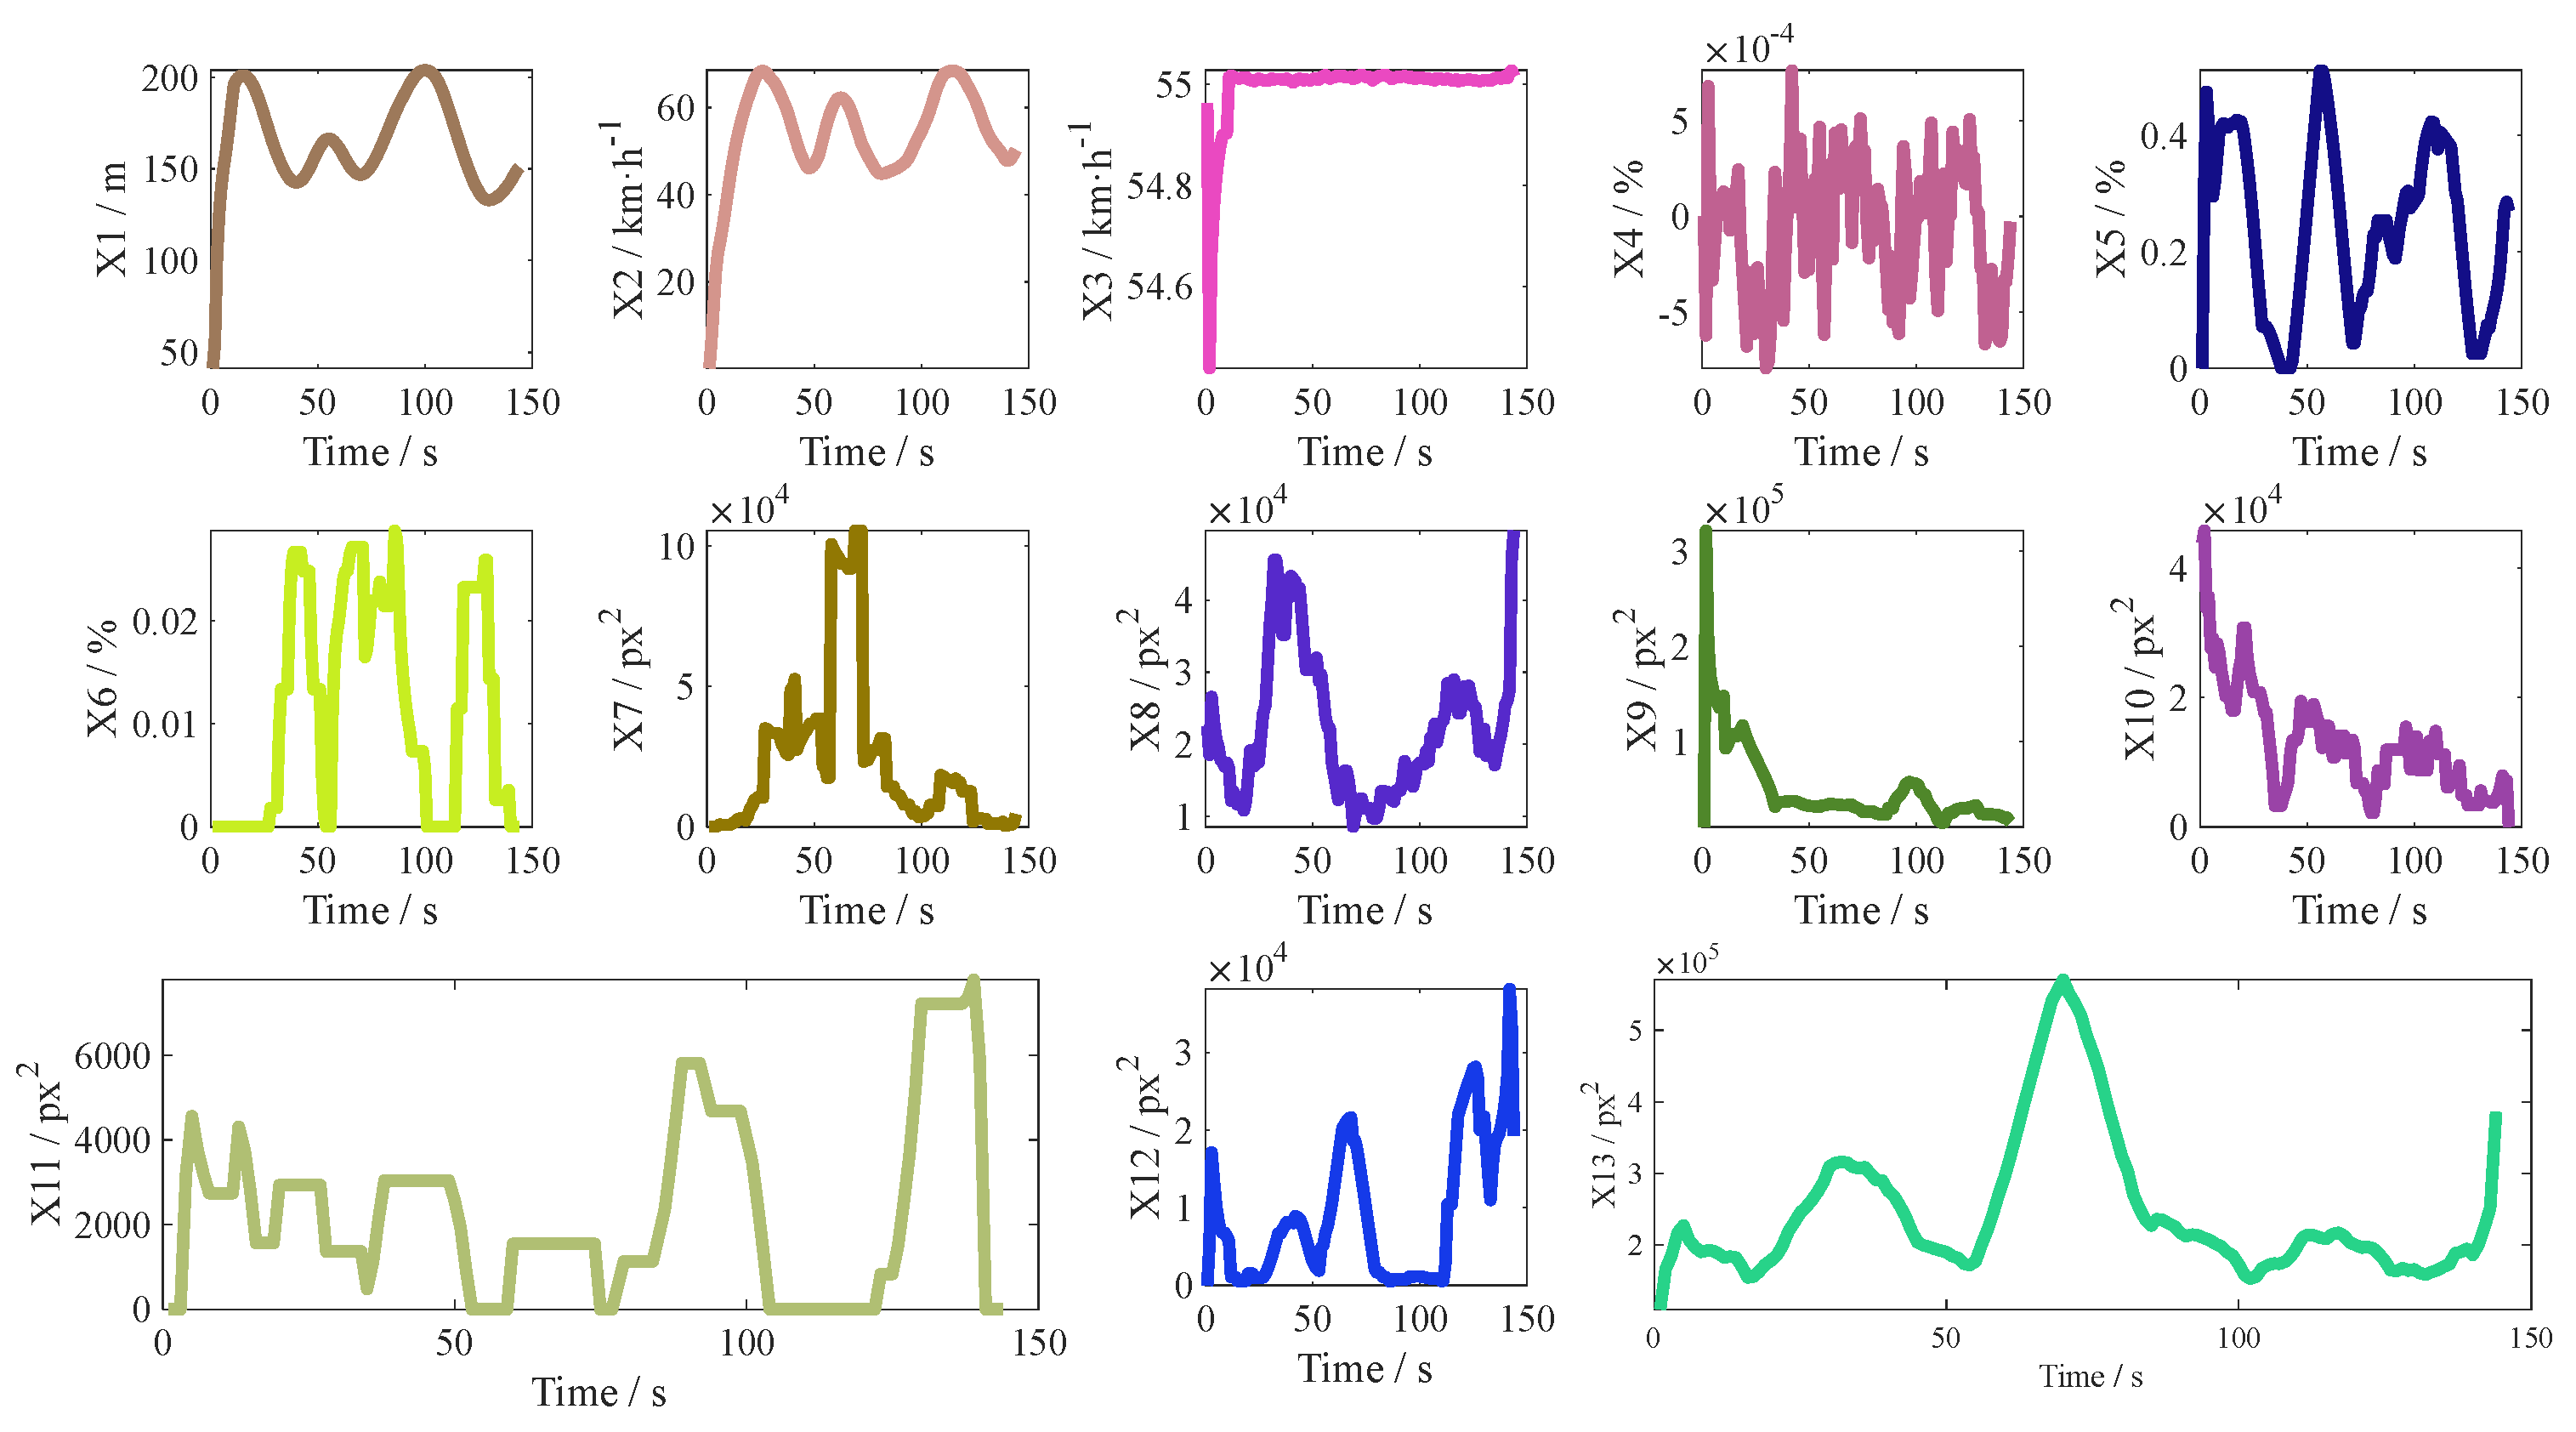
The driving simulation data obtained in the experiment and the extracted road traffic element data are preprocessed to make the two parts of data match in real time. The results are shown in Figure 5. The ordinate name in the figure can be referred to Table 1. As shown in the figure, the ordinate is different road traffic environmental impact factors, and the abscissa is time, and the starting time and deadline of all the extracted data are matched.

3.1. Weight of Index

In this study, the principal component analysis method is used to calculate the index weight. The purpose of principal component analysis is to reduce the dimension of data, and to reduce the dimension of the index to obtain the linear correlation principal component load matrix. Finally, the index weight is calculated according to the load matrix and the principal component contribution rate. Therefore, to use the principal component analysis method, the premise is that there should be a strong linear correlation between multiple variables in the original data. If the correlation between the original variables is too small, there is no persuasive common factor between them, and then the principal component analysis has no practical significance. Kaiser–Meyer–Olkin (KMO) test is used to compare the simple correlation coefficient and partial correlation coefficient between variables. The value is between 0 and 1. The larger the value is, the more effective the data is. It is mainly used in principal component analysis of multivariate statistics.
The test data of 30 testers were extracted, and the data were arranged according to the index X1–X13 in Table 1. The integrated data were 13—dimensional data. According to Equations (2)–(4), the test data of 30 testers were standardized, and then the correlation analysis was carried out by KMO test.
It can be seen from Table 3 that the appropriate measurement value of KMO sampling is 0.801 > 0.7, and significance < 0.01, indicating that there is a high correlation between each index. The correlation coefficient matrix is non-unit matrix, and principal component analysis can be carried out.
According to Equations (5)–(15), the principal component load values calculated in Table 4 are obtained. According to the principal component feature vector, the calculated values can be used to analyze the influence degree of different indicators in different principal components. The greater the calculated value is, the greater the influence degree in the principal component is. Specific analysis is as follows: the first principal component reflects the influence of the vehicle speed and the front vehicle speed on the driver under the influence of different interfaces, and the influence degrees are 0.853 and 0.831. The second principal component reflects the influence of vehicle distance, throttle pedal opening and closing degree, brake pedal opening and closing degree on the driver under the influence of different interfaces, the influence degrees are 0.602, 0.715 and 0.524. The third principal component reflects the influence of the change of pedestrian pixel area on the driver under the influence of different interfaces, with the influence degree of 0.674. The fourth principal component reflects the influence of vehicle pixel area change and road route pixel area change on drivers under different interface effects, the influence degrees are 0.374 and 0.768. The fifth principal component reflects the influence of the change of the pixel area of the traffic signal lamp and the change of the pixel area of the speed limit plate on the driver under the influence of different interfaces, the influence degrees are 0.619 and 0.609. The sixth principal component reflects the influence of the change of vehicle distance and traffic signal pixel area on the driver under the influence of different interfaces, and the influence degrees are 0.366 and 0.48.
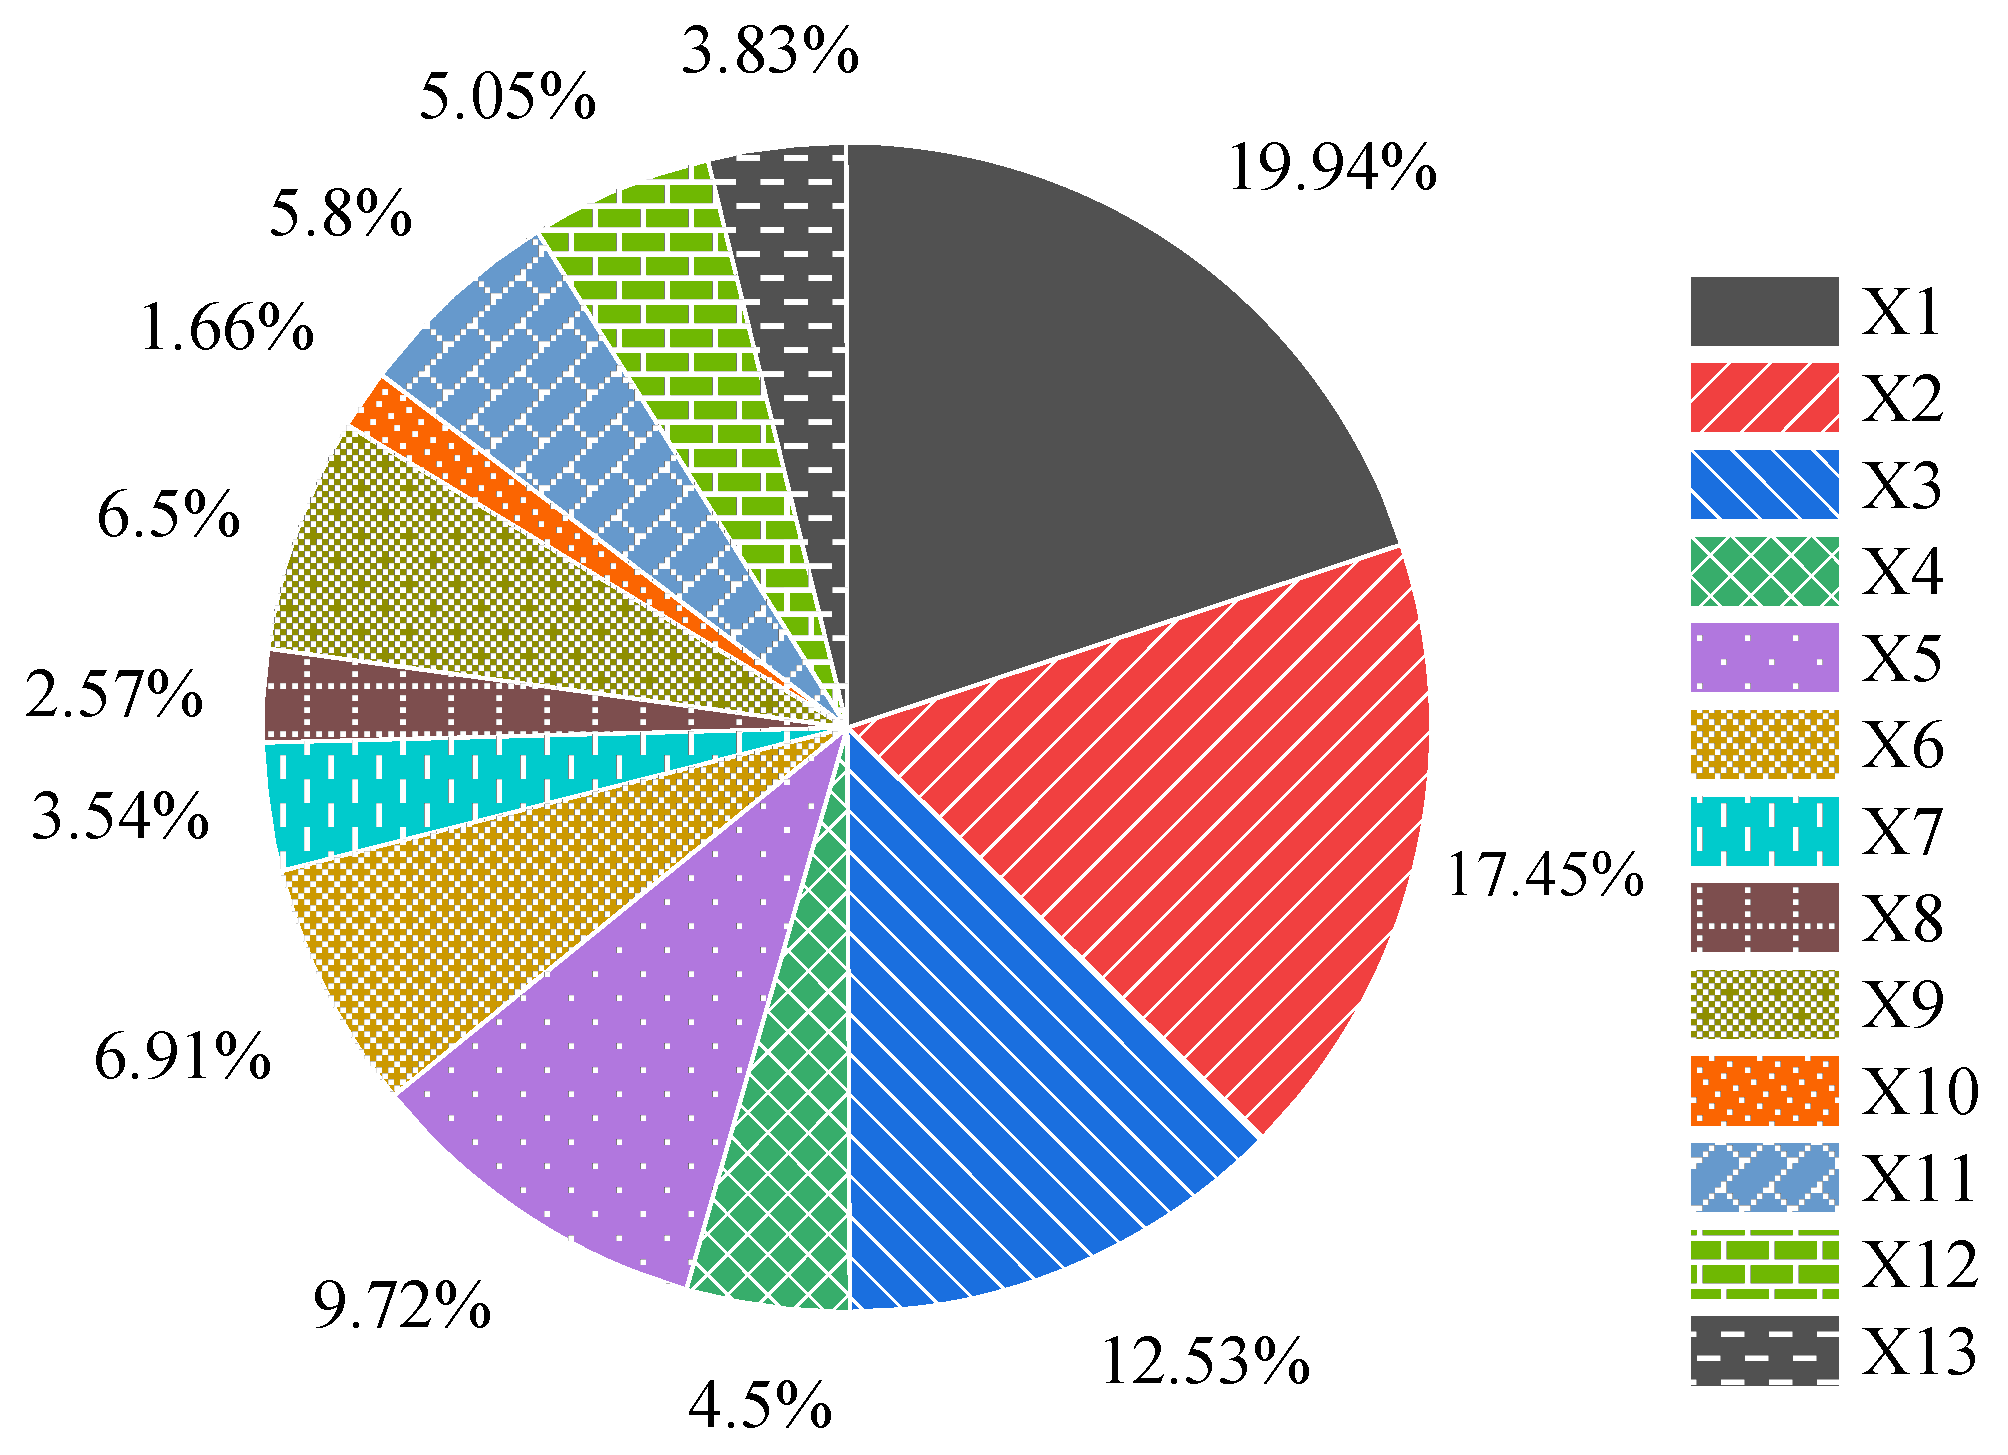
The contribution rates of each principal component calculated by principal component analysis are as follows: the first principal component is 13.338%, the second principal component is 10.602%, the third principal component is 9.171%, the fourth principal component is 9.057%, the fifth principal component is 8.419% and the sixth principal component is 7.917%. Combined with the load matrix composed of the load values in Table 4 and Table 5, the index weights of road traffic environmental impact factors are calculated according to Equation (13). The calculation results are shown in Figure 6.
According to the calculation results of the model, the indicators that have the greatest impact on the driver are vehicle spacing, self-driving speed and front-driving speed, accounting for 0.1994, 0.1745 and 0.1253 of the total weight, respectively, indicating that the driving state of the front vehicle and self-driving has the greatest impact on the driver. Secondly, the amount of steering wheel operation, the degree of throttle pedal opening and closing and the degree of brake pedal opening and closing have a moderate impact on the driving operation task, accounting for 0.045, 0.0972 and 0.0691 of the total weight, respectively. Finally, the change of road traffic landscape in the car-following process has little effect on the driver, among which the pixel area change of other vehicles, the pixel area change of traffic signal light and the pixel area change of speed limit plate have a greater impact, accounting for 0.065, 0.058 and 0.0505 of the total weight, respectively, indicating that the traffic landscape that can present driving information to the driver in the road traffic environment has a greater impact on the driver.

3.2. Calculation Results of Road Traffic Environment Complexity Quantification Model

The road traffic complexity model is divided into two parts, one is constructed according to the driving state of the two vehicles in the car-following lane, the other is constructed according to the changes of other lanes and the surrounding road traffic environment area.
The data in the driving simulator and the target extraction data of YOLOv5 image are substituted into the weight calculation model for calculation. The principal component contribution rate and load matrix are calculated by principal component analysis. Combined with the analysis of Equation (1), the index weight is calibrated. The calibrated weights of road traffic environmental impact factors are:
ω 0 = 0.7105   ω 1 = 0.0354   ω 2 = 0.0257   ω 3 = 0.065   ω 5 = 0.058   ω 6 = 0.0505   ω 7 = 0.0383 E = E a + E b = ω 0 E 1 + i = 1 7 ω i E 2 p
In the formula, E a is the complexity of the road traffic environment generated by the vehicle driving in the car-following lane, and E b is the complexity of the surrounding road traffic environment except the car-following lane.
Firstly, the complexity of road traffic environment caused by car-following lane vehicles is calculated. The driving simulator data are extracted from Figure 5 and substituted into Equations (14)–(23) for calculation. The settlement results are shown in Figure 7.
Figure 7 shows the calculation results of road traffic environment complexity caused by vehicle driving in the following lane, and the complexity calculation value is consistent with the actual vehicle operation condition. According to Figure 8a–c, the front car travels at 50 km/h uniform speed, through the control of the car to change the following distance. The calculation results of road traffic environment complexity are divided into five cases. The first case—the vehicle accelerates, shortens the distance between the vehicle and the front vehicle, and increases the calculation value of road traffic environment complexity. The second case—the speed of the car is greater than the speed of the front car, and the car slows down, followed by the front car, the complexity of the road traffic environment increases. The third case—the vehicle speed is less than the front vehicle speed, and the vehicle deceleration, road traffic environment complexity calculation value is close to 0. The fourth case—the speed of the car is less than the speed of the front car, but the complexity of the road traffic environment decreases when the car accelerates. When the speed of the car is greater than or equal to the speed of the front car, the complexity of the road traffic environment increases. The fifth case—the speed of the two vehicles is equal and uniform, road traffic complexity calculation value unchanged.
Secondly, the complexity of other lane road traffic environment is calculated. The pixel area data of other lane road traffic environment elements extracted in Figure 5 are standardized according to Equation (24), and calculated with Equation (25). Finally, the complexity quantification value of other lane road traffic environments is obtained.
Figure 9 is the complexity of other lane road traffic environments. The increase in the computational complexity is due to the traffic environment factors with large amounts of information, such as signalized intersections and speed limit signs during driving, while the decrease in the computational complexity is due to the traffic environment factors that do not provide drivers with driving information around the road. The calculation results are in line with the actual situation. Figure 5 shows that the change of bus pixel area will have a greater impact on the complexity, and the increase of bus pixel area will increase the complexity of the road traffic environment. Pedestrians and bicycles on both sides of the road have less impact on complexity. Except for the front vehicle, the change of pixel area of other vehicles has little effect on complexity. The area change of traffic lights and speed limit sign has obvious influence on the complexity of the road traffic environment. From the perspective of providing information, the effective information provided by traffic lights and speed limit signs to drivers is large, thus the presentation of their information has a great impact on the complexity of road traffic. The calculation results of the complexity model generated by landscape changes are consistent with the actual road traffic information changes.
Finally, combined with the complexity of road traffic generated in the process of car-following and the complexity of road traffic environment generated by environmental changes in the process of car-following, comprehensive calculation is carried out according to Equation (27), and finally the complexity, E, generated by comprehensive road traffic environmental changes is obtained.
Figure 10 shows that the vehicle speed distance control has a major impact on the complexity of the car-following process, and the complexity of the road traffic environment changes has a secondary impact, and the complexity of the road traffic environment is real-time change. The value range of the road traffic environment is [0, 1], and the calculation results are in line with the actual driving situation of the vehicle.

3.3. Calculation Example Analysis

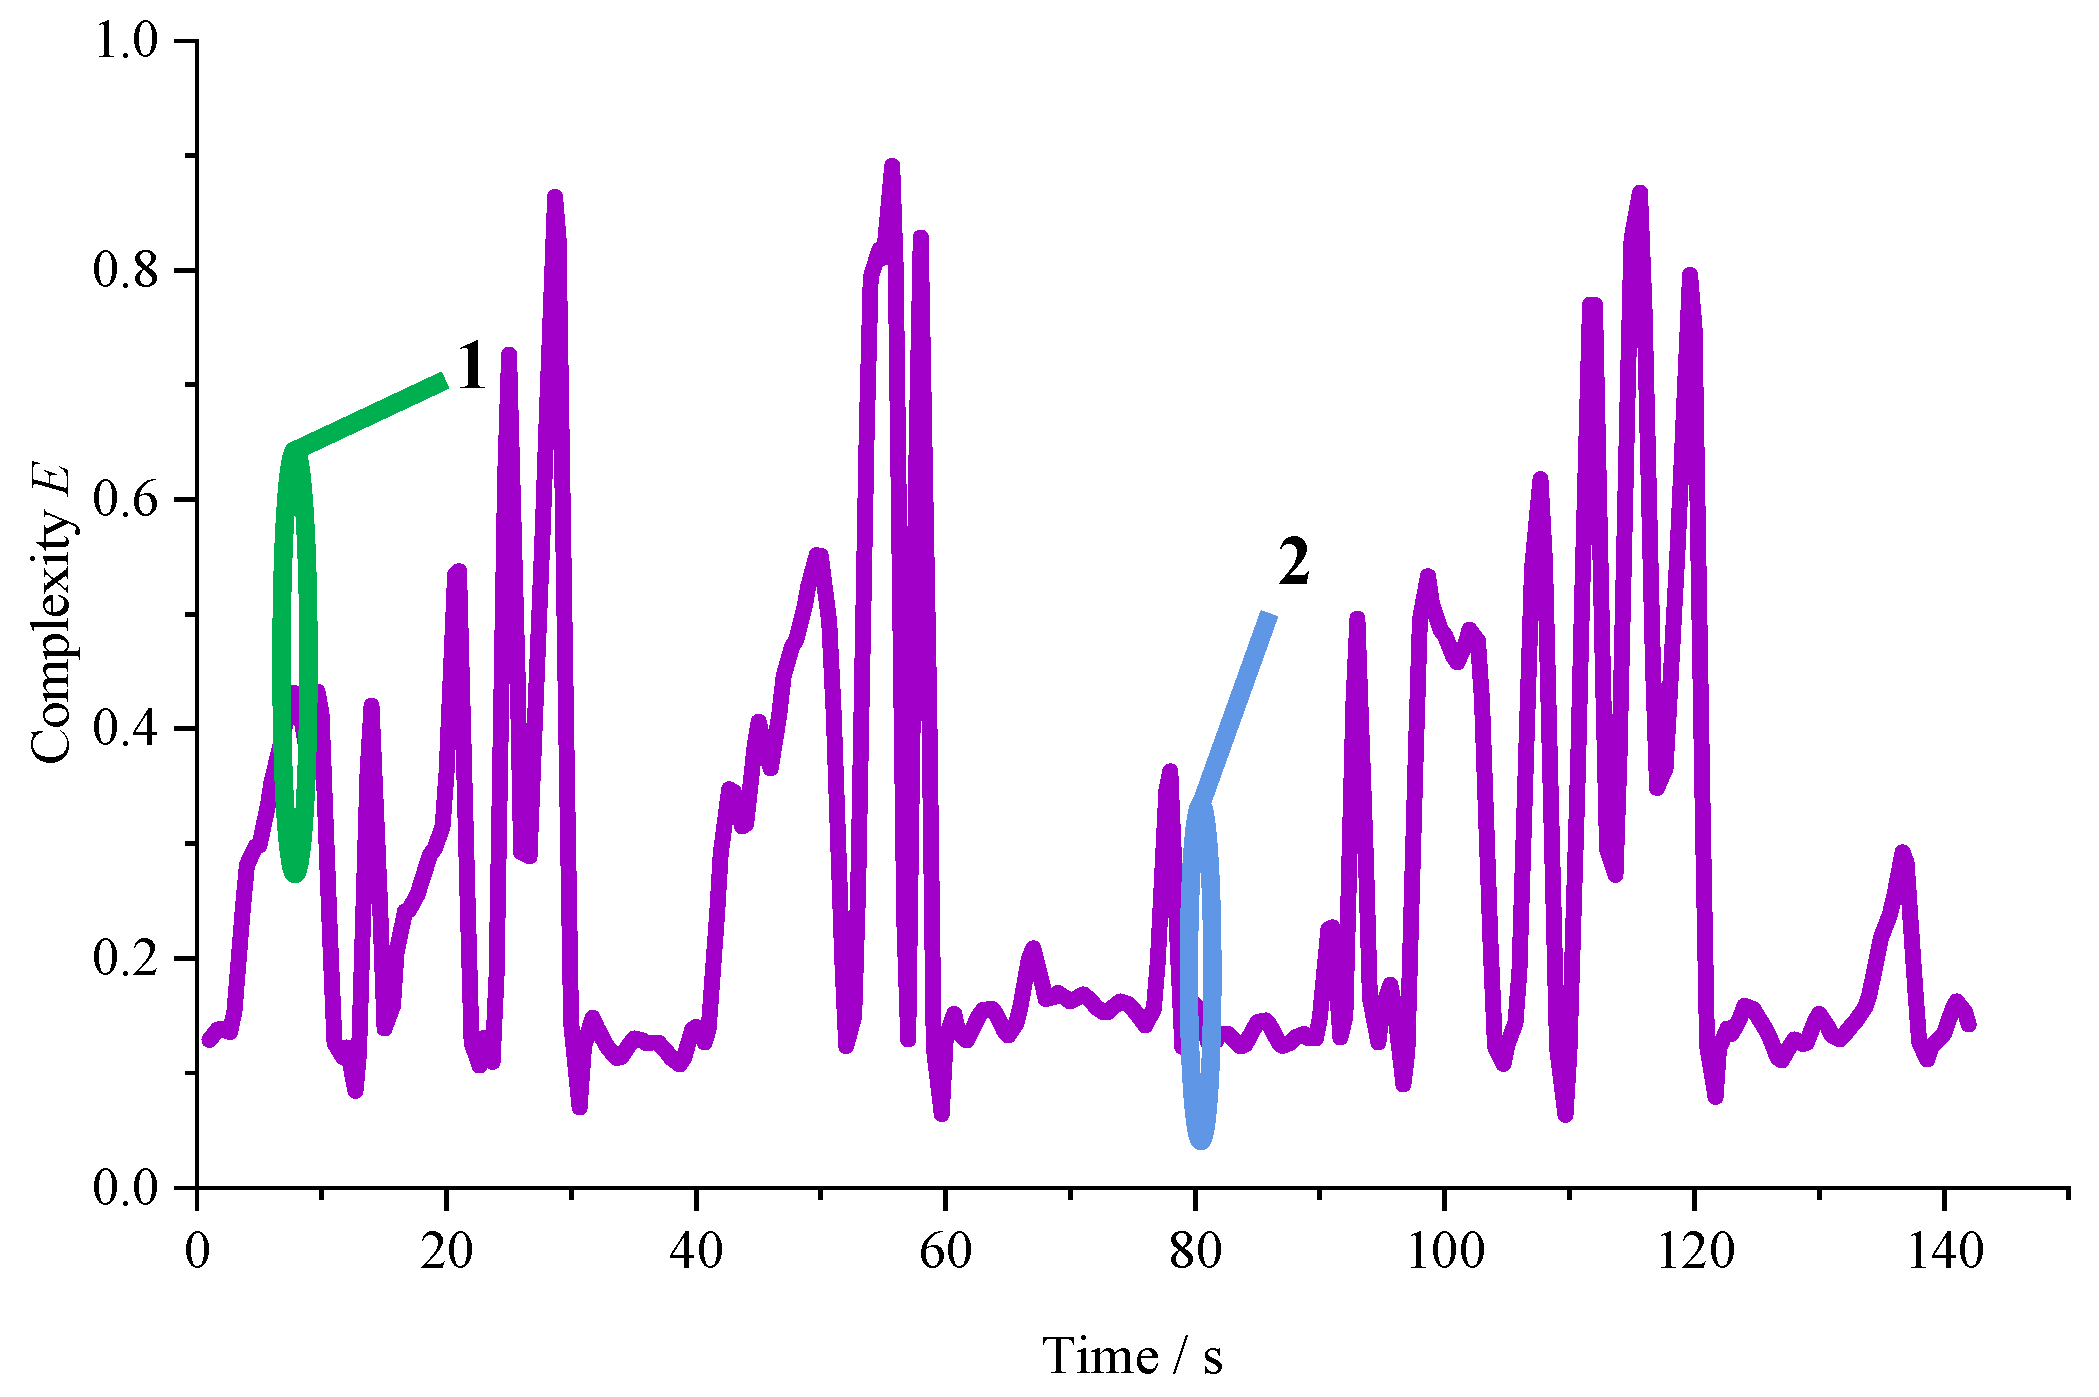
Based on the calculated complexity of the road traffic environment, the traffic conditions of urban roads are analyzed. Figure 11 shows the quantitative value of the real-time calculated complexity of the road traffic environment. Mark point 1 is a normal road traffic environment, the vehicle in the urban road is mostly in such a scenario; marking point 2 is an uncomplicated road traffic environment. Vehicles are driving along urban roads, and drivers are less affected by the road traffic environment. The following details analysis of these two traffic scenarios.
Figure 12 shows the road traffic environment at the time of vehicle driving for 9 s at marking point 1, in which the traffic condition of the following lane is as follows: the self-driving speed is 18.76 m/s, the front vehicle speed is 15.28 m/s, and the distance is 96.39 m. The calculated Ea value is 0.21573, Eb value is 0.16908 and E value is 0.3848. The calculation results of the model are consistent with the actual road traffic conditions. In Figure 12, the rear vehicle speed in the car-following lane is greater than the front vehicle speed, and there is a risk of rear vehicle rear-end, but the rear vehicle rear-end probability is low. There are four vehicles on the road, one pedestrian, one forbidden turning sign and many parked bicycles, and the surrounding road traffic environment is relatively complex.
Figure 13 shows the road traffic environment at the time when the vehicle at marking point 2 runs for 80 s. The traffic condition of the following lane is as follows: the self-driving speed is 14.25 m/s, the front vehicle speed is 15.28 m/s, and the distance is 85.81 m. The calculated Ea value is 0.04534. The complex Eb value generated by the surrounding road traffic environment except the following lane is 0.08432, and the calculated total road traffic environment complexity E is 0.1296. The calculation results of the model are consistent with the actual scenario of road traffic conditions. The speed of both the front and rear vehicles in the following lane is similar, and the vehicle distance is far, and the probability of rear-ending the vehicle is small. Figure 13 shows a bus, a car and a speed limit sign in the scenario, thus the complexity of the surrounding road traffic environment is low.

4. Discussion

The complexity of the road traffic environment calculated in this paper can provide a basis for the design of a driver assistance system. Driving assistance is a vehicle active safety technology developed for the purpose of improving car-following safety and reducing the drive’s operating load. It provides warning information for drivers when potential risks occur to avoid accidents or reduce accident hazards [35]. Our paper is based on the study of car-following driving. The most intuitive and easy-to-obtain vehicle early warning index is the relative speed of the front and rear vehicles and the relative position of the front and rear vehicles. Therefore, we select TTC (time to collision) as the research index, and converts the TTC calculation value into the value of the same dimension with the complexity of the road traffic environment. The two models are substituted into the same data for comparative analysis, and the practical significance of this model is determined by comparative analysis.
TTC reflects the relative velocity and relative distance between the car-following vehicle and the target vehicle, which has been widely used in the correlation analysis of vehicle longitudinal collision safety [36]. The TTC calculation formula is:
T T C = X l X f L v f v l
where X is the distance from the center line of the road to the starting point of the road, L is the length of the body, the corner mark l is the front car and the corner mark f is the self-car. When TTC is greater than 20 s [33], the driver has enough time to react to the unexpected situation and take corresponding measures. Therefore, the TTC calculation value of 20 s is absolutely safe, and the warning degree function is constructed.
P = 20 T T C 20
where P is the warning value, the greater the warning value represents the road traffic insecurity, and there is a risk of car-following.
In order to verify the calculation effect of this model, the same data are substituted into the TTC warning model and road traffic environment complexity calculation model, and the results are compared and analyzed. Figure 14 is the complexity surface and contour map of the road traffic environment complexity calculation; Figure 15 is the warning value surface and contour map based on TTC calculation. It can be seen that the surface change trend calculated by road traffic environment complexity is similar to the surface change trend of the early warning value based on TTC calculation.
If the complexity of the road traffic environment is applied to the vehicle early warning system, the difference between the complexity of the road traffic environment and the calculation of early warning value should be analyzed. From the surface calculation results, the road traffic environment complexity calculation results are greater than the warning value. Based on the warning value, the difference between the calculated value of the road traffic environment and the warning value is obtained.
T D = E P
where TD is the difference between the complexity of the road traffic environment and the warning value.
According to Equation (30), the contour maps of absolute difference surface and difference surface are calculated. According to the different surface analyses, the calculated value of the road traffic environment complexity is greater than the warning value, and the gap between the calculated value of road traffic complexity and the warning value is large when the distance between the two vehicles is large and the speed difference is small. When the vehicle distance is larger and the speed difference is large, the calculated value of road traffic environment complexity is close to the warning value, and the calculated value of road traffic environment is greater than the warning value. At present TTC between 3 and 5 s, a warning system warns the driver that they need to slow down to keep the distance; when TTC is less than 3 s, the driver is warned and the driver needs to take emergency measures [37]. Corresponding to the p value range [0.75, 0.85] in this paper, the warning system for warning; p > 0.85, the driver warning. The results are shown in Figure 16. It can be seen from the difference surface that the complexity value of the road traffic environment calculated in this paper is greater than the warning value, and it indicates that the warning threshold and warning threshold are increased by 2–5%. Therefore, the calculation value of road traffic environment complexity can be considered to be applied to the design of vehicle warning system.
Since the weight calibration in the model is calibrated by driving simulation data, there are differences in the application of the conclusion in the actual scene. The model parameters should be calibrated by real vehicle test, and the obtained conclusion is more applicable. If this model algorithm is applied to the vehicle early warning system, there will be some technical problems: in order to facilitate the acquisition of self-vehicle and front-vehicle data, the vehicle should be driven in the Internet scene; in order to obtain the pixel area of road traffic environmental factors in real time, the vehicle must have a complete machine vision target detection system; at the same time, the vehicle should have a complete data processing system to calculate the real-time data, obtain the real-time complexity of road traffic environment and provide early warning information for the vehicle.

5. Conclusions

We mainly studied the quantification of the complexity of the road traffic environment in the case of car-following. Firstly, the composition factors of road traffic environment are analyzed, and the weight of each element of road traffic environment is calculated based on the principal component analysis method. Secondly, considering the change of vehicle speed, vehicle distance, acceleration and other factors, and the change of road traffic environment in the process of vehicle following, the complexity model of the road traffic environment is constructed. Finally, the driving simulation test is carried out to obtain the driving simulation data. Based on YOLOv5 target recognition technology and image processing technology, the target recognition and data extraction of the road traffic environment are carried out, and the preprocessed data is substituted into the model for calculation. The complexity of road traffic environment is quantitively calculated. We have the following conclusions:
(1)
The weight of the road traffic environment complexity index is calculated based on principal component analysis. The results show that the weight of the vehicle driving state in the model is 0.7105, and the weight of other lane road traffic environment factors in the model is 0.2895. It indicates that the driving state of the front and rear vehicles in the car-following process has a great influence on the driver. When analyzing the influence of road traffic environment on the driver in the car-following situation, the driving state of the car-following lane should be emphatically analyzed.
(2)
We determine the early warning value according to TTC. When the complexity of road traffic environment is [0.75, 0.85], the early warning system is prompted for early warning. When the value is greater than 0.85, the driver is warned for early warning. The warning value calculated by this model is 2–5% higher than that calculated by TTC, which can be applied to the driving assistance system to ensure driving safety.
The model algorithm in this study can quantify the complexity of road traffic environment in real time according to the real-time changes in the road traffic environment in the process of car-following, and the quantitative results can provide design basis for the development of a vehicle early warning system. There are still some problems in our study. Restricted by the data acquisition technology, this study selects the driving simulator for the test, which is different from the real vehicle test. Subsequent researchers can do the real vehicle test with the technical permission. At the same time, this study lacks the analysis of drivers’ psychological and physiological data, which can be considered in subsequent studies.

Author Contributions

Conceptualization, W.L. and Y.C.; methodology, W.L. and Y.C.; software, H.L.; validation, H.Z.; formal analysis, H.Z.; investigation, H.L.; resources, H.L.; data curation, H.Z.; writing—original draft preparation, W.L.; writing—review and editing, W.L.; visualization, H.L.; supervision, H.L.; project administration, W.L. All authors have read and agreed to the published version of the manuscript.

Funding

This research received no external funding.

Institutional Review Board Statement

This study did not involve humans or animals.

Informed Consent Statement

Informed consent was obtained from all participants involved in the study.

Data Availability Statement

The data presented in this study are available in the paper.

Conflicts of Interest

The authors declare no conflict of interest.

References

  1. Yang, S.; Gao, L.; Yanan, Z.; Li, X. Research on the Quantitative Evaluation of the Traffic Environment Complexity for Unmanned Vehicles in Urban Roads. IEEE Access 2021, 9, 23139–23152. [Google Scholar] [CrossRef]
  2. Ding, N.; Lu, Z.; Jiao, N.; Lu, L. Quantifying effects of reverse linear perspective as a visual cue on vehicle and platoon crash risk variations in car-following using path analysis. Accid. Anal. Prev. 2021, 159, 106215. [Google Scholar] [CrossRef] [PubMed]
  3. Xu, D.; Zhao, H.; Guillemard, F.; Geronimi, S.; Aioun, F. Aware of Scene Vehicles—Probabilistic Modeling of Car-Following Behaviors in Real-World Traffic. IEEE Trans. Intell. Transp. Syst. 2019, 20, 2136–2148. [Google Scholar] [CrossRef]
  4. Wang, H.; Gu, M.; Wu, S.; Wang, C. A driver’s car-following behavior prediction model based on multi-sensors data. EURASIP J. Wirel. Commun. Netw. 2020, 10. [Google Scholar] [CrossRef]
  5. Bao, S.; Wu, L.; Yu, B.; Sayer, J.R. An examination of teen drivers’ car-following behavior under naturalistic driving conditions: With and without an advanced driving assistance system. Accid. Anal. Prev. 2020, 147, 105762. [Google Scholar] [CrossRef]
  6. Li, G.; Li, S.E.; Cheng, B. Field operational test of advanced driver assistance systems in typical Chinese road conditions: The influence of driver gender, age and aggression. Int. J. Automot. Technol. 2015, 16, 739–750. [Google Scholar] [CrossRef]
  7. Son, J.; Park, M.; Park, B.B. The effect of age, gender and roadway environment on the acceptance and effectiveness of Advanced Driver Assistance Systems. Transp. Res. Part F Traffic Psychol. Behav. 2015, 31, 12–24. [Google Scholar] [CrossRef]
  8. Kurakina, E.V.; Sklyarova, V.A. Road safety improvement in road traffic participant–vehicle–road–external environment system. Russ. Automob. Highw. Ind. J. 2020, 17, 488–499. [Google Scholar] [CrossRef]
  9. Yang, B.; Zhang, H. A CFAR Algorithm Based on Monte Carlo Method for Millimeter-Wave Radar Road Traffic Target Detection. Remote Sens. 2022, 14, 1779. [Google Scholar] [CrossRef]
  10. Geng, K.; Dong, G.; Huang, W. Robust dual-modal image quality assessment aware deep learning network for traffic targets detection of autonomous vehicles. Multimed. Tools Appl. 2022, 81, 6801–6826. [Google Scholar] [CrossRef]
  11. Redmon, J.; Divvala, S.; Girshick, R.; Farhadi, A. You Only Look Once: Unified, Real-Time Object Detection. In Proceedings of the 2016 IEEE Conference on Computer Vision and Pattern Recognition (CVPR), Las Vegas, NV, USA, June 27–30 June 2016; pp. 779–788. [Google Scholar]
  12. Fernandes, A.; Neves, J. Sensitivity of traffic safety to the pavement and road environment conditions using driving simulations. J. Transp. Saf. Secur. 2017, 10, 88–104. [Google Scholar]
  13. Larocca, A.P.C.; LemosRibeiro, R.; Figueira, A.C.; Oliveira, P.T.M.e.S.; CássioLulio, L.; CastilloRangel, M.A. Analysis of perception of vertical signaling of highways by drivers in a simulated driving environment. Transp. Res. Part F Traffic Psychol. Behav. 2018, 58, 471–487. [Google Scholar] [CrossRef]
  14. Babi, D.; Babi, D.; Sucha, M.; Stanić, V.; Toman, M. The influence of music genres on the driving behaviour of young drivers and their visual scanning of the environment. Transp. Res. Part F Traffic Psychol. Behaviour. 2021, 81, 396–407. [Google Scholar] [CrossRef]
  15. Topolšek, D.; Areh, I.; Cvahte, T. Examination of driver detection of roadside traffic signs and advertisements using eye tracking. Transp. Res. Part F Traffic Psychol. Behaviour. 2016, 43, 212–224. [Google Scholar] [CrossRef]
  16. Wang, L.; Li, H.; Li, S.; Bie, Y. Gradient illumination scheme design at the highway intersection entrance considering driver’s light adaption. Traffic Inj. Prev. 2022, 1–5. [Google Scholar] [CrossRef]
  17. Wang, L.; Li, H.; Guo, M.; Chen, Y. The Effects of Dynamic Complexity on Drivers’ Secondary Task Scanning Behavior under a Car-Following Scenario. Int. J. Environ. Res. Public Health 2022, 19, 1881. [Google Scholar] [CrossRef]
  18. Wei, Y.; Yingshi, G.; Rui, F.; Yong, M. Effect of urban road type on driver workload. J. Chang. Univ. Nat. Sci. Ed. 2014, 34, 6. [Google Scholar]
  19. Shakouri, M.; Ikuma, L.H.; Aghazadeh, F.; Nahmens, I. Analysis of the sensitivity of heart rate variability and subjective workload measures in a driving simulator: The case of highway work zones. Int. J. Ind. Ergon. 2018, 66, 136–145. [Google Scholar] [CrossRef]
  20. Faure, V.; Lobjois, R.; Benguigui, N. The effects of driving environment complexity and dual tasking on drivers’ mental workload and eye blink behavior. Transp. Res. Part F Traffic Psychol. Behav. 2016, 40, 78–90. [Google Scholar] [CrossRef]
  21. Huang, H.; Hou, L.Y. Traffic Road Sign Detection and Recognition in Natural Environment Using RGB Color Model. In Proceedings of the International Conference on Intelligent Computing, Madurai, India, 15–16 June 2017. [Google Scholar]
  22. Lee, D.; Kim, T.; Byun, H.; Choi, Y.-W. All-Weather Road Image Enhancement using Multicolor Content-Aware Color Constancy. Adv. Electr. Comput. Eng. 2018, 18, 67–78. [Google Scholar] [CrossRef]
  23. Chang, S.H.; Lee, D.Y. Driving environment complexity of mixed traffic flow: Its measurement and characteristics. Proc. East. Asia Soc. Transp. Stud. 2008, 2007, 299. [Google Scholar]
  24. Ma, Y.; Fan, L.; Gu, G. Risk Identification of In-Vehicle Information System Operation Based on Traffic Environment Complexity. In Proceedings of the 8th International Conference on Green Intelligent Transportation Systems and Safety, Changchun, China, 1–2 July 2017. [Google Scholar]
  25. Chihara, T.; Kobayashi, F.; Sakamoto, J. Estimation of mental workload during automobile driving based on eye-movement measurement with a visible light camera. Trans. JSME 2020, 86, 19–00326. [Google Scholar] [CrossRef] [Green Version]
  26. Heine, T.; Lenis, G.; Reichensperger, P.; Beran, T.; Doessel, O.; Deml, B. Electrocardiographic features for the measurement of drivers’ mental workload. Appl. Ergon. 2017, 61, 31–43. [Google Scholar] [CrossRef]
  27. Sugiono, S.; Denny, W.; Andriyani, D.P. Mental Stress Evaluation of Car Driver in Different Road Complexity Using Heart Rate Variability (HRV) Analysis. In Proceedings of the 5th International Conference on Bioinformatics Research and Applications, ICBRA, Hong Kong, China, 27–29 December 2018. [Google Scholar]
  28. Rudinbrown, C.M. The effect of driver eye height on speed choice, lane-keeping, and car-following behavior: Results of two driving simulator studies. Traffic Inj. Prev. 2006, 7, 365–372. [Google Scholar] [CrossRef]
  29. Deng, C.; Wu, C.; Cao, S.; Lyu, N. Modeling the effect of limited sight distance through fog on car-following performance using QN-ACTR cognitive architecture. Transp. Res. Part F Traffic Psychol. Behav. 2018, 65, 643–654. [Google Scholar] [CrossRef]
  30. Yongjie, D.; Ren, C.Y. Evaluation of Urban Road Traffic Environment Based on Visual Information Quantity. Traffic Inf. Saf. 2014, 32, 7. [Google Scholar]
  31. Penghui, L.; Chengwei, L.; Zhixiao, Z.; Cen, L. Cognitive impact of distraction on the handling safety of the vehicle following process. Chin. Highw. J. 2018, 31, 7. [Google Scholar]
  32. Zhixiao, Z.; Penghui, L.; Mengxia, H.; Yibing, L. Effect of visual distraction on driver-following behavior. Highw. Traffic Technol. 2020, 37, 9. [Google Scholar]
  33. Jian, L.; Jun, J. Urban Road Driver Following the Chi Behavior; Science Press: Beijing, China, 2013. [Google Scholar]
  34. Zhu, X.; Lyu, S.; Wang, X.; Zhao, Q. TPH-YOLOv5: Improved YOLOv5 Based on Transformer Prediction Head for Object Detection on Drone-captured Scenarios. In Proceedings of the IEEE/CVF International Conference on Computer Vision (ICCV) Workshops, Online, 11–17 October 2021; 2021. [Google Scholar]
  35. Lyu, N.; Duan, Z.; Ma, C.; Wu, C. Safety margins—A novel approach from risk homeostasis theory for evaluating the impact of advanced driver assistance systems on driving behavior in near-crash events. J. Intell. Transp. Syst. 2020, 1, 1–14. [Google Scholar] [CrossRef]
  36. Ge, H.; Xia, R.; Sun, H.; Yang, Y.; Huang, M. Construction and Simulation of Rear-End Conflicts Recognition Model Based on Improved TTC Algorithm. IEEE Access. 2019, 7, 134763–134771. [Google Scholar] [CrossRef]
  37. Formosa, N.; Quddus, M.; Ison, S.; Abdel-Aty, M.; Yuan, J. Predicting real-time traffic conflicts using deep learning. Accid. Anal. Prev. 2020, 136, 105429. [Google Scholar] [CrossRef] [PubMed]
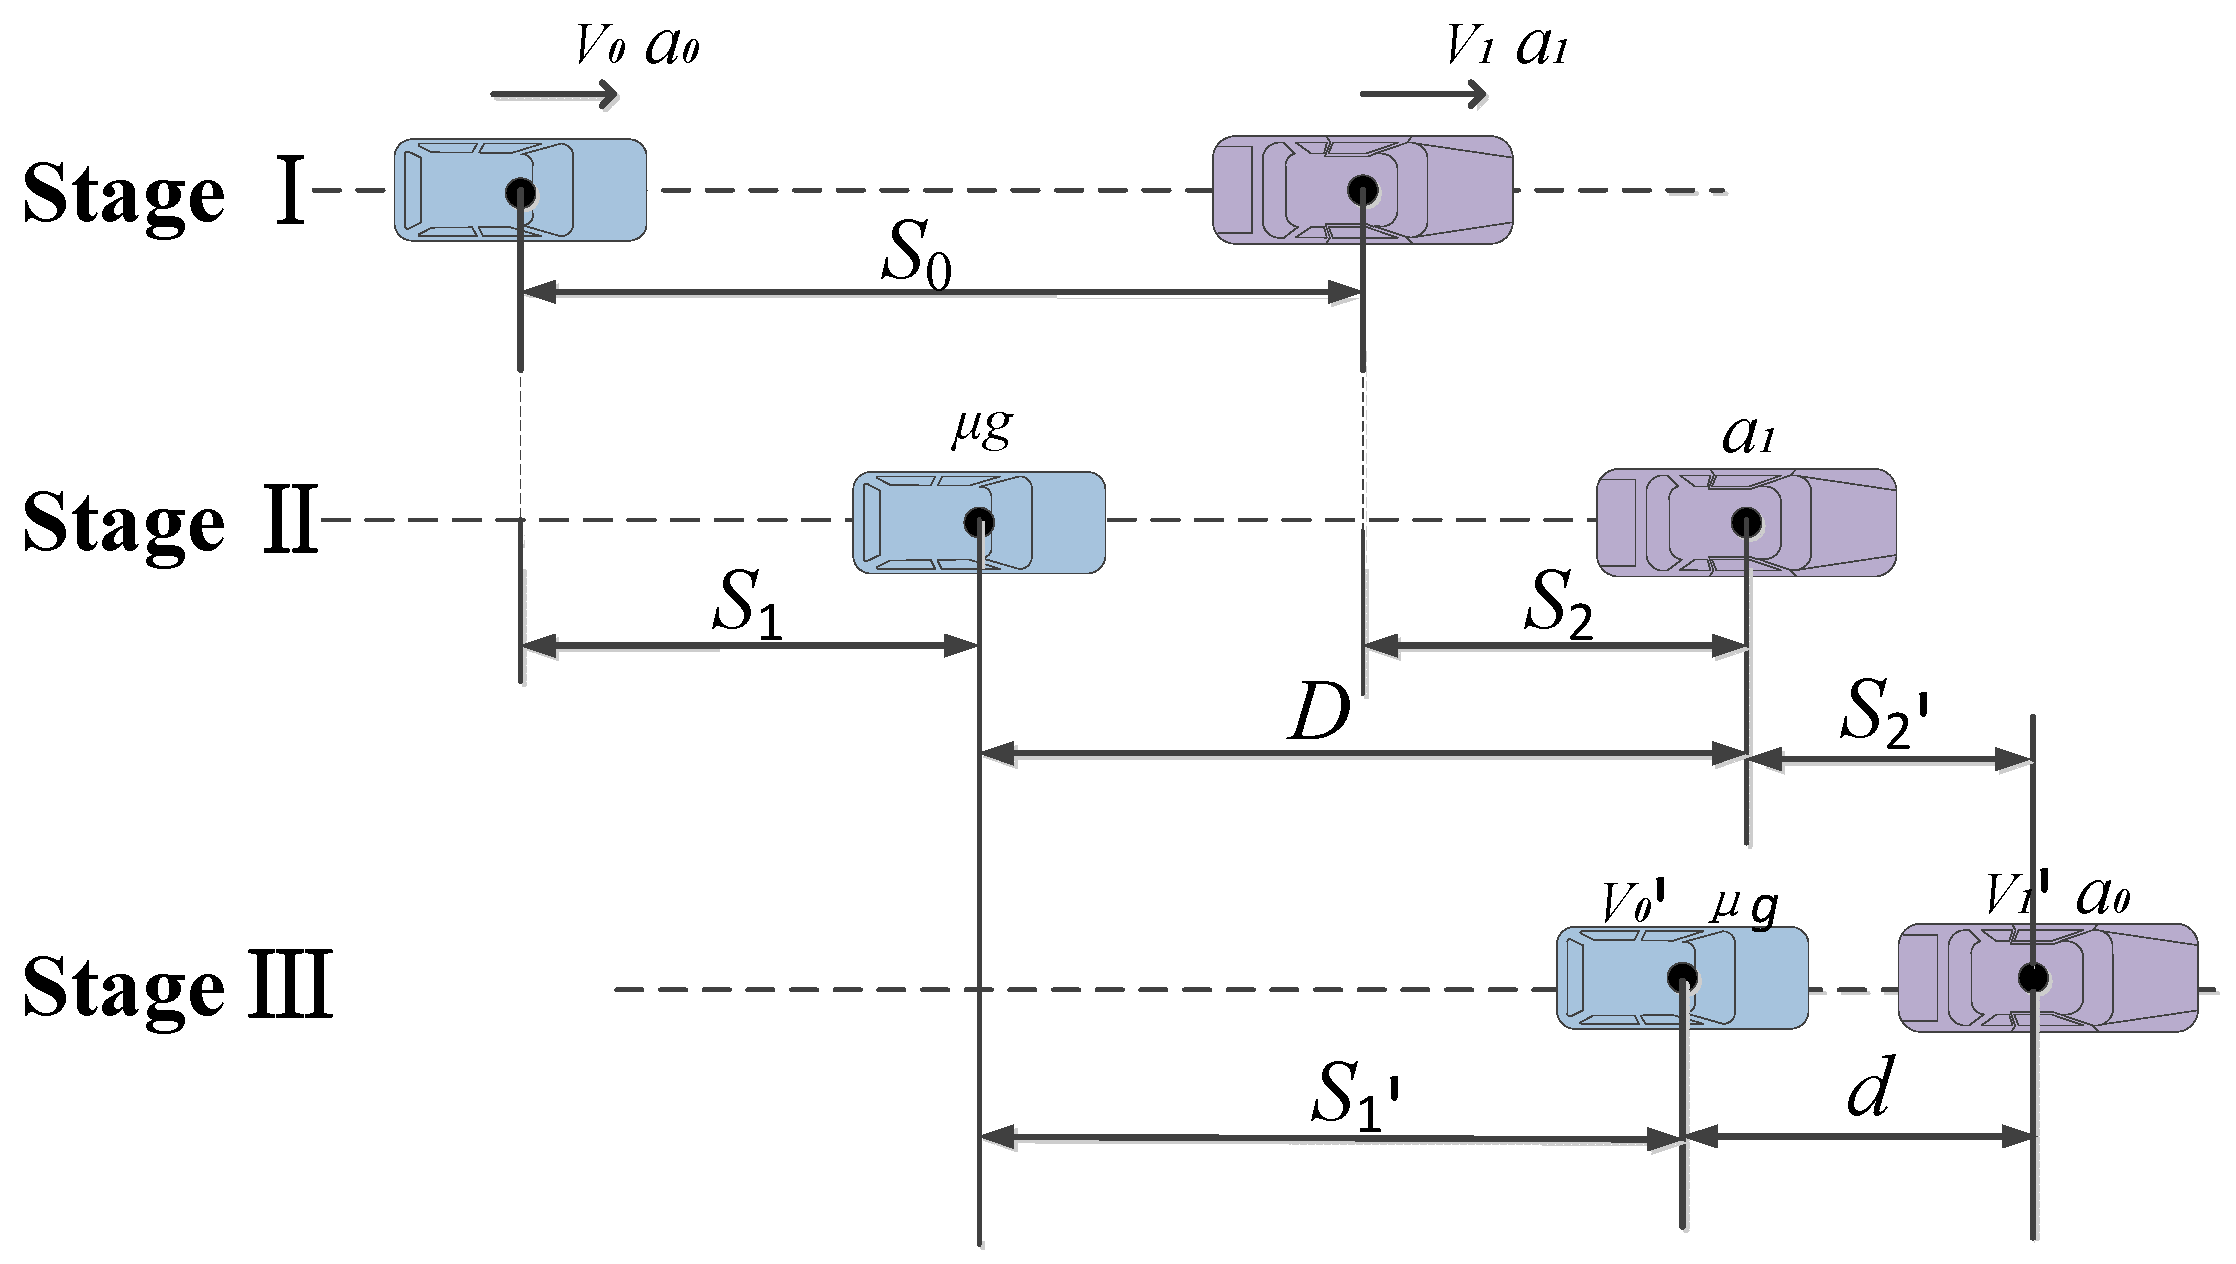
Figure 1. Three stages of car-following.
Sustainability 14 06251 g001
Figure 2. Car-following scenario.
Sustainability 14 06251 g002
Figure 3. Driving simulation test scene.
Sustainability 14 06251 g003
Figure 4. Target extraction. (a)YOLOv5 target identification; (b) target recognition extraction and target extraction.
Sustainability 14 06251 g004
Figure 5. Real−time changing road traffic environment information.
Sustainability 14 06251 g005
Figure 6. Weight calculation of each index.
Sustainability 14 06251 g006
Figure 7. Complexity of road traffic environment caused by car-following.
Sustainability 14 06251 g007
Figure 8. Vehicle running status before and after the car−following stage. (a) Vehicle speed relationship; (b) front and rear accelerations; (c) the distance between the front and rear cars.
Sustainability 14 06251 g008
Figure 9. The complexity quantification value of other lane road traffic environment.
Sustainability 14 06251 g009
Figure 10. Comprehensive complexity calculation results.
Sustainability 14 06251 g010
Figure 11. Comprehensive complexity calculation results and marks. Mark point 1 is a normal road traffic environment, the vehicle in the urban road is mostly in such a scenario; marking point 2 is an uncomplicated road traffic environment.
Sustainability 14 06251 g011
Figure 12. Complex road traffic environment at marker 1.
Sustainability 14 06251 g012
Figure 13. Complex road traffic environment at marker 2.
Sustainability 14 06251 g013
Figure 14. Road traffic environment complexity calculation. (a) Complexity surface; (b) contour surface.
Sustainability 14 06251 g014
Figure 15. TTC-based warning value calculation. (a) Warning surface; (b) early warning contour.
Sustainability 14 06251 g015
Figure 16. Difference calculation. (a) Difference surface; (b) contour of difference surface.
Sustainability 14 06251 g016
Table 1. Coding of each index.
Index Code Index Code
Distance (m)X1Pedestrian pixel area (px2)X8
Self car speed (km/h)X2Car pixel area (px2)X9
Front car speed (km/h)X3Bicycle pixel area (px2)X10
Steering wheel operation (%)X4Pixel area of the traffic signal light (px2)X11
Open throttle pedal (%)X5Speed limit card pixel area (px2)X12
Brake pedal opening and closing degree (%)X6Road alignment pixel area (px2)X13
Bus pixel area (px2)X7
Table 2. The RGB range of the target objects.
Target Object/RGB ScopeRGB
Bus[55, 75][215, 224][125, 140]
Pedestrian[255, 256][45, 60][45, 60]
Car[250, 256][110, 120][20, 35]
Bicycle[250, 256][150, 165][145, 155]
Signboard[80, 170][10, 70][10, 70]
Traffic light[0, 10][205, 224][180, 195]
Road marking[160, 220][170, 220][170, 220]
Table 3. KMO and Bartlett test.
Number of KMO Sampling0.801
Bartlett spherical testApproximate chi square939.589
Free degree78
Significance0
Table 4. Principal component feature vector.
Indicators\Loads123456
X10.2050.6020.178−0.0970.2060.366
X20.853−0.058−0.1690.167−0.0550.064
X30.831−0.249−0.134−0.0120.0260.011
X4−0.122−0.065−0.2240.045−0.2180.562
X50.2680.7150.1110.066−0.040.016
X60.0410.524−0.060.1380.048−0.333
X70.335−0.0370.21−0.4710.03−0.384
X8−0.0010.0850.6740.197−0.3830.118
X90.161−0.2710.2740.3730.25−0.064
X10−0.0020.23−0.62−0.15−0.1750.1
X110.061−0.1040.191−0.2480.6190.48
X12−0.2040.123−0.2010.2030.609−0.235
X130.031−0.002−0.1130.7680.0460.061
Table 5. Total variance interpretation of each principal component.
ComponentExtraction of Square Sum of Loads
TotalVariance ProportionAccumulation (%)
11.73413.33813.338
21.37810.60223.939
31.1929.17133.111
41.1779.05742.168
51.0958.41950.587
61.0297.91758.504
Publisher’s Note: MDPI stays neutral with regard to jurisdictional claims in published maps and institutional affiliations.