Article

Turbulent Kinetic Energy Distribution around Experimental Permeable Spur Dike

1
Key Laboratory of Hydraulic and Waterway Engineering of Ministry of Education, Chongqing Jiaotong University, Chongqing 400074, China
2
National Engineering Research Center for Inland Waterway Regulation, Chongqing Jiaotong University, Chongqing 400074, China
3
CCCC Second Harbor Engineering Construction Technology Company Ltd., Wuhan 430048, China
4
School of Civil Engineering, Chongqing Jiaotong University, Chongqing 400074, China
*
Author to whom correspondence should be addressed.
Sustainability 2022, 14(10), 6250; https://doi.org/10.3390/su14106250
Submission received: 7 April 2022 / Revised: 13 May 2022 / Accepted: 19 May 2022 / Published: 20 May 2022

Abstract

:
The spur dike is widely used in the waterway renovation project in the upper reaches of the Yangtze River as a remediation structure, but its water destruction is very common, and the influence of the permeable characteristics of the riprap spur dike on its stability has been neglected in many studies. Through the method of combining a generalized flume test and theoretical analysis, the influence of the submerged degree of the permeable spur dike, the porosity of the spur dike body, and the size of the void on its nearby turbulent kinetic energy is studied. The results show that the turbulent kinetic energy in the front of the spur dike increases with the increase of the submerged degree, decreases with the increase of the porosity, and first increases and then decreases with the increase of the pore size. At the axis of the dike, the turbulent kinetic energy increases with the increase of the submerged degree, decreases first and then increases with the increase of the porosity, and increases with the increase of the pore size. In the rear area of the dike, the turbulent kinetic energy decreases with the increase of the submerged degree, firstly decreases and then increases with the increase of the porosity, and first increases and then decreases with the increase of the pore size. The research results are of great significance to further understanding the water dike age of a permeable spur dike, and can provide scientific guidance for the design and restoration of spur dikes.

1. Introduction

As a regulation structure, the spur dike plays an irreplaceable role in improving channels and maintaining rivers, but it is also an indisputable fact that the natural river flow pattern is destroyed locally, the flow structure becomes more complicated, and the three-dimensional turbulence property is enhanced after its construction. She et al. (2016) [1] analyzed the relationship between the shape of the local scour pit at the head of the submerged spur dike, the maximum drawing depth, and the width of the bottom protection through model tests; Cai et al. (2018) [2] studied the quantitative relationship between water flow force and spur dike length by combining numerical simulations and physical experiments; Kong et al. (2020) [3] analyzed the influence of wave period and water depth on the sediment threshold through field tests; Ren et al. (2016) [4] used a moving-bed model test to study the influence of the water permeability of the hydraulic insert on the slow flow effect, local scour, and siltation behind the dike; Xu et al. (2019) [5] studied the effect of porosity and pore size on the water surface line of the permeable spur dike; Wei et al. (2020) [6] analyzed the distribution laws of turbulent kinetic energy and the turbulent kinetic energy budget through the experiment of a low Freud number in a narrow flume; Zhong et al. (2020) [7] studied the turbulent flow characteristics of open channels with dense-row rough-bed surfaces through turbulent PIV flow field test data; Wang et al. (2020) [8] analyzed the distribution of turbulent strength, Reynolds stress, and turbulent kinetic energy in the wide and narrow channels by a generalized model test in a laboratory; Pang et al. (2020) [9] analyzed the tradeoff among turbulent kinetic energy, and wave and suspended matter deposition through a field observation; Puzdrowska and Heese (2019) [10] analyzed the turbulent kinetic energy in a bolted fishway and found differences in velocity and turbulent kinetic energy distribution; Gao et al. (2007) [11] studied the distribution law of flow kinetic energy around a spur dike by means of a flume test and theoretical analysis; and Kumar and Ojha (2019) [12] studied the turbulent characteristics of a non-submerged hook spur dike through a model test, and obtained the relationship between turbulent kinetic energy and the bed shear stress. By means of a model test and theoretical analysis, the authors studied the hydraulic characteristics of the super dike, the influential factors of turbulence, and the distribution of turbulent kinetic energy around different hydraulic structures. From the above analysis, it can be found that in the past, spur dikes were considered as impermeable entities, and the influence of porosity on water flow turbulence was not considered.
The local changes caused by the construction of spur dikes affected the flow pattern of the river. The generation, separation, and attenuation of the vortex at the tail of the spur dike make the water flow exhibit strong three-dimensional turbulence characteristics, and the corresponding flow structure becomes very complicated. Discussing the flow structure near the spur dike not only has important hydraulic research value, but also has practical guiding significance for the practical engineering application of the spur dike. In this paper, the influence of factors such as water depth, porosity, and pore size on the turbulent kinetic energy near the permeable spur dike is analyzed by the combination of a flume model test and theoretical analysis.

2. Physical Model

The test was carried out in a rectangular glass flume of 30 m length, 2.0 m width, and 1.0 m height. The cross section of the model spur dike is trapezoidal and the head of the spur dike is arc-shaped. The specific dimensions of the spur dike in the experiment are as follows: the dike length L = 50 cm, the dike top width Wt = 7.5 cm, the dike height H = 10 cm, the dike bottom width Wb = 42.5 cm, the upstream slope ratio m1 = 1:1.5, the backwater slope ratio m2 = 1:2, and the downstream slope ratio m3 = 1:2.5. The specific layout is shown in Figure 1.
The geometric scale of the model is λ = 40. Taking the roughness of the prototype channel np as 0.025, the flow velocity scale λV, roughness scale λn, and the model roughness nm in the test are:
λ V = 40 = 6.325
λ n = λ h 1 / 6 = 40 1 / 6 = 1.85
n m = n p λ n = 0.025 1.85 = 0.0135
Three control water depths were designed for the experiment: h1 = 11 cm (Q1 = 65 L/s), h2 = 14 cm (Q2 = 95 L/s), and h3 = 17 cm (Q3 = 135 L/s); dike porosity: P1 = 6.8%, P2 = 14.1% and P3 = 22.5%. The pore sizes of the spur dikes are R1 = 16 mm, R2 = 20 mm, and R3 = 32 mm. Table 1 shows the specific test conditions. In the test, the incoming flow velocity range is 0.25~0.4 m/s. A total of 13 cross sections for the velocity observation were arranged in the experimental section near the spur dike, and seven observation points were arranged on each cross section, where acoustic Doppler velocimeter (ADV) data were collected at 13 cross sections through the flume (Figure 1). The velocity data were collected at each observation point using the three-point method (0.2h, 0.6h, and 0.8h). The arrangement of the observed sections of groin and velocity is shown in Figure 1.

3. Calculation Method of Turbulent Kinetic Energy

The turbulent kinetic energy (TKE) of water flow can be calculated by the following equation, which is commonly used in several works (e.g., Penna et al., 2020 [13]):
T K E = 1 2 u u ¯ + v v ¯ + w w ¯
where u , v , and w are the temporal velocity fluctuation in the streamwise, spanwise, and vertical directions. In this paper, the average inlet flow velocity V0 (0.6h flow velocity) is used to treat the dimensionless turbulent kinetic energy, and the dimensionless form E / V 0 2 is obtained.
The turbulent kinetic energy of the water flow plays a crucial role in sediment suspension and riverbed evolution. Different intensities of turbulent kinetic energy have different effects on the changes of the river bed morphology and the failure of spur dikes. The greater the turbulent kinetic energy, the greater the impact. In this paper, the representative dike front-section, dike axis-section, and dike rear-section are selected for turbulent kinetic energy analysis.

4. Flow Turbulence Kinetic Energy Distribution

4.1. Effect of Submergence Degree on Kinetic Energy of Flow Turbulence

The void size (R1 = 16 mm) and void ratio (P1 = 6.8%) remain unchanged. Three submerged conditions, i.e., control water depth h1 = 11 cm (Q1 = 65 L/s), h2 = 14 cm (Q2 = 95 L/s), and h3 = 17 cm (Q3 = 135 L/s), are selected. The distributions of the turbulent kinetic energy at 0.2h, 0.6h, and 0.8h along the front section (2# cross section), the axis section (4# cross section), and the rear section (6# cross section) of the dike were analyzed.
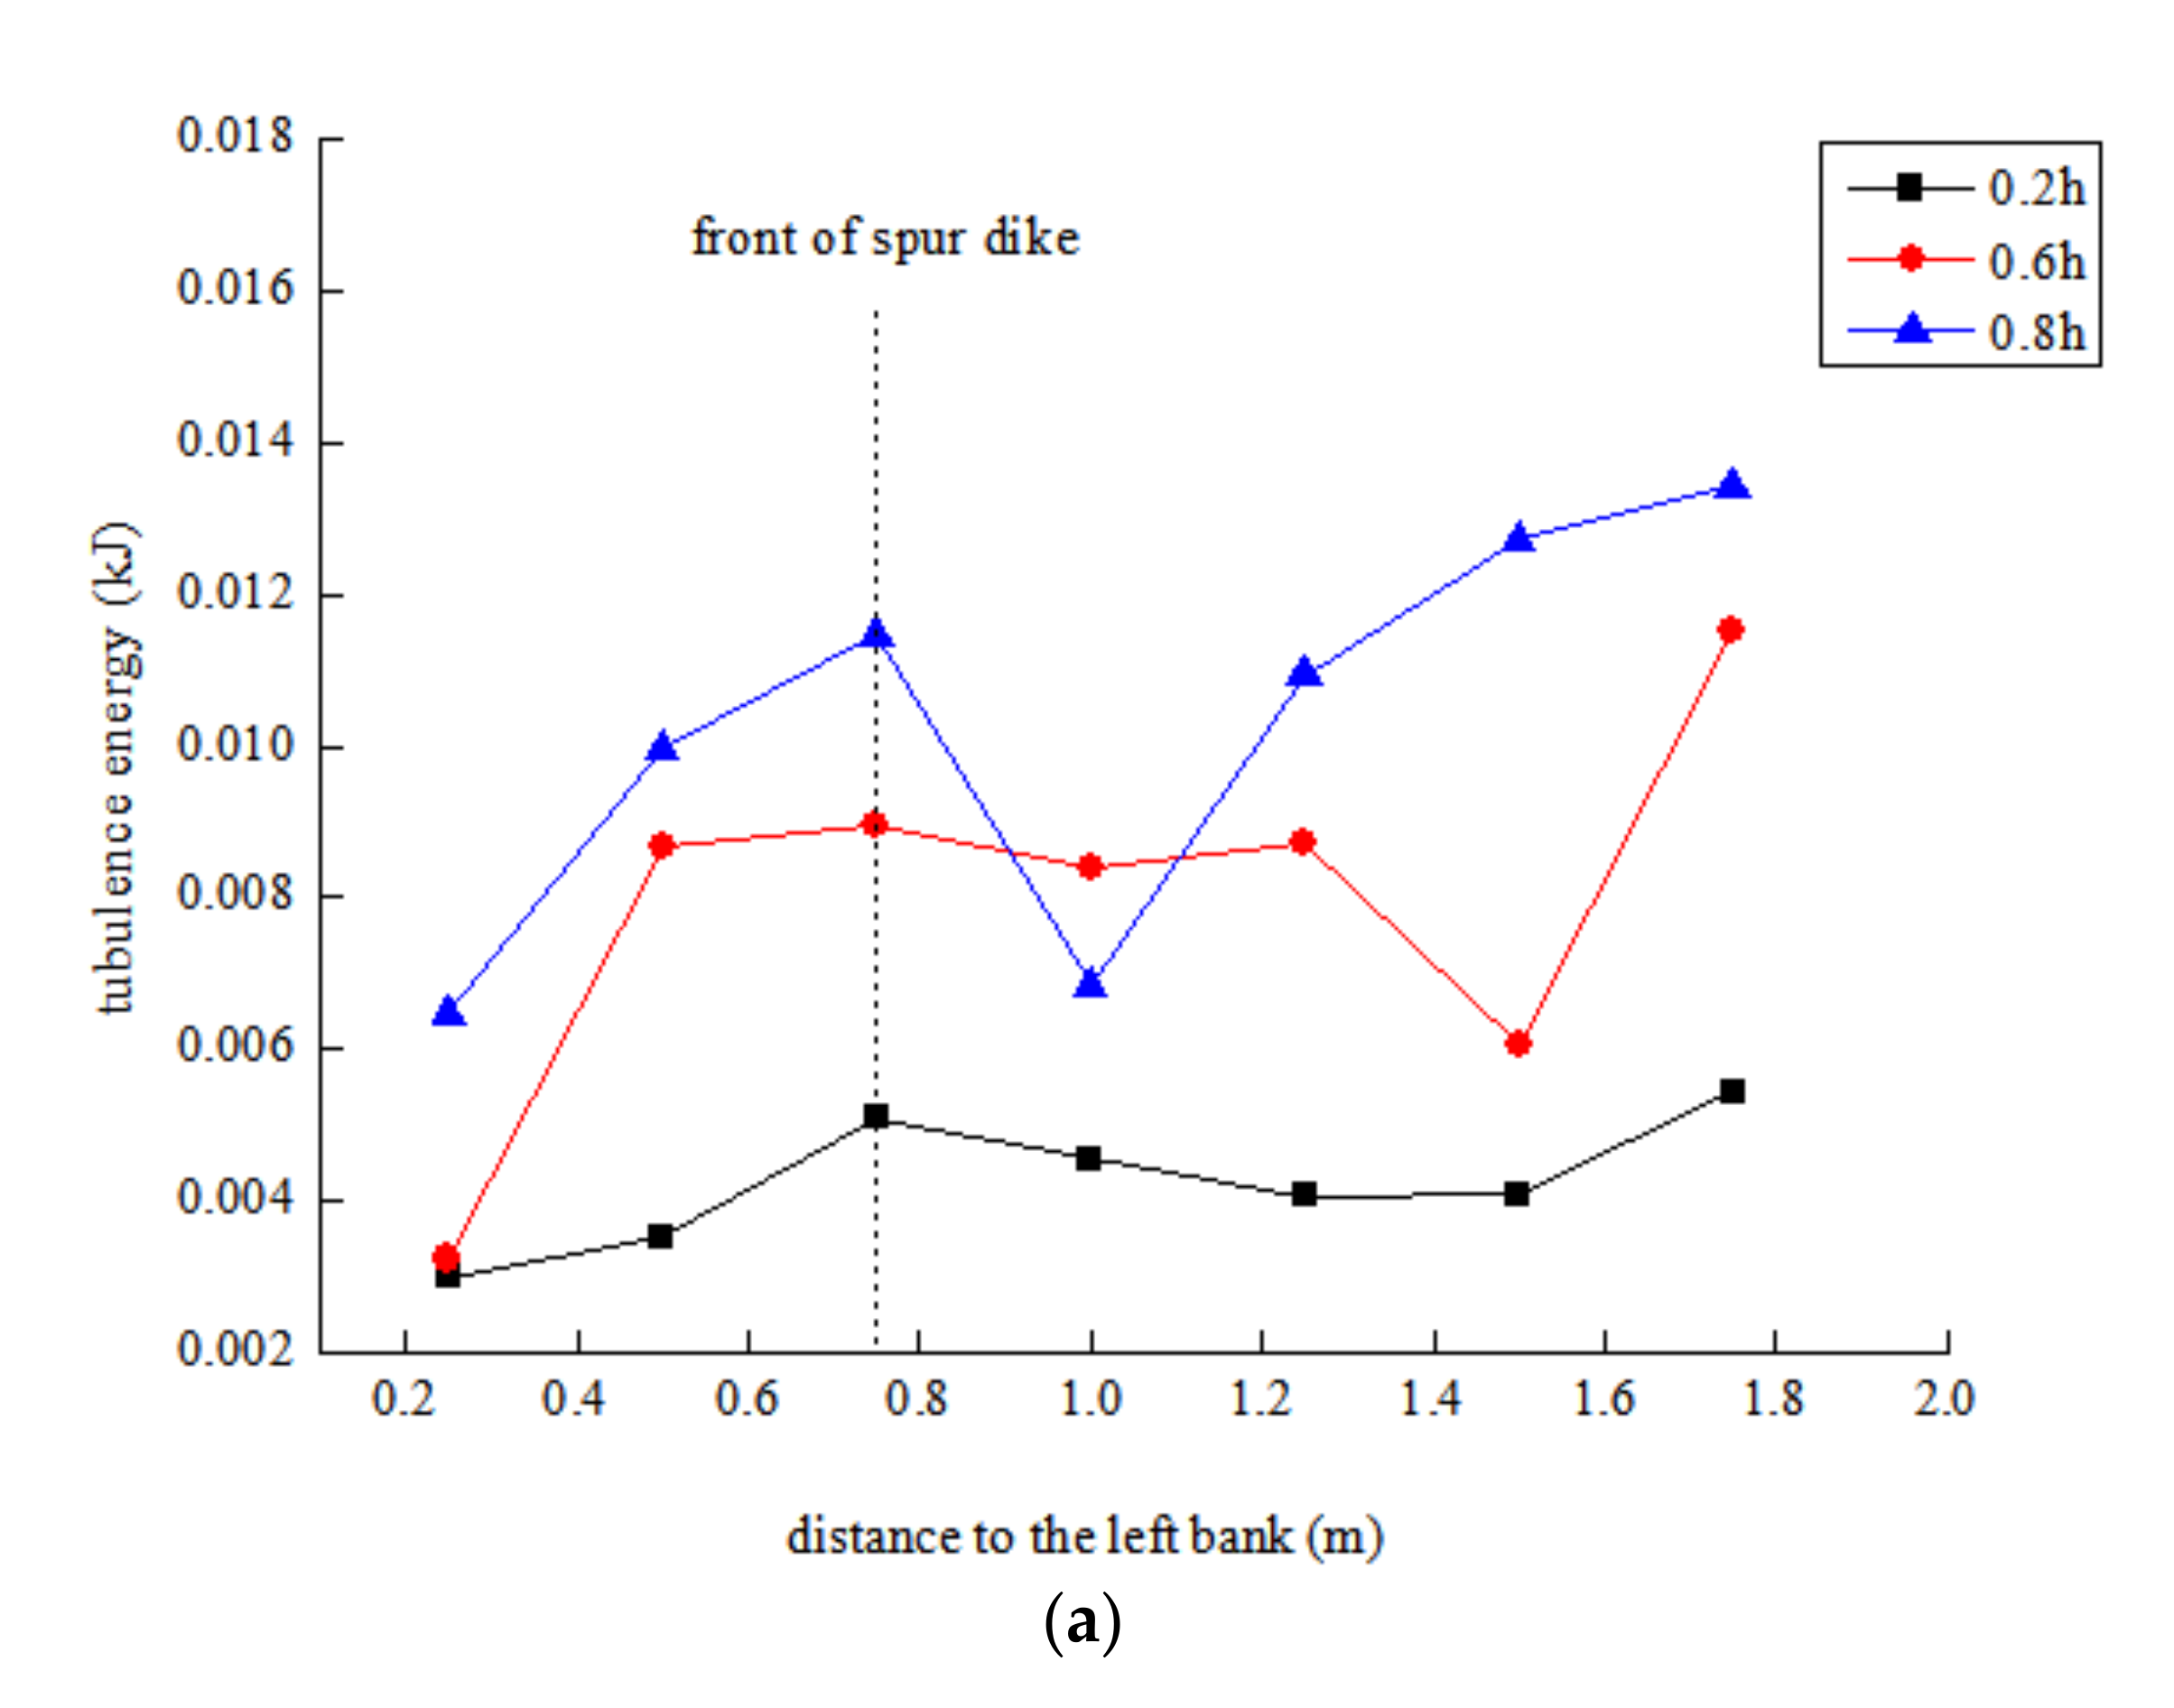
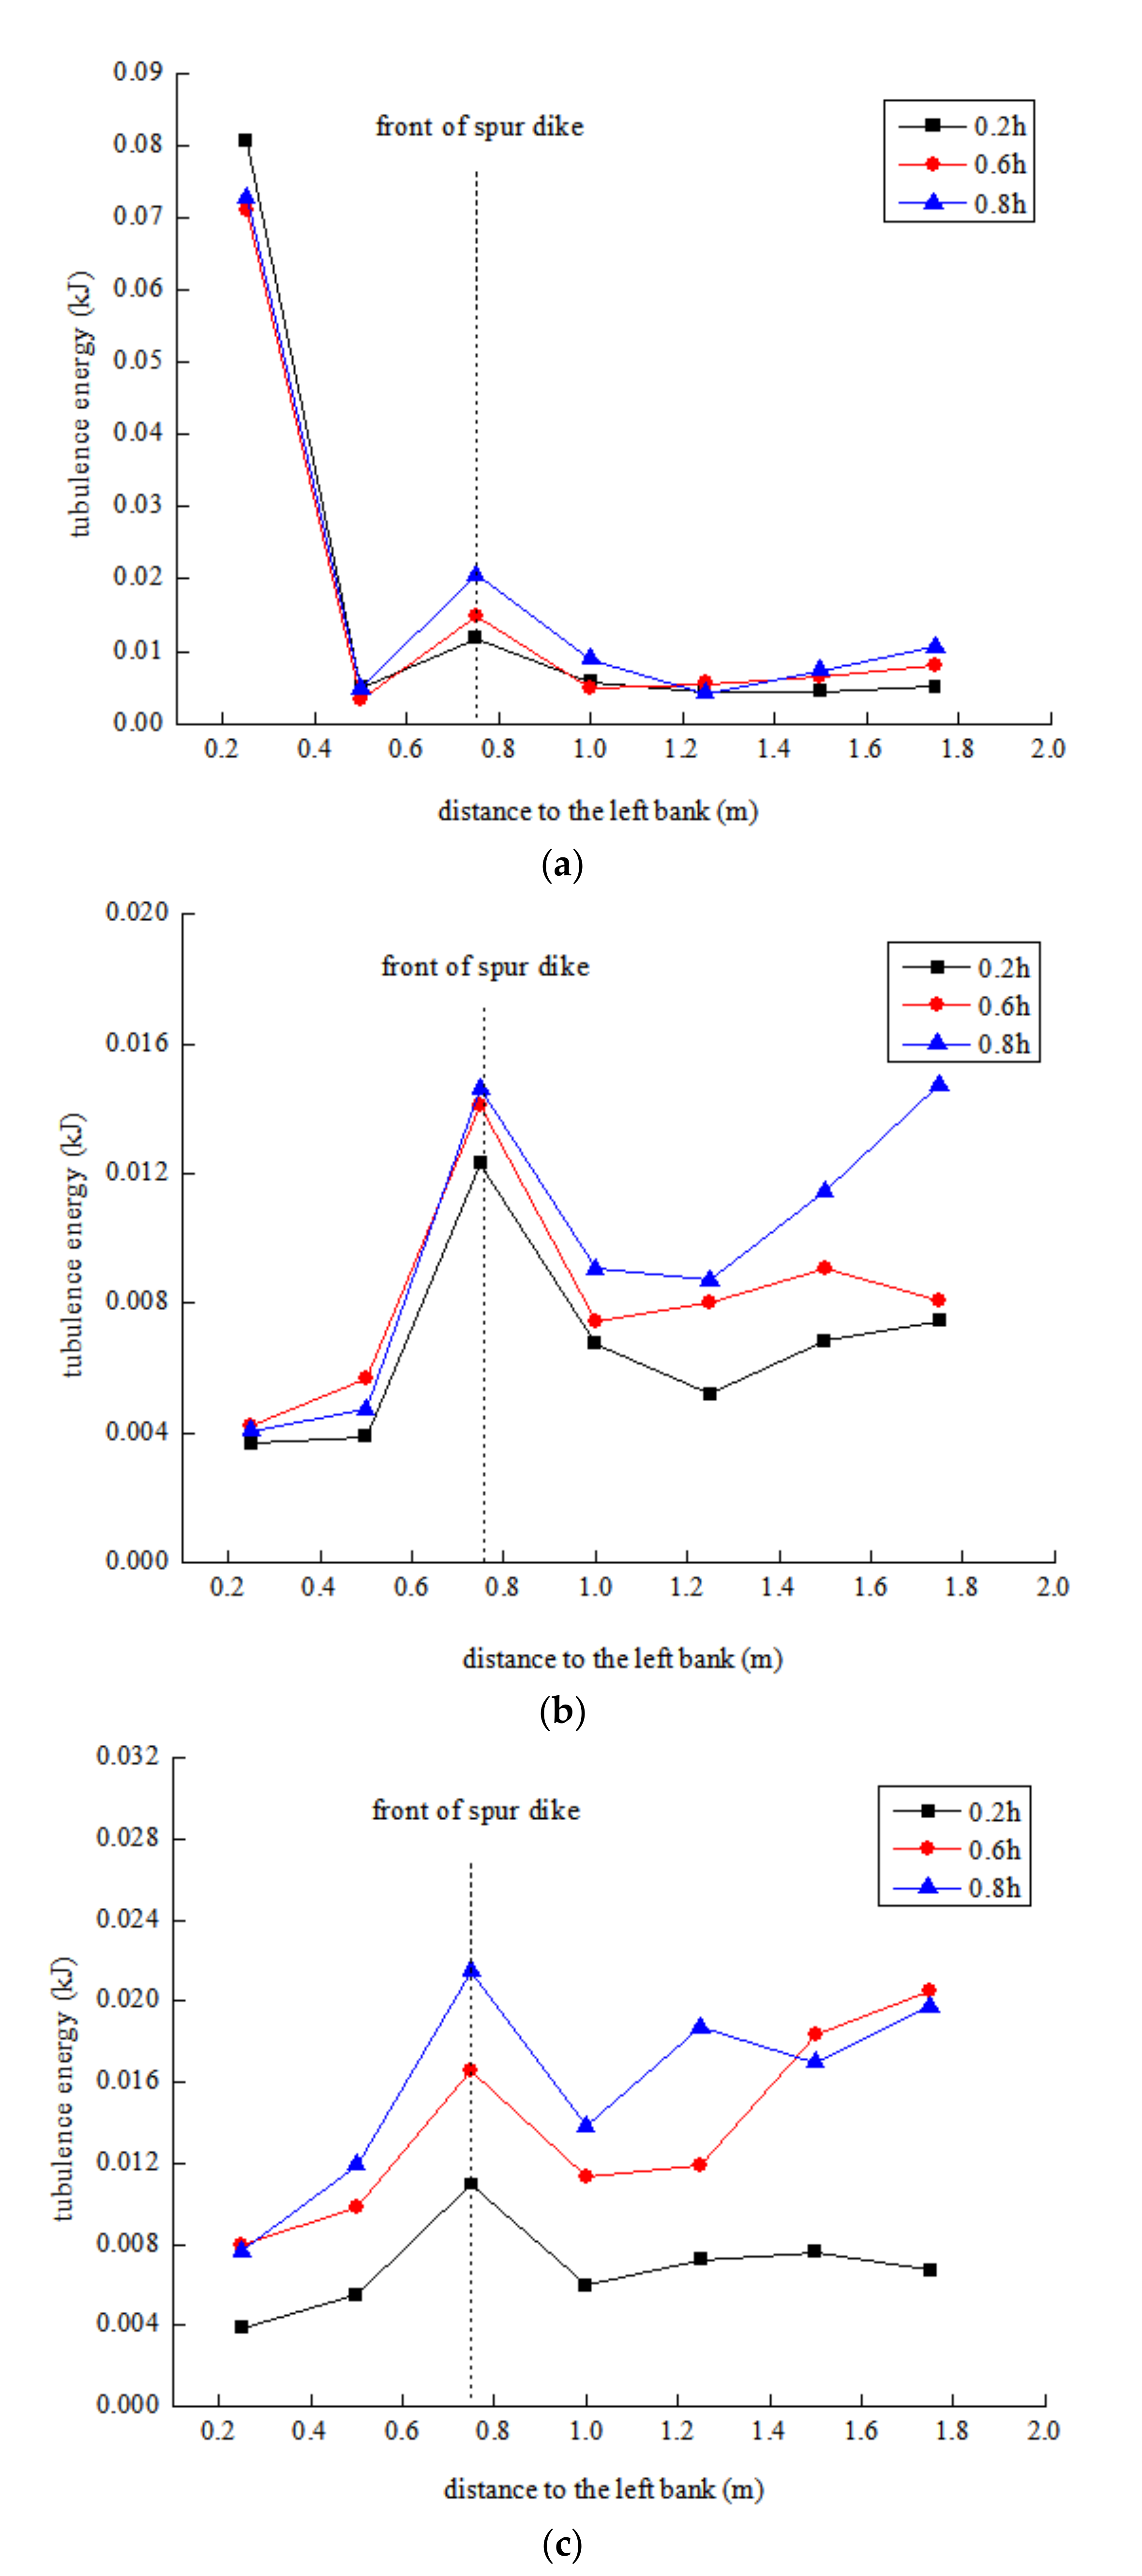
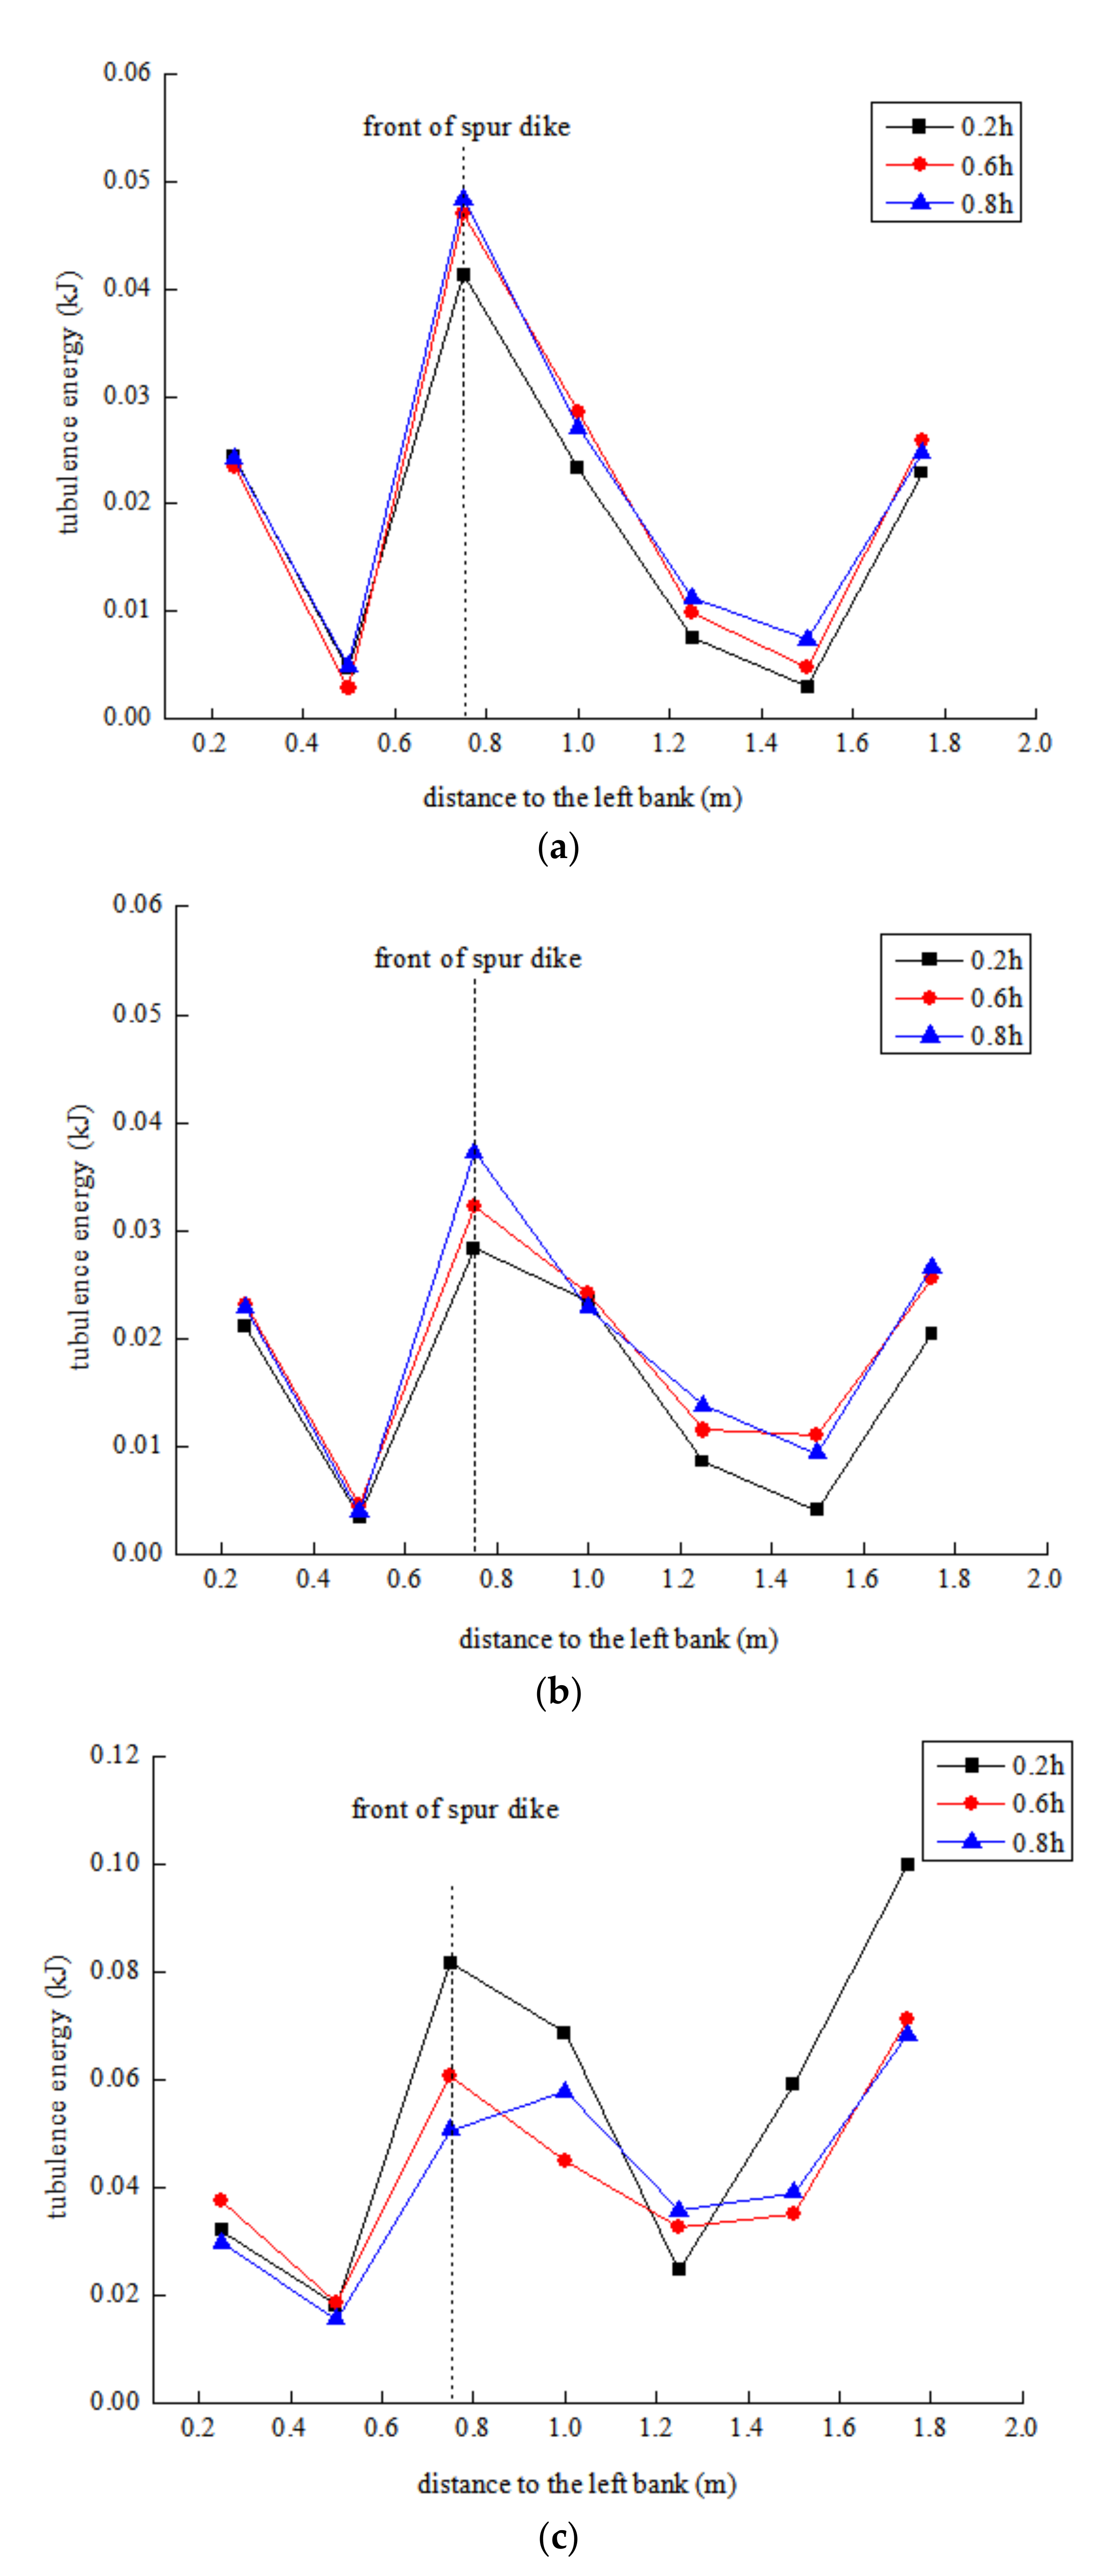
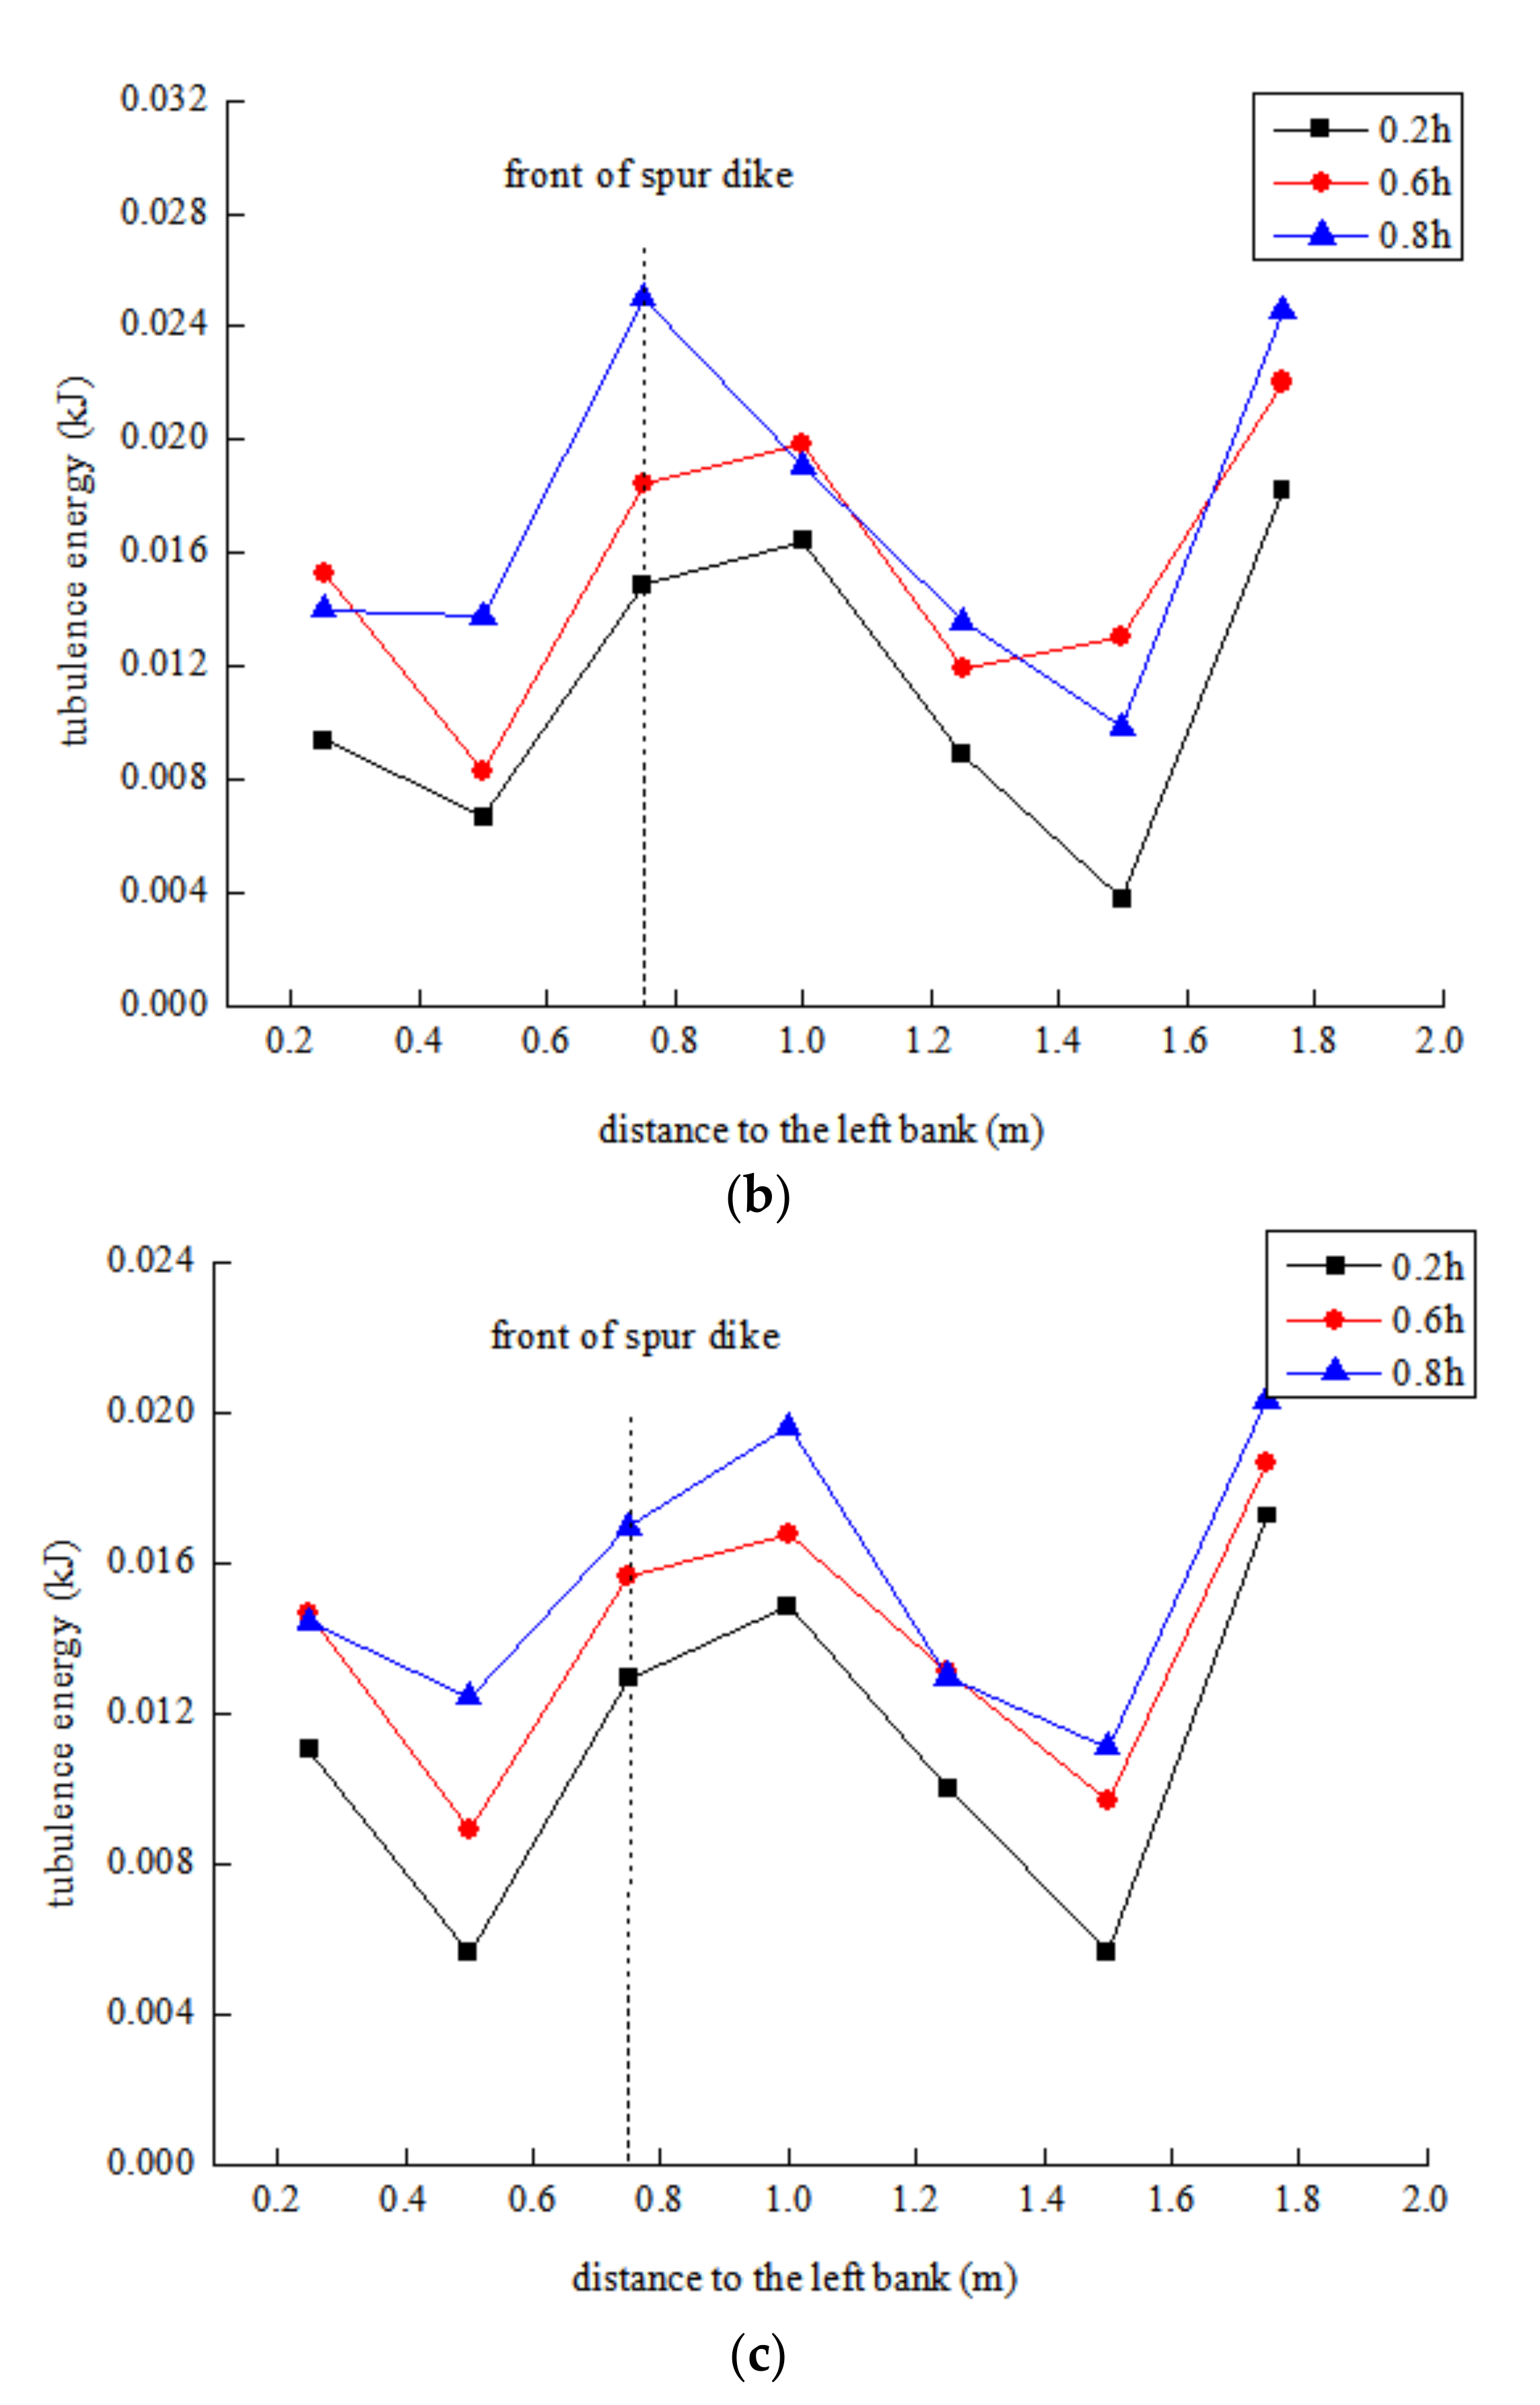
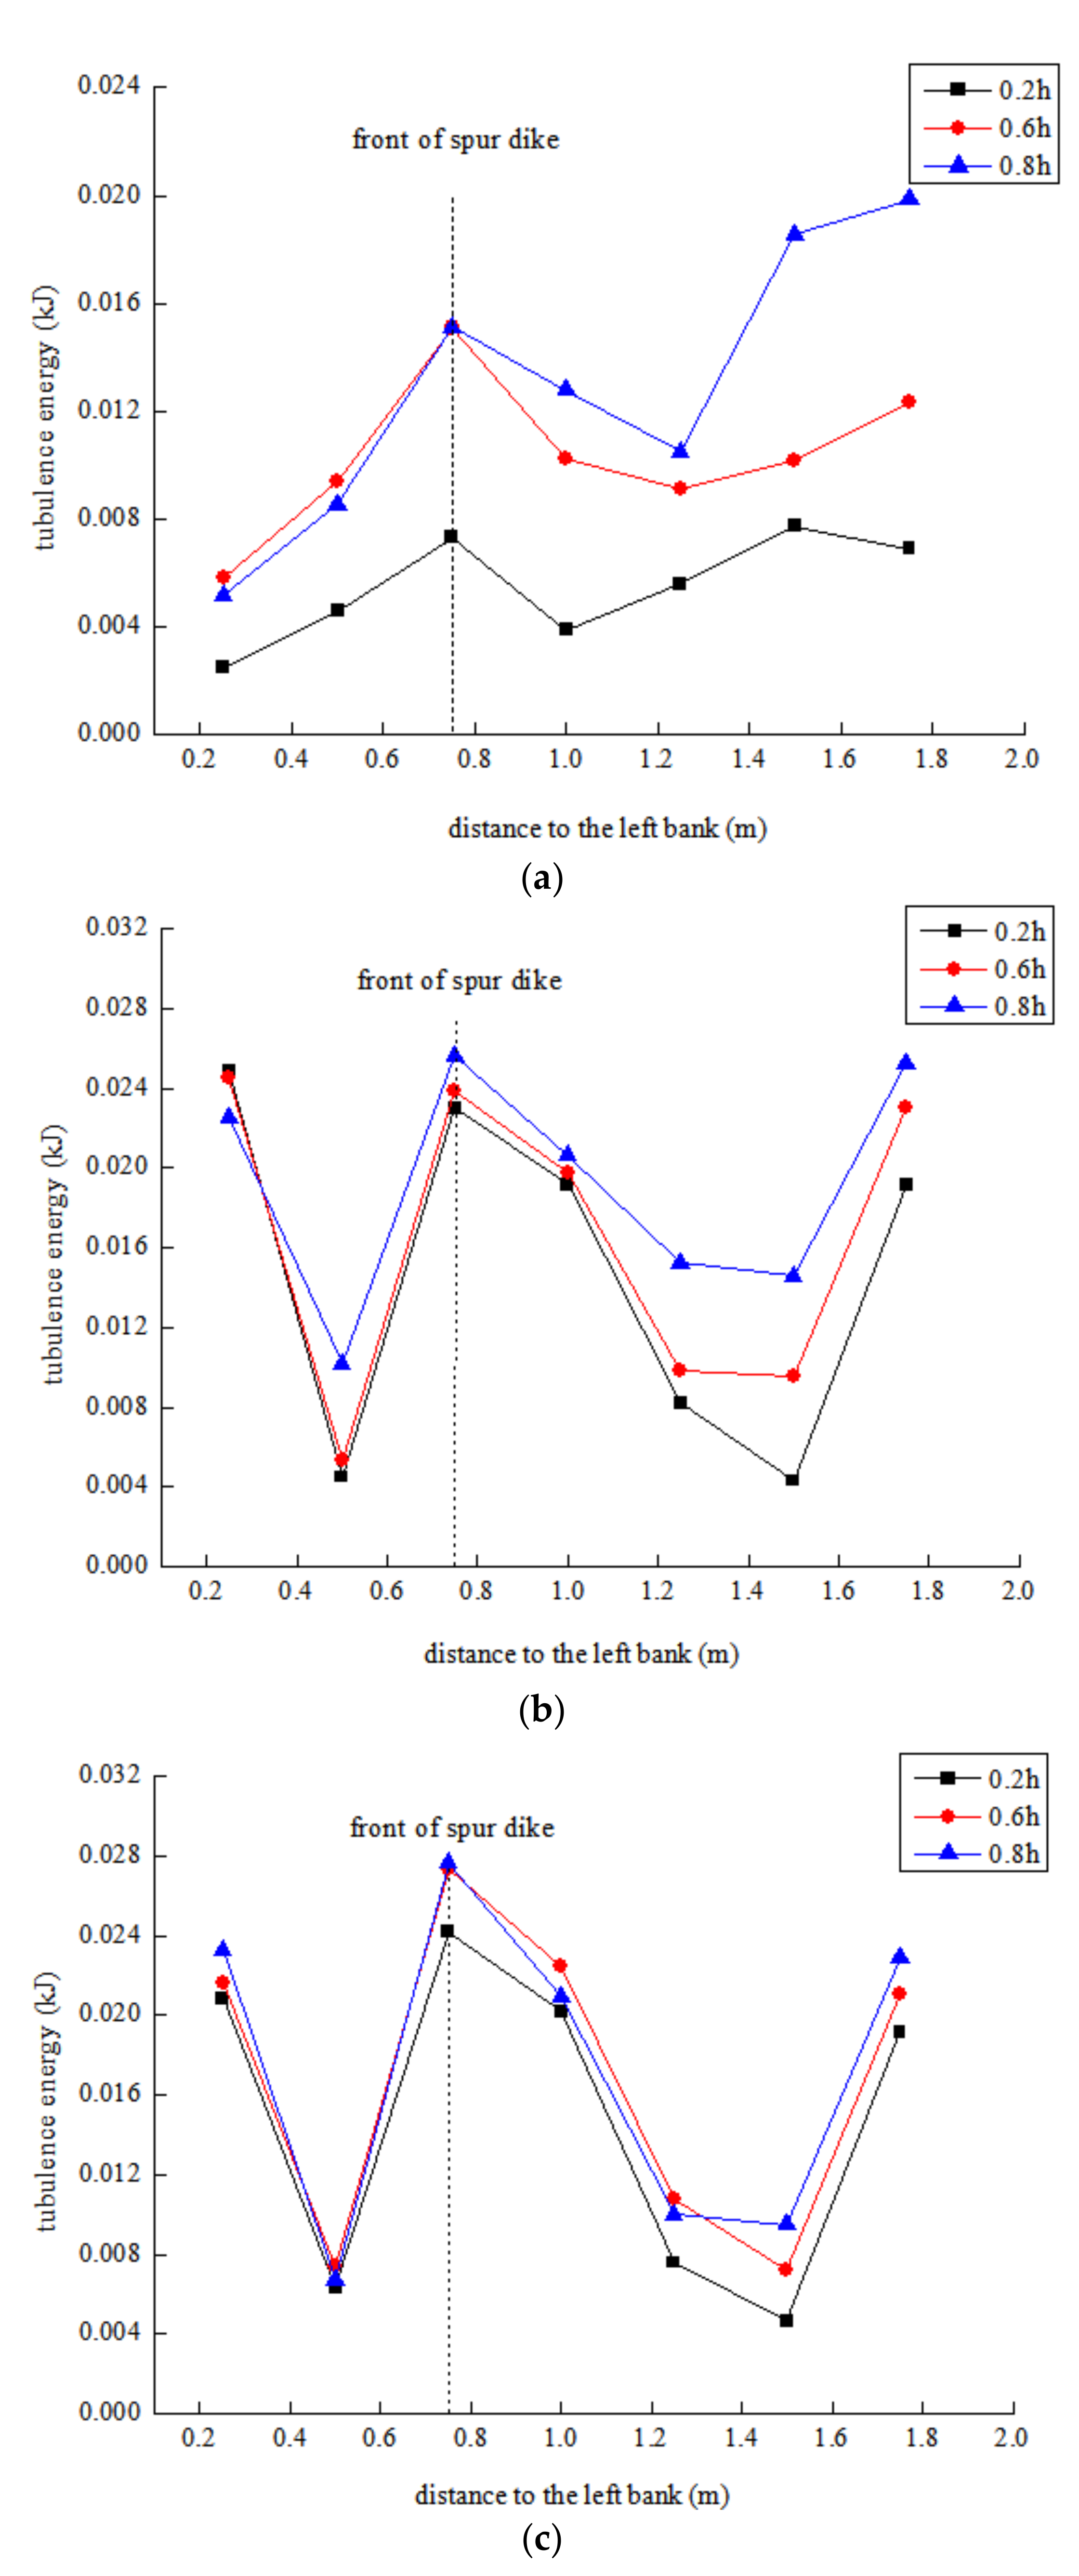
It can be seen from Figure 2, Figure 3 and Figure 4 that in the front section of the spur dike, the distribution of turbulent kinetic energy is the smallest at 0.2h, followed by 0.6h, and the largest is at 0.8h, and the turbulent kinetic energy increases with the increase of the submergence degree. At the cross section of the dike axis, the turbulent kinetic energy is the smallest at 0.2h, followed by 0.6h, and it is the largest at 0.8h. The magnitude of turbulent kinetic energy increases with the increase of the submergence degree. The position of the maximum turbulent kinetic energy changes with the increase of the submergence degree: when h = 11 cm, the maximum turbulent kinetic energy appears at the dike root; when h = 14 cm or 17 cm, the maximum turbulent kinetic energy appears at the front of the dike head. This is because when the spur dike is at the depth of just-submerged, the water flow at the top of the dike is unstable and fluctuates greatly, so the turbulent kinetic energy at the dike root is larger, and when the spur dike is completely submerged, the mixing effect of the flow around the dike head and the flow over the dike is enhanced, resulting in a large increase in the turbulent kinetic energy here.
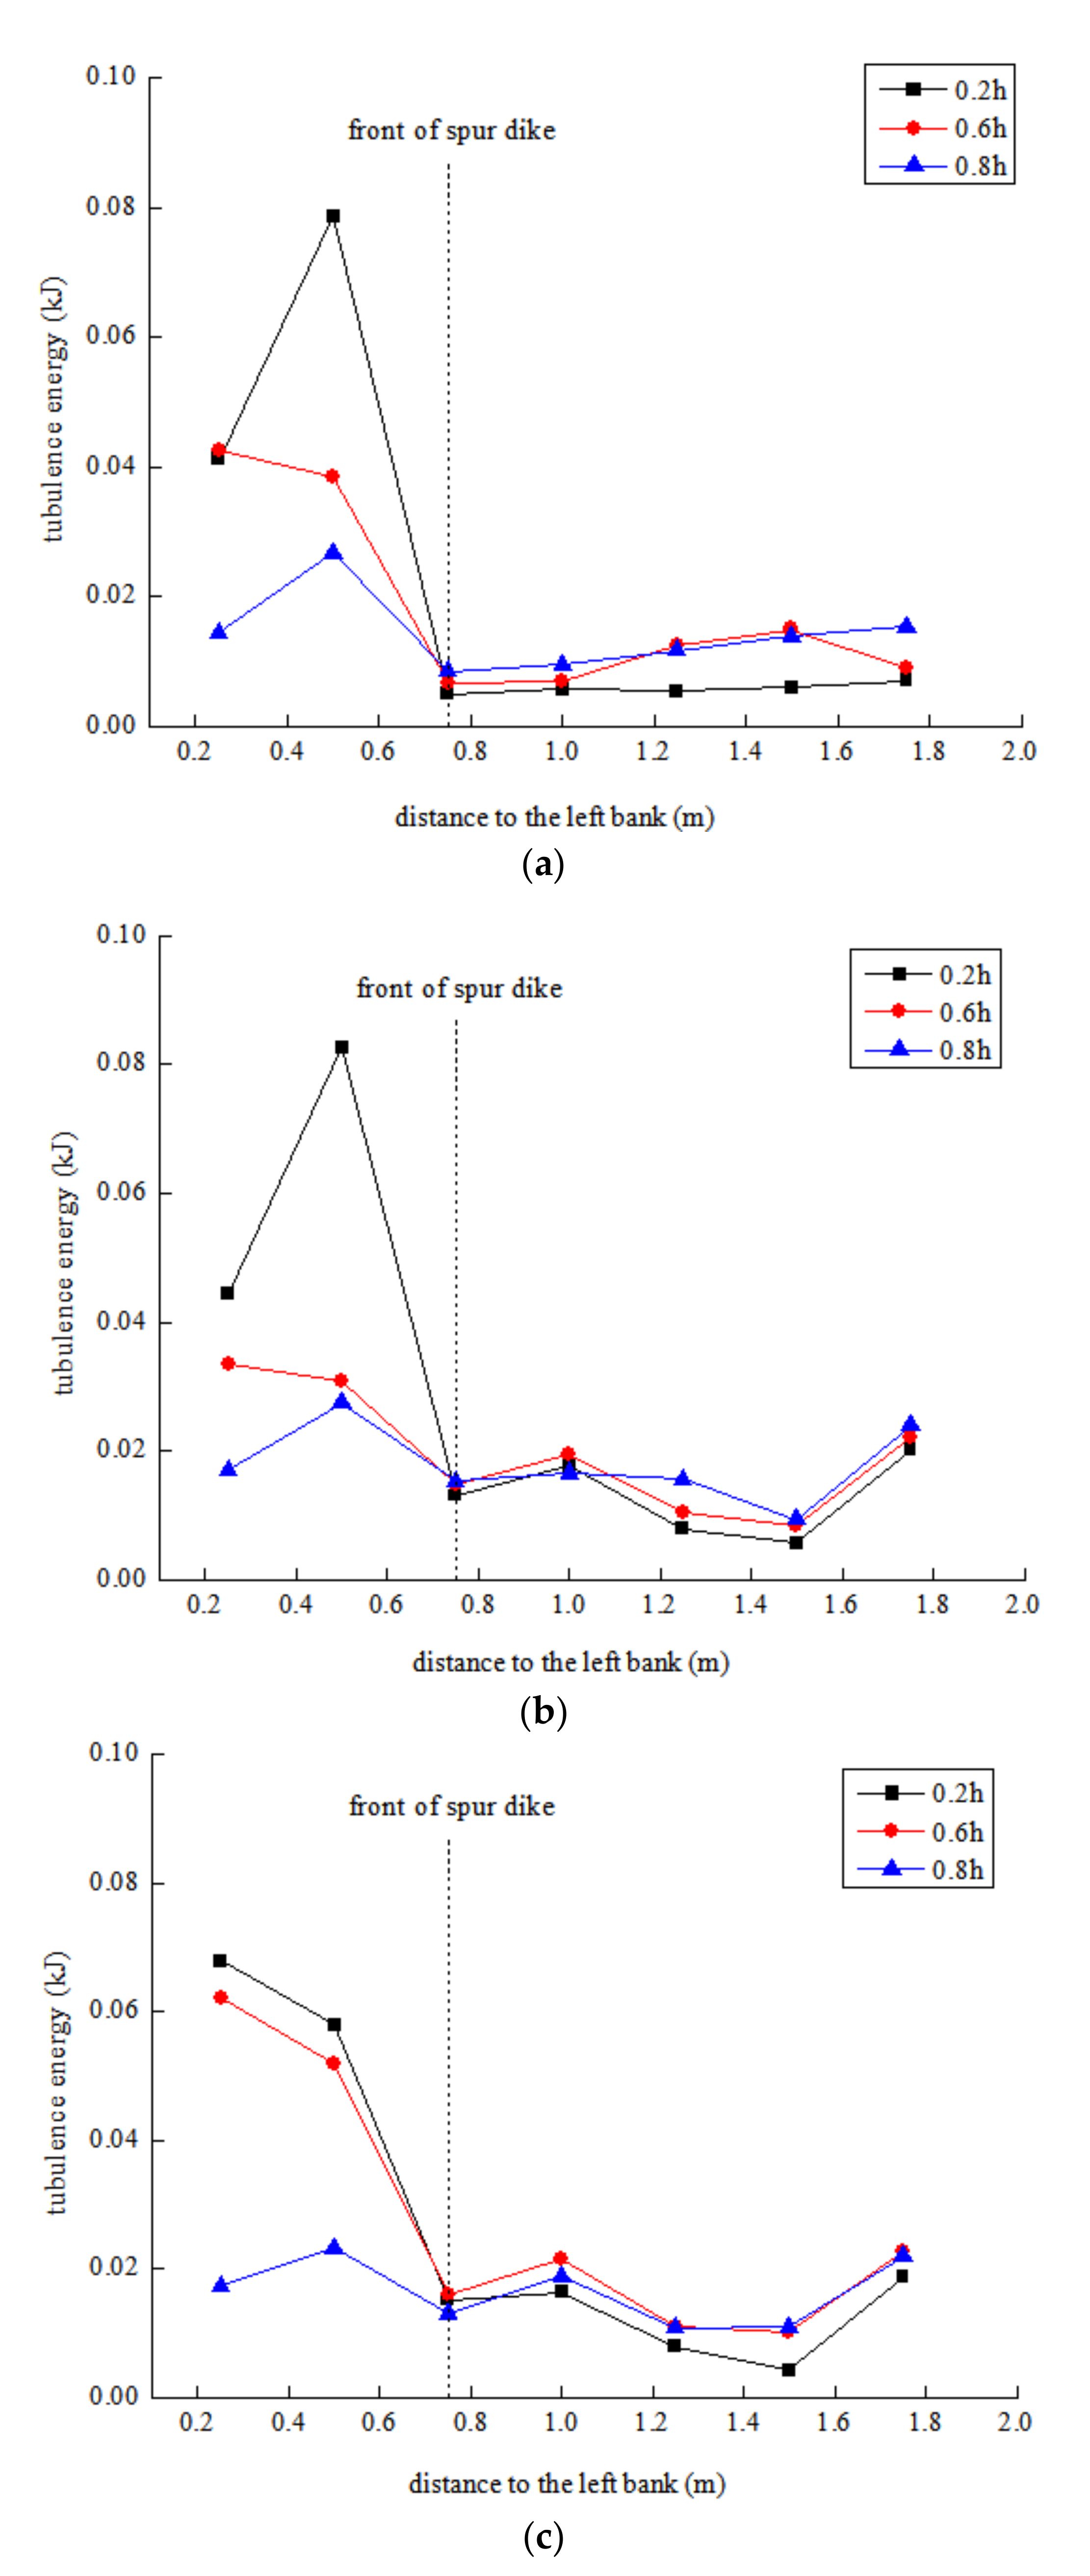
After the dike, the turbulent kinetic energy is the largest at 0.2h, followed by 0.6h, and the smallest is at 0.8h. The location of the maximum turbulent kinetic energy varies with the degree of submersion. When h = 11 cm, the maximum turbulent kinetic energy appears at the front end of the dike head; when h = 14 cm and 17 cm, the maximum turbulent kinetic energy appears behind the spur dike.

4.2. Effect of Porosity on Kinetic Energy of Flow Turbulence

The pore size (R2 = 20 mm) and control water depth (h2 = 14 cm) remain unchanged. Three porosity conditions, P1 = 6.8%, P2 = 14.1%, and P3 = 22.5%, were selected to analyze the distribution of the turbulent kinetic energy at 0.2h, 0.6h, and 0.8h along the front section (2# cross section or 3# cross section), the axis section (4# cross section), and the rear section (5# cross section or 6# cross section).
According to Figure 5, Figure 6 and Figure 7, near the front of the dike, the turbulent kinetic energy is the smallest at 0.2h, followed by 0.6h, and it is the largest at 0.8h. The turbulent kinetic energy showed an overall increasing trend with the increase of porosity. At the axis of the dike, the turbulent kinetic energy is the smallest at 0.2h, followed by 0.6h, and it is the largest at 0.8h, and the distribution trend of the turbulent kinetic energy becomes more and more obvious with the increase of porosity. When P1 = 6.8% and P2 = 14.1%, the turbulent kinetic energy near the two sides of the model flume was larger, but when P3 = 22.5, the turbulent kinetic energy on both sides of the model flume was significantly reduced, especially near the groin side. At the cross section behind the dike, from the front of the dike head to the side of the dike root, the turbulent kinetic energy is the largest at 0.2h, the second largest at 0.6h, and the smallest at 0.8h. At the opposite side of the groin, the variation of the turbulent kinetic energy is opposite. The turbulent kinetic energy decreases first and then increases with the increase of the void fraction. The maximum turbulent kinetic energy section appears in the rear section of the dike under any void ratio conditions.

4.3. Effect of Pore Size on Kinetic Energy of Flow Turbulence

The water depth (h3 = 17 cm) and void ratio (P2 = 14.1%) remain unchanged. Three void size conditions, R1 = 16 mm, R2 = 20 mm, and R3 = 32 mm, are selected. The distributions of the turbulent kinetic energy at 0.2h, 0.6h, and 0.8h along the front section (2# cross section or 3# cross section), the axis section (4# cross section), and the rear section (5# cross section or 6# cross section) of the dike were analyzed.
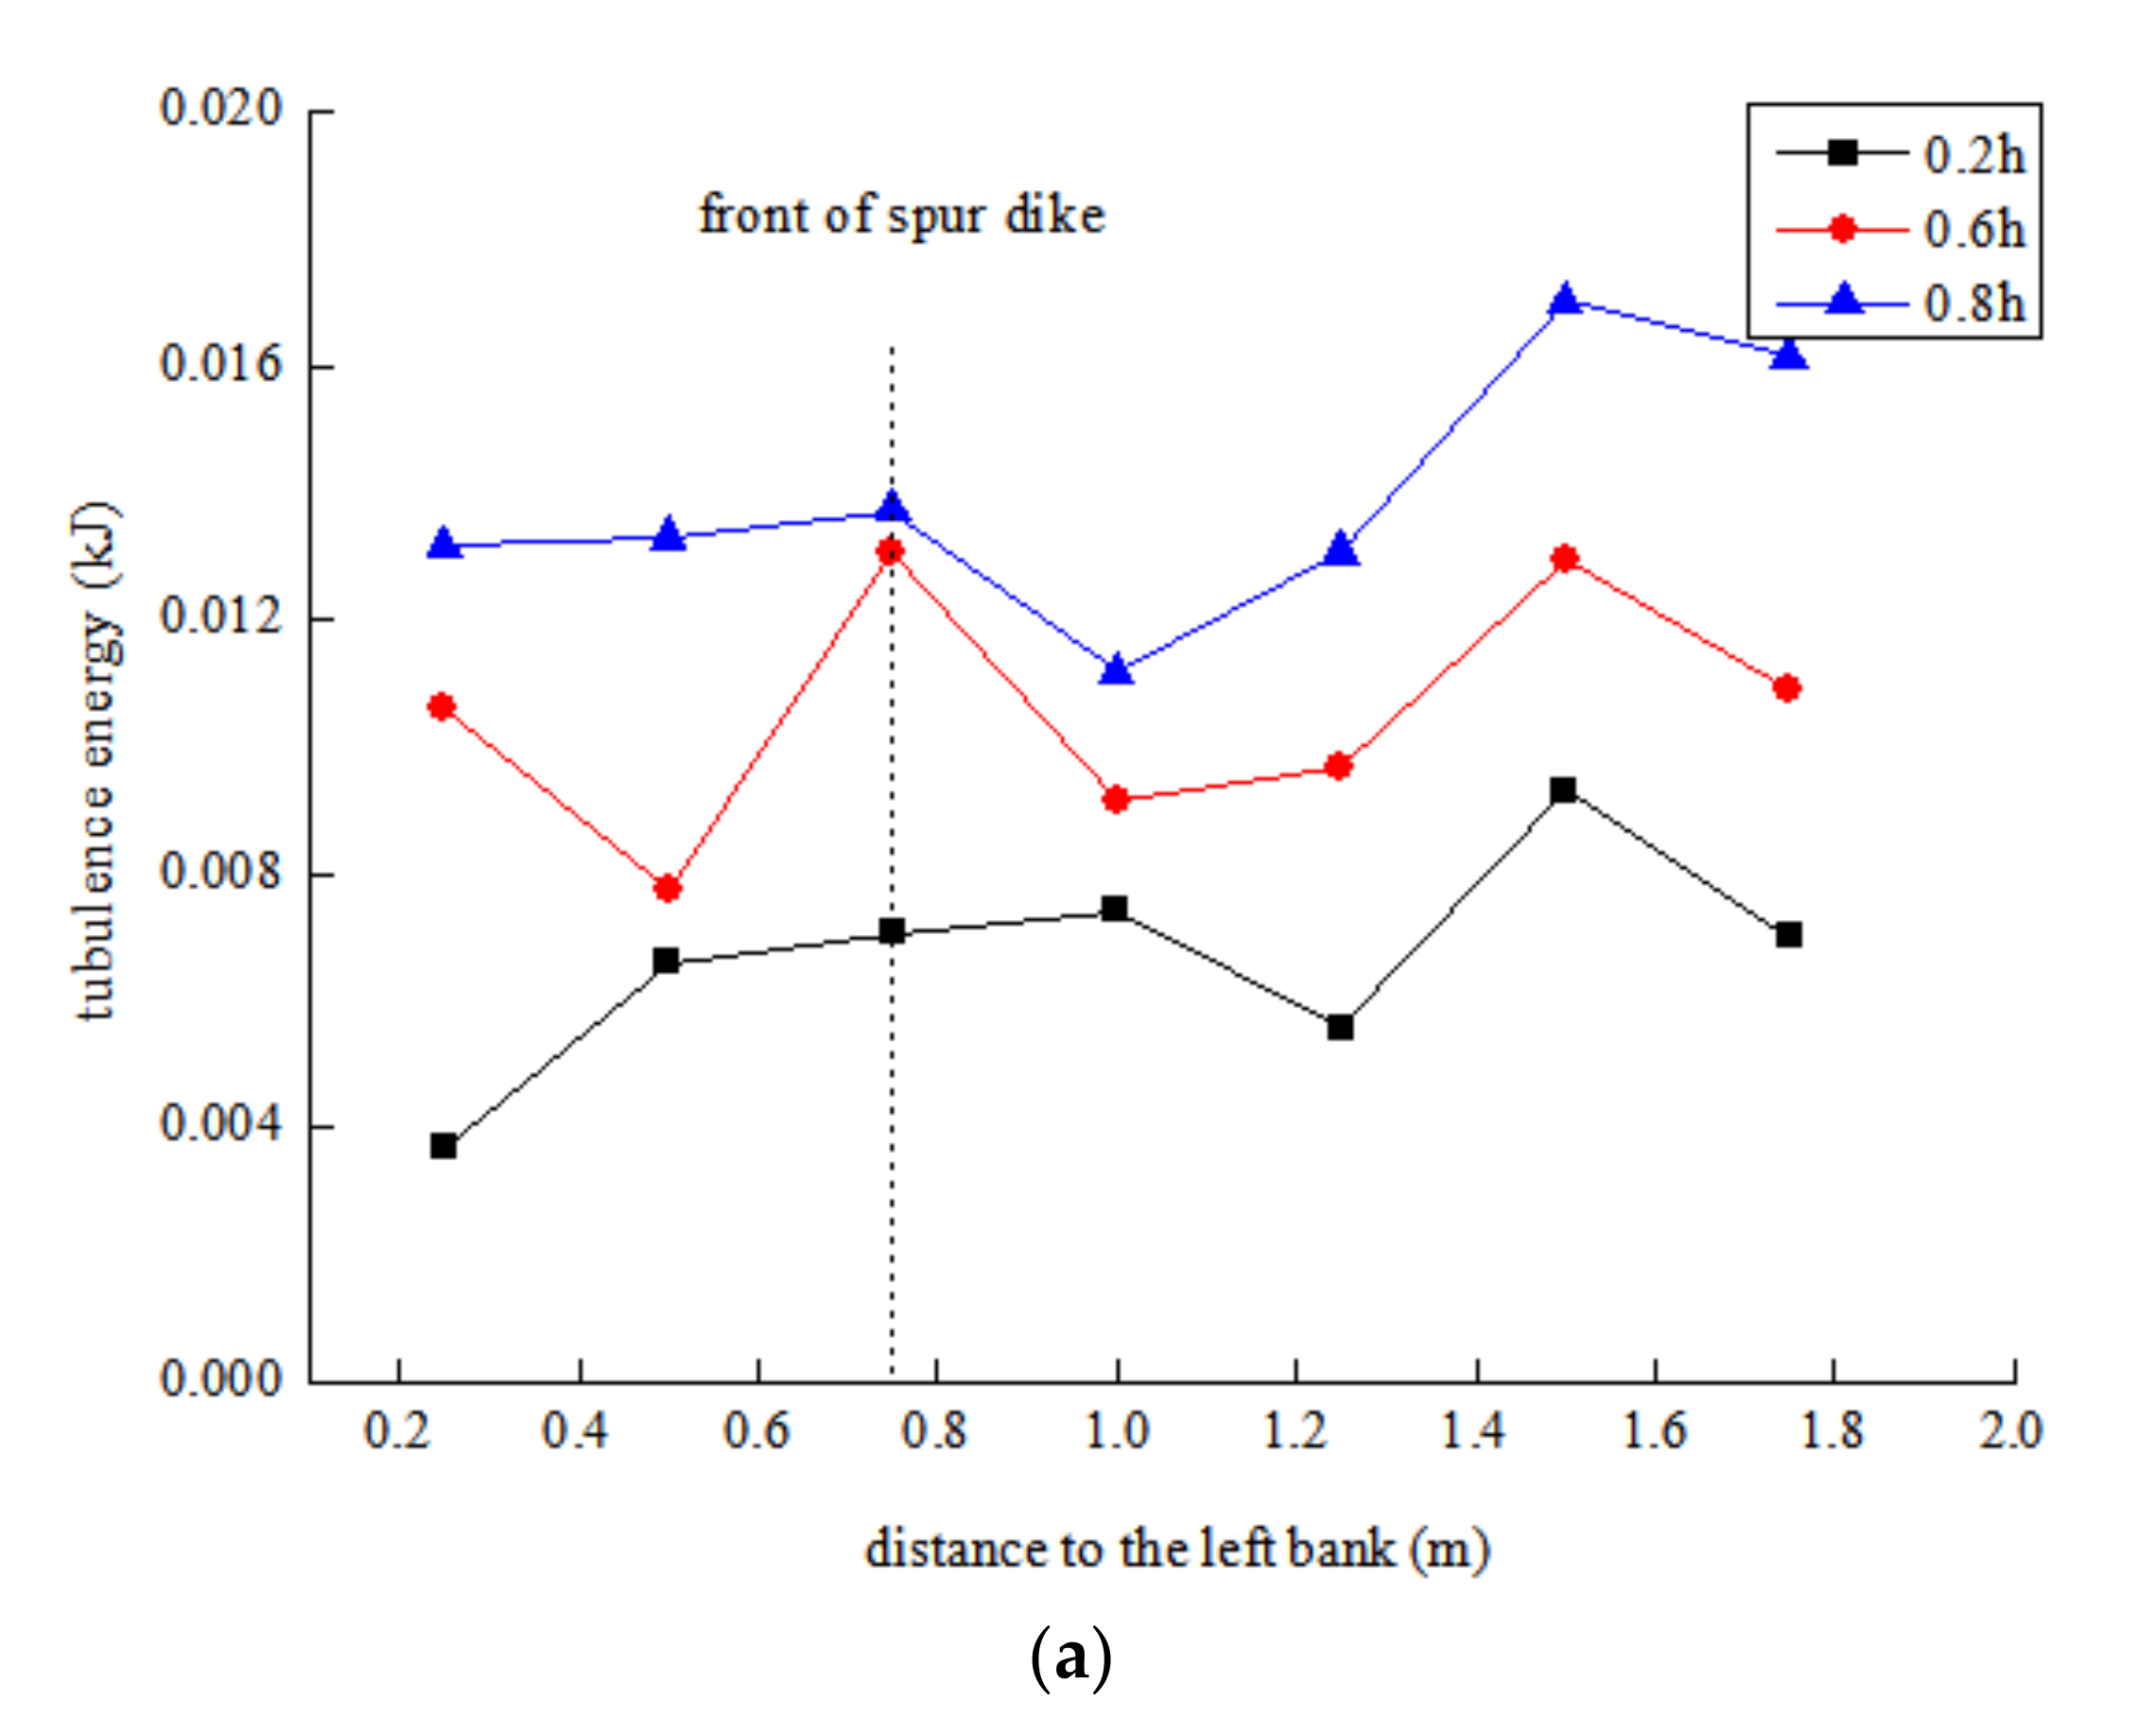
It can be seen from Figure 8, Figure 9 and Figure 10 that near the front of the dike, the turbulent kinetic energy is the smallest at 0.2h, followed by 0.6h, and it is the largest at 0.8h. The turbulent kinetic energy under different water depths shows the phenomenon of individual point crossings with the increase of void size. This is because the void ratio is constant. The larger the void size, the smaller the number of voids, which has a greater impact on the turbulent kinetic energy near the position of the void and has little effect on the turbulent kinetic energy far away from the void. Near the dike axis, the turbulent kinetic energy is the smallest at 0.2h, followed by 0.6h, and it is the largest at 0.8h. However, with the increase of pore size, the difference of turbulent kinetic energy at different water depths becomes smaller and smaller, which indicates that the larger the pore size, the more favorable the water flow mixing. At the rear section of the dike, from the front end of the dike head to the side of the dike root, the turbulent kinetic energy at 0.2h is the largest, the turbulent kinetic energy at 0.6h is larger, and the turbulent kinetic energy at 0.8h is the smallest. Additionally, the difference of turbulent kinetic energy at different water depths is small. The turbulent kinetic energy on the opposite bank of the spur dike fluctuates with the increase of void size; R1 = 16 mm is the smoothest, R2 = 20 mm is relatively smooth, and R3 = 32 mm fluctuates the most. From the dike root to the front end of the dike head, with the increase of the void size, the phenomenon that the turbulent kinetic energy first increases and then decreases gradually disappears, and it turns into a gradually decreasing phenomenon. Regardless of the size of the void, the section with the maximum turbulent kinetic energy appears in the section behind the dike.

5. Conclusions

In this paper, the influence of the submergence degree, porosity, and pore size on the distribution of the turbulent kinetic energy near spur dikes is studied through model tests. The conclusions are as follows:
  • Near the front of the spur dike, the turbulent kinetic energy is the smallest at 0.2h, followed by 0.6h, and it is the largest at 0.8h. The turbulent kinetic energy increases with the increase of the submerged degree, increases with the increase of porosity, and shows a trend of first increase and then decrease with the increase of pore size;
  • Near the dike axis, the turbulent kinetic energy is the smallest at 0.2h, followed by 0.6h, and it is the largest at 0.8h. The turbulent kinetic energy decreases with the increase of the submerged degree, firstly decreases and then increases with the increase of the porosity, and increases with the increase of the pore size. The position of the maximum turbulent kinetic energy moves from the dike root to the front end of the dike head with the increase of the submergence degree and porosity, and from the front end of the dike head to the dike root with the increase of pore size;
  • The turbulent kinetic energy behind the spur dike has the maximum value in the entire experimental observation range, and the turbulent kinetic energy is the largest at 0.2h, followed by 0.6h, and it is the smallest at 0.8h. This change gradually decreases as it moves away from the dike body.

Author Contributions

Conceptualization, T.Y.; Data curation, B.Y.; Formal analysis, B.Y.; Funding acquisition, P.W.; Investigation, P.W.; Methodology, L.H.; Writing—review & editing, T.Y. All authors have read and agreed to the published version of the manuscript.

Funding

This research was funded the National Key Research and Development Program of China (Grant 2016YFC0402106-04); Frontier and Applied Basic Research Program of Chongqing, China (Grant cstc2015jcyjA30004); Open Fund of Key Laboratory of Water Conservancy and Waterway Engineering, Ministry of Education (Grant SLK2018B05); and the National Natural Science Foundation of China (Grant 52009014).

Institutional Review Board Statement

Not applicable.

Informed Consent Statement

Not applicable.

Data Availability Statement

Not applicable.

Acknowledgments

This research was supported by the National Key Research and Development Program of China (Grant 2016YFC0402106-04); Frontier and Applied Basic Research Program of Chongqing, China (Grant cstc2015jcyjA30004); Open Fund of Key Laboratory of Water Conservancy and Waterway Engineering, Ministry of Education (Grant SLK2018B05); and the National Natural Science Foundation of China (Grant 52009014). Support by scientific personnel and technical staff at the National Engineering Research Center for Inland Waterway Regulation, Chongqing Jiaotong University, Chongqing, is also acknowledged.

Conflicts of Interest

The authors declare no conflict of interest.

References

  1. She, J.; Xia, Y.; Xu, H.; Du, D.; Hao, S. Experimental study on local scouring of submerged spur dike head under bottom protection condition. Adv. Water Sci. 2016, 27, 579–585. [Google Scholar]
  2. Cai, Z.; Xia, Y.; Xu, H.; Yan, J. Study on hydrodynamic characteristics of new submerged groin in deepwater channel regulation. Hydro-Sci. Eng. 2018, 3, 16–23. [Google Scholar]
  3. Kong, L.; Xu, B.; Lu, J.; Jia, X. Experimental study on initiation of fine sediment under wave action. China Ocean Eng. 2020, 38, 73–80. [Google Scholar]
  4. Ren, Z.; Li, Y.; Shi, K.; Zhou, Q. Experiment of scour prevention and sedimentation promotion effect for hydraulic flashboard permeable spur dike in different water permeability rates. J. Water Resour. Water Eng. 2016, 27, 172–174. [Google Scholar]
  5. Xu, B.; Yu, T.; Wang, P.; Yang, X.; Zhang, X. Experimental studies on flow profile of permeable spur dikes in upper reaches of Yangtze River. Hydro-Sci. Eng. 2019, 5, 62–68. [Google Scholar]
  6. Wei, M.; Chiew, Y.M.; Emadzadeh, A. Flow Patterns and Turbulent Kinetic Energy Budget of Undular Jumps in a Narrow Flume. J. Hydraul. Eng. 2020, 146, 04020060. [Google Scholar] [CrossRef]
  7. Zhong, L.; Liao, S.; Zhang, J.; Liu, J. Turbulence characteristics of open channel flow with dense roughness bed. J. Sediment. Res. 2020, 45, 8–14. [Google Scholar]
  8. Wang, W.; Liao, W.; Qi, L. Experiment of turbulent characteristics of flow in wind-and-narrow channels. Adv. Water Sci. 2020, 31, 394–403. [Google Scholar]
  9. Pang, W.; Dai, Z.; Ma, B.; Wang, J.; Li, S. Linkage between turbulent kinetic energy, waves and suspended sediment concentrations in the nearshore zone. Mar. Geol. 2020, 425, 106190. [Google Scholar] [CrossRef]
  10. Puzdrowska, M.; Heese, T. Turbulent Kinetic Energy in Bolt Fishway. AgriEngineering 2019, 1, 20. [Google Scholar] [CrossRef] [Green Version]
  11. Gao, G.; Wang, P.; Yang, C.; Liu, H. Distribution of Pulsation Kinetic Energy of Flow Around Spur Dike. Port Waterw. Eng. 2017, 11, 75–79. [Google Scholar]
  12. Kumar, A.; Ojha, C.S.P. Effect of Different Compositions in Unsubmerged L-head Groynes to Mean and Turbulent Flow Characteristics. KSCE J. Civ. Eng. 2019, 23, 4327–4338. [Google Scholar] [CrossRef]
  13. Penna, N.; Coscarella, F.; D’lppoloto, A.; Gaudio, R. Bed roughness effects on the turbulence characteristics of flows through emergent rigid vegetation. Water 2020, 12, 2401. [Google Scholar] [CrossRef]
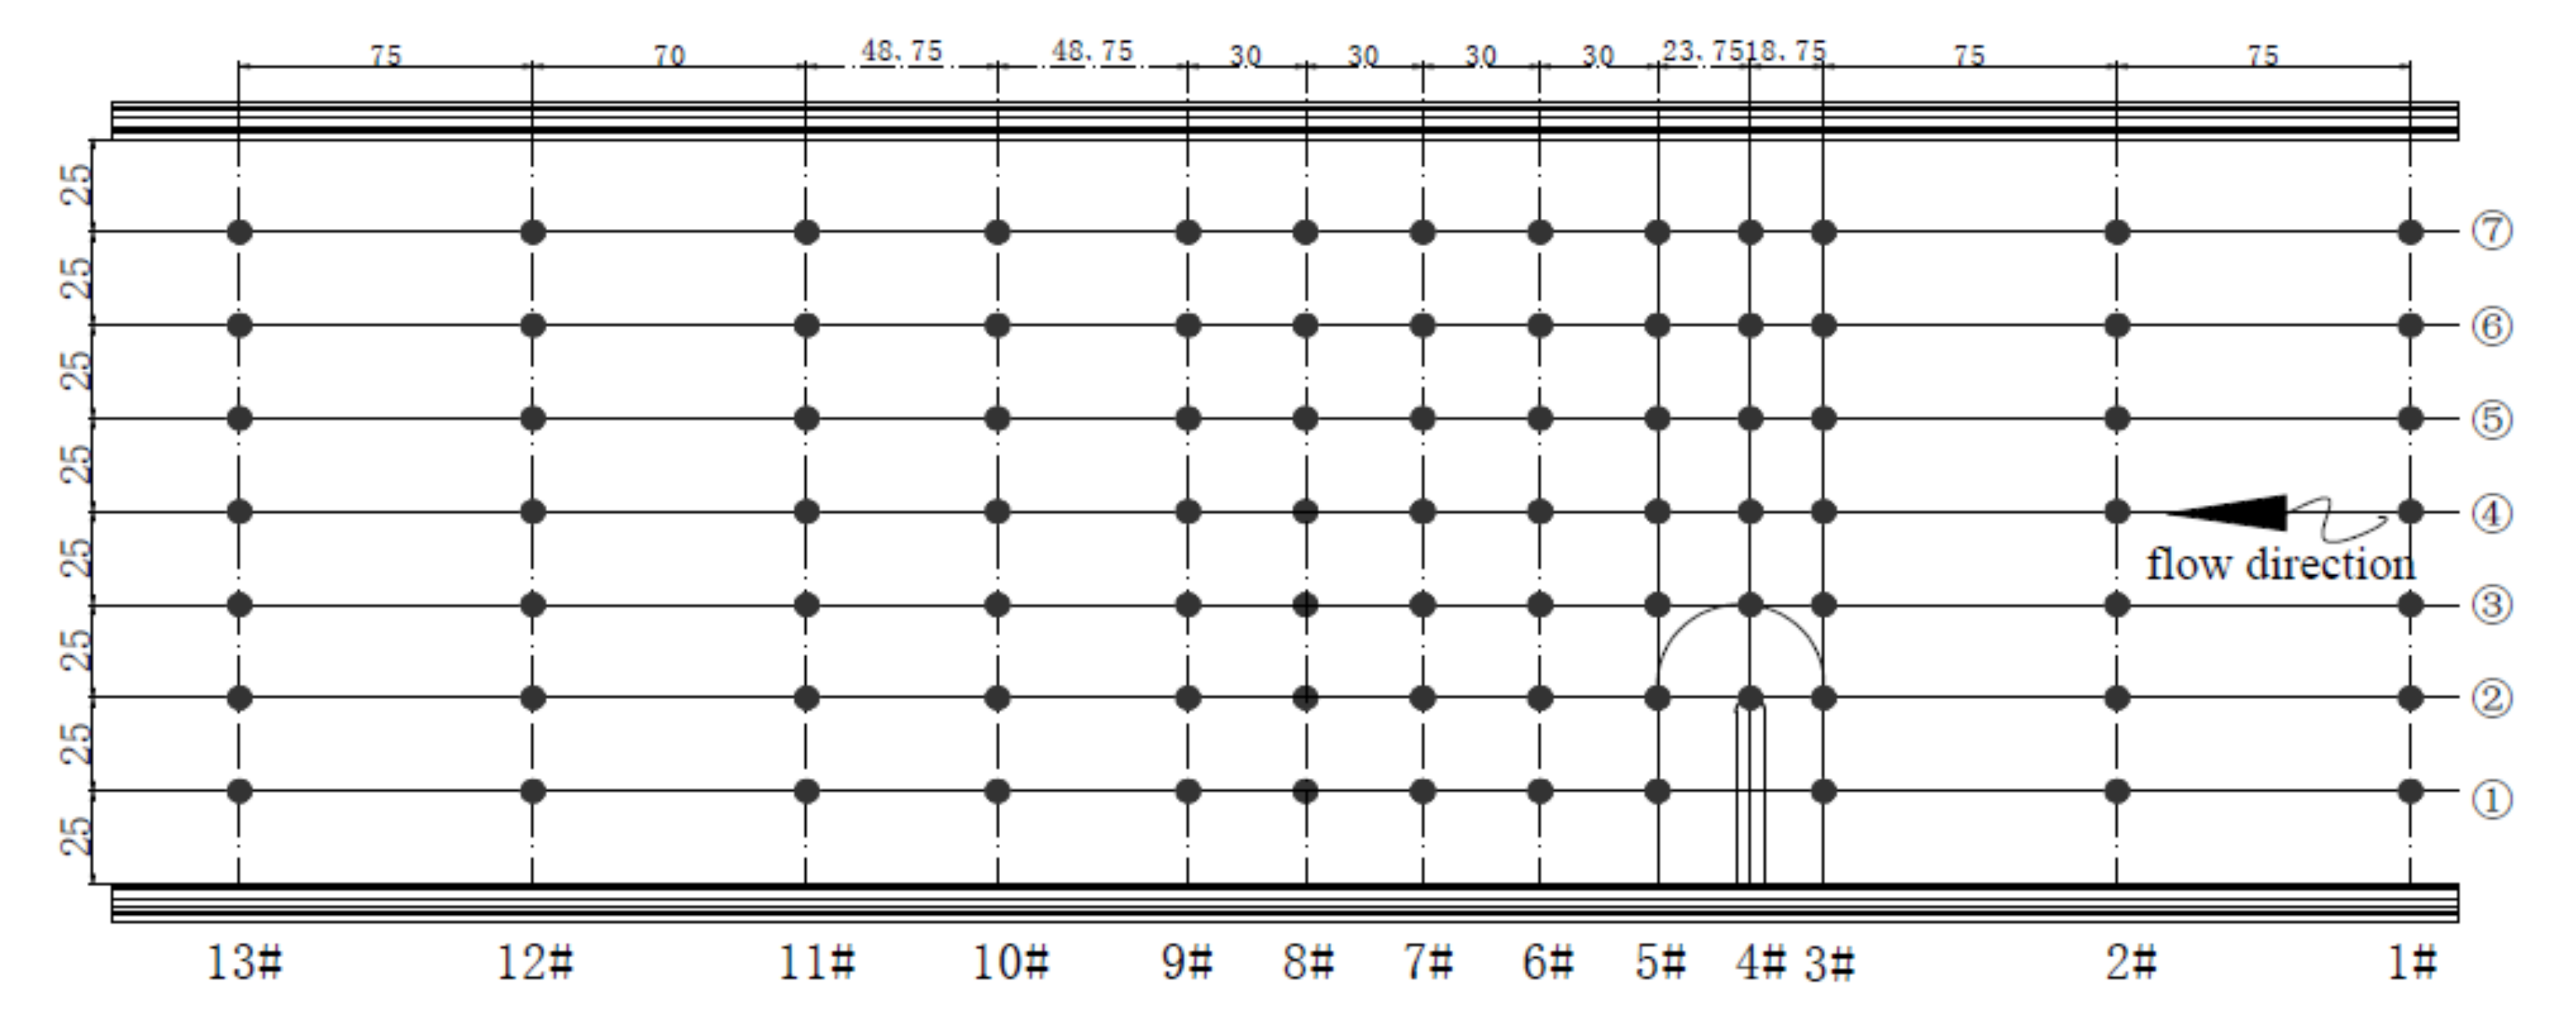
Figure 1. Test layout (Unit: cm).
Sustainability 14 06250 g001
Figure 2. Turbulent kinetic energy distribution in front of the super dike under different submerged conditions. (a) h1 = 11 cm (2# section); (b) h2 = 14 cm (2# section); (c) h3 = 17 cm (2# section).
Sustainability 14 06250 g002aSustainability 14 06250 g002b
Figure 3. Turbulent kinetic energy distribution in dike axial section under different submerged conditions. (a) h1 = 11 cm (4# section); (b) h2 = 14 cm (4# section); (c) h3 = 17 cm (4# section).
Sustainability 14 06250 g003
Figure 4. Turbulent kinetic energy distribution in cross section behind spur dike under different submerged conditions. (a) h1 = 11 cm (6# section); (b) h2 = 14 cm (6# section); (c) h3 = 17 cm (6# section).
Sustainability 14 06250 g004
Figure 5. Turbulent kinetic energy distribution in front section of the super dike under different porosity conditions. (a) P1 = 6.8% (2# section); (b) P2 = 14.1% (2# section); (c) P3 = 22.5% (2# section).
Sustainability 14 06250 g005aSustainability 14 06250 g005b
Figure 6. Turbulent kinetic energy distribution in dike axial section under different porosity conditions. (a) P1 = 6.8% (4# section); (b) P2 = 14.1% (4# section); (c) P3 = 22.5% (4# section).
Sustainability 14 06250 g006
Figure 7. Turbulent kinetic energy distribution in cross section behind spur dike under different porosity conditions. (a) P1 = 6.8% (6# section); (b) P2 = 14.1% (5# section); (c) P2 = 22.5% (5# section).
Sustainability 14 06250 g007
Figure 8. Turbulent kinetic energy distribution in front section of the super dike under different pore size conditions. (a) R1 = 16 mm (2# section); (b) R2 = 20 mm (2# section); (c) R3 = 32 mm (2# section).
Sustainability 14 06250 g008aSustainability 14 06250 g008b
Figure 9. Turbulent kinetic energy distribution in dike axial section under different pore size conditions. (a) R1 = 16 mm (4# section); (b) R2 = 20 mm (4# section); (c) R3 = 32 mm (4# section).
Sustainability 14 06250 g009
Figure 10. Turbulent kinetic energy distribution in cross section behind spur dike under different pore size conditions. (a) R1 = 16 mm (6# section); (b) R2 = 20 mm (6# section); (c) R3 = 32 mm (6# section).
Sustainability 14 06250 g010
Table 1. Experiments on turbulent kinetic energy distribution around permeable spur dike.
Run TitlePorosity (%)Water Depth (cm)Flow Rate (L/s)
TR16.81165
TR26.81495
TR36.817135
TR414.11165
TR514.11495
TR614.117135
TR722.51165
TR822.51495
TR922.517135
Publisher’s Note: MDPI stays neutral with regard to jurisdictional claims in published maps and institutional affiliations.