Spatial Simulation of Land-Use Development of Feixi County, China, Based on Optimized Productive–Living–Ecological Functions


Abstract
:1. Introduction
2. Materials and Methods
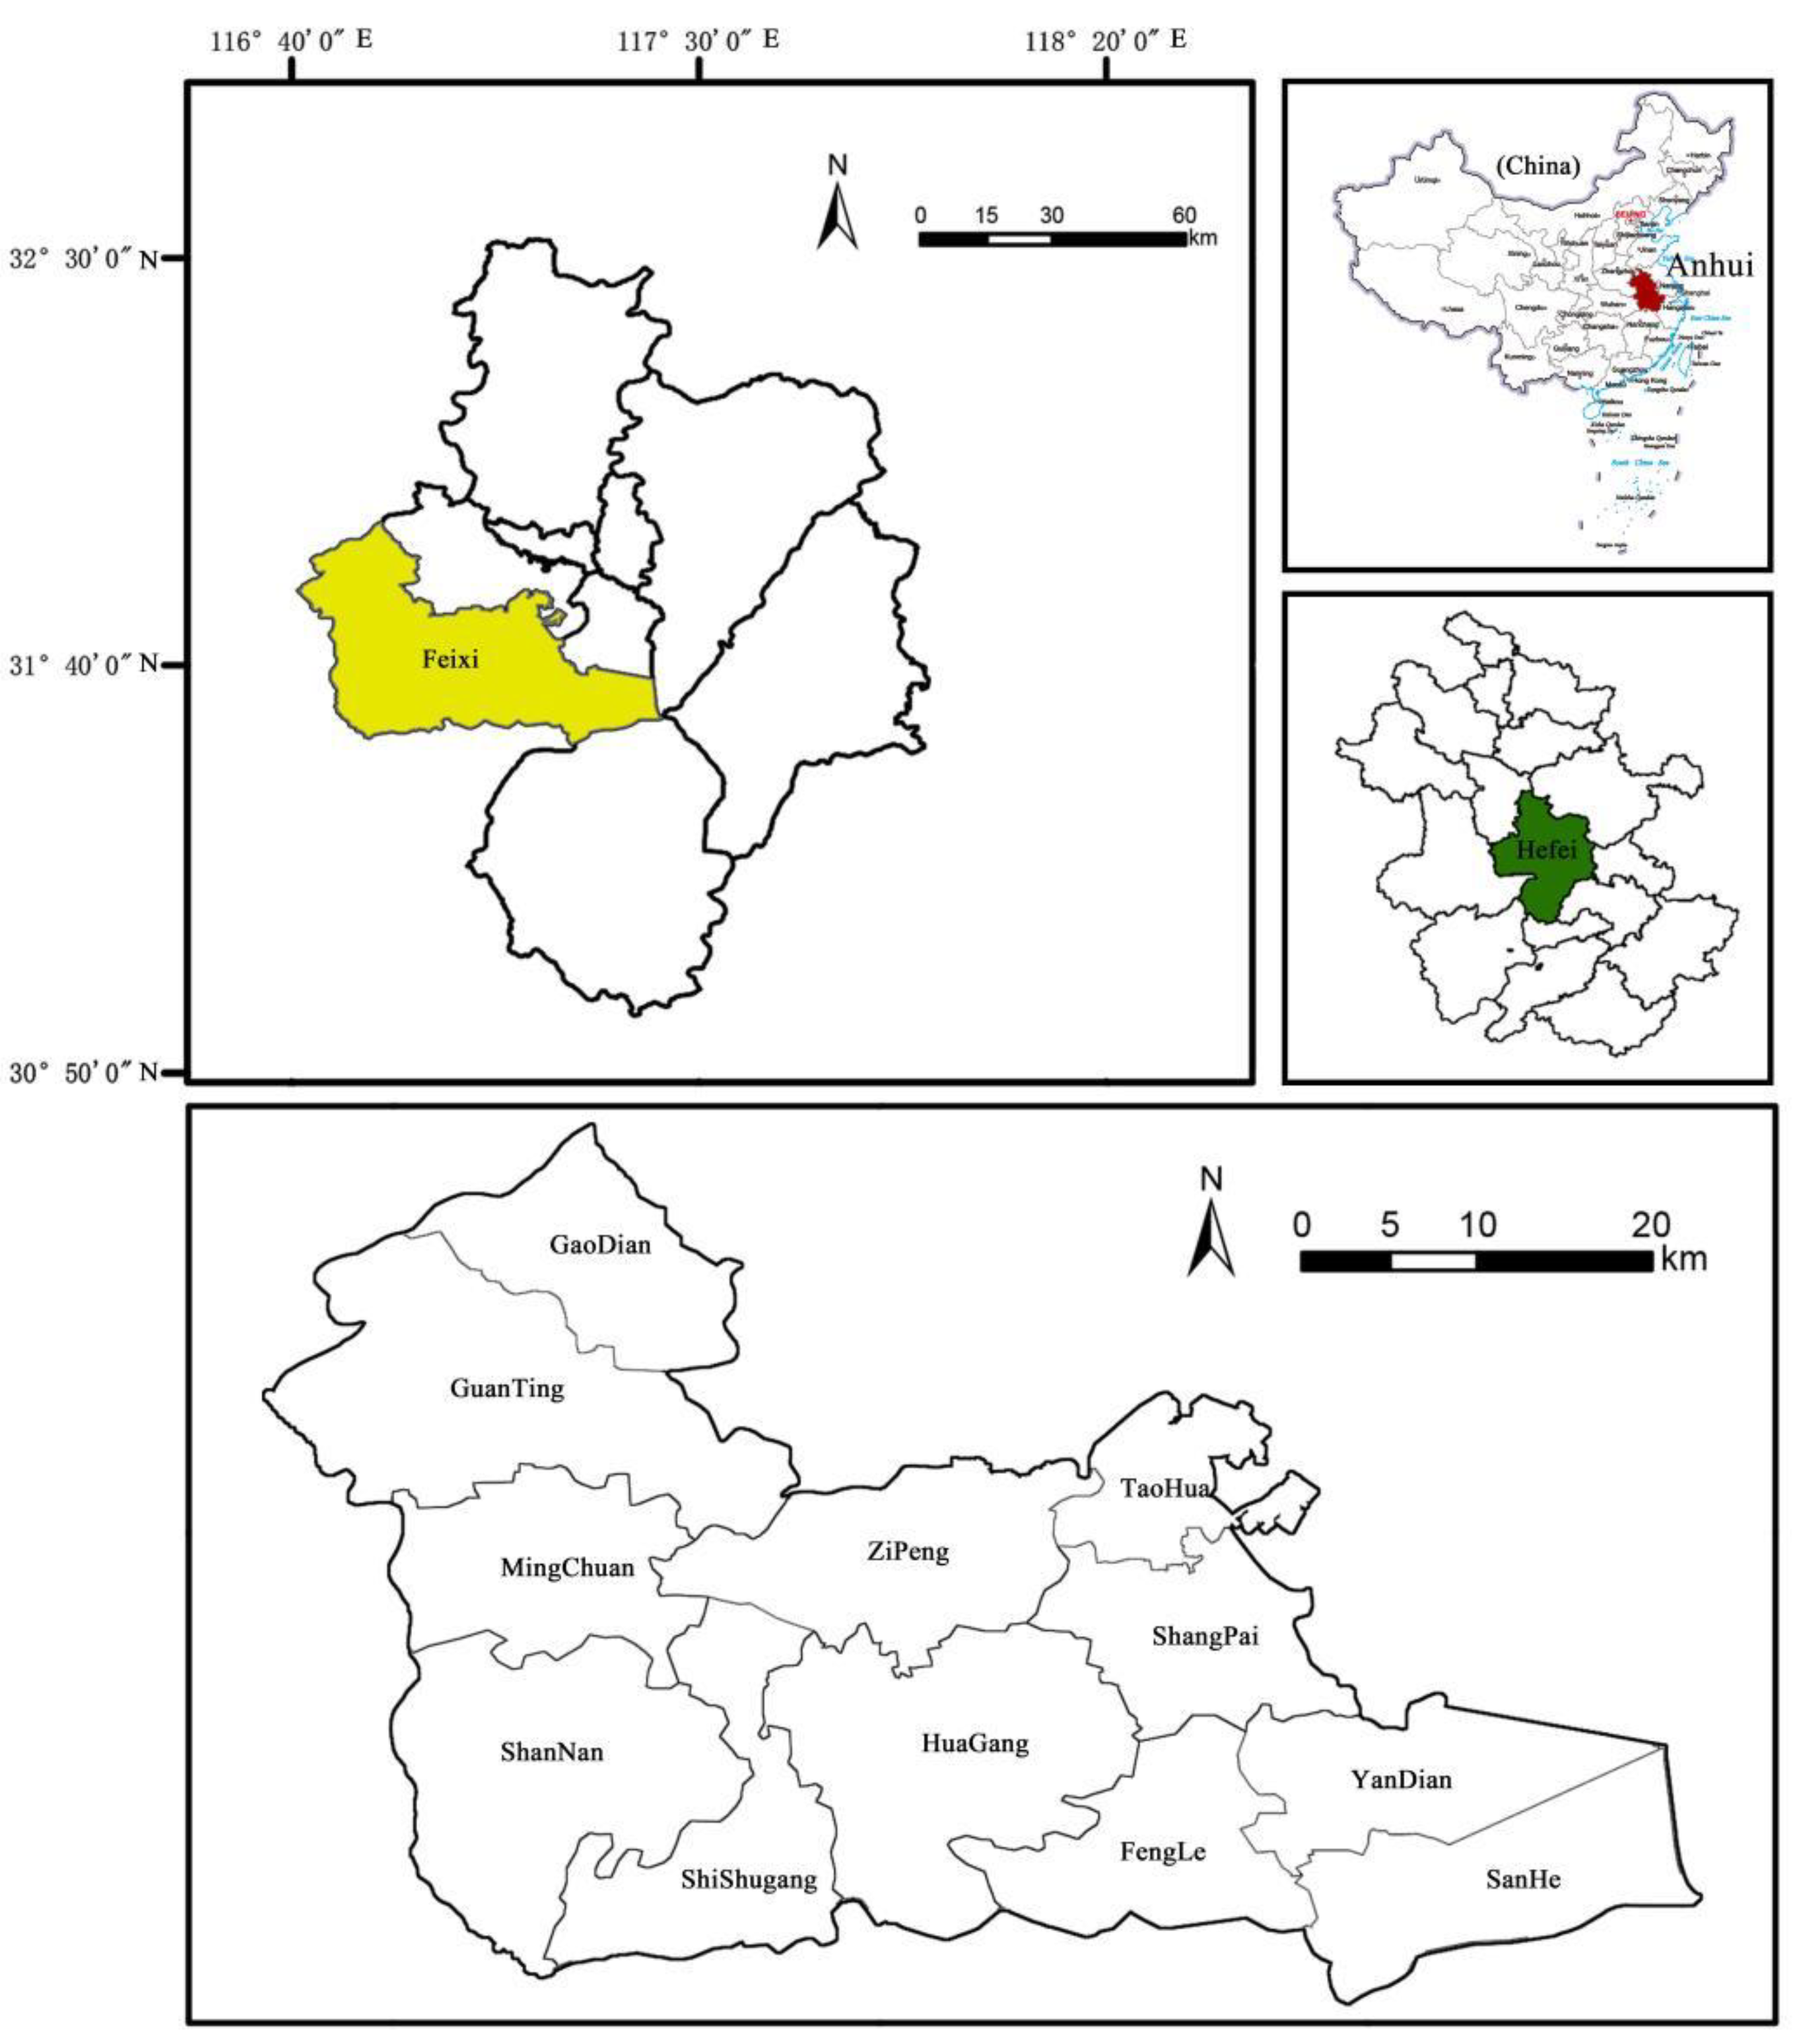
2.1. Study Area
2.2. Data Sources
2.3. Data Processing
2.3.1. Identification and Classification of P-L-E Functional Areas in Feixi County
2.3.2. Construction of the Evaluation Index System for the Three Spatial Functions
2.3.3. Construction of Driving Factors
2.4. Methods
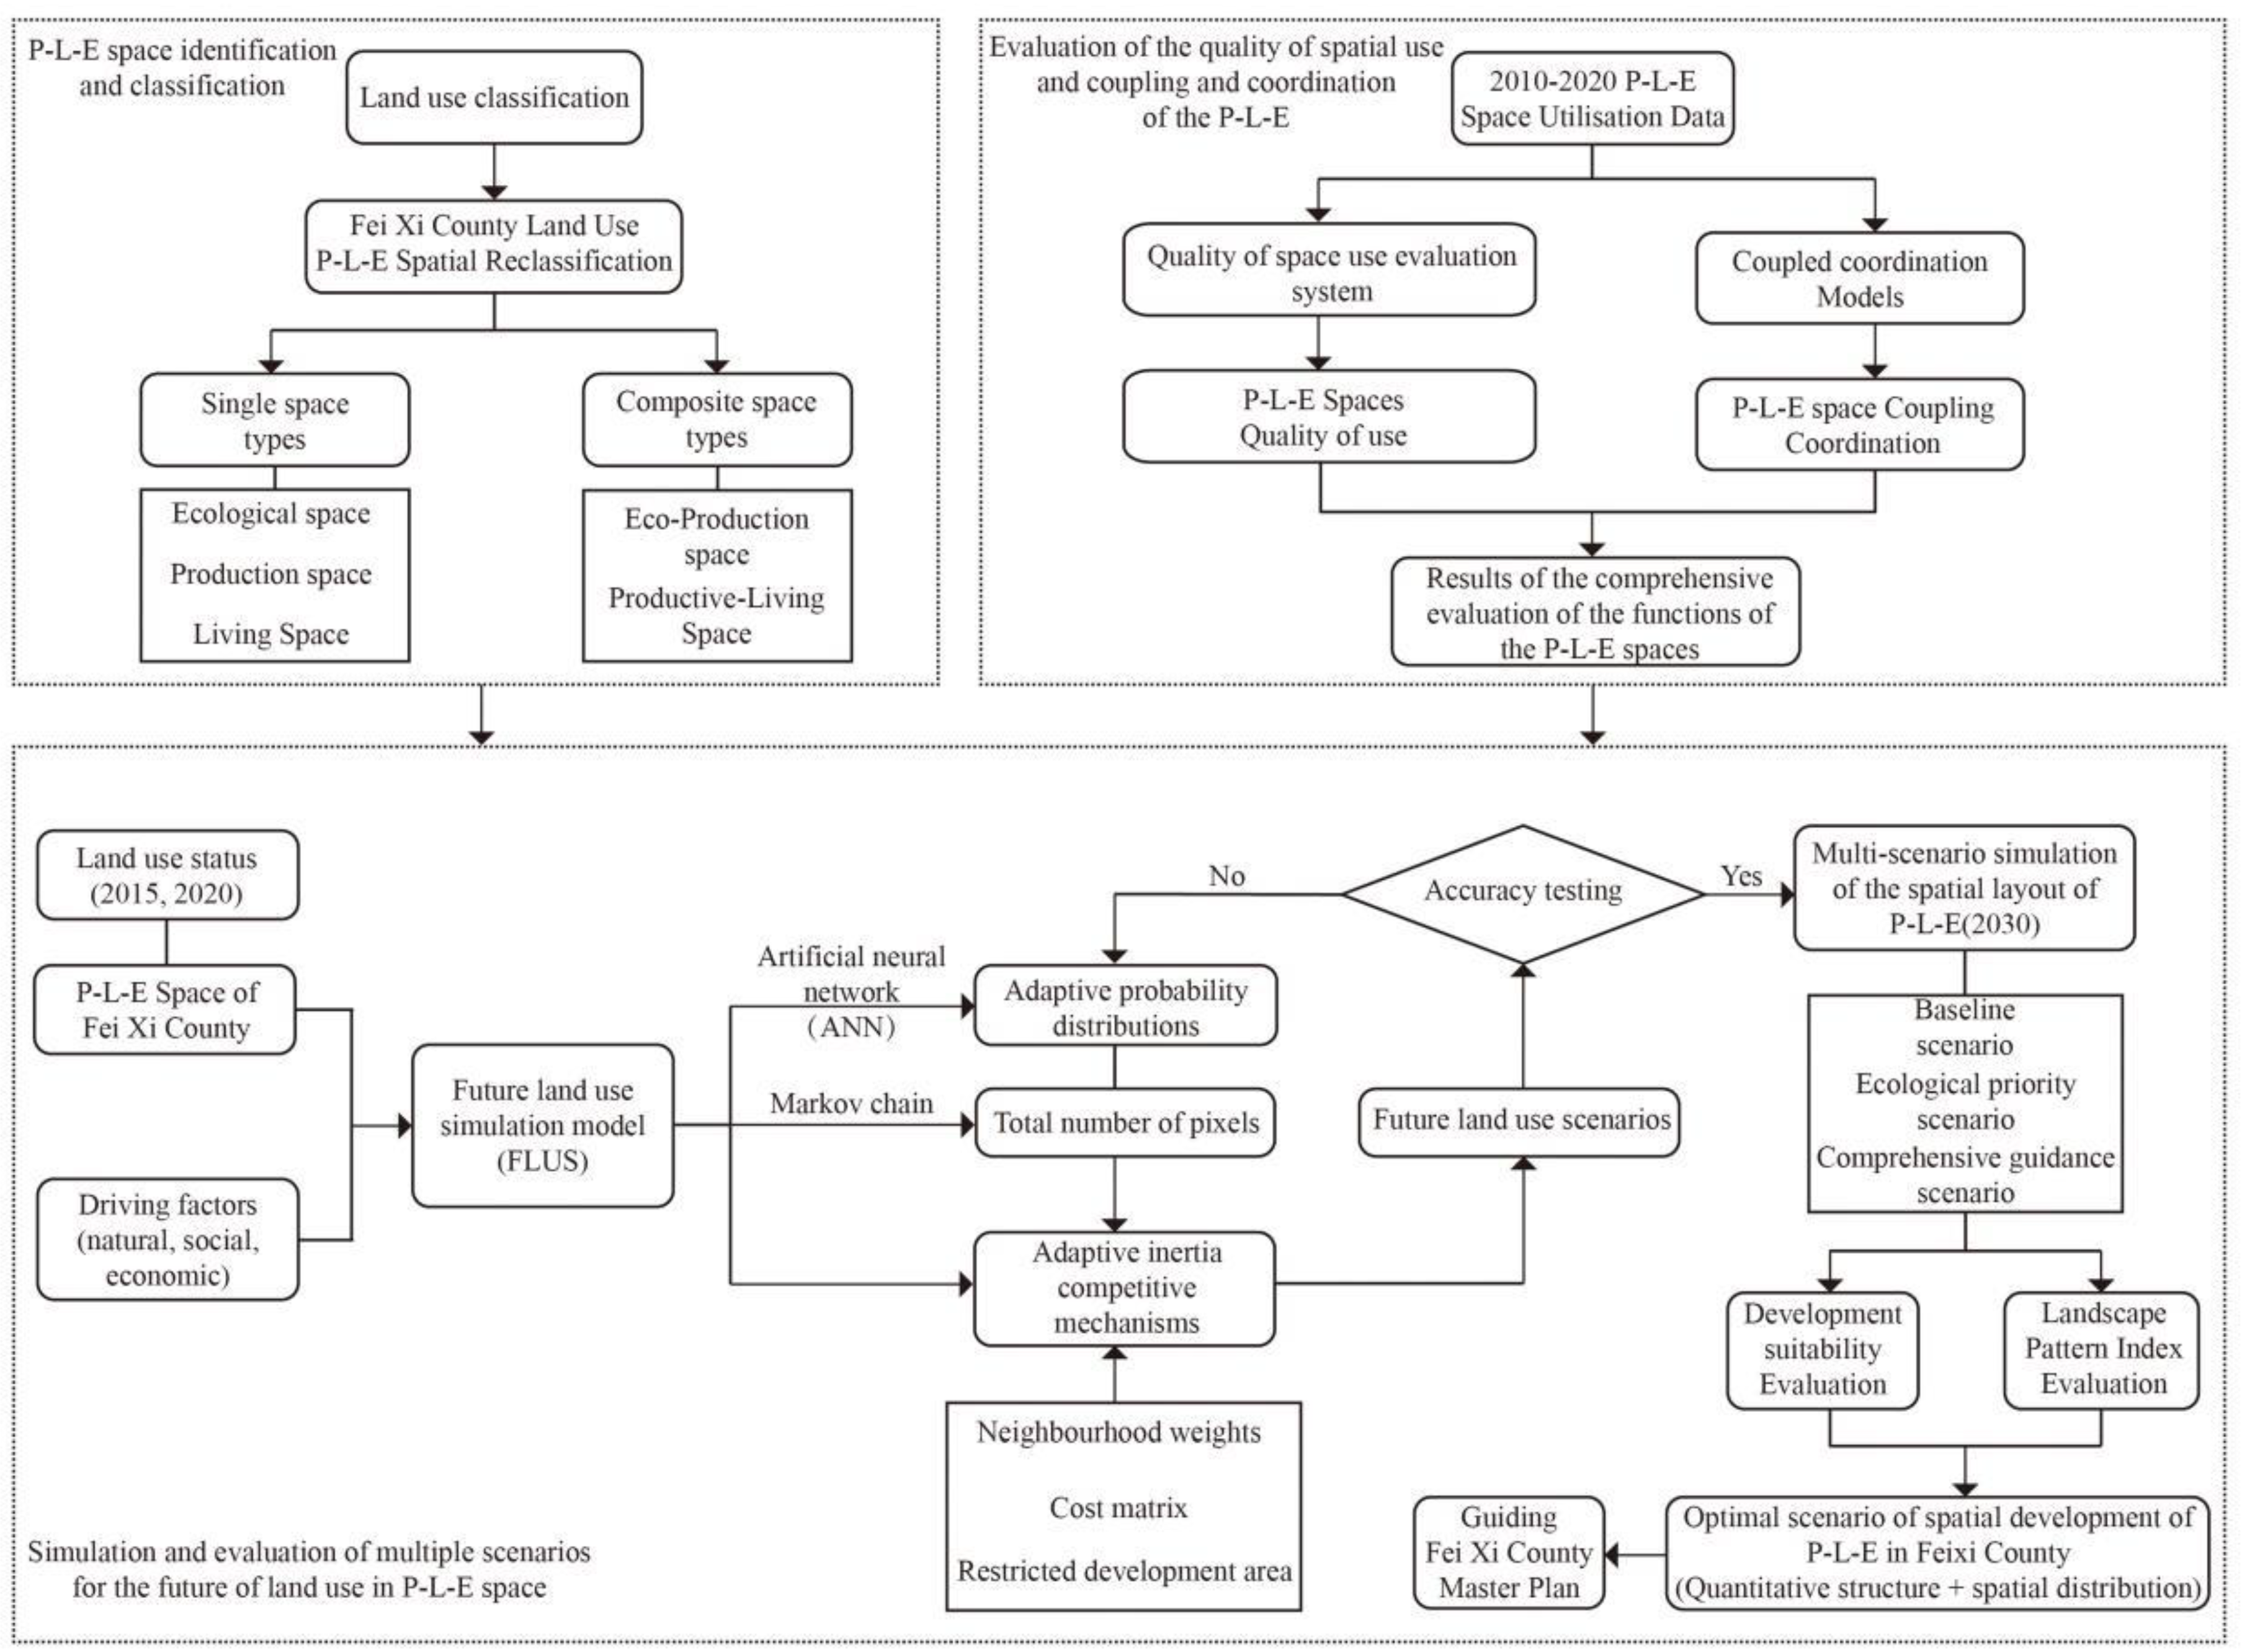
2.4.1. Framework Design
2.4.2. Evaluation of Utilization Quality and Coupling Coordination Degree of P-L-E Space
- (1)
- Evaluation of the quality of the P-L-E spaces
- (2)
- Coupling coordination degree model
2.4.3. Development Suitability Evaluation
2.4.4. Multiscenario FLUS Simulation
2.4.5. Evaluation of Landscape Patch Indexes
3. Results
3.1. Evaluation Results of the Spatial Function and Coupling Coordination of P-L-E
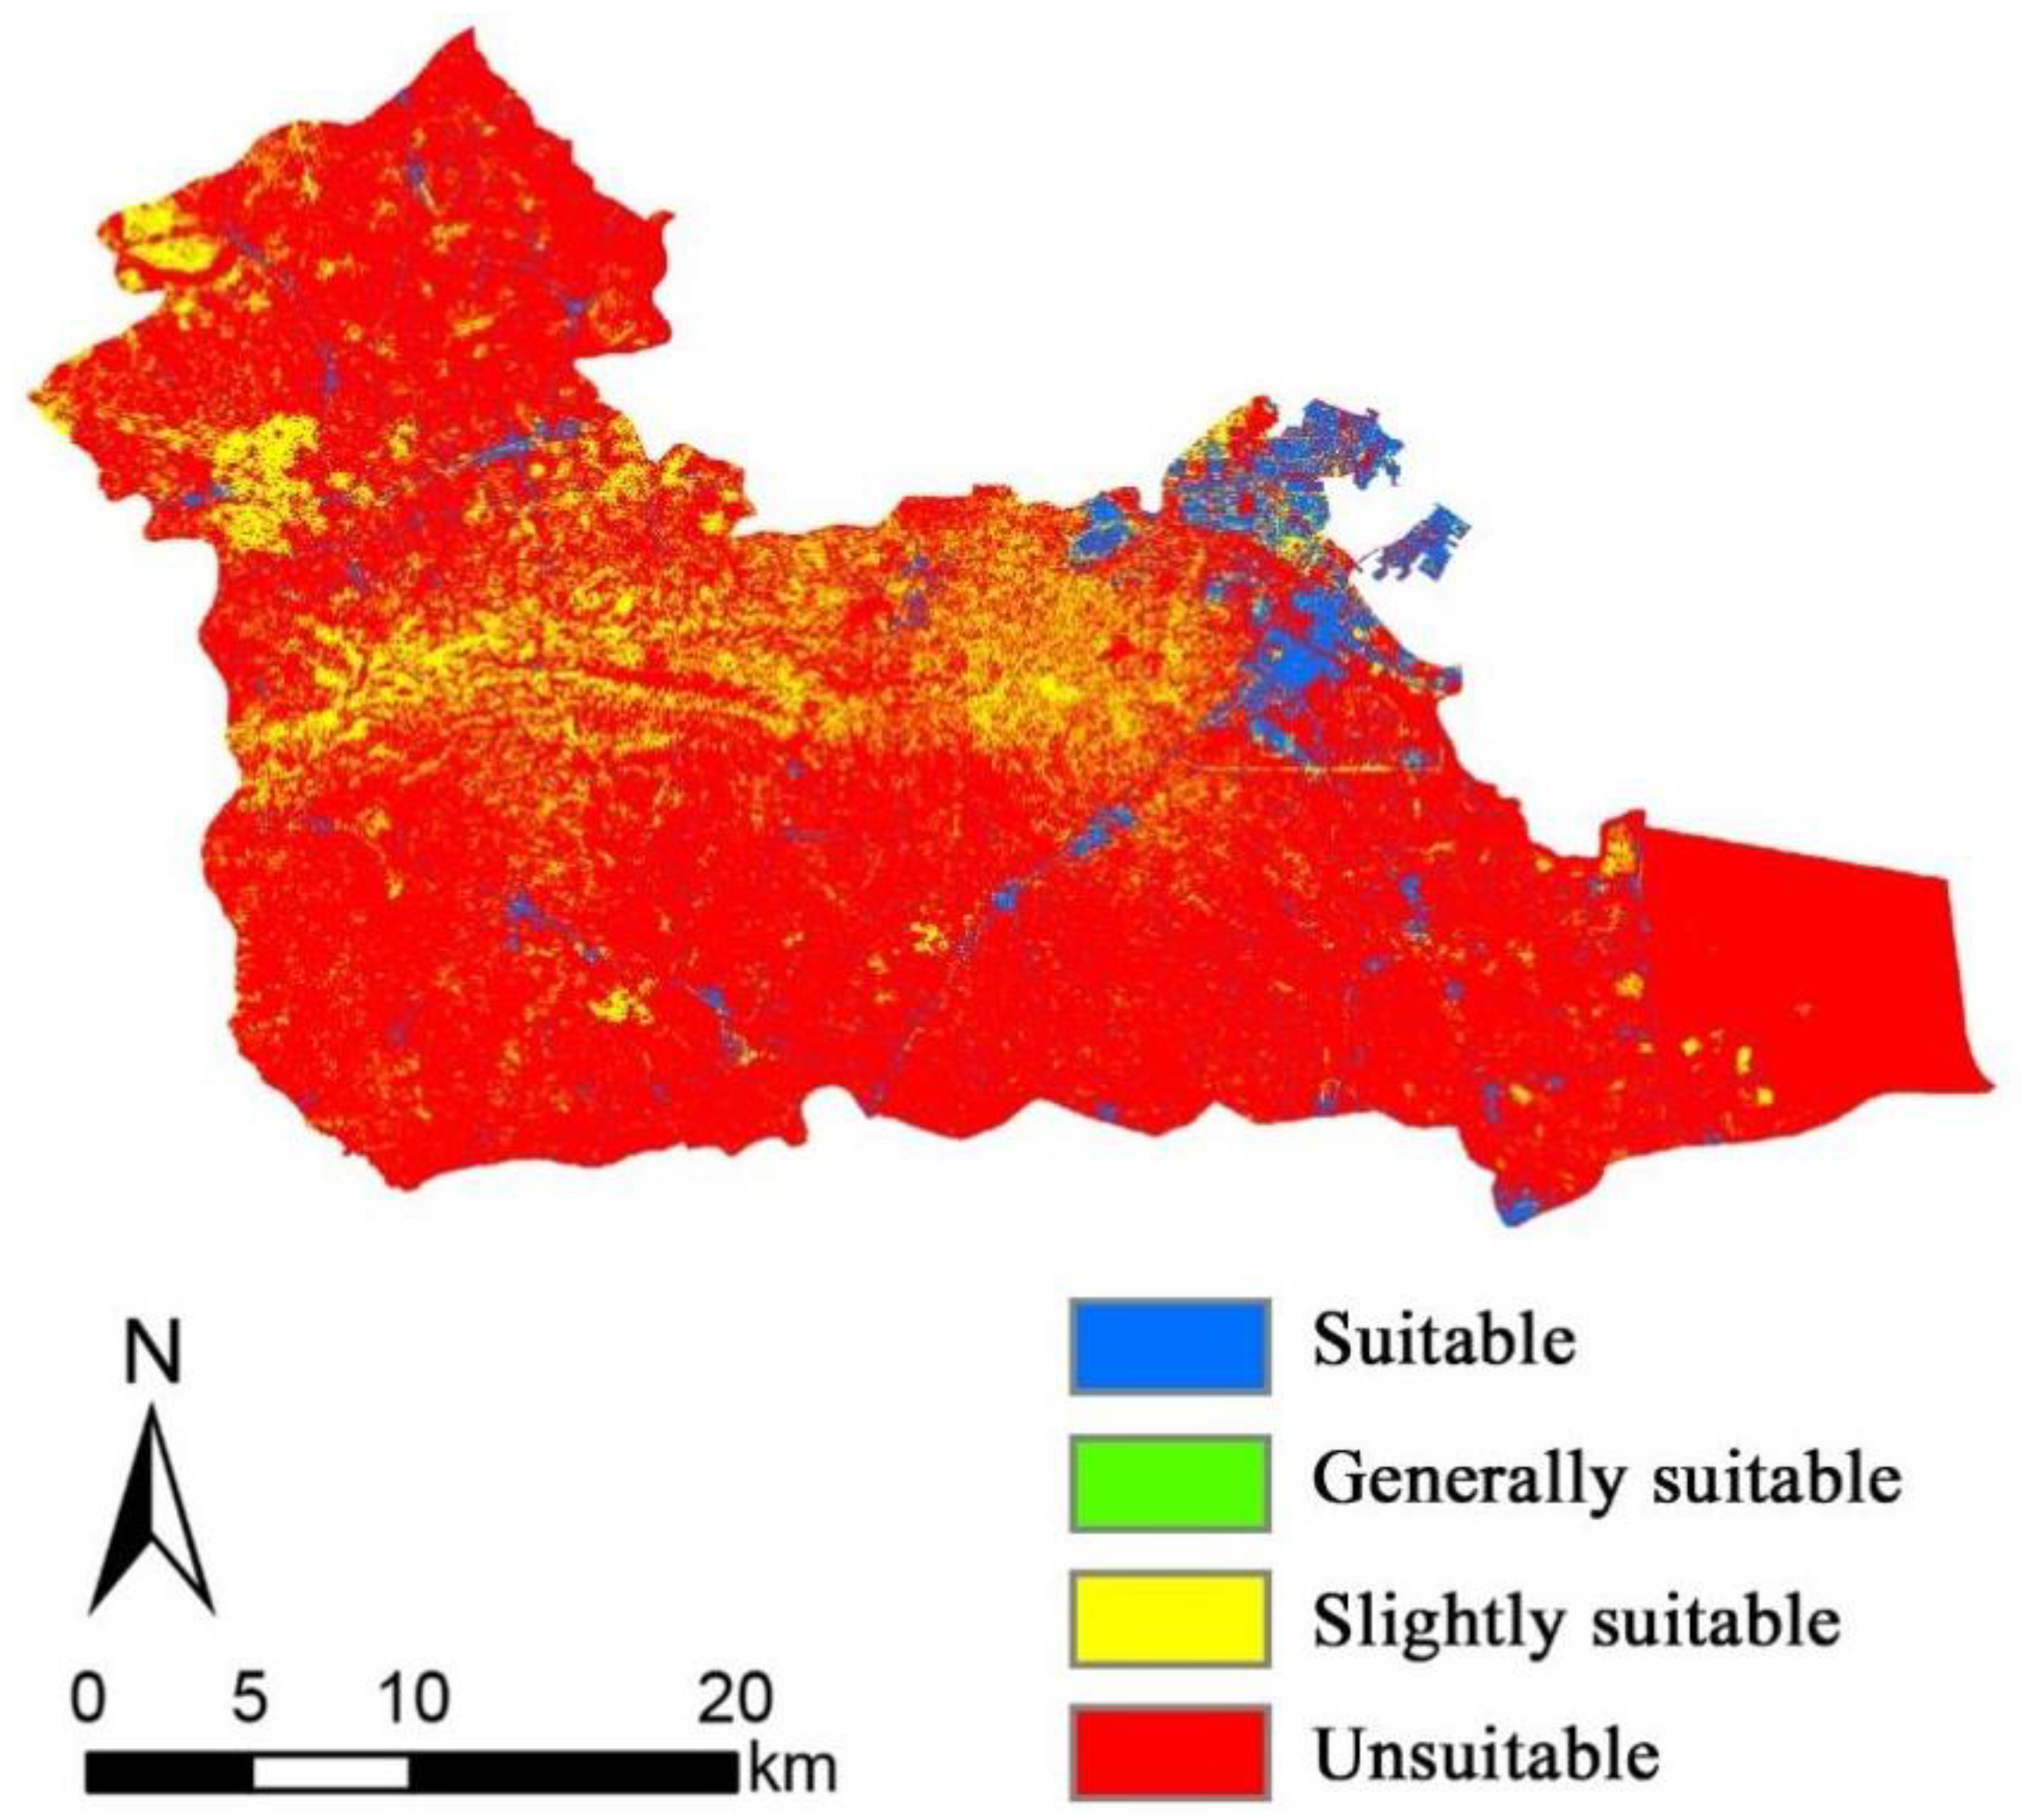
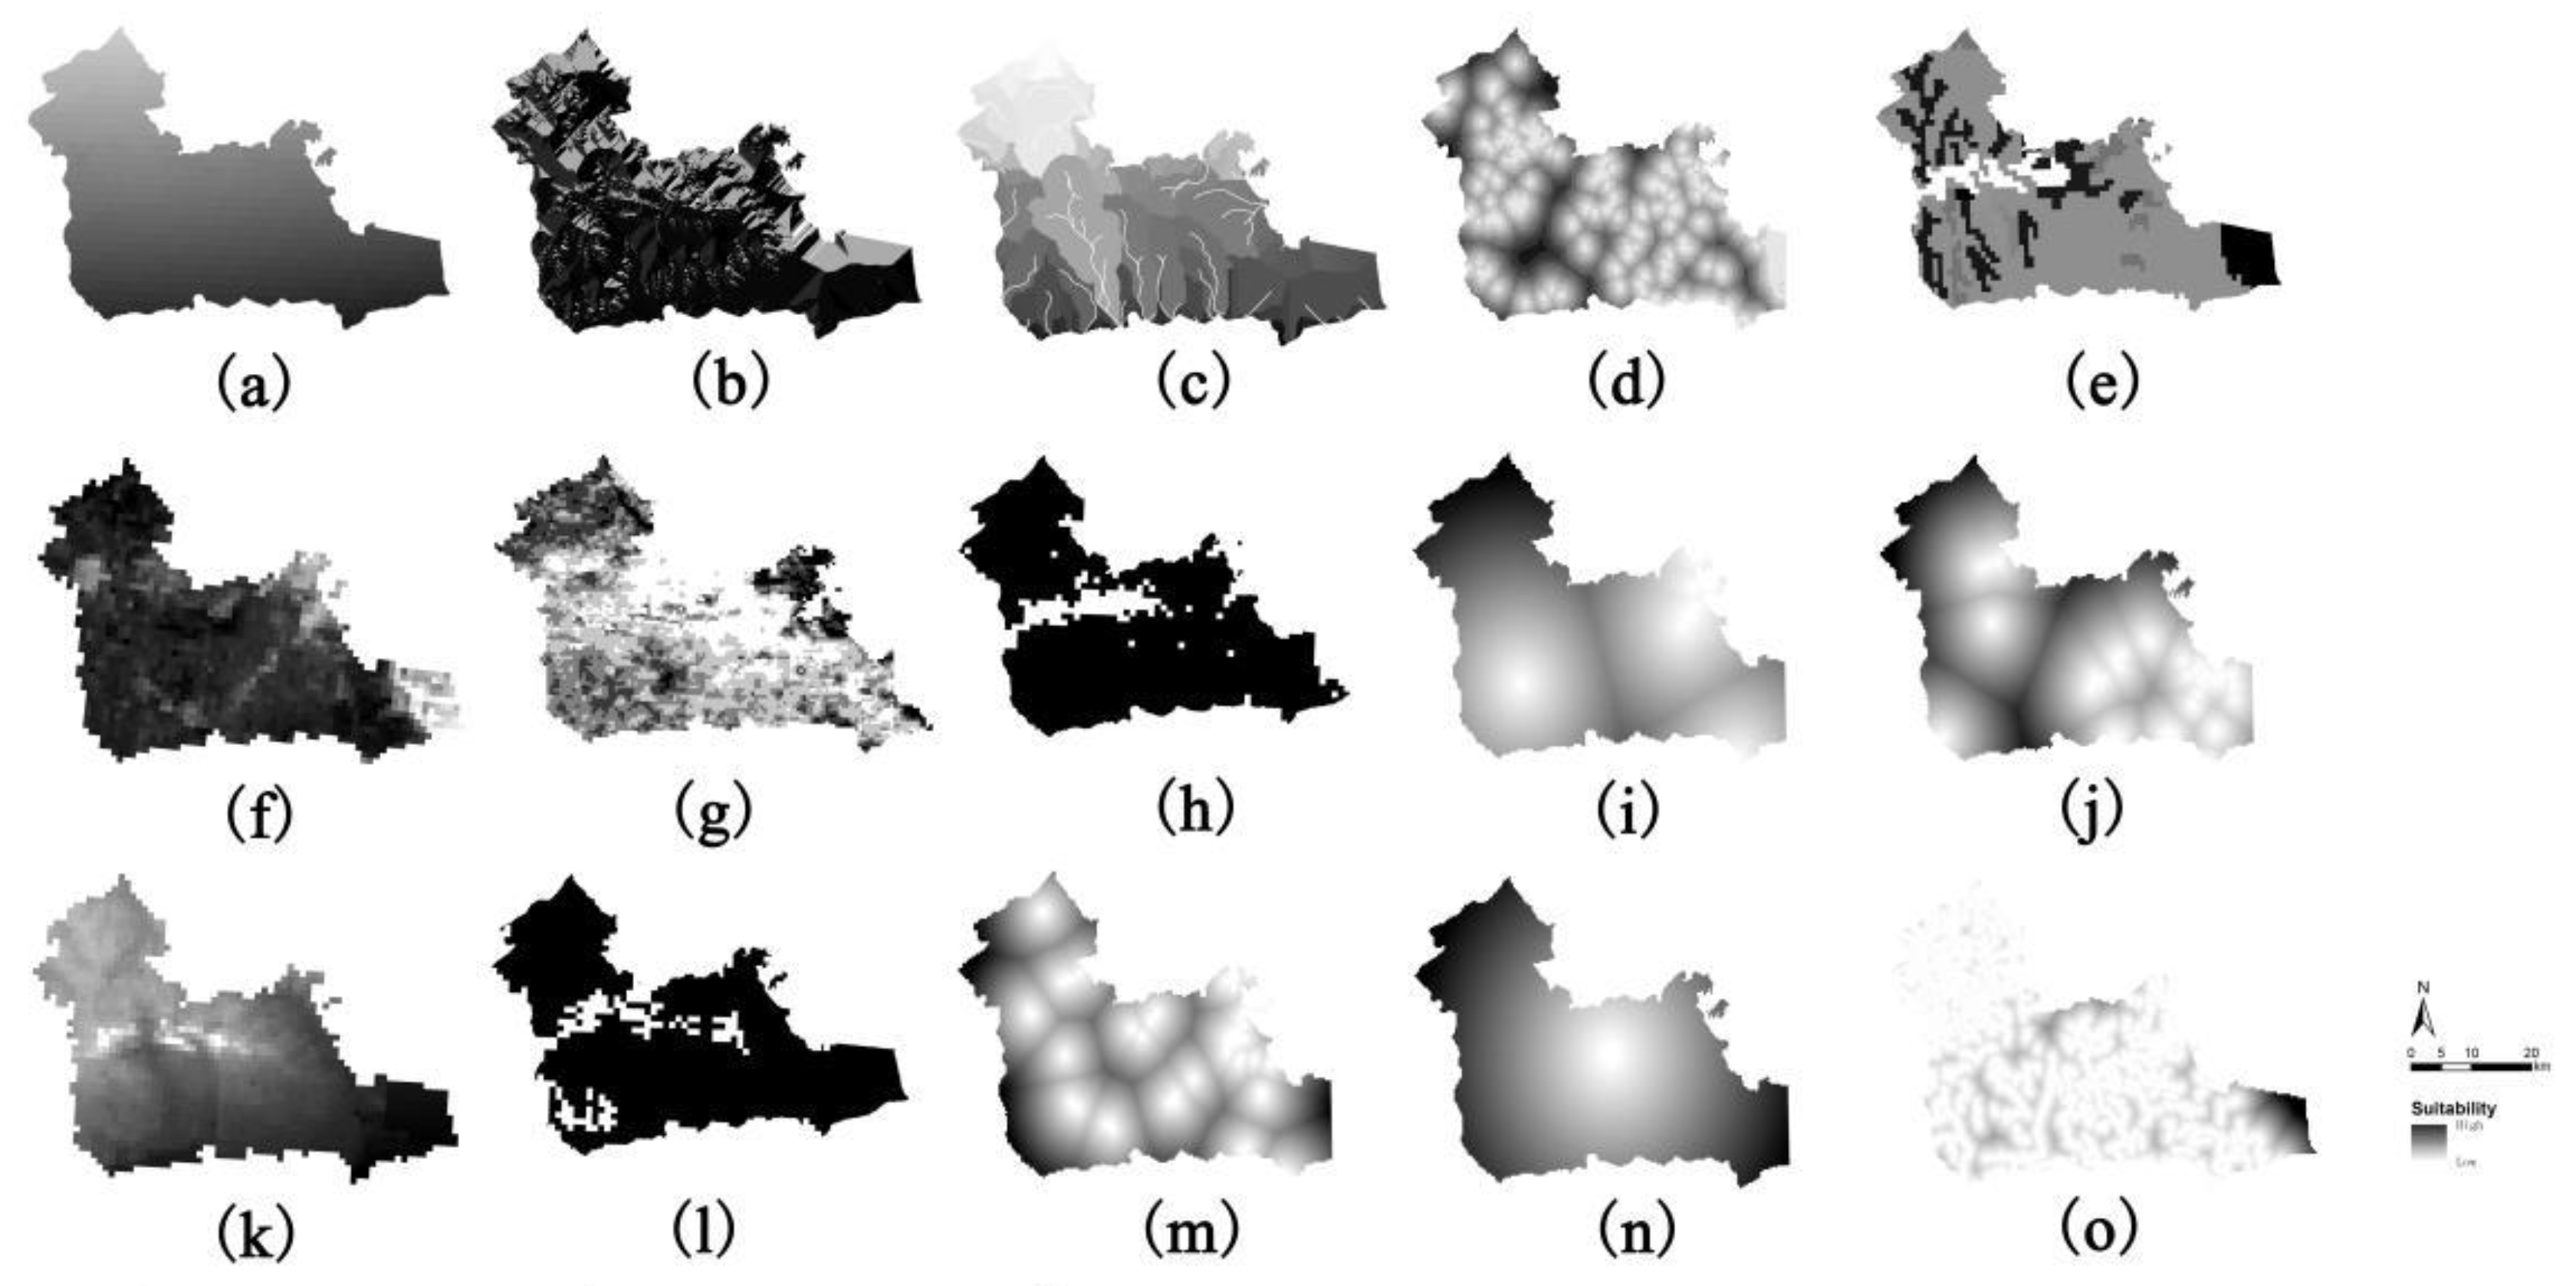
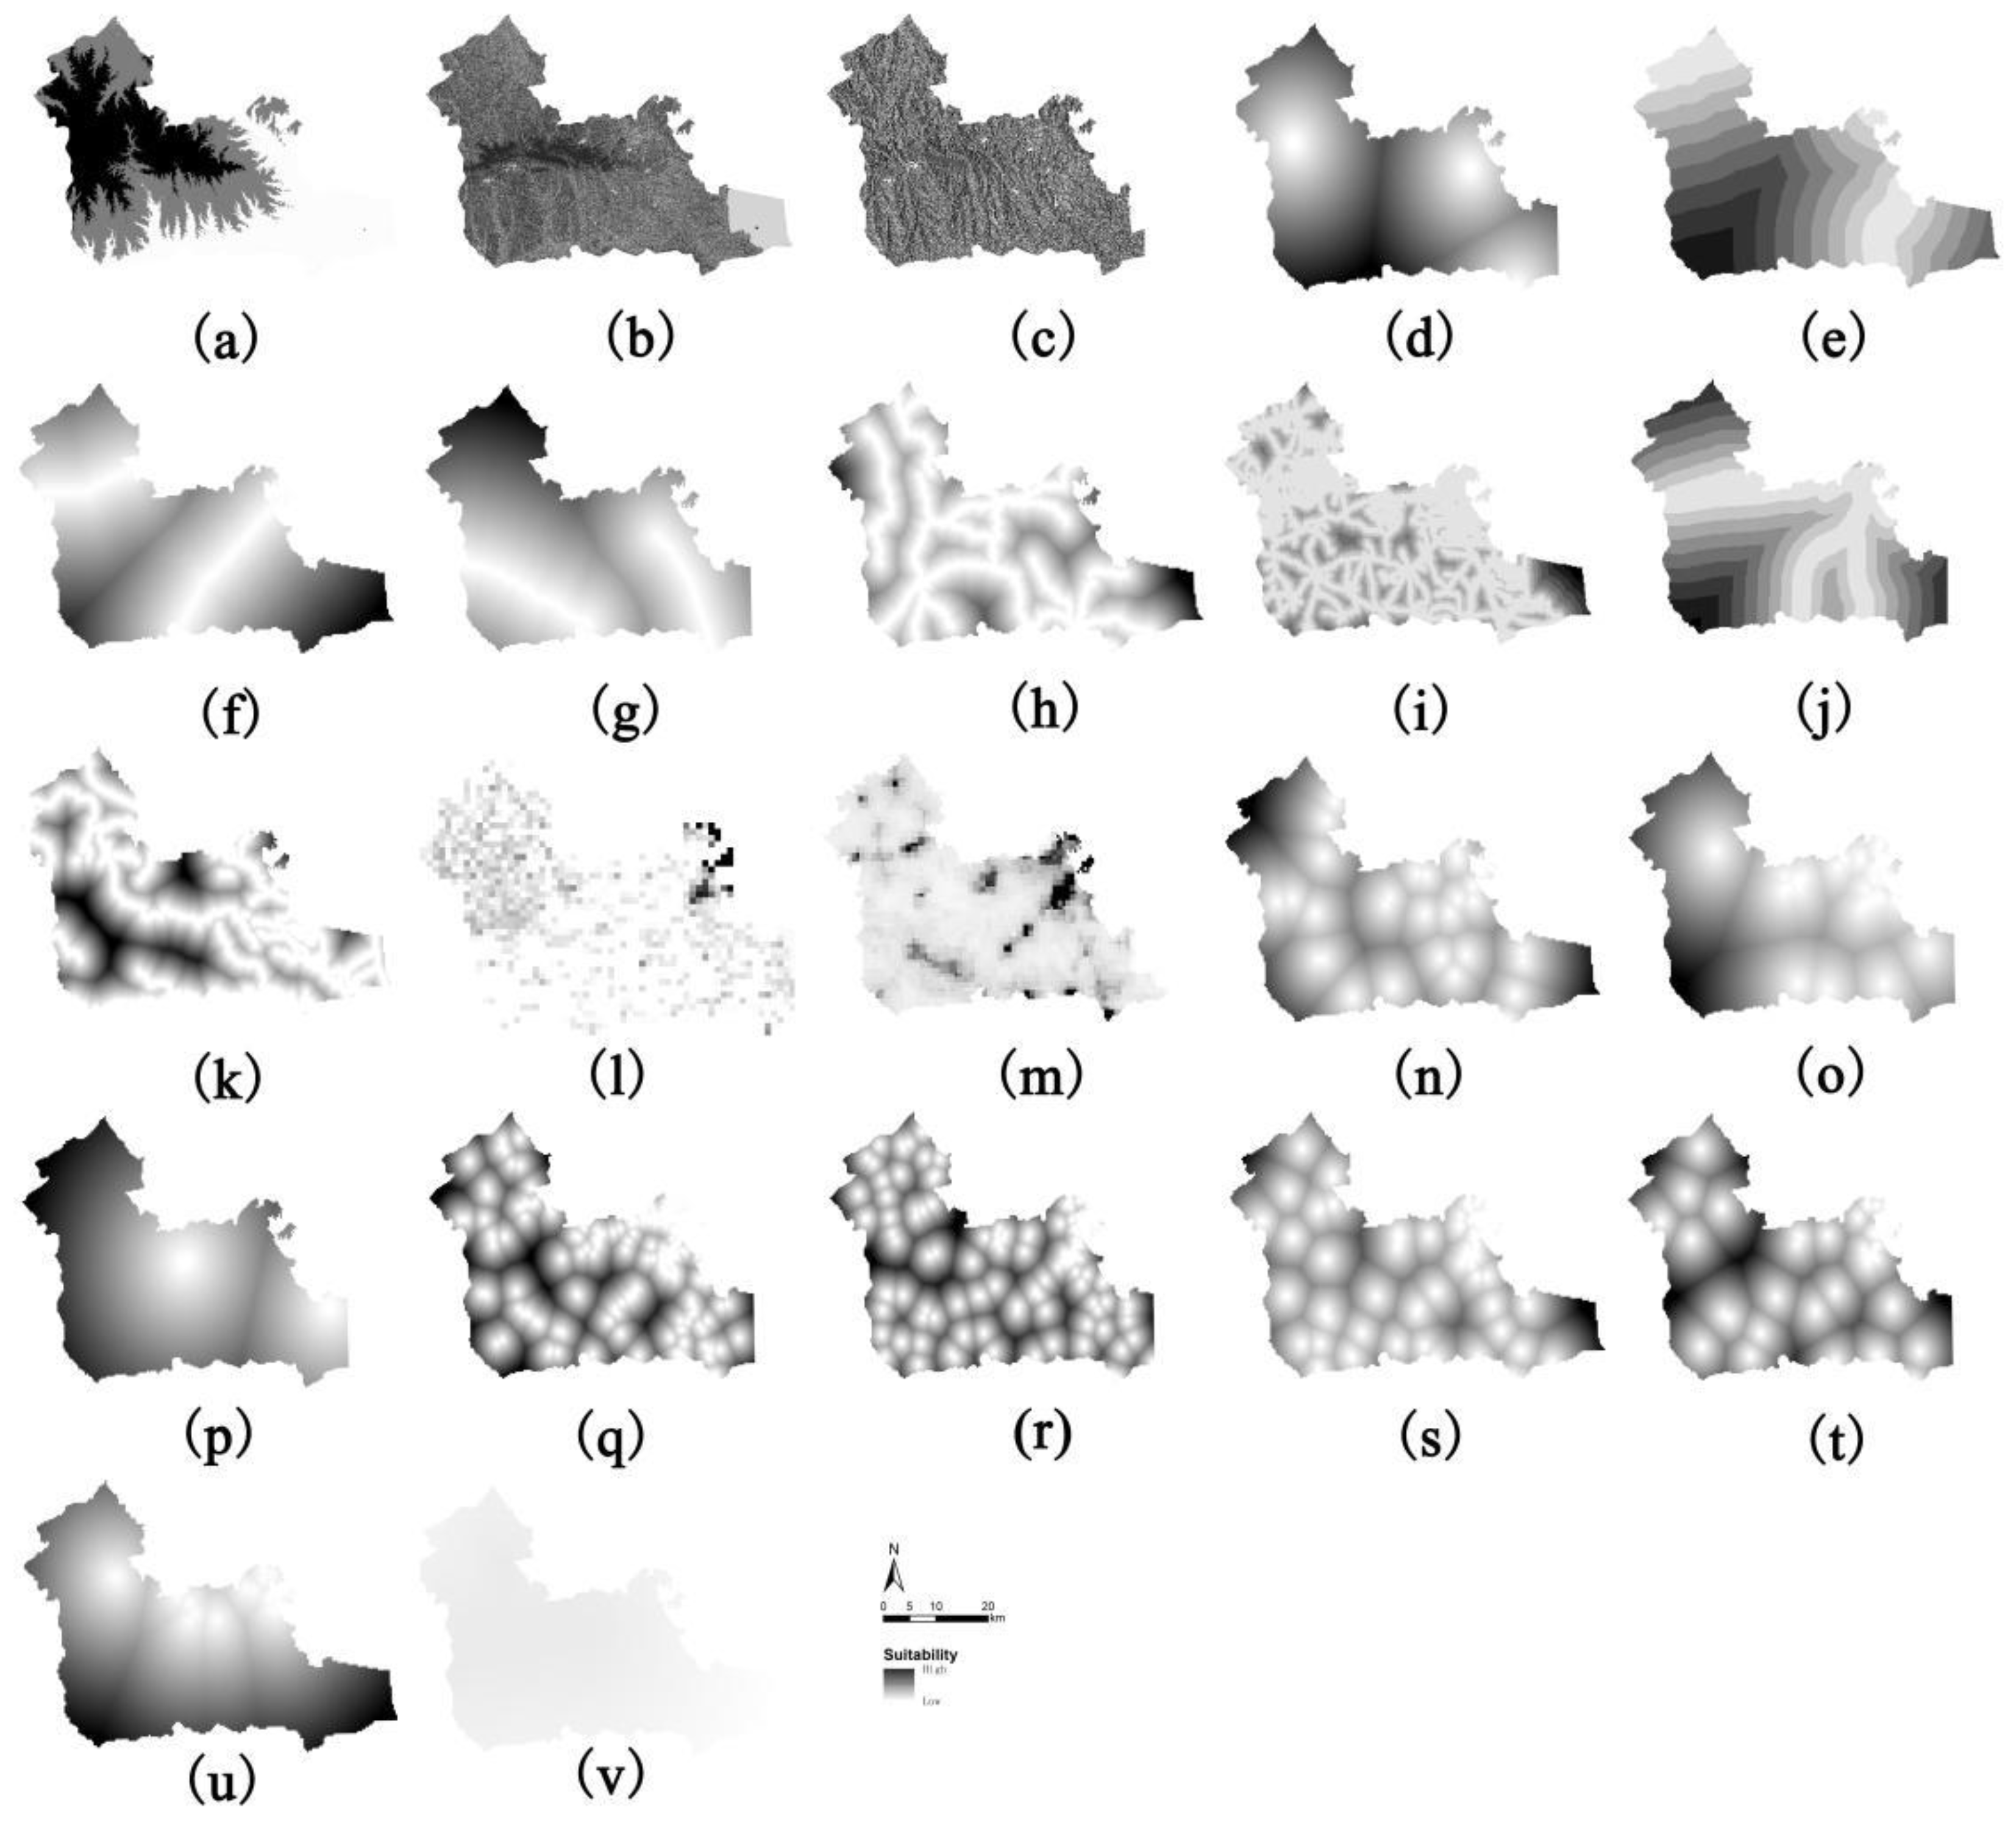
3.2. Spatial Distribution of the Suitability of Spatial Development of P-L-E
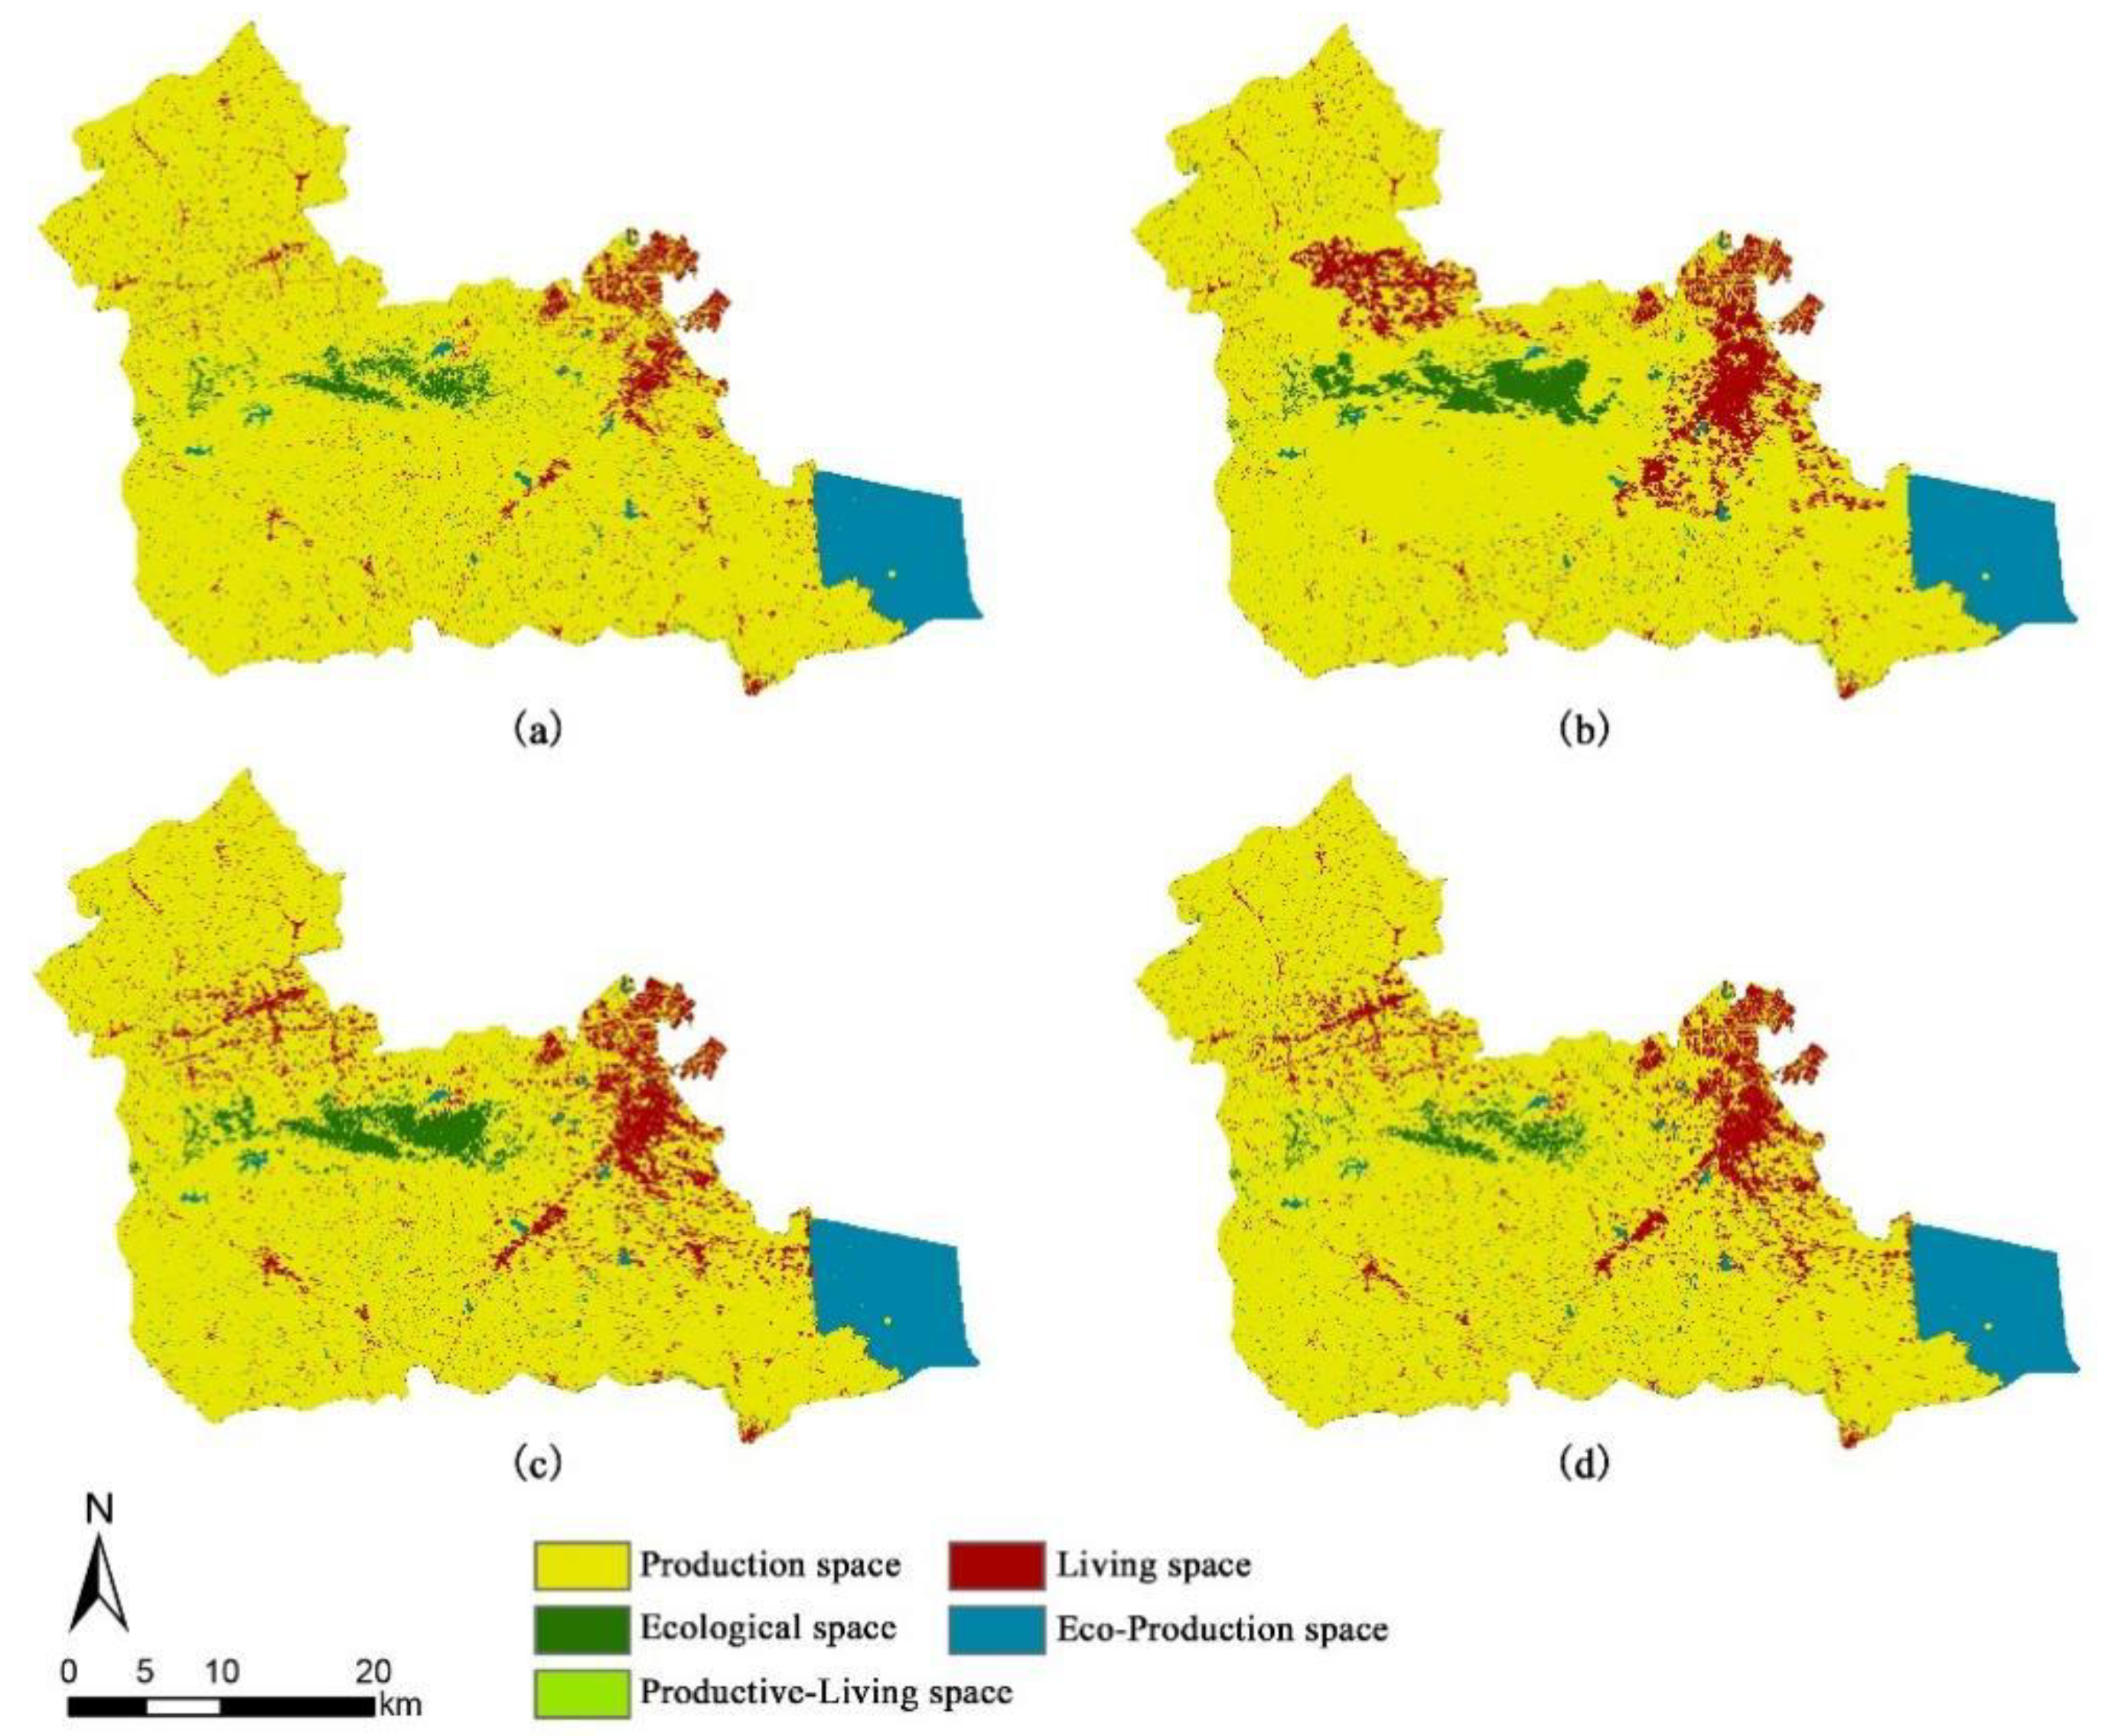
3.3. Simulation Results of Spatial Distribution Scenarios
3.3.1. Qualitative Analysis for Driving Factors
3.3.2. Simulation Results of the Spatial Distribution Scenarios of Three Statuses
3.3.3. Comprehensive Evaluation Results of Landscape Patches
4. Discussion
4.1. Spatial Function and Coupled Evaluation
4.2. P-L-E Space Pattern and Driving Forces
4.3. Development Suitability and Land-Use Simulation
4.4. Recommendations and Future Strategies
5. Conclusions
Author Contributions
Funding
Institutional Review Board Statement
Informed Consent Statement
Data Availability Statement
Conflicts of Interest
References
- Reidsma, P.; König, H.; Feng, S.Y.; Bezlepkina, I.; Nesheim, I.; Bonin, M.; Sghaier, M.; Purushothaman, S.; Sieber, S.; Van Ittersum, M.K.; et al. Methods and tools for integrated assessment of land use policies on sustainable development in developing countries. Land Use Policy 2011, 28, 604–617. [Google Scholar] [CrossRef]
- Verburg, P.H.; van de Steeg, J.; Veldkamp, A.; Willemen, L. From land cover change to land function dynamics: A major challenge to improve land characterization. J. Environ. Manag. 2009, 90, 1327–1335. [Google Scholar] [CrossRef] [PubMed]
- Wiggering, H.; Dalchow, C.; Glemnitz, M.; Helming, K.; Müller, K.; Schultz, A.; Stachow, U.; Zander, P. Indicators for multifunctional land use: Linking socio-economic requirements with landscape potentials. Ecol. Indic. 2006, 6, 238–249. [Google Scholar] [CrossRef]
- Gaodi, X.; Lin, Z.; Caixia, Z.; Xiangzheng, D.; Koenig, H.J.; Tscherning, K.; Helming, K. Assessing the multifunctionalities of land use in China. J. Resour. Ecol. 2010, 1, 311–318. [Google Scholar]
- Jiang, X.; Zhai, S.; Liu, H.; Chen, J.; Zhu, Y.; Wang, Z. Multi-scenario simulation of production-living-ecological space and ecological effects based on shared socioeconomic pathways in Zhengzhou, China. Ecol. Indic. 2022, 137, 108750. [Google Scholar] [CrossRef]
- Huang, J.C.; Lin, H.X.; Qi, X.X. A literature review on optimization of spatial development pattern based on ecological-production-living space. Prog. Geogr. 2017, 36, 378–391. [Google Scholar]
- Liao, G.T.; He, P.; Gao, X.S.; Deng, L.J.; Zhang, H.; Feng, N.N.; Zhou, W.; Deng, O.P. The “Production-Living-Ecological” land classification system and its characteristics in the hilly area of Sichuan province, Southwest China based on identification of the main functions. Sustainability 2019, 11, 1600. [Google Scholar] [CrossRef] [Green Version]
- Zhang, X.S.; Xu, Z.J. Spatial temporal evolution of functional coupling coordination degree of production-living-ecological space and its relationship with human activity intensity in ethnic minority areas-taking minority autonomous prefecture of Guizhou as an example. Res. Soil Water Conserv. 2021, 28, 268–273. [Google Scholar]
- Yu, G.S.; Zhao, M.H. Research status summary of domestic “P-L-E space” research based on bibliometrics. J. Guangzhou Univ. (Nat. Sci. Ed.) 2018, 17, 76–82. [Google Scholar]
- Ande Rsen, P.S.; Vejre, H.; Dalgaa, R.T.; Brandt, J. An indicator-based method for quantifying farm multifunctionality. Ecol. Indic. 2013, 25, 166–179. [Google Scholar] [CrossRef]
- De Groot, R.; Wilson, M.A.; Boumans RM, J. A typology for the classification, description and valuation of ecosystem functions, goods and services. Ecol. Econ. 2002, 41, 393–408. [Google Scholar] [CrossRef] [Green Version]
- Lovell, S.T.; Nathan, C.A.; Olson, M.B.; Mendez, V.E.; Kominami, H.C.; Erickson, D.L.; Morris, K.S.; Morris, W.B. Integrating agroecology and landscape multifunctionality in Vermont: An evolving framework to evaluate the design of agroecosystems. Agric. Syst. 2010, 103, 327–341. [Google Scholar] [CrossRef]
- Liu, C.; Li, W.; Xu, J.; Zhou, H.; Li, C.; Wang, W. Global trends and characteristics of ecological security research in the early 21st century: A literature review and bibliometric analysis. Ecol. Indic. 2022, 137, 108734. [Google Scholar] [CrossRef]
- Morano, P.; Guarini, M.R.; Sica, F.; Anelli, D. Ecosystem Services and Land Take. A Composite Indicator for the Assessment of Sustainable Urban Projects. In International Conference on Computational Science and Its Applications; Springer: Cham, Switzerland, 2021; pp. 210–225. [Google Scholar]
- Fu, J.; Zhang, S. Functional Assessment and Coordination Characteristics of Production, Living, Ecological Function—A Case Study of Henan Province, China. Int. J. Environ. Res. Public Health 2021, 18, 8051. [Google Scholar] [CrossRef]
- Zou, L.; Liu, Y.; Wang, J.; Yang, Y. An analysis of land use conflict potentials based on ecological-production-living function in the southeast coastal area of China. Ecol. Indic. 2021, 122, 107297. [Google Scholar] [CrossRef]
- Paracchini, M.L.; Pacini, C.; Jones, M.L.M.; Pérez-Soba, M. An aggregation framework to link indicators associated with multi-functional land use to the stakeholder evaluation of policy options. Ecol. Indic. 2011, 11, 71–80. [Google Scholar] [CrossRef]
- Zhang, J.X. Assessment of land space utilization quality and its coupling and coordination based on producing, living and ecological—A case study of the southern Jiangsu region. J. Agric. Sci. 2017, 38, 57–63. [Google Scholar]
- Liang, X.; Guan, Q.; Clarke, K.C.; Liu, S.; Wang, B.; Yao, Y. Understanding the drivers of sustainable land expansion using a patch-generating land use simulation (PLUS) model: A case study in Wuhan, China. Comput. Environ. Urban Syst. 2021, 85, 101569. [Google Scholar] [CrossRef]
- Li, S.-Y.; Liu, X.-P.; Li, X.; Chen, Y.M. Simulation model of land use dynamics and application: Progress and prospects. J. Remote Sens. 2017, 21, 329–340. [Google Scholar]
- Xu, X.; Guan, M.; Jiang, H.; Wang, L. Dynamic Simulation of Land Use Change of the Upper and Middle Streams of the Luan River, Northern China. Sustainability 2019, 11, 4909. [Google Scholar] [CrossRef] [Green Version]
- Lai, Y.; Huang, G.; Chen, S.; Lin, S.; Lin, W.; Lyu, J. Land Use Dynamics and Optimization from 2000 to 2020 in East Guangdong Province, China. Sustainability 2021, 13, 3473. [Google Scholar] [CrossRef]
- Liang, X.W.; Zhang, Y. Evolution characteristics of spatial and temporal pattern of rural life-production-ecological spatial coupling and coordination in Shandong province. Jiangsu Agric. Sci. 2021, 49, 20–27. [Google Scholar]
- Li, G.D.; Fang, C.L. Quantitative function identification and analysis ofurban ecological-production-living spaces. Acta Geogr. Sin. 2016, 71, 49–65. [Google Scholar]
- Fu, B.J. Several Key Points in Territorial Ecological Restoration. Bull. Chin. Acad. Sci. 2021, 36, 64–69. [Google Scholar]
- Hao, Q.; Peng, J.; Wei, Y.; Wang, F.L.; Yao, H.S.; Wang, W.; Zhang, S.H.; Deng, L.; Zhao, Y.T. The connotation of territory and the suggestions of drawing upspatial planning in the New Era. J. Nat. Resour. 2021, 36, 2219–2247. [Google Scholar]
- Liu, H.Z.; Zhou, G.H.; Wang, P.; Shen, W. Progress and Prospect of CiteSpace-Based Studies onTerritorial Spatial Planning. J. Nat. Sci. Hunan Norm. Univ. 2021, 44, 1–10. [Google Scholar]
- Peng, J.; LYU, D.N.; Dong, J.Q.; Liu, Y.X.; Liu, Q.Y. Processes coupling and spatial integration: Characterizing ecological restoration of territorial space in view of landscape ecology. J. Nat. Resour. 2020, 35, 3–13. [Google Scholar]
- Guo, T.W.; Lu, C.F.; Wang, J.; Liu, R.; Zhou, S. Construction and optimization of ecological security pattern based on the coupling ofecological-production-living spaces: Taking Yangzhou City as an example. J. Nanjing For. Univ. (Nat. Sci. Ed.) 2021, 45, 133–142. [Google Scholar]
- Chen, X.L.; Luo, M.S.Y. Study on characteristics of the spatio-temporal evolution in coupling and coordination of “ecological-production-living” spatial function in the Yangtze river economic belt. Sci. Technol. Manag. Land Resour. 2019, 36, 1–12. [Google Scholar]
- Wu, X.X.; Liu, X.P.; Liang, X.; Chen, G. Multi-scenarios simulation of urban growth boundaries in Pearl River Delta based on FLUS-UGB. J. Geo-Inf. Sci. 2018, 20, 532–542. [Google Scholar]
- Zhu, S.H.; Shu, B.R.; Ma, X.D.; Liang, X.; Yao, Q. The delimitation of urban growth boundary based on the idea of “Anti-planning” and FLUS Model: A case study of Jiawang District, Xuzhou City. Geogr. Geo-Inf. Sci. 2017, 33, 80–86 + 127. [Google Scholar]
- Zhang, W.; Li, B. Research on an Analytical Framework for Urban Spatial Structural and Functional Optimisation: A Case Study of Beijing City, China. Land 2021, 10, 86. [Google Scholar] [CrossRef]
- Penny, J.; Djordjevic, S.; Chen, A.S. Using public participation within land use change scenarios for analysing environmental and socioeconomic drivers. Environ. Res. Lett. 2022, 17, 025002. [Google Scholar] [CrossRef]
- Ma, Y.; Wang, M.; Zhou, M.; Tu, J.T.; Ma, C.N.; Li, S.Q. Multiple scenarios-based on a hybrid economy-environment-ecology model for land-use structural and spatial optimization under uncertainty: A case study in Wuhan, China. Stoch. Environ. Res. Risk Assess 2022. [Google Scholar] [CrossRef]
- Xu, X.; Zhang, D.; Liu, X.; Ou, J.P.; Wu, X.X. Simulating multiple urban land use changes by integrating transportation accessibility and a vector-based cellular automata: A case study on city of Toronto. Geo-Spat. Inf. Sci. 2022. [Google Scholar] [CrossRef]
- Mansour, S.; Al-Belushi, M.; Al-Awadhi, T. Monitoring land use and land cover changes in the mountainous cities of Oman using GIS and CA-Markov modelling techniques. Land Use Policy 2020, 91, 104414. [Google Scholar] [CrossRef]
- Ye, X.; Yu, W.W.; Yu, W.H.; Lv, L.N. Simulating urban growth through case-based reasoning. Eur. J. Remote Sens. 2022, 55, 277–290. [Google Scholar] [CrossRef]
- Wang, R.; Peng, Q.; Zhang, W.; Zhao, W.; Liu, C.; Zhou, L. Ecohydrological Service Characteristics of Qilian Mountain Ecosystem in the next 30 Years Based on Scenario Simulation. Sustainability 2022, 14, 1819. [Google Scholar] [CrossRef]
- Yang, X.; Li, S.; Zhu, C.; Dong, B.Y.; Xu, H.W. Simulating Urban Expansion Based on Ecological Security Pattern—A Case Study of Hangzhou, China. Int. J. Environ. Res. Public Health 2022, 19, 301. [Google Scholar] [CrossRef]
- Chen, Z.; Huang, M.; Zhu, D.; Altan, O. Integrating Remote Sensing and a Markov-FLUS Model to Simulate Future Land Use Changes in Hokkaido, Japan. Remote Sens. 2021, 13, 2621. [Google Scholar] [CrossRef]
- Sun, Q.; Wu, M.; Du, P.; Qi, W.; Yu, X. Spatial Layout Optimization and Simulation of Cultivated Land Based on the Life Community Theory in a Mountainous and Hilly Area of China. Sustainability 2022, 14, 3821. [Google Scholar] [CrossRef]
- Huo, J.; Shi, Z.; Zhu, W.; Xue, H.; Chen, X. A Multi-Scenario Simulation and Optimization of Land Use with a Markov–FLUS Coupling Model: A Case Study in Xiong’an New Area, China. Sustainability 2022, 14, 2425. [Google Scholar] [CrossRef]
- Lin, J.; He, P.; Yang, L.; He, X.; Lu, S.; Liu, D. Predicting future urban waterlogging-prone areas by coupling the maximum entropy and FLUS model. Sustain. Cities Soc. 2022, 80, 103812. [Google Scholar] [CrossRef]
- Wang, Q.; Guan, Q.; Lin, J.; Luo, H.; Tan, Z.; Ma, Y. Simulating land use/land cover change in an arid region with the coupling models. Ecol. Indic. 2021, 122, 107231. [Google Scholar] [CrossRef]
- Wang, Y.; Liu, X.-L.; Wei, X.; Yu, H. The method and practice of regional spatial planning from “three basic spaces” to “three-zones and three-lines”. Urban Plan. Forum 2018, 4, 65–74. [Google Scholar]
- Jiang, D.; Lin, G.; Fu, J.Y. Discussion on scientific foundation and approach for the overalloptimization of “Production-Living-Ecological” space. J. Nat. Resour. 2021, 36, 1085–1101. [Google Scholar]
- Wang, J.; Bretz, M.; Dewan, M.A.A.; Delavar, M.A. Machine learning in modelling land-use and land cover-change (LULCC): Current status, challenges and prospects. Sci. Total Environ. 2022, 822, 153559. [Google Scholar] [CrossRef]
- Jiang, M.Q.; Liu, Y. Discussion on the Concept Definition and Spatial Boundary Classification of “Production-Living-Ecological” Space. Urban Dev. Stud. 2020, 27, 43–48 + 61. [Google Scholar]
- Feng, X.J.; Luo, Z.J.; Xu, J.; Li, F. Suitability evaluation of urban-rural construction land development and evaluation of spatial pattern matching based on “production-living-ecological” space: Case study of Leping city in Jiangxi province. Southwest China J. Agric. Sci. 2021, 34, 2014–2024. [Google Scholar]
- Zhang, H.Q.; Xu, E.Q.; Zhu, H. An ecological-living-industrial land classification system and its spatial distribution in China. Resour. Sci. 2015, 37, 1332–1338. [Google Scholar]
- Liu, J.L.; Liu, Y.S.; Li, Y.R. Classification evaluation and spatial-temporal analysis of “production-living-ecological” spaces in China. Acta Geogr. Sin. 2017, 72, 1290–1304. [Google Scholar]
- Wang, C.; Tang, N. Spatio-temporal characteristics and evolution of rural production-living-ecological space function coupling coordination in Chongqing municipality. Geogr. Res. 2018, 37, 1100–1114. [Google Scholar]
- Li, S.N.; Zhao, X.Q.; Pu, J.W.; Wang, Q.; Miao, P.P.; Tan, K. Territorial space function quality evaluation and coupling coordination analysis in typical karst areas of Southwest China: A case study of Guangnan county. J. Nat. Resour. 2021, 36, 2350–2367. [Google Scholar] [CrossRef]
- Zhang, J.T.; Zhai, J.T. The coupling coordination degree evaluation on China’s production-living-ecological space. Urban Probl. 2019, 38–44. [Google Scholar] [CrossRef]
- Li, H.Y. Research on new urbanization coordinated development of Beijing-Tianjin-Hebei city cluster based on the concept of “production-living-ecology” space. Ecol. Econ. 2021, 37, 92–98. [Google Scholar]
- Pang, L.; Zhou, X.; Wei, L.G. Function evaluation and coupling coordination analysis of land space “production-living-ecological” in Guangxi Zhuang autonomous region during 2009–2018. Bull. Soil Water Conserv. 2021, 41, 237–244 + 251. [Google Scholar]
- Gao, H.H.; Wang, Z.Q.; Wang, T.; Yang, Y.C. Optimizing the layout of rural settlements in Zhongquan town under the coordination of P-L-E space. Sci. Surv. Mapp. 2021, 46, 176–182. [Google Scholar]
- Yang, Z.; Li, S.; Sun, D.; Li, C.; Wu, J. Intensive Evaluation and High-Quality Redevelopment of Enterprise Land Use: A Case Study in China. Land 2022, 11, 432. [Google Scholar] [CrossRef]
- Zhao, X.; Peng, J.D.; Fan, Z.Y.; Yang, C.; Yang, H. Land use simulation and urban growth boundaries delineation in Wuhan metropolitan area based on FLUS model and “dual environment evaluation”. J. Geo-Inf. Sci. 2020, 22, 2212–2226. [Google Scholar]
- Xie, G.D.; Zhang, C.X.; Zhang, L.M.; Chen, W.H.; Li, S.M. Improvement of the evaluation method for ecosystem service value based on per unit area. J. Nat. Resour. 2015, 30, 1243–1254. [Google Scholar]
- Jiang, G.X.; Wang, J.H.; Luo, Y. Rethinking “dual evaluations” of national land use and spatial plan and their optimization. Planners 2020, 36, 10–14. [Google Scholar]
- Wu, Y.J.; Yang, Y.Z.; Yang, L.; Zhang, C.; You, Z. Land spatial development and suitability for city construction based onecological-living-industrial space—Take Ningbo City as an example. Resour. Sci. 2016, 38, 2072–2081. [Google Scholar]
- Wang, X.; Ma, B.W.; Li, D.; Chen, K.L.; Yao, H.S. Multi-scenario simulation and prediction of ecological space in Hubei province based on FLUS model. J. Nat. Resour. 2020, 35, 230–242. [Google Scholar]
- Zhao, X.; Tang, F.; Zhang, P.T.; Hu, B.Y.; Xu, L. Dynamic simulation and characteristic analysis of county production-living-ecological spatial conflicts based of CLUE-S model. Acta Ecol. Sin. 2019, 39, 5897–5908. [Google Scholar]
- Wang, B.S.; Liao, J.F.; Zhu, W.; Qiu, Q.Y.; Wang, L.; Tang, L.N. The weight of neighborhood setting of the FLUS model based on a historical scenario: A case study of land use simulation of urban agglomeration of the Golden Triangle of Southern Fujian in 2030. Acta Ecol. Sin. 2019, 39, 4284–4298. [Google Scholar]
- Dinda, S.; Das Chatterjee, N.; Ghosh, S. An integrated simulation approach to the assessment of urban growth pattern and loss in urban green space in Kolkata, India: A GIS-based analysis. Ecol. Indic. 2021, 121, 21. [Google Scholar] [CrossRef]
- Zhang, J.; Li, X.C.; Zhang, C.C.; Yu, L.; Wang, J.Z.; Wu, X.Y.; Hu, Z.W.; Zhai, Z.H.; Li, Q.Q.; Wu, G.F.; et al. Assessing spatiotemporal variations and predicting changes in ecosystem service values in the Guangdong-Hong Kong-Macao Greater Bay Area. GISci Remote Sens. 2022, 59, 184–199. [Google Scholar] [CrossRef]
- Liao, G.T.; He, P.; Gao, X.S.; Lin, Z.Y.; Huang, C.Y.; Zhou, W.; Deng, O.P.; Xu, C.H.; Deng, L.J. Land use optimization of rural production-living-ecological space at different scales based on the BP-ANN and CLUE-S models. Ecol. Indic. 2022, 137, 108710. [Google Scholar] [CrossRef]
- Wang, Q.; Wang, H. Dynamic simulation and conflict identification analysis of production-living-ecological space in Wuhan, Central China. Integr. Environ. Assess Manag. 2022. [Google Scholar] [CrossRef]
- Ji, Y.X.; Bai, Z.K.; Hui, J.W. Landscape Ecological Risk Assessment Based on LUCC–A Case Study of Chaoyang County, China. Forests 2021, 12, 1157. [Google Scholar] [CrossRef]
- Wei, C.; Lin, Q.W.; Yu, L.; Zhang, H.; Ye, S.; Zhang, D. Research on Sustainable Land Use Based on Production-Living-Ecological Function: A Case Study of Hubei Province, China. Sustainability 2021, 13, 996. [Google Scholar] [CrossRef]
- Wang, L.Y.; Li, F.X.; Gong, Y.; Jiang, P.; Huang, Q.; Hong, W.; Chen, D. A Quality Assessment of National Territory Use at the City Level: A Planning Review Perspective. Sustainability 2016, 8, 145. [Google Scholar] [CrossRef] [Green Version]
- Xie, H.L. Towards Sustainable Land Use in China: A Collection of Empirical Studies. Sustainability 2017, 9, 2129. [Google Scholar] [CrossRef] [Green Version]
- Jiao, M.Y.; Hu, M.M.; Xia, B.C. Spatiotemporal dynamic simulation of land-use and landscape-pattern in the Pearl River Delta, China. Sustain. Cities Soc. 2019, 49, 101581. [Google Scholar] [CrossRef]
- Kobayashi, Y.; Higa, M.; Higashiyama, K.; Nakamura, F. Drivers of land-use changes in societies with decreasing populations: A comparison of the factors affecting farmland abandonment in a food production area in Japan. PLoS ONE 2020, 15, e0235846. [Google Scholar] [CrossRef]
- Tian, F.H.; Li, M.Y.; Han, X.L.; Liu, H.; Mo, B. A Production-Living-Ecological Space Model for Land-Use Optimisation: A case study of the core Tumen River region in China. Ecol. Model. 2020, 437, 109310. [Google Scholar] [CrossRef]
- Huang, R.J.; Nie, Y.J.; Duo, L.H.; Zhang, X.; Wu, Z.; Xiong, J. Construction land suitability assessment in rapid urbanizing cities for promoting the implementation of United Nations sustainable development goals: A case study of Nanchang, China. Environ. Sci. Pollut. Res. 2021, 28, 25650–25663. [Google Scholar] [CrossRef]
- Ustaoglu, E.; Aydınoglu, A.C. Suitability evaluation of urban construction land in Pendik district of Istanbul, Turkey. Land Use Policy 2020, 99, 104783. [Google Scholar] [CrossRef]
- Zhang, X.; Fang, C.; Wang, Z.; Ma, H. Urban construction land suitability evaluation based on improved multi-criteria evaluation based on GIS (MCE-GIS): Case of new Hefei City, China. Chin. Geogr. Sci. 2013, 23, 740–753. [Google Scholar] [CrossRef] [Green Version]
- Lin, Y.; Fan, J.; Wen, Q.; Liu, S.; Li, B. Primary exploration of ecological theories and technologies for delineation of ecological redline zones. Acta Ecol. Sin. 2016, 36, 1244–1252. [Google Scholar]
- Wu, J.S.; Zhang, D.N.; Wang, H.; Li, X. What is the future for production-living-ecological spaces in the Greater Bay Area? A multi-scenario perspective based on DEE. Ecol. Indic. 2021, 131, 108171. [Google Scholar] [CrossRef]
- Yang, S.; Zou, C.; Shen, W.; Shen, R.; Xu, D. Construction of ecological security patterns based on ecological red line: A case study of Jiangxi Province. Chin. J. Ecol. 2016, 35, 250–258. [Google Scholar]
- Wilhelm, J.A.; Smith, R.G.; Jolejole-Foreman, M.C.; Hurley, S. Resident and stakeholder perceptions of ecosystem services associated with agricultural landscapes in New Hampshire. Ecosyst. Serv. 2020, 45, 101153. [Google Scholar] [CrossRef]
- Wang, Y.; Fan, J.; Zhou, K. Territorial function optimization regionalization based on the integration of “Double Evaluation”. Geogr. Res. 2019, 38, 2415–2429. [Google Scholar]
- Zhou, D.; Xu, Y.; Wang, Y.; Zhou, K.; Liu, B.; Li, J.; Fan, J. Methodology and role of “double evaluation” in optimization of spatial development pattern. Bull. Chin. Acad. Sci. 2020, 35, 814–824. [Google Scholar]


| Category | Data Name | Data Format | Year | Data Source |
|---|---|---|---|---|
| Land database | Land-use data | 30 m × 30 m raster | 2010, 2015 and 2020 | US Geological Survey (https://glovis.usgs.gov/ (accessed on 18 October 2021)) |
| Socio-economic Factors | Coupling coordination analysis series data | Text data | 2010, 2015 and 2020 | China Rural Statistical Yearbook, Hefei City Statistical Yearbook and Anhui Province Ecological Environment Status Bulletin |
| Urbanization | 30 m × 30 m raster data | 2015 and 2018 | Resource and Environment Science and Data Center (http://www.resdc.cn/ (accessed on 18 October 2021)) | |
| Economic development | 1 km × 1 km per capita GDP | 2015 | ||
| Population gathering | 30 m × 30 m raster data | 2020 | Gaode Map POI data (https://lbs.amap.com/ (accessed on 18 October 2021)) | |
| Topography | Digital elevation model data (DEM) | 30 m × 30 m raster | 2015 | National Basic Science Data Center (http://www.nbsdc.cn/ (accessed on 18 October 2021)) |
| Locational Factors | Transportation advantages | 30 m × 30 m raster | 2020 | Gaode Map POI data (https://lbs.amap.com/ (accessed on 18 October 2021)) |
| Natural Environmental Factors | Water resources | 1 km × 1 km raster data | 2015 | Resource and Environment Science and Data Center (http://www.resdc.cn/ (accessed on 18 October 2021)) and China National Environmental Monitoring Center (http://www.cnemc.cn (accessed on 18 October 2021)) |
| Land resources | Calculate the spatial distribution of chalky soil, clay and sand content | 1995 | ||
| Atmospheric resources | 1 km × 1 km raster data | 2010 and 2018 | ||
| Soil erosion | 1 km × 1 km erosion intensity | 2015 | ||
| Biological diversity | Specific reference to spatial distribution data of ecosystem service values | 2015 | ||
| Ecological development | Specific reference to spatial distribution data of ecosystem service values | 2015 | ||
| Vegetation resources | NDVI data | 2018 | Big Earth Data Science Engineering Data Sharing Service System (https://data.casearth.cn/ (accessed on 18 October 2021)) | |
| Food resources | NPP data | 2015 |
| Space Classification | Land-Use Type | Further Subdivision of Land Use | Description | |
|---|---|---|---|---|
| Tier 1 | Tier 2 | |||
| Single functional space | Ecological space | Woodland | Wooded land, shrubland, other wooded land | With climate regulation, atmospheric regulation, soil and water regulation and other ecosystem regulation functions play an important role in biodiversity |
| Grass | Natural pasture, other grasslands | Provide biological products, atmospheric regulation, climate regulation, water conservation, soil and water conservation, ecological landscape and recreation | ||
| Water and water facilities land | River water surface, lake water surface, inland mudflats | Plays an important role in regulating regional temperatures and stabilizing local climate | ||
| Other land | Vacant land, saline land, swampy land, sandy land, bare land | Important ecological function of the landscape | ||
| Production space | Cropland | Paddy field, watered land, dry land | Production function for providing food and other biological products | |
| Other land | Facility agricultural land, field | Has a certain production function | ||
| Commercial land | Wholesale and retail land, accommodation and catering land, business and financial land, other commercial land | Important production functions such as providing business services | ||
| Industrial and mining storage land | Industrial land, mining land, storage land | To provide people with industrial production and material storage places | ||
| Transportation land | Railroad land, road land, street land, rural roads, pipeline transport land | Surface lines, yards, etc., that provide important transportation access for people | ||
| Water and water facilities land | Hydraulic construction land | Provides an important watershed production function | ||
| Living Space | Residential land | Urban residential land, rural residential land | Provides an important place for people to live and rest | |
| Special land | Religious land, funeral land | Provides for people’s special needs | ||
| Composite functional space | Eco–production space | Gardens | Orchards, tea plantations, other gardens | Ecosystem supply service functions that provide food, fruits and other biological products, as well as ecosystem support functions such as climate regulation, atmospheric regulation, nutrient cycling and soil and water regulation |
| Water and water facilities land | Ditches, reservoir water, pond water | Has important ecological service functions and is important land for water conservation; also has certain production functions | ||
| Production-living space | Public administration and public service land | Land for institutions and organizations; press and publication; science and education; culture, sports, and recreation; public facilities; scenic facilities; parks; green areas | Provide public services and products such as medical care, education, culture, sports, while having certain production functions | |
| P-L-E Space | First Grade Indexes | Second Grade Index | Interpretation of Indexes and Calculation Methods | Entropy Method Weights | Coefficient of Variation Method Weights | Combined Weights |
|---|---|---|---|---|---|---|
| Production space | Agricultural production function | Food production per capita | Total food production/total population, tons per 10,000 people | 0.0017 | 0.0152 | 0.0084 |
| Arable land per capita | Total arable land area/total rural population, acre/person | 0.0057 | 0.0280 | 0.0168 | ||
| Nonagricultural production function | Per capita output value of secondary and tertiary industries | Output value of secondary and tertiary industries/total rural population, million yuan/person | 0.1742 | 0.1501 | 0.1621 | |
| Per capita output value of agriculture, forestry, animal husbandry and fishery services | Total output value of agriculture, forestry, animal husbandry, and fishery services/rural employed population, million yuan/person | 0.0468 | 0.0785 | 0.0626 | ||
| Structure of rural employment | Rural nonfarm employment/rural employment, percent | 0.0039 | 0.0234 | 0.0136 | ||
| Living Space | Life Security | Average annual income of rural residents | Total annual income of rural residents/total rural population, million yuan | 0.0833 | 0.1066 | 0.0950 |
| Per capita living consumption expenditure of rural residents | Total living consumption expenditure/total rural population, million yuan | 0.2022 | 0.1643 | 0.1833 | ||
| Rural housing area per capita | Total rural housing area/total rural population, m2/person | 0.3275 | 0.2535 | 0.2905 | ||
| Social Security | Number of hospital beds per 10,000 rural residents | Total number of beds in hospitals and health centers/total rural population, number of beds/10,000 people | 0.0101 | 0.0277 | 0.0189 | |
| Percentage of rural residents receiving education | Total number of educated people in rural areas (kindergarten, primary, secondary)/total rural population, % | 0.0990 | 0.0102 | 0.0546 | ||
| Ecological Space | Natural conditions | Forest coverage | Total area of forest land/total area of evaluation unit, % | 0.0186 | 0.0511 | 0.0349 |
| Wetland area ratio | Wetland area/total area of study area, % | 0.0096 | 0.0365 | 0.0231 | ||
| Ecological status | Amount of agricultural fertilizer applied by rural residents per capita | Agricultural fertilizer application/total rural population, tons per 10,000 people | 0.0172 | 0.0498 | 0.0335 | |
| Water resources per rural resident | Total water resources/total rural population, tons per 10,000 people | 0.0002 | 0.0051 | 0.0027 |
| Database | Categories | Evaluation Indicators | Data Description | Year | Data Source |
|---|---|---|---|---|---|
| Resource and environmental carrying capacity evaluation factors | Water resources | Average annual precipitation | 1 km × 1 km raster data | 2015 | a |
| Water supply | Specific reference to spatial distribution data of ecosystem service values [61] | ||||
| Hydrological regulation | |||||
| Distance from river system | 30 m × 30 m raster data | ||||
| Land resources | Soil texture | Calculate the spatial distribution of chalky soil, clay and sand content | 1995 | a | |
| Vegetation resources | Annual normalized vegetation index | NDVI data | 2018 | b | |
| Food resources | Net primary productivity | NPP data | 2015 | ||
| Food production capacity | Specific reference to spatial distribution data of ecosystem service values [61] | 2015 | a | ||
| Raw material production capacity | |||||
| Atmospheric resources | Atmospheric pollution index | PM2.5 spatial interpolation of raster data | 2018 | c | |
| Average annual temperature | 1 km × 1 km raster data | 2010 | a | ||
| Soil erosion | Soil erosion | 1 km × 1 km erosion intensity | 2015 | a | |
| Urbanization | Distance from each town center | 30 m × 30 m raster data | 2015 | a | |
| Distance to mineral resources | 2018 | ||||
| Biological diversity | Biodiversity | Specific reference to spatial distribution data of ecosystem service values [61] | 2015 | a | |
| Appropriateness evaluation factors for urban spatial development | Terrain conditions | Elevations | Calculated from DEM data | 2015 | d |
| Slope | |||||
| Slope direction | |||||
| Transportation advantages | Distance to train station | 30 m × 30 m raster data | 2020 | e | |
| Distance to highway | |||||
| Distance to national highway | |||||
| Distance to provincial road | |||||
| Distance to county road | |||||
| Distance to main road | |||||
| Distance to railroad | |||||
| Distance to waterway | |||||
| Economic development | GDP | 1 km × 1 km per capita GDP | 2015 | a | |
| Population gathering | Population density | 1 km × 1 km population distribution | 2015 | a | |
| Distance to park square | 30 m × 30 m raster data | 2020 | e | ||
| Distance to industrial park | |||||
| Distance to scenic spot | |||||
| Distance to important companies | |||||
| Distance to institution | |||||
| Distance to hospital | |||||
| Distance to financial services | |||||
| Distance to shopping center | |||||
| Ecological development | Environmental purification capacity | Specific reference to spatial distribution data of ecosystem service value [61] | 2015 | a |
| Coupling Coordination Level | Range |
|---|---|
| Low-level coupling coordination | Di ∈ (0, 0.3] |
| Lower-level coupling coordination | Di ∈ (0.3, 0.35] |
| Medium coupling coordination | Di ∈ (0.35, 0.5] |
| Higher-level coupling coordination | Di ∈ (0.5, 0.8] |
| High-level coupling coordination | Di ∈ (0.8, 1] |
| Suitability Level | Land Type | Corresponding Space Types |
|---|---|---|
| Suitable | Wholesale and retail land; accommodation and catering land; business and financial land; other commercial land; industrial land; mining land; storage land; railroad land; highway land; street land; rural roads; pipeline transport land; waterworks land; urban residential land; rural residential land; religious land; funeral land; institutional land; press and publication land; scientific and educational land; cultural, sports and entertainment land; public facilities land; scenic spots and facilities land | Production space, living space, production–living space |
| Generally suitable | Dry land; orchards; tea gardens; other garden land; ditches; reservoir water; pond water; parks and green spaces; facilities; agricultural land | Production space, eco–production space |
| Slightly suitable | Natural pasture; other grasslands; inland mudflats; fields | Ecological space, production space |
| Unsuitable | Paddy land; watered land; wooded land; shrub land; other wooded land; river water; lake water; inland mudflat; vacant land; saline land; marsh land; sandy land; bare land | Ecological space, production space |
| Number of Pixels for the Corresponding Year | 2015–2020 Amount of Pixel Increase | 2020–2025 Amount of Pixel Increase | 2025–2030 Amount of Pixel Increase | ||||
|---|---|---|---|---|---|---|---|
| 20 15 | 20 20 | 20 25 | 20 30 | ||||
| Production space | 319,790 | 310,649 | 304,449 | 300,194 | −9141 | −6200 | −4255 |
| Ecological space | 7451 | 9554 | 11,149 | 12,368 | 2103 | 1595 | 1219 |
| Productive–living space | 1831 | 971 | 956 | 969 | −860 | −15 | 13 |
| Living space | 21,952 | 28,893 | 32,677 | 34,846 | 6941 | 3784 | 2169 |
| Eco–production space | 27,346 | 28,303 | 29,138 | 29,992 | 957 | 835 | 854 |
| Land-Use Types | Living Space | Eco–Production Space | Productive–Living Space | Production Space | Ecological Space |
|---|---|---|---|---|---|
| 1 | 0.74 | 0.64 | 0.52 | 0.45 |
| Baseline Developments | Ecological Priorities | Comprehensive Guidance | |||||||||||||
|---|---|---|---|---|---|---|---|---|---|---|---|---|---|---|---|
| a | b | c | d | e | a | b | c | d | e | a | b | c | d | e | |
| a | 1 | 1 | 1 | 1 | 1 | 1 | 1 | 1 | 1 | 1 | 1 | 0 | 1 | 1 | 1 |
| b | 1 | 1 | 0 | 0 | 0 | 0 | 1 | 0 | 0 | 0 | 1 | 1 | 0 | 0 | 0 |
| c | 1 | 0 | 1 | 1 | 1 | 0 | 1 | 1 | 0 | 1 | 1 | 1 | 1 | 1 | 1 |
| d | 1 | 0 | 0 | 1 | 0 | 0 | 0 | 0 | 1 | 0 | 0 | 0 | 0 | 1 | 0 |
| e | 1 | 0 | 0 | 0 | 1 | 0 | 0 | 0 | 0 | 1 | 0 | 0 | 1 | 0 | 1 |
| Landscape Patch Index | Meaning of the Index | Formula |
|---|---|---|
| Class area (CA) | Area sum of a certain patch type is the basis for calculating other indicators | |
| Largest patch index (LPI) | Proportion of the largest patch in a certain patch type to the whole landscape area; the change in its value can reflect the landscape dominance and the direction and strength of human activity in land use | is the total landscape area |
| Number of patches (NP) | Total number of all patches in a given patch type or landscape area, capable of describing landscape heterogeneity and landscape fragmentation | , |
| Perimeter–area ratio distribution (PARA_MN) | Average value of the perimeter–area ratio of each patch can measure the shape complexity of each type of patch | , |
| Euclidean nearest-neighbor distance distribution (ENN_MN) | Distance to the nearest neighboring plaque of the same type enables the quantification of plaque isolation | , to the closest neighboring patch of the same kind |
| Splitting index (SPLIT) | Degree to which the landscape is separated can reflect the spatial structure of the landscape | , is the total landscape area |
| 2010 | 2015 | 2020 | |
|---|---|---|---|
| Production space | 0.033 | 0.197 | 0.406 |
| Living space | 0.002 | 0.198 | 0.541 |
| Ecological space | 0.025 | 0.012 | 0.029 |
| Year | 2010 | 2015 | 2020 |
|---|---|---|---|
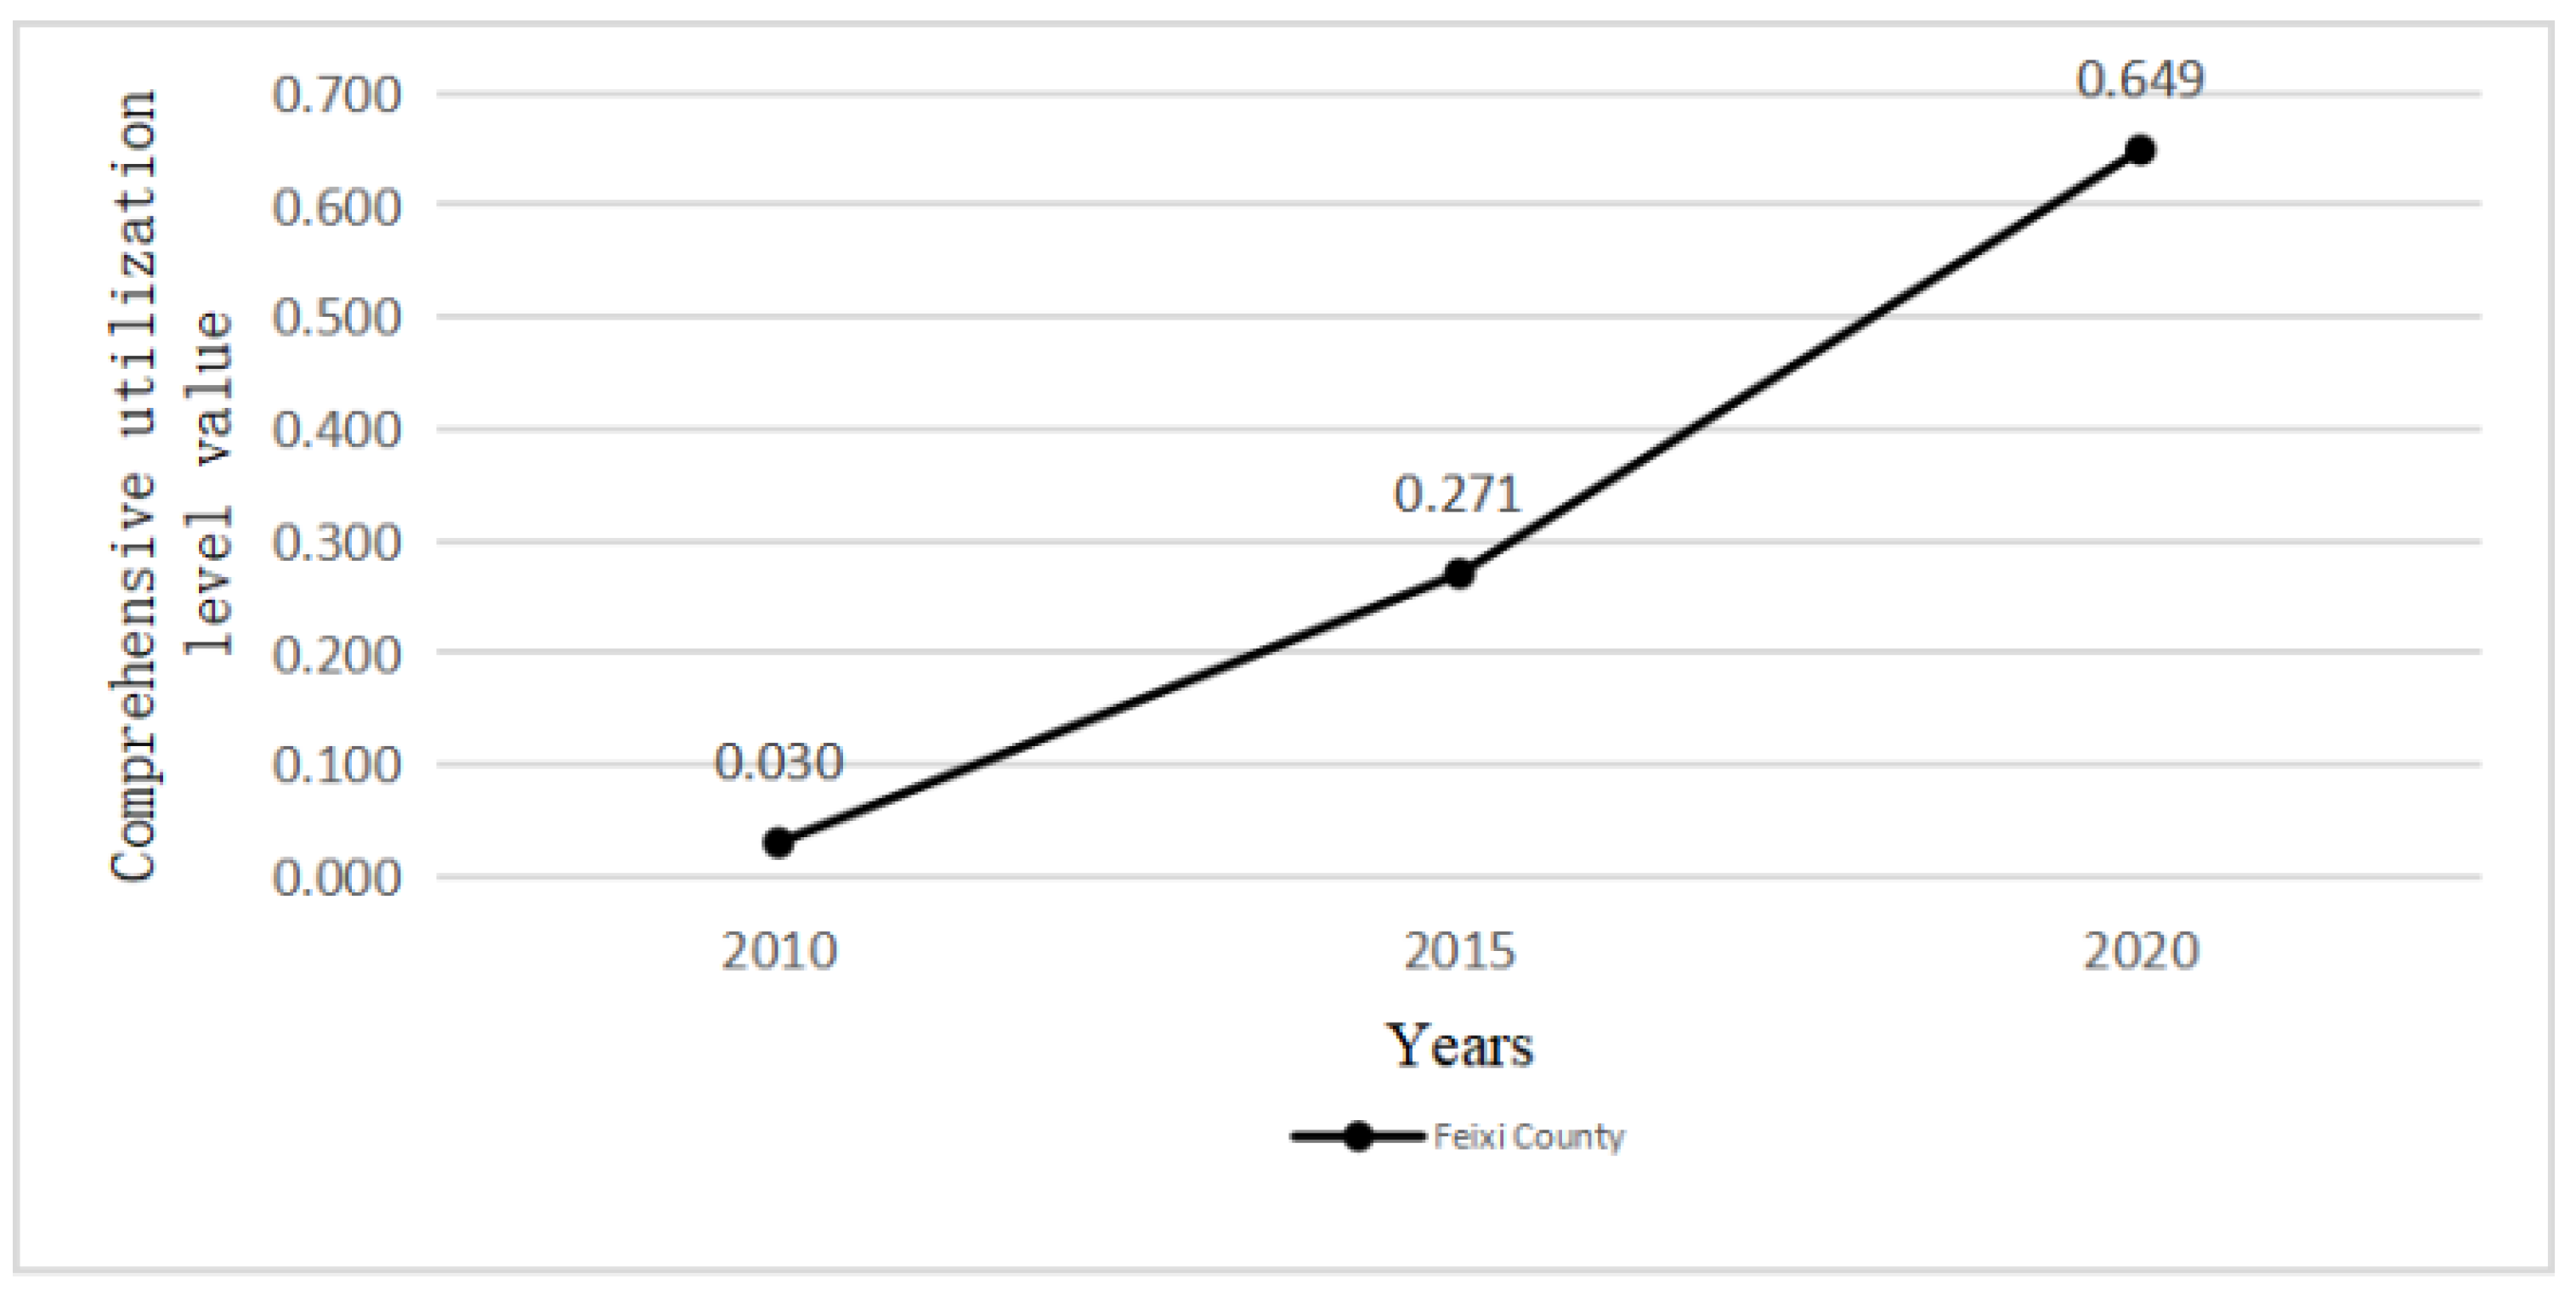
| Feixi County | 0.030 | 0.267 | 0.649 |
| Item | Coupling Degree C-Value | Coordination Index T-Value | Coupling Coordination D-Value | Coordination Level | Degree of Coupling Coordination |
|---|---|---|---|---|---|
| 2020 | 0.652 | 0.212 | 0.372 | 3 | Medium coupling coordination |
| 2015 | 0.242 | 0.247 | 0.245 | 1 | Low-level coupling coordination |
| 2010 | 0.122 | 0.018 | 0.131 | 1 | Low-level coupling coordination |
| Regression Coefficients | Production Space | Ecological Space | Productive–Living Space | Living Space | Eco–Production Space |
|---|---|---|---|---|---|
| Average annual precipitation | −0.001170 | 0.005513 | - | −0.002057 | 0.001344 |
| Water supply | 0.000372 | 0.000393 | - | - | 0.000430 |
| Hydrological regulation | - | 0.005778 | - | −0.000894 | 0.001649 |
| Distance from river system | −1.763042 | - | −2.190576 | −1.415009 | 2.098721 |
| Soil texture | 0.000029 | −0.000115 | - | −0.000037 | 0.000019 |
| Annual normalized vegetation index | 0.569112 | 1.533602 | 0.689810 | −0.430065 | 0.917689 |
| Net primary productivity | −0.008672 | 0.003770 | 0.003542 | 0.001631 | 0.010750 |
| Food production capacity | 1.184822 | −1.102773 | −0.508086 | 0.176642 | −0.206951 |
| Raw material production capacity | 3.704482 | - | - | −5.913095 | 2.933071 |
| Atmospheric pollution index | −3.572851 | −3.798831 | 4.208653 | 2.351258 | 1.837250 |
| Average annual temperature | 0.902957 | −4.204323 | - | 1.612922 | −1.077030 |
| Soil erosion | - | - | - | −0.006732 | 0.008976 |
| Distance from each town center | - | 10.039127 | −10.456873 | 4.959463 | −4.924353 |
| Distance to mineral resources | 1.221799 | −4.180269 | - | - | - |
| Biodiversity | −32.080199 | 51.261999 | −20.012987 | −9.472880 | 28.411155 |
| Elevations | −0.419370 | 1.937141 | 0.355437 | 0.053486 | −0.148695 |
| Slope | - | 0.454744 | 0.143120 | - | −0.258234 |
| Slope direction | - | - | - | - | −0.048880 |
| Distance to train station | 1.469992 | −9.783845 | 2.375191 | 3.174095 | −7.044560 |
| Distance to highway | 0.030546 | −0.315732 | −0.074175 | 0.051262 | 0.059441 |
| Distance to national highway | 3.151996 | 21.074044 | −5.182357 | −3.056930 | −2.528056 |
| Distance to provincial road | −1.214557 | 6.130374 | - | −3.576987 | 3.428839 |
| Distance to county road | 5.762157 | - | −6.812342 | −9.871236 | 7.467694 |
| Distance to main road | 0.015106 | −0.171118 | −0.213137 | −0.256120 | 0.059041 |
| Distance to railroad | −0.070780 | −0.158040 | −0.152683 | −0.090970 | - |
| Distance to waterway | −3.340447 | 14.739082 | - | 2.503530 | 9.431854 |
| GDP | −0.000062 | −0.000114 | - | 0.000028 | −0.000101 |
| Population density | −0.000656 | −0.001129 | 0.000157 | 0.000965 | −0.000308 |
| Distance to park square | - | −21.686782 | 6.168784 | - | - |
| Distance to industrial park | 6.416128 | −18.046922 | −2.132867 | 0.794588 | - |
| Distance to scenic spot | −1.091852 | −6.664396 | - | 3.345872 | −3.753178 |
| Distance to important companies | 15.897312 | 13.451898 | - | −13.167416 | 1.815647 |
| Distance to institution | 5.031040 | −12.684662 | −13.984502 | −2.867755 | 8.391972 |
| Distance to hospital | 6.570663 | −4.241231 | - | 19.957793 | - |
| Distance to financial services | −10.140912 | 27.443215 | 10.804411 | 3.866193 | 4.440700 |
| Distance to shopping center | 7.033288 | −7.178214 | −5.664033 | −5.706204 | - |
| Environmental purification capacity | −4.075612 | 18.388761 | 2.966647 | 9.688627 | - |
| Constant | 0.777194 | −6.399624 | 1.972114 | 2.088712 | −1.243135 |
| ROC | 0.856200 | 0.984890 | 0.750651 | 0.837967 | 0.925830 |
| Baseline | Ecological Priority | Comprehensive Guidance | |
|---|---|---|---|
| Kappa | 0.6828 | 0.7056 | 0.7647 |
| FoM | 0.0524 | 0.0519 | 0.0508 |
| Simulation Scenarios | Production Space | Ecological Space | Production–Living Space | Living Space | Eco–Production Space | |||||
|---|---|---|---|---|---|---|---|---|---|---|
| Number of Pixels/pcs | Percentage/% | Number of Pixels/pcs | Percentage/% | Number of Pixels/pcs | Percentage/% | Number of Pixels/pcs | Percentage/% | Number of Pixels/pcs | Percentage/% | |
| Status scenario in 2015 | 310,649 | 82.10% | 9554 | 2.53% | 971 | 0.26% | 28,893 | 7.64% | 28,303 | 7.48% |
| Baseline scenario in 2030 | 303,101 | 80.11% | 12,370 | 3.27% | 1066 | 0.28% | 34,846 | 9.21% | 26,987 | 7.13% |
| Ecological priority scenario in 2030 | 301,956 | 79.80% | 12,368 | 3.27% | 1853 | 0.49% | 34,847 | 9.21% | 27,346 | 7.23% |
| Comprehensive guidance scenario in 2030 | 308,168 | 81.45% | 7007 | 1.85% | 1070 | 0.28% | 34,847 | 9.21% | 27,278 | 7.21% |
| Simulation Scenarios | CA/ha | LPI/% | NP/pc | PARA_MN | ENN_MN/m | SPLIT | Integrated Value A |
|---|---|---|---|---|---|---|---|
| Baseline | 353508.7500 | 51.8460 | 8144.0000 | 555.1848 | 247.9873 | 2.3783 | 0.9653 |
| Ecological priority | 353508.7500 | 51.8460 | 8592.0000 | 559.1992 | 259.3545 | 2.4146 | 0.9435 |
| Comprehensive guidance | 353508.7500 | 51.8460 | 6731.0000 | 565.6931 | 260.3648 | 2.4136 | 0.9839 |
Publisher’s Note: MDPI stays neutral with regard to jurisdictional claims in published maps and institutional affiliations. |
© 2022 by the authors. Licensee MDPI, Basel, Switzerland. This article is an open access article distributed under the terms and conditions of the Creative Commons Attribution (CC BY) license (https://creativecommons.org/licenses/by/4.0/).
Share and Cite
Zhang, Y.; Li, C.; Zhang, L.; Liu, J.; Li, R. Spatial Simulation of Land-Use Development of Feixi County, China, Based on Optimized Productive–Living–Ecological Functions. Sustainability 2022, 14, 6195. https://doi.org/10.3390/su14106195
Zhang Y, Li C, Zhang L, Liu J, Li R. Spatial Simulation of Land-Use Development of Feixi County, China, Based on Optimized Productive–Living–Ecological Functions. Sustainability. 2022; 14(10):6195. https://doi.org/10.3390/su14106195
Chicago/Turabian StyleZhang, Yichen, Chuntao Li, Lang Zhang, Jinao Liu, and Ruonan Li. 2022. "Spatial Simulation of Land-Use Development of Feixi County, China, Based on Optimized Productive–Living–Ecological Functions" Sustainability 14, no. 10: 6195. https://doi.org/10.3390/su14106195
APA StyleZhang, Y., Li, C., Zhang, L., Liu, J., & Li, R. (2022). Spatial Simulation of Land-Use Development of Feixi County, China, Based on Optimized Productive–Living–Ecological Functions. Sustainability, 14(10), 6195. https://doi.org/10.3390/su14106195