Abstract
We developed an agrivoltaic greenhouse (a ‘test cell’) that partially trapped waste heat from two photovoltaic (PV) panels. These panels served as parts of the roof of the enclosure to extend the growing season. Relative humidity, internal air temperature, incident solar radiation, wind speed, and wind direction were measured for one year. A locally 1-D transient heat and moisture transport model, as well as a shadowing model, was developed and validated with experimental data. The models were used to investigate the effects of altering various parameters of the greenhouse in a scalability study. The design kept test cell air temperatures generally above ambient throughout the year, with the test cell temperature below freezing for 36% less of the year than ambient. Plant growth experiments showed that kale, Brassica oleraceae, a shade-tolerant plant, can be grown within the test cell throughout the winter. The simulations showed that enlarging the greenhouse will increase cell air temperatures but that powering an electric load from the PV panels will reduce cell air temperatures.
Keywords:
renewable; energy; photovoltaic; agrivoltaics; agriculture; greenhouse; modeling; thermal; humidity; shadowing 1. Introduction
Local and national governments and private industry continue efforts to expand the deployment of renewable energy sources. A central pillar of renewable energy generation is utility-scale photovoltaic (PV) solar farms. These farms require large amounts of land with high solar irradiance. Growing global populations also require more food, which necessitates more flat land with high solar irradiance for growing crops. The needs of solar energy production have prompted significant debate and even legislative action on the uses of high-quality agricultural land [1,2,3]. Some local communities and governments have already adopted rules limiting the development of solar farms [1,2], but some farmers prefer renting their land to solar companies instead of growing crops, as the income can be more reliable [3]. Agrivoltaics may allow farmers to avoid the conflict by combining PV arrays and agriculture in a way that preserves the yield of both.
Different ideas for combining PV arrays and agriculture have been proposed, but they generally fall into the three categories shown in Figure 1: interspersed PV arrays, greenhouse-mounted PV arrays, and stilt-mounted PV arrays [4,5,6,7,8,9,10]. For interspersed PV arrays, the PV panels are mounted between rows of plants [2,4]. Greenhouse-mounted PV arrays use the framework of a traditional greenhouse to mount the panels on the roof, although the position and orientation of the solar panels may be sub-optimal to accommodate needs of the greenhouse. The greenhouse may also take advantage of primary (electricity) or secondary (heat) products of the panels. Finally, stilt-mounted PV arrays position the panels at a desired height above an otherwise open field, with plants growing under them. The space beneath allows access to the crops by farming machinery.

Figure 1.
Categories of agrivoltaic arrays: (a) interspersed PV arrays; (b) greenhouse-mounted PV arrays (PVs shown as horizontal, but they can be appropriately inclined); (c) stilt-mounted PV arrays [10] (open access article distributed under the Creative Commons Attribution License).
In [5], Joudi and Farhan replaced a greenhouse roof with a solar air heater panel to partially block light during warmer months and remove heat from the system. It also absorbed light during colder months and redirected heat into the greenhouse. The greenhouse maintained a temperature 16 °C higher than ambient during the winter and 10 °C cooler than ambient during the summer, which showed that the solar air heaters could reduce the cooling load in the summer and support the heating load during the winter.
Marucci et al. [6] placed PV panels in a checkerboard pattern across the roof of a Quonset-type greenhouse. The purpose of their study was to examine the effects of shading by the panels. Another design by Cossu et al. [7] replaced the covering material of a traditional greenhouse with a version of semi-transparent PV panels (STPs). The STPs in this design were interconnected PV cells pressed between two sheets of glass. It was found that the STPs could only partially offset the energy costs of the greenhouse.
There are multiple examples of large commercial greenhouses being converted into agrivoltaic greenhouses by replacing parts of the pitched roofs with PV panels [8,9]. The fraction of roof covered by the PV panels varies, but these designs have the same general limitations. They are quite large, and the shading caused by the PV panels can reduce crop yields inside the structures. Finally, structures that have already been built are difficult or expensive to retrofit.
A stilt-mounted PV array, like the system shown in Figure 1c, was developed by Sekiyama and Nagashima [10]. They compared the effects of a low-density configuration (panel spacing of 1.67-m apart) and a high-density configuration (panel spacing of 71-cm apart) on the growth of corn, a shade-intolerant crop. The panels were mounted at a height of 4 m above the ground, high enough for a tractor to pass under. Sekiyama and Nagashima found improved crop yield for corn grown beneath the low-density configuration and a slightly reduced yield for corn grown beneath the high-density configuration. The configuration of Figure 1c does not extend the growing season due to the lack of a heat-trapping enclosure.
Vanthoor suggested that a comprehensive greenhouse model should consider internal temperature, relative humidity (RH), and CO2 concentration [11]. Nearly all thermal models in [12] were locally 1-D transient models, with the discrete components considered as lumped masses. The models differed in regard to the other factors considered. Combinations of RH, CO2 concentration, and heat flow due to certain heat transfer modes were neglected in many of the models. Jouid et al. [5] neglected the evaporation of water from the soil, assumed there was no water in the greenhouse soil, and assumed there were no plants in the greenhouse. Mohammadi et al. [13] assumed that there were no crops in the greenhouse, i.e., no evapotranspiration in the greenhouse, a negligible effect of CO2 concentration on evapotranspiration, and no evaporation from the soil. They also assumed that any water condensed on the inside of the roof or screens was removed from the system. Cooper and Fuller [14] neglected edge losses, and Sethi [15] neglected radiation heat exchange between the walls and the roof, which we note below is not negligible.
Tiwari et al. [16] considered heat loss from the floor to the ground but handled it as steady-state heat transfer, unlike the rest of the model, which was quasi-steady state. They also considered solar radiation to be partially absorbed by the plants, an effect we neglected by using a model that addresses the overall impact of the solar gain and evapotranspiration. Abdel-Ghani 2011 [17] took an entirely different modeling approach, treating a greenhouse as a solar collector and assuming that elements such as coverings, air, and plant canopies have radiation properties, such as transmittance, absorbance, and reflectance.
There are several differences in our model compared with the above. We chose to neglect CO2 concentration and the effects of the plant canopy inside the greenhouse (the test cell), because CO2 concentrations were beyond the scope of our project, and the fraction of the base shadowed by the canopy would be highly uncertain. For our design, radiation heat exchange among elements inside the cell was found to be larger than free convection. In fact, heat flow rates for radiation were at least double those for free convection. Marucci et al. [6] and Cossu et al. [7] only modeled the solar radiation transmitted from outside the greenhouse to the interior. Most of the effects in our model are included in other models [5,6,7,12,13], but only our model contains all the effects we included. Our model also included transient heat conduction in the ground below the greenhouse, as earth coupling effects are generally important during fall and spring periods.
Unlike [16], we modeled transient transfer from floor to ground and included thermal contact conductance between concrete blocks and the ground, as well as contact conductance between possible multi-layers of concrete blocks and modelling transient heat transfer from floor to ground. No individual greenhouse model we examined considered all the heat transfer modes included in this work, although several considered other factors that we neglected, such as CO2 concentration.
The test cell (Figure 2) has a 20.3-cm (8-in) window of transparent polycarbonate at the top placed between two PV panels, which allows light into the area below and allows plants to grow at the floor level. The PV panels transfer heat by free convection and thermal radiation to the cell inside surfaces when exposed to solar radiation on the outside. The heat is partially trapped in the enclosed space, increasing the cell air temperature. At each instant in time, the value of the cell air temperature results from an energy balance, which includes all cell surfaces and masses, the thermal resistances of the cell walls, and radiation and forced convection on all outer cell surfaces. Due to the traditional “greenhouse” effect (of poor thermal radiation through the polycarbonate from the cell inside surfaces), the energy balance maintains internal temperatures at above the ambient throughout the day, extending the growing season without the use of heaters during periods of cool ambient temperature.
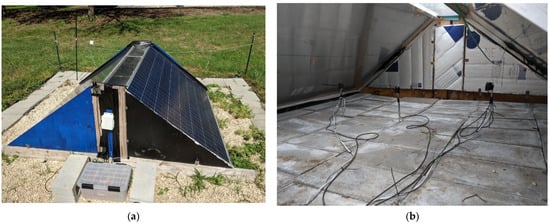
Figure 2.
The test cell: (a) exterior view of the south-facing side; (b) interior view of the north-facing side.
2. Materials and Methods
The test cell used two 0.7 m × 2 m PV panels donated by Solar States LLC [18]. The two panels were positioned facing east and west at 35.5° from the horizontal and were held in position by two wooden frames constructed from 3.81 cm × 8.9 cm (a U.S. “2 × 4”) wooden beams. As shown in Figure 2, the frame has two vertical beams about 78-cm-long, spaced 15.2-cm-apart, and two horizontal beams of about 1.1 m. There is an approximately 20.3-cm gap between the upper edges of the two PV panels covered by a transparent glazing of 1.6-mm-thick transparent polycarbonate.
The north- and south-facing sides of the enclosure are sealed by plywood walls. The north walls are supported by brackets, and the southern walls are held in place by hinges and locks that allow interior access. The test cell is insulated by R-10 foamboard insulation mounted on the inside of the north- and south-facing side walls.
As shown in Figure 2b, the base of the test cell was covered with low-density concrete blocks of density 1920 kg/m3, which added thermal mass to the system to attempt to make cell air temperatures more uniform over short times. Three total solar radiation pyranometers, two temperature, and two RH sensors were installed in the test cell, as shown in Figure 2b. The internal sensors were positioned about 1.3 m from the south-facing sidewall and about 65.3 cm from each other and from the east- and west-facing PV panels. A pyranometer and temperature, RH, wind speed, and wind direction sensors were installed outside of the test cell to collect ambient data. Manufacturers, models, and specifications of sensors used are presented in Appendix A.
The temperature and RH sensors collected data every 5 min, while the pyranometers and wind speed and direction sensors collected data every minute and record five-minute averages. Approximately every 55 days, data were collected, and sensors were reset. The data sets were concatenated to produce a full year data set from 17 January 2020 to 17 January 2021. Gaps in data caused by brief instrumentation failures and brief periods when snow covering rendered the data invalid were filled using linear interpolation.
Three plant growth experiments were carried out in the test cell. In each experiment, two Italian heirloom Toscano Lacinato kale (also known as “dinosaur” kale) seeds (Brassica oleraceae) were planted together six-millimeters-deep in potting soil. Pairs of Toscano kale seeds were about 3.8-cm apart, with six sets of seeds in each planter. Plants within the test cell were watered by a gravity-fed irrigator. Control plants growing adjacent to the test cell and in a conventional greenhouse were watered by hand every few days. Samples of soil were taken for gravimetric water content analysis to assure all plants were receiving sufficient and approximately equal soil moisture.
In the October-2019 experiment, four planters were placed in the test cell, and one planter was placed outside as a control. In the October-2020 growth experiment, four planters were placed in the test cell, four planters were placed outside as a control, and four planters were placed in a nearby conventional greenhouse. Finally, in the March-2021 growth experiment, two planters in the test cell from the October-2020 growth experiment were replaced with new planters, and four new planters were placed outside as controls.
During the October-2020 growth experiment, the total leaf area of sample plants from the test cell and the control was estimated by measuring leaf length and width and assuming an ellipsoid shape for the leaves. The same data were collected for the control plants in the greenhouse; however, those plants were then taken and dried at 62.8 °C (145 °F) in an oven for 24–48 h to estimate dry mass. An allometric function (discussed in Appendix B) correlated total leaf area to plant dry mass. This function was used with the measurements of leaves from the test cell and the adjacent control plants to determine the average dry mass of the plants and thus compare the dry mass of the kale produced in the test cell, greenhouse, and control test.
During the third growth experiment, the same measurements as those in the second growth experiment were taken. These new plants were started in March 2021 in the test cell and in the control area. The allometric function found previously was used to compare the dry mass of kale produced in the test cell and in the control area.
3. Mathematical Modeling
Three models were developed to help understand the relative contributions of the heat and mass transfer processes in the greenhouse and to predict the effects of changes in the test cell design parameters (i.e., scalability) in sensitivity studies. The first was a locally 1-D thermal model with temperature nodes throughout the system, based on an energy balance at each node. The moisture transport model, like the thermal model, had nodes throughout the system and was based on a mass balance at each node. Thermal and moisture transport interact through the latent heat of water, so their equations must be solved simultaneously. The thermal model had a strong effect on the moisture transport model results, but the moisture transport model only weakly affected the thermal model. This interaction is discussed below.
The third model predicted shadowing of the beam and diffuse solar radiation and used the geometry of the test cell and the sun’s transit across the sky to predict which parts of the test cell base were shadowed.
In the thermal model (Figure 3), several processes act at each node. Some nodes experienced incident solar radiation, such as the nodes on the outside of the solar panels. This was found from measured values of surface area and solar radiation flux. Values for the angle of incidence and transmissivity (for the transparent polycarbonate, its absorptivity) were calculated from the instantaneous solar positions and published data. The solar panel nodes also experience radiation heat exchange with the sky, which was found using calculated values of node temperature, sky temperature, and the radiation view factor. Solar radiation transmitted through the transparent polycarbonate was calculated based on the transmissivity of the material and was assumed to be distributed uniformly over the internal surfaces. Forced convection due to external wind occurred at all external surface nodes and was calculated using the measured wind speed and air temperature and the calculated surface temperatures. Free convection occurred at all internal surface nodes. Radiation heat transfer also occurred at all internal nodes and was calculated using the net radiation method (Appendix C).
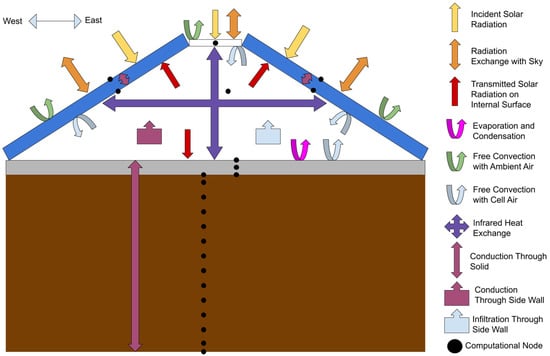
Figure 3.
Thermal nodes and their interactions in the computational model.
Air in the test cell is coupled with the ambient air by conduction through the north- and south-facing side walls, as well as through infiltration through gaps in the side walls. Heat flow due to conduction through the side walls was determined using measured ambient and cell air temperatures and a calculated wall thermal conductance. All properties, such as thermal conductivity, were taken from published values. Heat flow due to infiltration was found using the measured ambient air temperature and calculated cell air temperature. The infiltration air flow rate was determined using measured values of wind speed and direction to calculate the stagnation pressure on the outside of the south-facing wall. In addition, infiltration due to the stack effect was calculated from cell air temperature and measured ambient temperature. Conduction in the concrete and soil was modeled by numerically solving the 1D, transient heat conduction equation. The resulting linear algebraic equations were solved implicitly using a matrix method. At the concrete soil interface, the heat flow due to thermal contact conductance was found from calculated temperatures and a thermal contact resistance, the value of which was determined during model validation (by comparison with measured data).
Key assumptions in the models are as follows:
- Heat and mass transfer are lumped in a node, and heat flow is locally 1-D;
- Solar radiation entering the test cell is treated as diffuse over all internal surfaces, except on the polycarbonate sheet;
- No thermal nodes are located in the north- and south-facing side walls (these function only as thermal resistances, coupling the cell temperature with the outside air. The mass of the walls is small due to the small size and the low thermal mass of the wall insulation);
- The thermal diffusivity and thermal conductivity of the soil are assumed to be constant based on the partial water infiltration theory [19];
- The irrigation rate and the rate of water diffusion from the soil are known and constant (Appendix D);
- The infiltration of ambient air and the accompanying moisture and heat transfer occurs by wind-driven infiltration through cracks in the walls and by the stack effect. The cracks are lumped into a single gap area determined during model validation;
- Only beam radiation is considered in the shadowing model; diffuse radiation, generally smaller than beam, is not considered.
Governing equations for the thermal model are given below. The heat flow rate equations for Equations (1)–(10) are discussed in Appendix C, along with mass flow rates from Equations (11)–(18).
dTlex/dt = (qsol,lex + qwind,lex + qsky,lex + qa,lex − qrad,lex)/ρlexVlexCplex
dTsp,out/dt = (qsol,sp + qwind,sp + qsky,sp + qcond,sp,inner)/ρspVspCPsp
dTsp,in/dt = (qa,sp-qrad,sp + qcond,sp,outer + qligh,sp)/ρspVspCPsp
dTcell/dt = (qsp,west,a + qsp,east,a + qlex,a+qcon,a + qsidp,a-qinfi)/ρaVaCPa
dTcon,up/dt = (αcon/Δx2con)(2Tcon,up+1 − 2Tcon,up + (2Δxcon/kcon)[qflux,ligh,con + qflux,a,con + qflux,evap + qflux,rad,con])
dTi,con/dt = (αcon/Δxcon2)(Ti,con+1 − 2Ti,con + Ti,con-1)
dTcon,low/dt = (qcond,con + qtcc,con)/ρconAcon[Δxcon/2]CPcon
dTsoil,up/dt = (qcond,soil + qtcc,soil)/ρsoilAsoil[Δxsoil/2]CPsoil
dTi,soil/dt = (αsoil/Δxsoil2)(Ti,soil+1 − 2Ti,soil + Ti,soil-1)
dTsoil,low/dt = (αsoil/Δx2soil)(2Tsoil,low-1 − 2Tsoil,low)
In Equations (7) and (8), we assumed there is no heat storage in the interface. Equation (10) is a variant of Equation (9) and predicts temperature changes in the lower soil surface layer, which is insulated.
It is assumed that liquid water can condense and collects on the concrete base and that this liquid water can subsequently evaporate. Three water mass nodes are considered, one each for the air, the accumulated liquid water, and the planter (Figure 4). In the moisture transport model, a mass balance is written for each node, just as is done for heat in an energy balance.
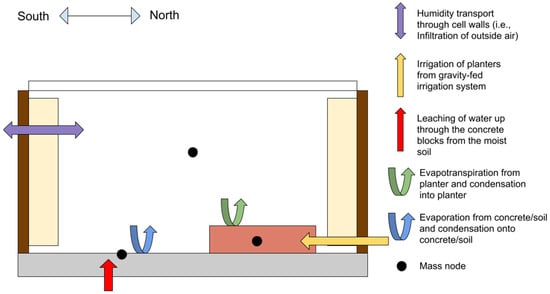
Figure 4.
Mass transfer nodes and interactions in the computational model. The white bar is the transparent polycarbonate, the brown bars are wood side walls, the tan bars are foam board insulation, the red rectangle represents planters, and the grey rectangle is the concrete block.
Condensation begins when the humidity ratio of air reaches the saturation humidity ratio. When the humidity ratio is less than the saturation humidity ratio, evaporation occurs.
The equations used in the moisture transport model are as follows:
dMa/dt = Mdotinfi,h2o + ETplant + Eliq
dMa/dt = Mdotinfi,h2o − Mcd
dMliq/dt = −Eliq + Mdotsoil
dMliq/dt = Mcd(Acon − Aplant)/Acon + Mdotsoil
dMplant/dt = Mdotirrig − ETplant
dMplant/dt = Mdotirrig + Mdotcd(Aplant/Acon)
Equations (11)–(15) are used when evaporation occurs, and Equations (12)–(16) are for condensation. ETPlant is evapotranspiration from the plants. It is an adapted form of the Hargraves equation [20] and is discussed in Appendix C.
A separate set of equationsgoverns the overflow of water from the planters when the water in that node exceeds the maximum capacity of the soil. If Mplant is greater than Mplant,max, Equations (17) and (18) are used. Note that Equation (18) modifies the mass change value predicted by Equations (13) or (14).
dMover/dt = (Mplant − Mplant,max)
dMliq/dt = dMliq/dt + dMover/dt
The thermal and moisture transport models are solved using the algorithm below in Matlab (Mathworks, Natick, MA, USA) with the integration package ODE15s. See Figure 5 and Figure 6.
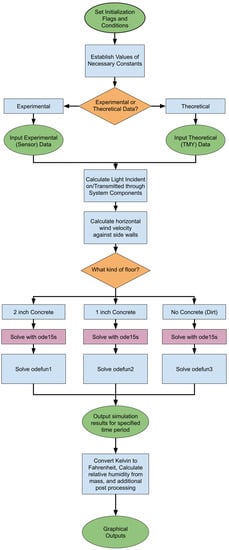
Figure 5.
Flow chart for thermal and moisture transport models.
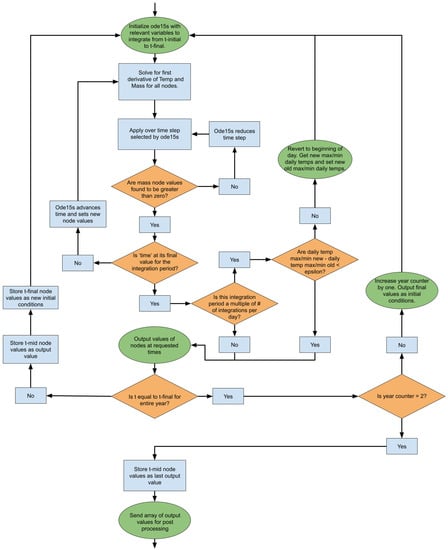
Figure 6.
Solution flow chart. Maximum and minimum daily temperatures are model-predicted maximum and minimum daily temperatures for test cell air. All terms ‘mass’ refer to water mass.
The equations for the shadowing model are presented below [21]. The hour angle (ω = 0 is assumed to occur at midnight) and cell-based surface azimuthal angle are defined by
ω = −180° + 1.25°p
sin(αs) = cos(φ) cos(δ) cos(ω) + sin(φ) sin(δ)
The shadow projection point SP is the distance in the north–south direction, measured from the base of the south-facing side wall (see Figure 7). It determines the length of the shadow projected by the sidewall. The value of cos(ω) was found from [22]. A point must be at a distance greater than SP from the south-facing side wall to be sunlit.
SP = cos(ω) H/tan(αs)
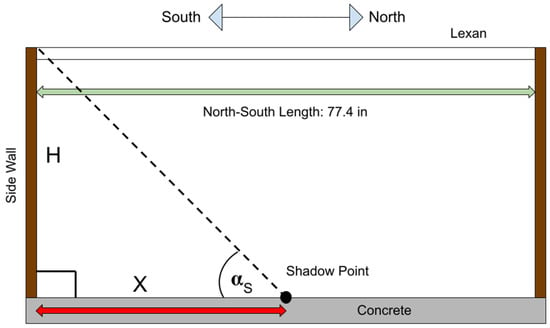
Figure 7.
Values used in the calculation of the shadow projection point from Equation (21).
A point on the base must also be between two different hour angles, defined as ωwest and ωeast, to be sunlit. These angles determine when the west-facing and east-facing solar panels no longer block sunlight from reaching the point under consideration. The angles are found by trigonometric relations based on the horizontal distance, y, and vertical distance, h, to each panel edge from the point under consideration.
ωeast = atan(h1/y1) − 90°
ωwest = atan(h2/y2) + 90°
The sunrise and sunset angles are
ωset = acos(−tan(φ)tan(δ))
ωrise = −ωset
Once the values calculated in Equations (19)–(25) are known, the algorithm to determine if a point at the base of the test cell is shaded is as follows. First, a check is made to determine if the current hour angle in the simulation is before sunrise or after sunset (if so, no points are illuminated).
For daytime, a check is performed to determine whether a point on the base is within the projected shadow of the side panel. If so, then the point is not illuminated.
Finally, if the point is not within the projected shadow, a check is made to see if the current hour angle is between the east and west blocking angles for that point. If it is, then the point is irradiated (if not, then it is shaded). Note that the shadowing model only considers beam radiation. The model is illustrated in Figure 7 and Figure 8. Values of constants used in the above models are presented in Appendix D.
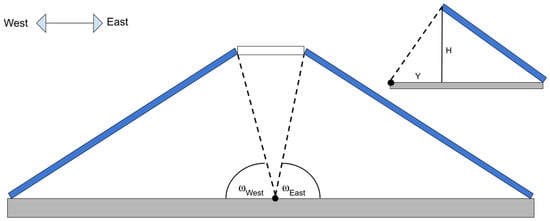
Figure 8.
Calculation used in Equations (22) and (23) to find the east and west blocking angles.
4. Results
The models were validated by comparing the calculated minimum and maximum test cell air temperatures with measurements and, by trial-and-error, adjusting key parameters that were identified as most uncertain. These included the area of the air infiltration gap, irrigation flow rate, ground-source moisture infiltration rate, Hargreaves Equation scaling factor, the thermal contact resistances (between the soil, first concrete layer, and second concrete layer), the coefficients of free convection (between the cell air and the concrete, as well as the cell air and every other internal surface), the SOF factors for both solar panels, and the transmittance-absorptance for the solar panels. Once validated, measured data were used as inputs to the models in a parametric study to predict performance of the test cell subject to a variety of changes in dimensions, configurations, and other operational parameters.
4.1. Validation
4.1.1. Thermal Model
Figure 9 and Figure 10 show that the predicted cell temperatures were in good agreement with experimental data. Predicted and measured daily maximum temperatures differed by an average of 1.9 °C (3.5 °F), and predicted and measured daily minimum temperatures differed by an average of 1.5 °C (2.7 °F).
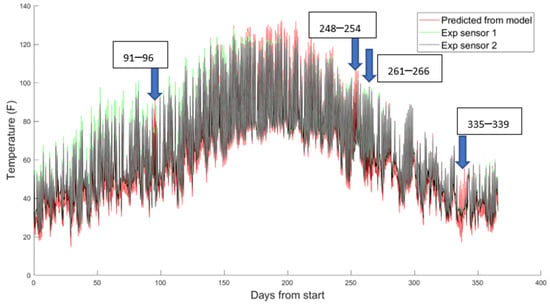
Figure 9.
Yearlong simulation results and experimental temperature data. “Exp sensor 1” refers to the temperature sensor located on the east side of the test cell base, and “Exp sensor 2” refers to the sensor on the west side. Periods of sensor interruption or snow cover, where data were linearly interpolated, are highlighted.
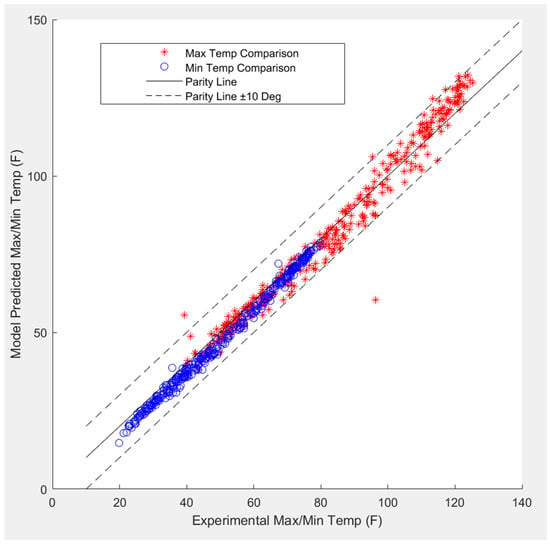
Figure 10.
Model-predicted daily maximum temperatures (red asterisks) and minimum temperatures (circles) vs. experimental maximum and minimum temperatures for the same day.
4.1.2. Moisture Transport Model
When comparing the moisture transport model with measurements, the predicted relative humidity (RH), seen in Figure 11 and Figure 12, showed a larger disagreement than that in Figure 9 and Figure 10. The predicted RH was noticeably greater during the winter than the observed RH, and opposite was the case during the summer. Cell air temperatures have a more pronounced effect on the RH values during the winter. From psychrometrics in classical thermodynamics, RH is inversely proportional to the saturation vapor pressure (pg(T)) at the air temperature of the test cell.
RH = λpa/0.662 pg(T)
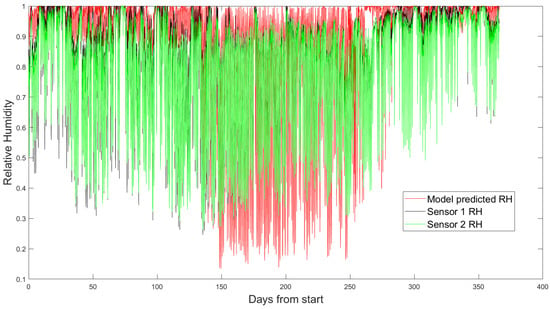
Figure 11.
Predicted RH and from measurement. Note: over-prediction occurred mostly during the winter and the under-prediction during the summer. Start date of 17 January 2020.
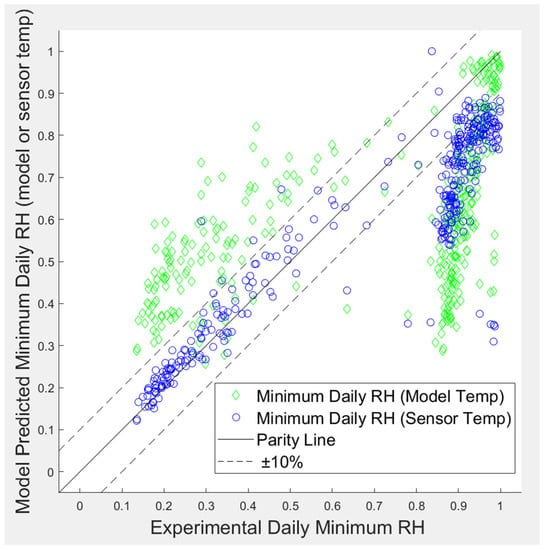
Figure 12.
Model-predicted daily minimum RH based on the model-predicted cell temperature (diamonds) and the model-predicted minimum RH based on measured temperature (circles) plotted against measured minimum RH for the same day.
Consider the case of air temperature at −10 °C (14 °F), where pg is nearly an order of magnitude smaller than that at 35 °C (95 °F) [23]. For a given change in the product of the humidity ratio, λ, and the air vapor pressure, pa, this translates into an order of magnitude greater change in RH at −10 °C (14 °F) compared to that at 35 °C (95 °F). Thus, the sensitivity of RH to λpa is much greater in the winter than in the summer.
Figure 13 compares model-predicted RH values calculated using both the model predicted and measured temperatures. The RH calculated using measured temperatures was significantly closer to the measured RH. The high sensitivity of RH to temperature, as seen in Figure 13, is due, at least in part, to the high RH at low temperatures, as noted above.
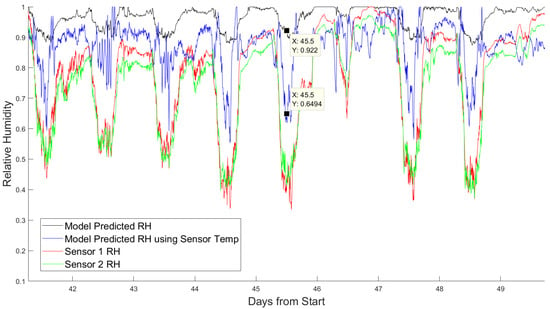
Figure 13.
Example that shows improvement in RH using measured cell air temperature instead of the model predicted. Note: the change in temperature for the two identified points was 6.1 °C (11 °F) from that predicted by the model. 27 February 2020 to 7 March 2020 test period.
Another possible reason for the differences in Figure 13 is the use of a constant irrigation rate in Equations (15) and (16), while the actual irrigation rate probably fluctuated due to interruptions caused by winter freezing (We selected a constant value for the irrigation rate by first finding a piecewise irrigation rate function that produced good agreement like that shown in Figure 11, and then finding the average value of this function over the course of a year.). We also assumed constant rate of water infiltration to the test cell from the moist soil below concrete blocks, although this value was uncertain and likely varied with time.
4.1.3. Shadowing Model
The shadowing model was validated by comparing the solar radiation data collected on a near completely clear day with that predicted by the shadowing model at the locations of the sensors. Figure 14 shows excellent agreement between the model and the experimental data. Late in the day, the model over-predicted the incident radiation, possibly due to light cloud cover or atmospheric haze near the horizon.
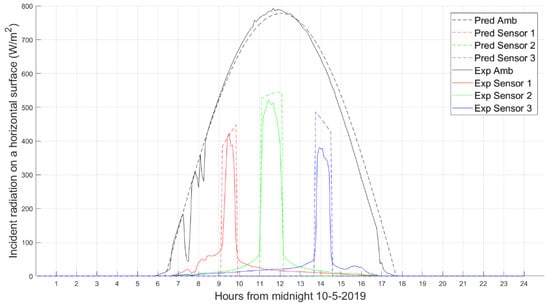
Figure 14.
Predicted (pred) solar radiation on 5 October 2019 and experimental (exp) data for the same day. Sensors 1, 2, 3, and 4 are located west in the test cell, center in the test cell, east in the test cell, and ambient, respectively.
4.2. Experimental Data
4.2.1. Test-Cell Temperature and Ambient Temperature
Figure 15 shows that daytime temperatures inside the test cell were greater than the ambient temperature for most of the year. Furthermore, as shown in Figure 16, even near day 350 and approaching the winter solstice, the minimum temperatures observed at night were typically higher than ambient. This occurred throughout nearly a year of observations.
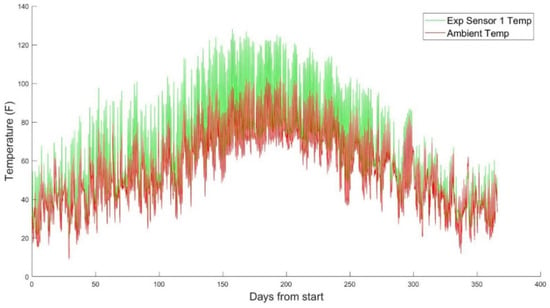
Figure 15.
Test-cell temperature data compared with ambient.
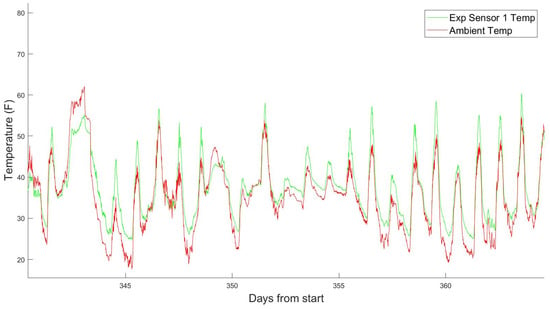
Figure 16.
Expanded view of test-cell air temperature measurements compared with ambient. In general, wintertime test-cell air temperatures were greater than ambient.
4.2.2. Plant Growth
The October-2019 plant growth experiment is shown in photographs taken weekly over the course of the experiment.
Figure 17 shows the progression of plant growth for kale in the test cell. The kale was planted in early October 2019 and grew slowly over the course of the next few months. In February 2020, plant growth accelerated, presumably due to improving conditions, and continued in March 2020.
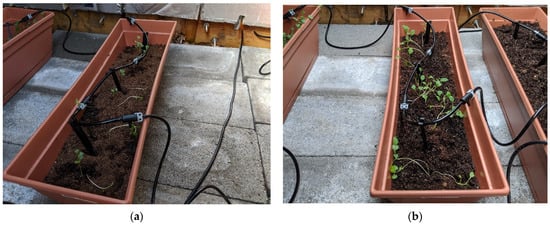
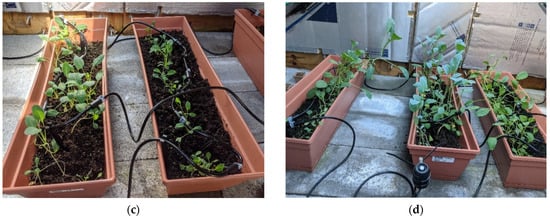
Figure 17.
Progression of the October-2019 plant-growth experiment: (a) 15 October 2019; (b) 20 November 2019; (c) 19 February 2020; (d) 26 March 2020.
Allometric measurements were used to find the average dry mass of the plants in the test cell and control cell throughout the October-2020 growth experiment. The allometric function is discussed in Appendix B.
Figure 18 shows the same progression as Figure 17. Plant growth was slow over the course of the winter, and during this time, the control cell plant’s average dry mass was greater. At the end of the winter, the plants in the test cell caught up with those of the control cell plants and resumed growth. The control cell plants, which were outside the test cell and unprotected, died on 21 January 2021 (six weeks after data collection started) due to exposure to snow and prolonged freezing temperatures.
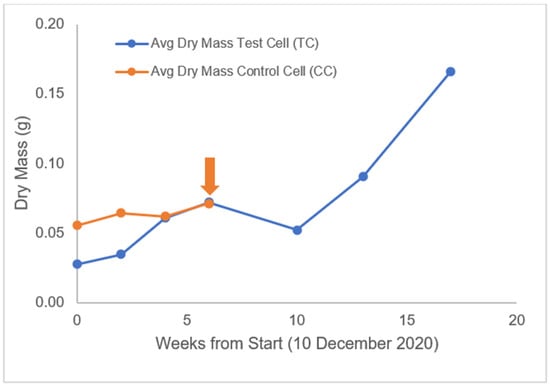
Figure 18.
Average aboveground plant dry mass in the test cell and control cell for each sampling since the start of the October-2020 growth test. The arrow indicates the point at which control cell plants died.
4.3. Numerical Results
4.3.1. Parametric Study
A parametric study using the above models was undertaken to evaluate test cell scalability, where we interpreted scalability as the performance of the cell under conditions different than those of the base case. The base-case parameter values are defined in Appendix D, and variations of the parameter values from those of the base case appear in Table 1. The base-case parity plot appears in Figure 10.

Table 1.
Cases for the parametric study in which the calculations converged (only case 16 did not). Note: Case 14 had the same number of planters as in the base case. For this case the planter height was doubled.
The results of the parametric study are presented in Figure 19. The maximum and minimum temperatures predicted by the model for each day of the year and those predicted by the base case are compared in each parity plot.
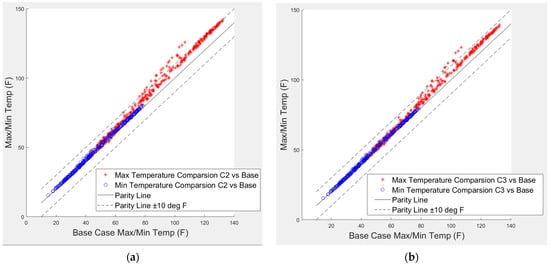
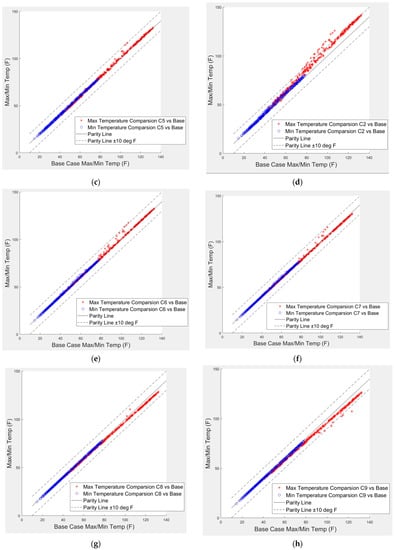
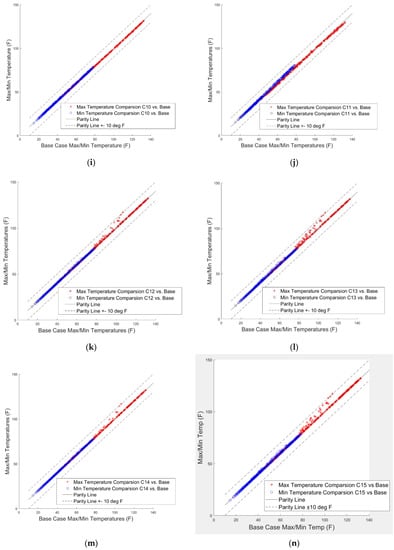
Figure 19.
Parity plots of maximum and minimum temperature test-cell air values from the model cases versus the base-case results.
Based on the results in Figure 19, the following conclusions could be reached regarding the test-cell scalability.
- Minimum temperatures in all parametric runs, Figure 19a–n, are only weakly affected by the structural, electrical load (the “load”), and thermal mass changes. Cases 2 (cell twice the length; Figure 19a) and 11 (no blocks; Figure 19j) showed a slightly elevated minimum air temperature, as the cell air received greater heat input from twice the number of PV panels in the absence of the load-leveling feature of energy storage in the concrete block. This suggests that the system was saturated with thermal mass, so additional mass may not have improved heat retention. This conclusion is supported by Figure 19i, in which additional thermal mass was added to the system, with only a slight reduction in daytime maximum temperatures.
- Figure 19a, for which the north–south length of the test cell was doubled (thereby doubling the number of PV panels), shows that the change led to increased heating during the day. This increase in temperature was larger during the summer than during the winter. As expected, the greatest increases in cell temperature were during the highest temperature days.
- Figure 19b shows an increase in daily maximum temperatures due to the widening of the gap area (i.e., increasing the insolation) between the two panels from 20.3 to 40.6 cm. Temperatures much above ambient have an adverse effect on plant growth, so this increase is undesirable. However, the increase in solar gain from the widened glazing is an improvement. The relative benefit of the increased glazing area is addressed in Section 4.3.2 and Section 4.3.4.
- Figure 19c–h shows that powering a load from the PV panels reduces the internal maximum temperatures during the day, especially during the summer, but as noted in comment 1 above, it does not significantly affect the minimum temperatures at night. This is discussed further in Section 4.3.3.
- Figure 19j shows that the removal of the concrete blocks reduces the maximum temperatures slightly during the hottest days of the year and slightly increases the minimum temperatures. The thermal contact conductance between the soil and the concrete blocks, which is removed in this case, reduces heat flow into the soil during the day and reduces heat flow out into the system at night This reduction in daily maximum temperatures (if only slight) can help keep the average cell temperature near the ideal of 20 °C (68 °F). (As thermal diffusivity is the ratio of the thermal conductivity to the product of density and specific heat, the smaller thermal diffusivity material is better at heat storage. The thermal diffusivities of concrete and soil are αcon = 0.45 · 10−6 m2/s and αsoil = 0.99 · 10−6 m2/s, indicating superior heat storage for concrete blocks on a per-mass basis. However, soil was the largest portion of the thermal mass in the system. Note that contact resistance is created by placing the blocks over the soil, which reduces the heat flow to and from the dominant thermal mass.)
- Figure 19k,l, shows some increase in temperatures during the spring and fall compared with the base case. This can be explained as follows:
- Figure 19k,l has more planters spread over the base of the test cell than the base case. Due to the increase in planters, less of the test cell base is exposed for evaporation, reducing evaporative cooling during these periods. Reduced evaporative cooling leads to the higher temperatures during the spring and fall as observed.
4.3.2. Instantaneous Photosynthetic Rate (Pn)
Our plant growth experiments confirmed that kale can be grown in the test cell. Using the shadowing model and the equation to calculate Pn [24], more information about where kale can grow at the base of the test cell could be determined. Pn > 0 means that a leaf is fixing more CO2 then needed for cellular respiration. Pn = 0 means that a leaf is fixing the necessary amount of CO2, and Pn < 0 means that a leaf is not fixing enough CO2. The instantaneous value of Pn can be found using the Mitscherlich equation [24].
where Pn is the instantaneous photosynthetic rate; Pmax is a constant (the maximum photosynthetic rate of 20.3–21.0 µmols CO2 fixed/m2 s [24]); I0 is the PAR irradiance at the compensation point where the Pn is equal to zero (which, for kale, is 13 µmols photons/m2 s = 2.85 W/m2); I is the instantaneous PAR irradiance; and k is Mitscherlich function, reported as 0.0030 [24]. Our shadowing model produces values of instantaneous solar irradiance. These values can be converted into instantaneous PAR (PAR stands for Phototsynthetically Active Radiation, which is solar radiation between 400 and 700 nm) irradiance using a conversion factor of 2.43 µmols photons/J, found using the methods described in [24,25,26] (The conversion factor for PAR in W/m2 to µmol photons/m2 s is about 4.57 µmols photons/J. However, the pyranometers used in this study measure solar radiation intensity between 300 and 1100 nm (visible light spectrum). PAR makes up only a fraction of that energy; as such, the factor of 4.57 must be reduced to 2.43 µmols photons/J when applied to readings from the pyranometers in this work.). If Pn is integrated over a 24-h period, a value for net photosynthetic gain per day can be found. If the net photosynthetic gain is positive valued, then a leaf could grow that day. If the net photosynthetic gain is zero, the plant would maintain its current biomass. Finally, if the net photosynthetic gain is negative, the leaf is likely to lose biomass.
Pn(I) = (1 − e−k(I−I0)) Pmax
The net photosynthetic gain per day is shown for the irradiance predicted by our shadowing model (Figure 20) and the measured irradiance (Figure 21).
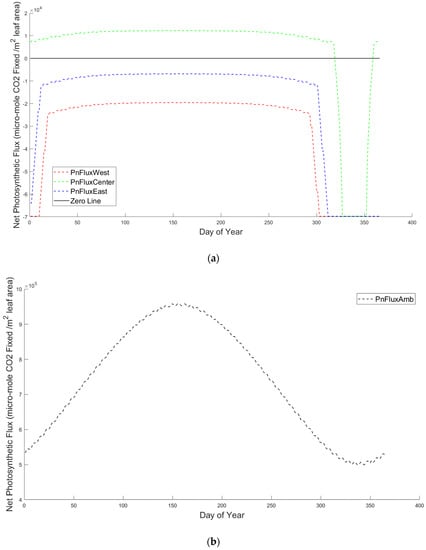
Figure 20.
Net photosynthetic flux of CO2 per day per unit area as found by using solar irradiance from the shadowing model. (a) Shows the net photosynthetic flux within the test cell at the points, and (b) shows the ambient. The zero line delineates a value of no net gain or loss.
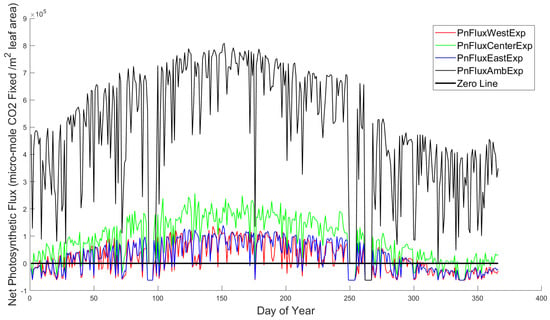
Figure 21.
Net photosynthetic gain of CO2 per day per unit area as found using solar irradiance from measured solar radiation. This was found using an assumed clearness index of 1 for the whole year. The zero line delineates a value of no net gain or loss.
Figure 20 shows that the only viable location for plant growth in the test cell is the area near the centerline between the east and west side of the test cell (dashed green line). If plants are placed close to the east (dashed blue line) or the west side (dashed red line), they would not be able to grow, because the net photosynthetic gain there is always negative. Clearly, the net photosynthetic gain inside the test cell was found to be substantially lower than outside, as expected.
The results based on solar radiation measurements (Figure 21) show that throughout most of the year, leaves would be able to grow in the center of the test cell (solid green line), as well as the east (solid blue line) and western sides (solid red line) of the test cell. The net photosynthetic gain values were higher than those observed in Figure 20 for the interior and exterior points. The solar radiation measurements included diffuse radiation, while the model-predicted solar radiation included only beam radiation.
4.3.3. Ideal Temperature Zones
Kale grows optimally at a temperature in small band centered around 20 °C (68 °F) [25]. Temperatures above freezing are desirable for nearly all plants. An analysis was conducted to determine how much of the year our test cell spent within three temperature bands surrounding the ideal temperature, based on parametric simulations and the ambient conditions (Table 2). Another analysis was conducted to determine how much time the test cell, the ambient conditions, and our parametric simulations spent below the freezing point (Table 2).

Table 2.
Percentage of the year each parametric run, the data from the test cell, and the ambient conditions spent within bands of ±1.1, ±2.2, and ±3.3 °C in relation to 20 °C (68 °F).
A brief examination of Table 2 shows a few trends discussed here.
- Plants in ambient conditions are expected to spend more time near the ideal temperature. Compared with the test cell data, Figure 15 reveals that the smaller time near the ideal temperature was mostly due to overheating during summer months. Simple modifications, such as ventilation fans, could reduce this overheating effect substantially and allow for better control of relative humidity. Addressing high temperatures during the summer should result in the test cell performing better than the ambient.
- The test cell spent fewer hours below freezing 0 °C (32 °F) than the ambient (36% fewer hours).
- Doubling the north–south length, as in case 2, reduced the number of hours spent near 20 °C (68 °F).
- Doubling the glazing area, as in case 3, reduced the number of hours spent near 20 °C (68 °F).
- Powering a load from the solar panels, as in cases 4–6 and 7–9, showed a progressive increase in the number of hours spent near 20 °C (68 °F) with increasing load.
- Table 2 shows that changes which increased cell temperature reduced the time spent near 20 °C (68 °F) and that changes that decreased cell temperature increased the time spent near 20 °C (68 °F) throughout the year. This suggests that the test cell overheated during the summer. This is an undesirable characteristic of the design. Keeping the test-cell air near the ideal temperature range would promote better plant growth.
The reason that the predicted temperatures were below freezing for more of the year than the measured temperatures is likely because the model underpredicted nighttime temperatures by an average of 1.5 °C (2.7 °F). As a result, the predicted temperatures may have fallen just below freezing at times when the experimental values were higher than 0 °C (32 °F). For example, if the measured temperature was 1.1 °C (34 °F), the model may have predicted −0.4 °C (31.3 °F).
4.3.4. Shadow Model: Transmitted Solar Radiation Compared with a Stilt-Mounted PV Array
Using the shadowing model developed in this work, the solar radiation transmitted to the cell base could be determined and compared with that in other agrivoltaic designs. A stilt-mounted PV array was selected (refer to Figure 1c), and the shadowing model was used to determine the fraction of solar beam radiation transmitted to the base beneath each array as compared to an area equal to the floor of the test cell.
Two types of stilt-mounted PV arrays with geometries from [10] were considered. The low-density stilt-mounted PV array in [10] is composed of 4 PV panels placed 1.67-m apart. The high-density array had 8 PV panels, positioned 0.71-m apart. The calculation was for the summer solstice. The low-density panel configuration of the stilt-mounted PV array allowed 82% of radiation to reach the base beneath the panels, compared to an unshaded area. The high-density configuration allowed 65% to reach the base beneath the panels. By comparison, the test cell allowed 5.2% to reach the base beneath the solar panels (Figure 22).
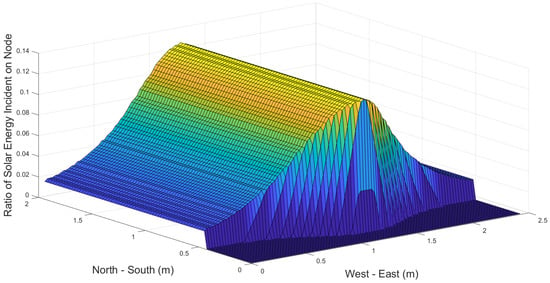
Figure 22.
Distribution of solar radiation at the base of the test cell over a day (the summer solstice). The vertical axis is the ratio of the actual beam radiation incident on each discrete node surface to an unshaded node surface.
5. Discussion
The present work focused primarily on evaluating the viability of our test cell, developing a computer model of the system, and on identifying potential improvements and scalability through a parametric study. The project has produced promising results and highlighted several areas where the design or models could be improved.
Based on the results presented in Section 3, we were able to grow kale in the test cell. However, only plants located directly under the glazing grew well. Those located more east and west in the test cell did not grow as well. However, our test cell also kept kale alive throughout the winter and allowed it to resume growth with the arrival of spring. Temperatures within the test cell were greater than those outside (ambient) for almost the entire year, which confirms our hypothesis that the heat produced by the PV panels could be used to augment the normal greenhouse effect and extend the growing season of crops. Based on the net photosynthetic gain (Appendix B) analysis of the interior of the test cell, it is clear that kale leaves can grow within the test cell, despite the lower light compared to other agrivoltaic designs. The test cell may be suitable for other shade-tolerant plants, such as arugula, lettuce, carrots, or potatoes. Trials with multiple plant species should be carried out. Furthermore, if the glazing were removed and the panels completely sealed against solar radiation, then crops such as mushrooms may grow quite well.
The proposed design would be difficult to use with traditional farming techniques. Possible modifications include increasing the height of the test cell to allow more comfortable access to the interior and the integration of automated crop-tending systems.
One option for greater sunlight transmission is to widen the glazing. However, as demonstrated in Section 4.3.3, this would increase cell air temperatures. Based on results from Section 4.3.3, drawing electric power from the PV panels decreases internal temperatures. If the glazing area was widened, then more light would be transmitted to the interior of the test cell, and if the PV panels had at least an efficiency of 14%, then no significant increase in test-cell air temperature would occur. An efficiency of 21% would lead to a reduction in daytime temperatures throughout the summer. The drop in test-cell temperatures during the day would keep the test-cell air closer to the ideal temperature of 20 °C (68 °F).
Several improvements to the computer models have been identified. Including temperature-difference-dependent free convection heat transfer coefficients would improve the fidelity of the heat transport model (constant values are currently in place based on assumed average thermal conditions). Improving the heat transport model would also improve the moisture transport model by increasing the accuracy of the RH calculation (see Section 4.1.2 and Equation (26)). The addition of a flow meter to the irrigation system would produce data that could further improve the moisture transport model. Adding diffuse radiation [27] would improve the accuracy of the shadowing model, especially in overcast climates. The effect of thermal earth coupling should be improved by modeling the ground as a two-dimensional (depth direction and radial outward direction normal to this), transient thermal conductor.
6. Movement to a Comprehensive Agrivoltaic-Based Plant Growth Model and System Optimization
One of the next steps in this work is to produce a model that incorporates the thermal and humidity transport models above with a model for plant growth rate. The most comprehensive of the latter is STICS [28,29,30,31]. Once completed, the agrivolatic greenhouse can be optimized by maximizing the monetary value of the two outputs, namely the value of the electricity produced as predicted by the solar input and PV efficiency from above and the value of the wet mass of the agricultural product [24,32]. These two outputs are predicted by the plant growth from STICS subject to changes in greenhouse geometry, construction materials, plant types, numbers and locations in the greenhouse, and environmental conditions. Clearly, STICS requires values for many input parameters that we have not considered, since growth-rate models were beyond the scope of the present study. One influencing growth-rate factor is the CO2 history in the greenhouse, which we have not modeled. However, a first-order approximation would be to the consider air infiltration (already included in the model) sufficient to keep the CO2 concentration equal to about 400 ppm, that of the outside ambient air [24], which ignores the CO2 contribution from soil respiration.
7. Comment on Scalability
Scalability, the extent to which the models may be accurately applied to agrivoltaic greenhouse designs of different sizes, dimensions, and materials enters the problem in several ways. For the thermal and moisture transport models, constant values of the convective heat transfer coefficients (h), radiation surface properties, and radiation view factors were used based on fundamentals from the heat transfer literature and were adjusted slightly during model calibration as described above. Good scalability may be assured if the designer refers to these fundamentals in carrying out the design. For example, free convection (in addition to radiation) heat transfer occurs between the inside of PV panels and the concrete block on the test-cell floor. Correlations for h exist in the literature for the geometry of the test cell and the intensity of the convection (i.e., laminar or turbulent flow). These should be sought out and used in the design. The same holds for radiation view factors and the need for accurate radiation surface properties for test-cell materials. The equations for the shadowing model and the model for heat transfer in the concrete block and soil mass are both general (no correlations are used) and will scale without any restrictions. Scalability of the relative humidity model is more challenging as we used the Hargreaves equation for evapotranspiration of water from the planters with a correction factor (0.525) determined by comparing with measured humidity data. We have no data to suggest the general nature of this correction factor. See Equation (A10).
8. Conclusions
Our test cell has shown promising results, and further work on developing its design is already underway. Low-light-tolerant plants, such as kale, can be grown in the test cell during extended time periods outside of the normal growing season. Light levels should be increased to improve the instantaneous photosynthetic rate. A design change such as widening the glazing area between the panels would have such an effect. The test cell reduces the number of hours the cell air spends below 0 °C (32 °F) by 36.6%, as compared to ambient. Powering an electrical load from the PV panels will generally improve growing performance by keeping temperatures near 20 °C (68 °F) for more of the year. More importantly, the load tends to reduce daily maximum temperatures, especially during the summer, but has a negligible effect on daily minimum temperatures. Days with lower maximum temperatures, like those during the winter, are also affected less.
Stilt-mounted PV arrays, as seen in [10], block much less sunlight than the panels in our test cell. However, stilt-mounted PV arrays do not extend the growing season, as the plants grow in their normal ambient environment. One of our major objectives was to extend the growing season, which stilt-mounted PV arrays cannot do.
Based on the net photosynthetic gain each day per unit area shown in Section 4.3.2, it is possible to grow kale in the test cell, because plants inside it receive sufficient PAR irradiance to produce a net gain in energy and biomass on most days. When both beam and diffuse radiation are considered, it is clear that most of the base area can be productively used for plant growth. The best growing area is along a line running north–south, which is centered between the east and west sides of the test cell.
Increasing the panel area results in an increase in cell temperatures during periods of intense solar radiation over those seen in the base case. This increase in temperatures can be counteracted, in full or in part, by powering a load from the panels. The same behavior is expected if the glazing area between the panels is doubled. If the system is scaled up for use in agricultural land, and the glazing area is increased, it is expected that the system will function as intended and that temperatures in the test cell will remain above ambient throughout the year.
Author Contributions
Conceptualization, F.R.S. and G.F.J.; methodology, G.F.J. and M.E.E.; software, M.E.E.; validation, M.E.E., G.F.J. and F.R.S.; formal analysis, M.E.E.; investigation, M.E.E.; resources, G.F.J.; data curation, M.E.E.; writing—original draft preparation, M.E.E.; writing—review and editing, G.F.J., F.R.S. and J.A.L.; visualization, M.E.E.; supervision, G.F.J. and F.R.S.; project administration, G.F.J. and F.R.S.; funding acquisition, G.F.J. All authors have read and agreed to the published version of the manuscript.
Funding
This research was funded by internal supporting research at Villanova University, which supported co-author M.E.E. The authors appreciate this support through the College of Engineering.
Data Availability Statement
See Mendeley Data Repository https://data.mendeley.com/datasets/7fdgvw4b32/1.
Acknowledgments
Two solar panels were donated by Solar States LLC.
Conflicts of Interest
The authors declare no conflict of interest. The funder for co-author M.E.E. had no role in the design of the study; in the collection, analyses, or interpretation of data; in the writing of the manuscript; or in the decision to publish the results.
Nomenclature
| Variable | Definition |
| A | Surface area, m2 |
| B | Solar radiation transmitted through a transparent surface, W/m2 |
| Cp | Specific heat capacity, J/kg·K |
| Eb | Emissive power, W/m2 |
| E | Evaporation rate, kg/s |
| ET | Evapotranspiration rate, kg/s |
| h | Coefficient of free convection, W/m2·K |
| J | Radiosity, W/m2 |
| k | Thermal conductivity, W/m2·K |
| L | Through-thickness length, m |
| M | Mass, kg |
| Mdot | Mass flow rate, kg/s |
| p | Index of the five-minute period per day from 0 to 288 |
| pa | Air vapor pressure, Pa |
| pg | Saturation air vapor pressure, Pa |
| H | Heigh of obstruction (i.e., side panel), m |
| q | Heat flow rate, W |
| RH | Relative humidity |
| Ra | Extraterrestrial solar radiation, W/m2 |
| Rc | Thermal contact resistance, m2·K/W |
| S | Incident solar radiation, W/m2 |
| SOF | Sky obstruction factor |
| SP | Shadow projection point, m |
| T | Temperature, K |
| U | Transmitted solar radiation, W/m2 |
| V | Volume, m3 |
| y | Horizontal distance from panel edge, m |
| α | Thermal diffusivity, m2/s |
| β | Angle from horizontal, degrees |
| Δx | Material layer thickness, m |
| δ | Declination angle, degrees |
| ε | Emissivity |
| η | Solar altitude angle, degrees |
| λ | Humidity ratio |
| φ | Latitude, degrees |
| ρ | Density, kg/m3 |
| σ | Stefan-Boltzmann constant, W/m2·K4 |
| ω | Hour angle, degrees |
| Subscript | |
| a | Test cell air |
| con | Concrete |
| cond | Conduction |
| cd | Condensation |
| east | Eastern facing solar panel |
| evap | Evaporative cooling |
| cv | Free Convection |
| flux | Heat Flux |
| i | ith node |
| in | Inner |
| infi | Infiltration |
| irrig | Irrigation |
| lex | Polycarbonate (i.e., Lexan) |
| ligh | SR transmitted through Lexan |
| liq | Liquid water node |
| low | Lower thermal node |
| Subscript | |
| max | Maximum |
| out | Outer |
| over | Overflow |
| plant | Planters |
| rad | Radiation heat exchange |
| rise | Sunrise |
| sidp | Side Panel |
| sky | Radiation heat exchange with sky |
| soil | Soil |
| sol | Incident solar radiation |
| sp | Solar Panel |
| set | Sunset |
| tcc | Thermal Contact Conductance |
| up | Upper thermal node |
| west | Western facing solar panel |
| wind | Free convection with wind |
Appendix A
The test cell was instrumented with solar radiation, temperature, humidity, windspeed, and wind direction sensors. To collect solar radiation data, an Onset S-LIB-M003 silicon pyranometer was selected, with a measurement range of 0–1280 W/m2 and a resolution of 1.25 W/m2. The sensor has an uncertainty of ±10 W/m2 or ±5% of the reading (whichever is greater), and an additional ±0.38 W/m2/°C (±0.21 W/m2/°F) for a temperature greater or less than 25 °C (77 °F) [33].
The temperature and humidity data measurements were made with Elitech GSP-6 temperature and humidity data loggers. This logger has two separate sensors, one for the temperature and one for the humidity. The temperature measurement range is −40 °C (−40 °F) to 85 °C (185 °F). The temperature accuracy is ±0.5 °C (0.9 °F) when within the temperature range of −20 °C (−4 °F) to 40 °C (104 °F) and ±1 °C (1.8 °F) when outside of that range. The temperature resolution is 0.1 °C (0.18 °F) [34].
For the humidity sensors, the measurement range is 10–99% RH. The accuracy for this RH measurement is ±3% at 25 °C (77 °F) between 20–90% RH and ±5% outside of this range. The resolution of the RH measurements is 0.1%.
In total, the GSP-6 can collect 16,000 data points between uploads [34].
Wind speed and direction were measured by a Davis wind speed and direction smart sensor from Onset [35]. It has a measurement range from 0 to 76 m/s and wind direction from 0 to 355 degrees. The resolution of the wind speed sensor is 0.5 m/s, and the resolution of the wind direction sensor is 1 degree. The wind speed sensor has an accuracy of ±1.1 m/s or ±5%, whichever is greater. The accuracy for the wind direction sensor is ±7 degrees [35].
Appendix B
As a nondestructive means of estimating a plant’s dry mass, allometry is a predictive method based on the measurement of a characteristic dimension of a plant, such as its stem length, leaf area, or average leaf dimensions. The dry mass of plants in the test cell and control cell were determined using measurements of total leaf area to determine an empirical allometric function, thus avoiding the need for destructive leaf testing.
An allometric function is created by measuring several aspects of a selected plant, in our case, leaf area, stem length, leaf number, and stem thickness. Then, the plant is harvested and dried, and its dry mass is obtained through measurement. Dry mass is then plotted against measured plant quantities, and the allometric function is determined by a regression analysis.
Figure A1 shows plant dry mass vs total leaf area and several trial curve fits. A second-order polynomial was found to give the best fit and was used in Section 4.2.2. To test the second-order polynomial, several plants were harvested, measured, and dried. Their dry mass was compared to the value predicted by the selected function. This is shown in Table A1. Both Table A1 and Figure A1 show an outlier. It is believed that this plant grew abnormally and in contradiction to the previously established trend.
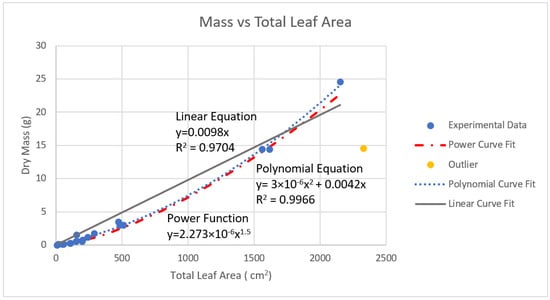
Figure A1.
Dry mass as a function of total leaf area. Trial curve fits include linear, a power function, and a second-order polynomial. The second-order polynomial showed best agreement with the data.

Table A1.
Comparison of experimentally derived plant dry mass sampled from the test cell to the value predicted by the allometric correlation of the same plants by a second-order polynomial.
Table A1.
Comparison of experimentally derived plant dry mass sampled from the test cell to the value predicted by the allometric correlation of the same plants by a second-order polynomial.
| Plant # | Leaf Area (cm2) | Correlation Result (kg) | Experimental Measurement (kg) | % Error |
|---|---|---|---|---|
| 1 | 15.3 | 0.065 | 0.063 | 3.1 |
| 2 | 26.1 | 0.112 | 0.113 | 1.1 |
| 3 | 33.3 | 0.161 | 0.112 | 43.7 |
| 4 | 38 | 0.164 | 0.151 | 8.3 |
Appendix C
Several well-known equations were used to model phenomenon discussed regarding Equations (1)–(10). Equations (A1)–(A3) and (A6)–(A9) were found from [36], and Equations (A4) and (A5) were found from [21]. For convection heat transfer, Newton’s law of cooling is
where h is from appropriate correlations for the convection type (laminar or turbulent) and geometry [36].
qcv = h (T1 − T2) A
For radiation heat transfer, the Stephan-Boltzmann law was used. For example, for radiation between the sky temperature and a Lexan surface at temperature T, we have
qsky,lex = σ ε (Tsky4 − T4) A
With tilt of the solar panels and the effect of blockage from trees, buildings, and other obstructions being included, we obtain
where the dimensionless SOF (0 ≤ SOF ≤ 1) accounts for the above obstructions in the manner of a radiation view factor.
qsky,sp = SOF σ ε (Tsky4 − T4) A (1 + cos β)/2
The heat flow rate due to incident solar radiation is
qsol = S A
The heat flow rate due to light transmitted to the interior of the test cell incident on an interior surface is
qligh = U A/Atotal
We assume that all light transmitted to the interior of the test cell is diffuse and distributed uniformly over all internal surfaces.
The net radiation method is used to calculate the thermal radiation exchange among surfaces that can view one another. This is
where Eb is the blackbody emissive power, J is the radiosity, and ε is the emissivity of the participating surface [36].
qrad = (Eb − J) A / ((1 − ε)/ε)
For conduction heat transfer, Fourier’s law for 1D heat flow is
qcond = (k/L) (Ti — Tj) A
The equation for heat flow due to thermal contact conductance follows the form of Fourier’s law and is
qtcc = (A/Rc) (Ti — Tj)
For heat flow due to air infiltration, we obtain
where Tint is the test cell air temperature and Tamb is the ambient temperature.
qinfi = Mdota Cpa (Tint — Tamb)
The evapotranspiration of water from the planters, Equation (A10), is modeled using the Hargreaves equation [20]. The Hargreaves equation predicts evapotranspiration based primarily on the maximum and minimum daily temperature. It is converted from mm/day into kg/s for the purposes of our equation, and a scaling factor of 0.525 was applied based on the parametric study, as the equation was being used in an environment for which it was not developed. It is important to note that the daily evaporation predicted by the Hargreaves equation was assumed to be constant throughout the day to convert the equation from mm/day to kg/s. The Hargreaves equation used in the present work is
where
and
ETplant = 0.525 × 0.0022 · Ra · TR0.5 (TC + 17.8)
TR = Tmax − Tmin
TC = (Tmax − Tmin)/2
In these equations, TR is the difference between the maximum and minimum temperatures of the day, and TC is the average temperature of the day in °C.
The equation for mass flow rate due to infiltration is
Minfih2o = Mdota (λamb − λcell)
Appendix D
All parameters for the thermal and moisture transport model are presented in Table A2, Table A3, Table A4, Table A5, Table A6, Table A7, Table A8, Table A9 and Table A10. All other parameters and values necessary for the model were derived from those presented here. Some of the parameters listed below are universal constants, like Gsc, σ, and Rgas which are the solar constant, the Stefan-Boltzmann constant, and the gas constant, respectively. Other constants, such as all angles and lengths, were measured values from the test cell, some of which were adjusted for model calibration in the parametric simulations. Finally, values such as specific heat capacities, densities, emissivity values, and other material properties were set as general values accepted for those materials. Some values in this appendix were slightly varied during parametric simulations. The values used in the base case are presented here.

Table A2.
Geometric angles and other standard constants.
Table A2.
Geometric angles and other standard constants.

Table A3.
Constant parameters for a polycarbonate sheet.
Table A3.
Constant parameters for a polycarbonate sheet.

Table A4.
Physical parameters for the solar panels.
Table A4.
Physical parameters for the solar panels.

Table A5.
Constant parameters for soil. Also included here are values for the planters which contain soil.
Table A5.
Constant parameters for soil. Also included here are values for the planters which contain soil.

Table A6.
Constant parameters for air.
Table A6.
Constant parameters for air.

Table A7.
Constant parameters for concrete.
Table A7.
Constant parameters for concrete.

Table A8.
Miscellaneous constant parameters related to thermal contact conductance, liquid water properties, irrigation rates, sky view factors, and the Hargreaves equation scale factor.
Table A8.
Miscellaneous constant parameters related to thermal contact conductance, liquid water properties, irrigation rates, sky view factors, and the Hargreaves equation scale factor.

Table A9.
Technical parameters for the solar panels.
Table A9.
Technical parameters for the solar panels.
| ThicknessGlass = 4 mm | ThicknessSi = 0.5 mm | ThicknessCoat = 0.25 mm |
| CpSPglass = 700 J/K*kg (quartz glass) | CpSi = 705 J/K*kg (silicon) | |
| Cpcoat = 1900 J/K*kg (EVA) | EpsSPb = 0.85 for aluminum (originally 0.77) (Emissivity) | EpsSPt = 0.93 for glass (originally 0.93) (Emissivity) |
| Tasp = 0.915 for glass (transmittance–absorbtance product) |

Table A10.
Input parameters associated with the Instantaneous Photosynthetic Rate.
Table A10.
Input parameters associated with the Instantaneous Photosynthetic Rate.
References
- MinnPost. Available online: https://www.minpost.com/community-voices/2019/06/minnesota-has-plenty-of-land-for-solar-development/ (accessed on 1 July 2019).
- Statesman Journal. Available online: https://www.statesmanjournal.com/story/news/local/stayton/2019/01/25/oregon-solar-farms-new-rules-high-value-farmland/2609838002/ (accessed on 14 June 2019).
- New York Times. Available online: https://www.nytimes.com/2018/07/11/us/washington-state-rural-solar-economy.html (accessed on 12 July 2018).
- Treehugger. Available online: https://www.treehugger.com/agrivoltaics-solar-power-crops-bees-4863595 (accessed on 2 April 2021).
- Jouid, K.A.; Farhan, A.A. A dynamic model and an experimental study for the cell air and soil temperatures in an innovative greenhouse. Energy Convers. Manag. 2014, 91, 76–82. [Google Scholar] [CrossRef]
- Marucci, A.; Zambon, I.; Colantoni, A.; Monarca, D. A combination of agricultural and energy purposes: Evaluation of a prototype of photovoltaic greenhouse tunnel. Renew. Sustain. Energy Rev. 2017, 82, 1178–1186. [Google Scholar] [CrossRef]
- Cossu, M.; Yano, A.; Li, Z.; Onoe, M.; Nakamura, H.; Matsumoto, T.; Nakata, J. Advances on the semi-transparent modules based on micro solar cells: First integration in a greenhouse system. Appl. Energy 2015, 162, 1042–1051. [Google Scholar] [CrossRef] [Green Version]
- Cossu, M.; Cossu, A.; Deligios, P.A.; Ledda, L.; Li, Z.; Fatnassi, H.; Poncet, C.; Yano, A. Assessment and comparison of the solar radiation distribution inside the main commercial photovoltaic greenhouse types in Europe. Renew. Sustain. Energy Rev. 2018, 94, 822–834. [Google Scholar] [CrossRef]
- Cossu, M.; Murgia, L.; Ledda, L.; Deligios, P.A.; Sirigu, A.; Chessa, F.; Pazzona, A. Solar radiation distribution inside a greenhouse with south-oriented photovoltaic roofs and effects on crop productivity. Appl. Energy 2014, 133, 89–100. [Google Scholar] [CrossRef]
- Sekiyama, T.; Nagashima, A. Solar Sharing for Both Food and Clean Energy Production: Performance of Agrivoltaic Systems for Corn, A Typical Shade-Intolerant Crop. Environments 2019, 6, 65–76. [Google Scholar] [CrossRef] [Green Version]
- Vanthoor, B.H.E.; Stanghellini, C.; Van Henten, E.J.; De Visser, P.H.B. A Methodology for Model-Based Greenhouse Design: Part 1, a greenhouse climate model for a broad range of designs and climates. Biosyst. Eng. 2011, 110, 363–377. [Google Scholar] [CrossRef]
- Sethi, V.P.; Sumathy, K.; Lee, C.; Pal, D.S. Thermal modeling aspects of solar greenhouse microclimate control: A review on heating technologies. Sol. Energy 2013, 96, 56–82. [Google Scholar] [CrossRef]
- Mohammadi, B.; Ranjbar, S.F.; Ajabshirchi, Y. Application of a dynamic model to predict some inside environmental variables inside a semi-solar greenhouse. Inform. Process. Agric. 2018, 9, 279–288. [Google Scholar]
- Cooper, P.I.; Fuller, R.J. A transient model of the interaction between crop environments and a greenhouse structure for predicting crop yield and energy consumption. J. Agric. Eng. Res. 1983, 28, 401–417. [Google Scholar] [CrossRef]
- Sethi, V.P. On the selection of shape and orientation of a greenhouse: Thermal modeling and experimental validation. Sol. Energy 2009, 83, 21–38. [Google Scholar] [CrossRef]
- Tiwari, G.N.; Sharma, P.K.; Goyal, R.K.; Sutar, R.F. Estimation of an Efficiency factor for a greenhouse: A numerical and experimental study. Energy Build. 1998, 28, 241–250. [Google Scholar] [CrossRef]
- Abdel-Ghany, A.M.; Al-Helal, I.M. Solar energy utilization by a greenhouse: General relations. Renew. Energy 2011, 36, 189–196. [Google Scholar] [CrossRef]
- Solar States LLC. Available online: https://www.solar-states.com/ (accessed on 7 September 2021).
- Philip, J.R. Theory of Infiltration. Adv. Hydrosci. 1969, 5, 215–296. [Google Scholar]
- Hargreaves, G.H.; Allen, R.G. History and Evaluation of Hargreaves Evapotranspiration Equation. J. Irrig. Drain. Eng. 2003, 129, 53–63. [Google Scholar] [CrossRef]
- Duffie, J.A.; Beckman, W.A. Solar Engineering of Thermal Processes, 4th ed.; John Wiley & Sons, Inc.: Hoboken, NJ, USA, 2013; pp. 7–8. [Google Scholar]
- Goetzberger, A.; Zastrow, A. on the Coexistence of Solar-Energy Conversion and Plant Cultivation. Int. J. Sol. Energy 1982, 1, 55–69. [Google Scholar] [CrossRef]
- Buck, A.L. New equations for computing vapor pressure and enhancement factor. J. Appl. Meteorol. 1981, 20, 1527–1532. [Google Scholar] [CrossRef] [Green Version]
- Erwin, J.; Gesick, E. Photosynthetic Responses of Swiss Chard, Kale, and Spinach Cultivars to Irradiance and Carbon Dioxide Concentration. HortScience 2017, 52, 706–712. [Google Scholar] [CrossRef] [Green Version]
- Lefsrud, M.G.; Kopsell, D.A.; Kopsell, D.E.; Curran-Celentano, J. Air Temperature Affects Biomass and Carotenoid Pigment Accumulation in Kale and Spinach Grown in a Controlled Environment. HortScience 2005, 40, 2026–2030. [Google Scholar] [CrossRef] [Green Version]
- ResearchGate. Available online: https://www.researchgate.net/post/Can-I-convert-PAR-photo-active-radiation-value-of-micro-mole-M2-S-to-Solar-radiation-in-Watt-m2/59ca6422217e201e2b23415f/citation/download (accessed on 31 March 2021).
- Jones, G.F.; Evans, M.E.; Shapiro, F.R. Reconsidering Beam and Diffuse Solar Fractions for Agrivoltaics. Sol. Energy 2020, 237, 135–143. [Google Scholar] [CrossRef]
- Brisson, N.; Mary, B.; Ripoche, D.; Jeuffroy, M.H.; Ruget, F.; Nicoullaud, B.; Gate, P.; Devienne-Barret, F.; Antonioletti, R.; Dürr, C.; et al. STICS—A generic model for the simulation of crops and their water and nitrogen balances I. Theory and parameterization applied to wheat and corn. Agronomie 1998, 18, 311–346. [Google Scholar] [CrossRef]
- Brisson, N.; Gary, C.; Justes, E.; Roche, R.; Mary, B.; Ripoche, D.; Zimmer, D.; Sierra, J.; Bertuzzi, P.; Burger, P.; et al. An overview of the crop model STICS. Eur. J. Agron. 2003, 18, 309–332. [Google Scholar] [CrossRef]
- Ruget, F.; Brisson, N.; Delécolle, R.; Faivre, R. Sensitivity analysis of a crop simulation model, STICS, in order to choose the main parameters to be estimated. Agronomie 2002, 22, 133–158. [Google Scholar] [CrossRef]
- Leonard, J. Nitrification, Denitrification and N2O Emissions in STICS. Available online: Documentation_N2O_formalism_STICS.html (accessed on 27 September 2018).
- Majumdara, D.; Pasqualetti, M.J. Dual Use of Agricultural Land: Introducing ‘Agrivoltaics’ in Phoenix Metropolitan Statistical Area, USA. Landsc. Urban Plan. 2018, 170, 150–168. [Google Scholar] [CrossRef]
- Onset Computers. Solar Radiation (Silicon Pyranometer) Smart Sensor. Available online: https://www.onsetcomp.com/products/sensors/s-lib-m003/ (accessed on 14 July 2019).
- Elitech Store. Available online: https://www.elitechlog.com/wp-content/manuals/GSP-6-instructions.pdf (accessed on 14 July 2019).
- Onset Computers. Davis® Wind Speed and Direction Smart Sensor. Available online: https://www.onsetcomp.com/products/sensors/s-wcf-m003/ (accessed on 14 July 2019).
- Incropera, F.P.; Dewitt, D.P. Fundamentals of Heat and Mass Transfer, 4th ed.; John Wiley & Sons, Inc.: Hoboken, NJ, USA, 2007. [Google Scholar]
Publisher’s Note: MDPI stays neutral with regard to jurisdictional claims in published maps and institutional affiliations. |
© 2022 by the authors. Licensee MDPI, Basel, Switzerland. This article is an open access article distributed under the terms and conditions of the Creative Commons Attribution (CC BY) license (https://creativecommons.org/licenses/by/4.0/).