
Phenotypic Diversity Analysis of Lens culinaris Medik. Accessions for Selection of Superior Genotypes


Abstract
:1. Introduction
2. Materials and Methods
2.1. Plant Materials and Study Location
2.2. Experimental Design and Data Collection
2.3. Statistical Analysis
3. Results
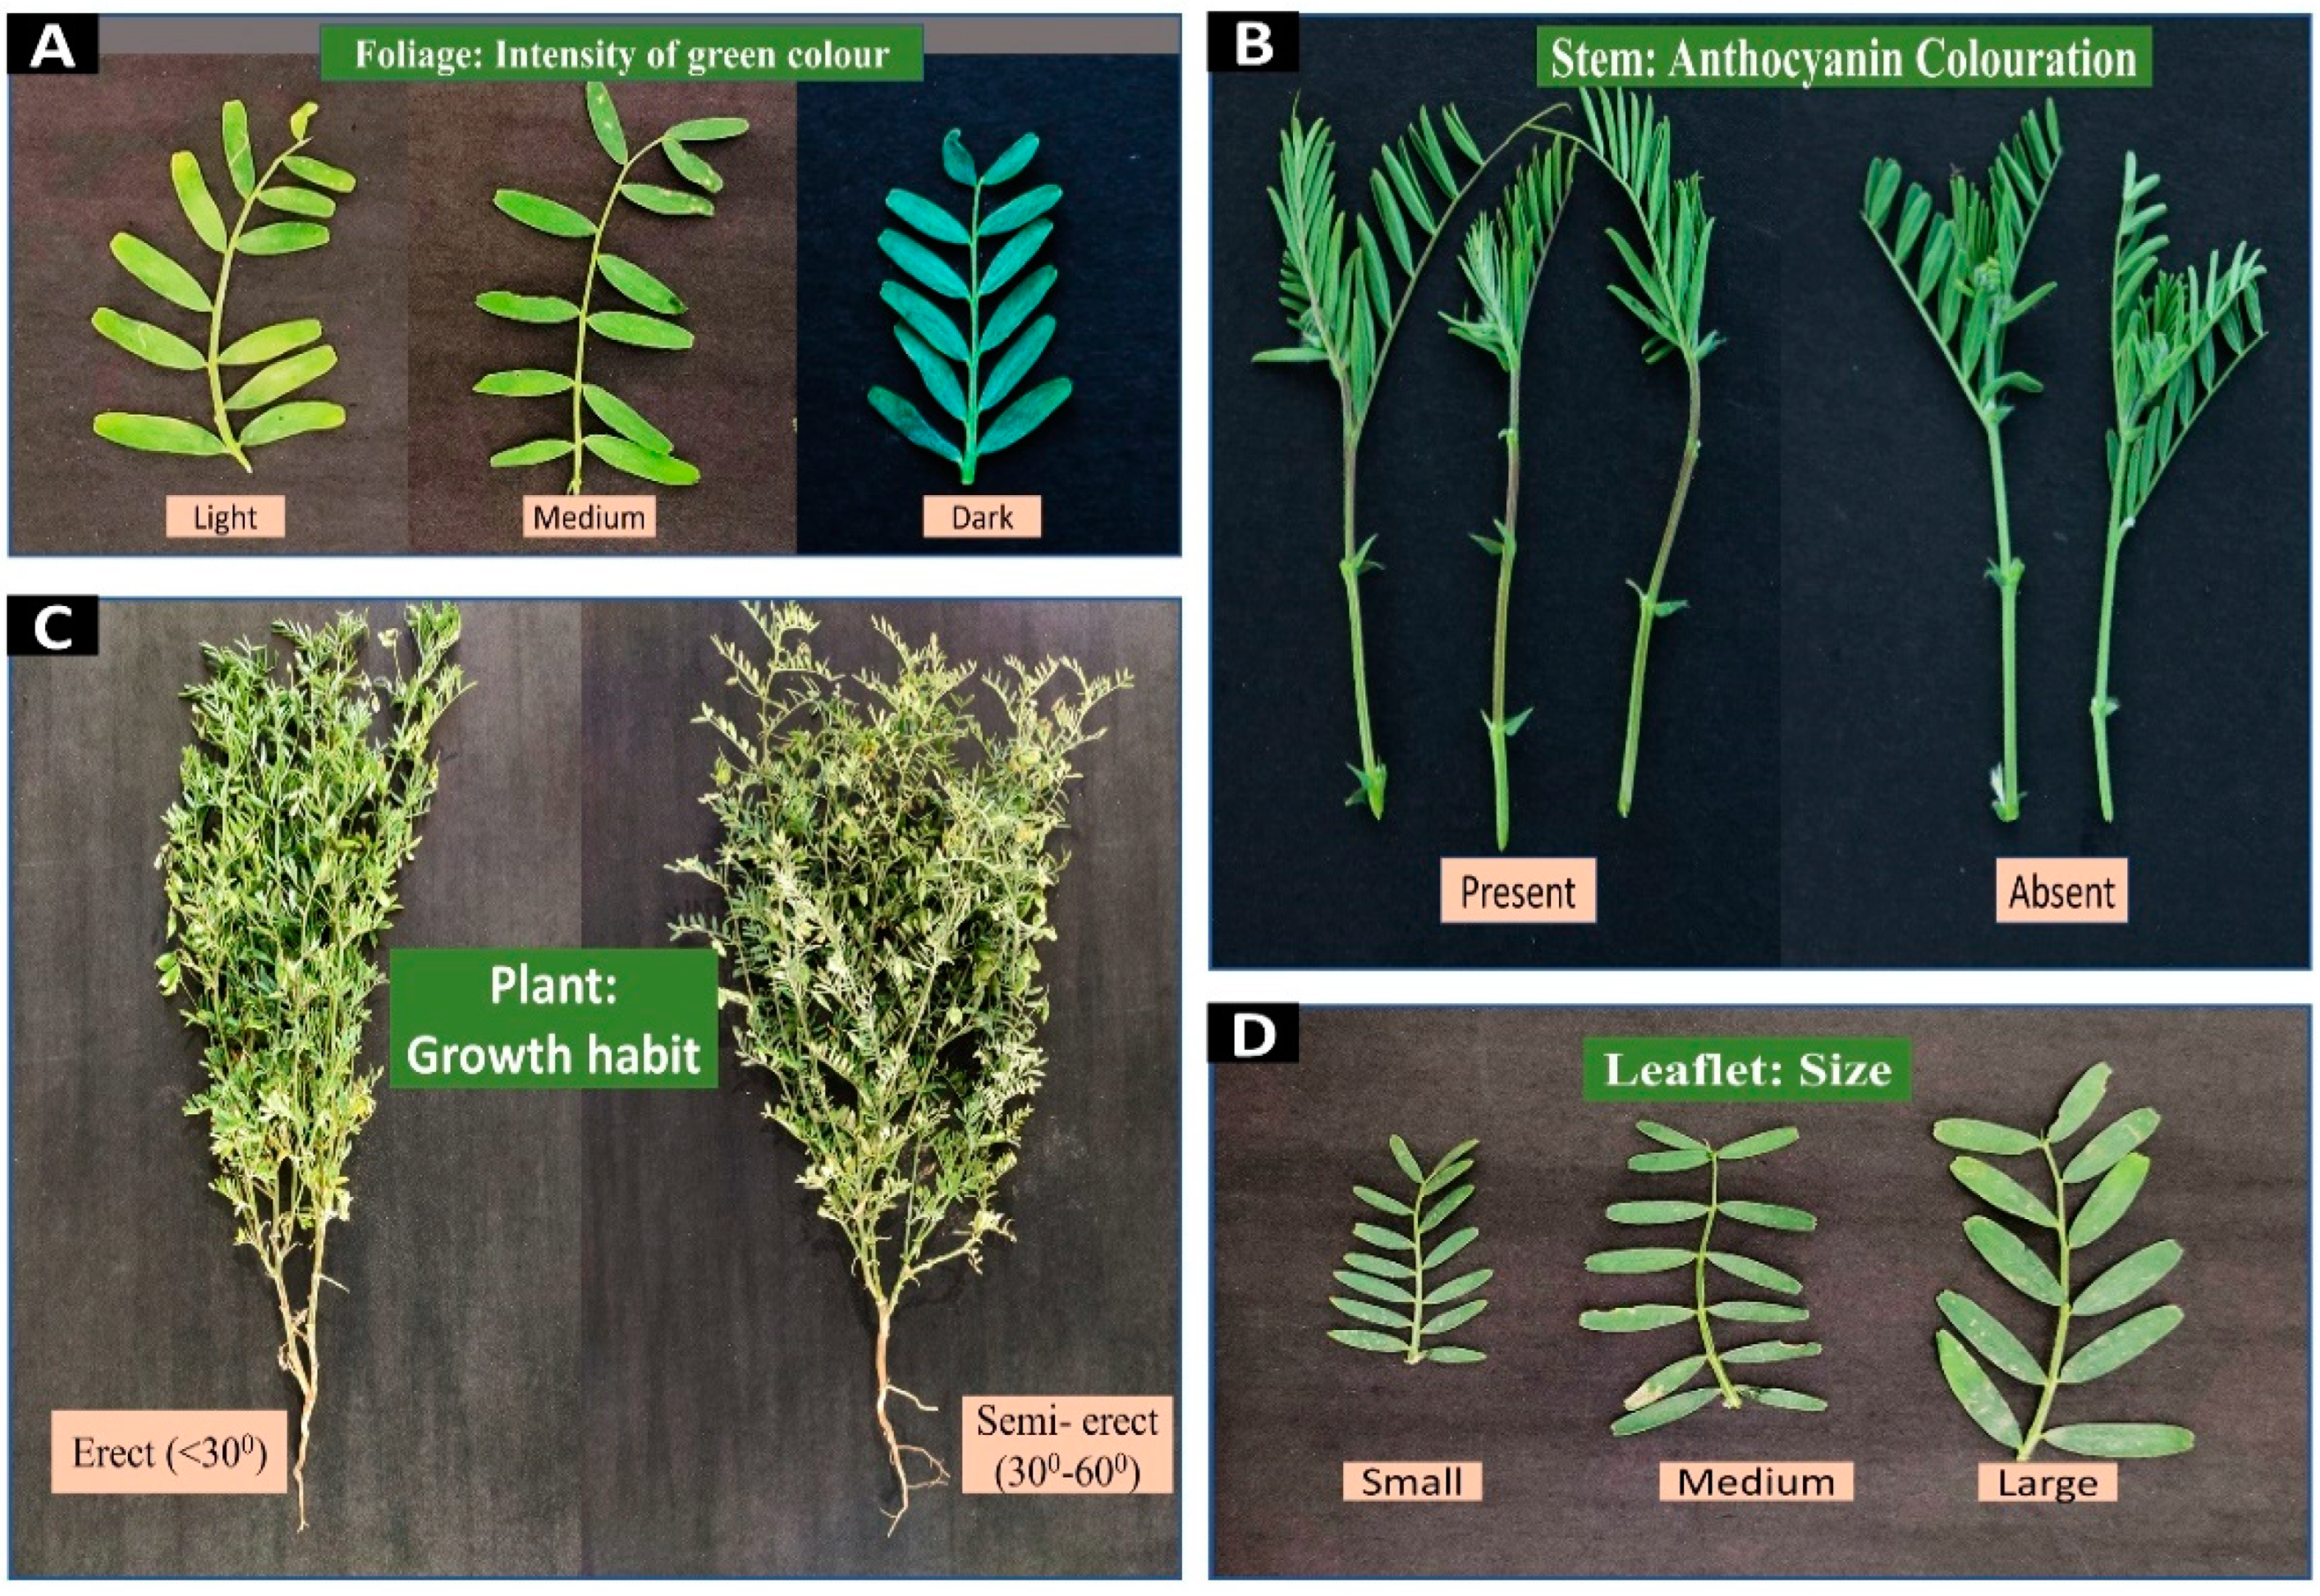
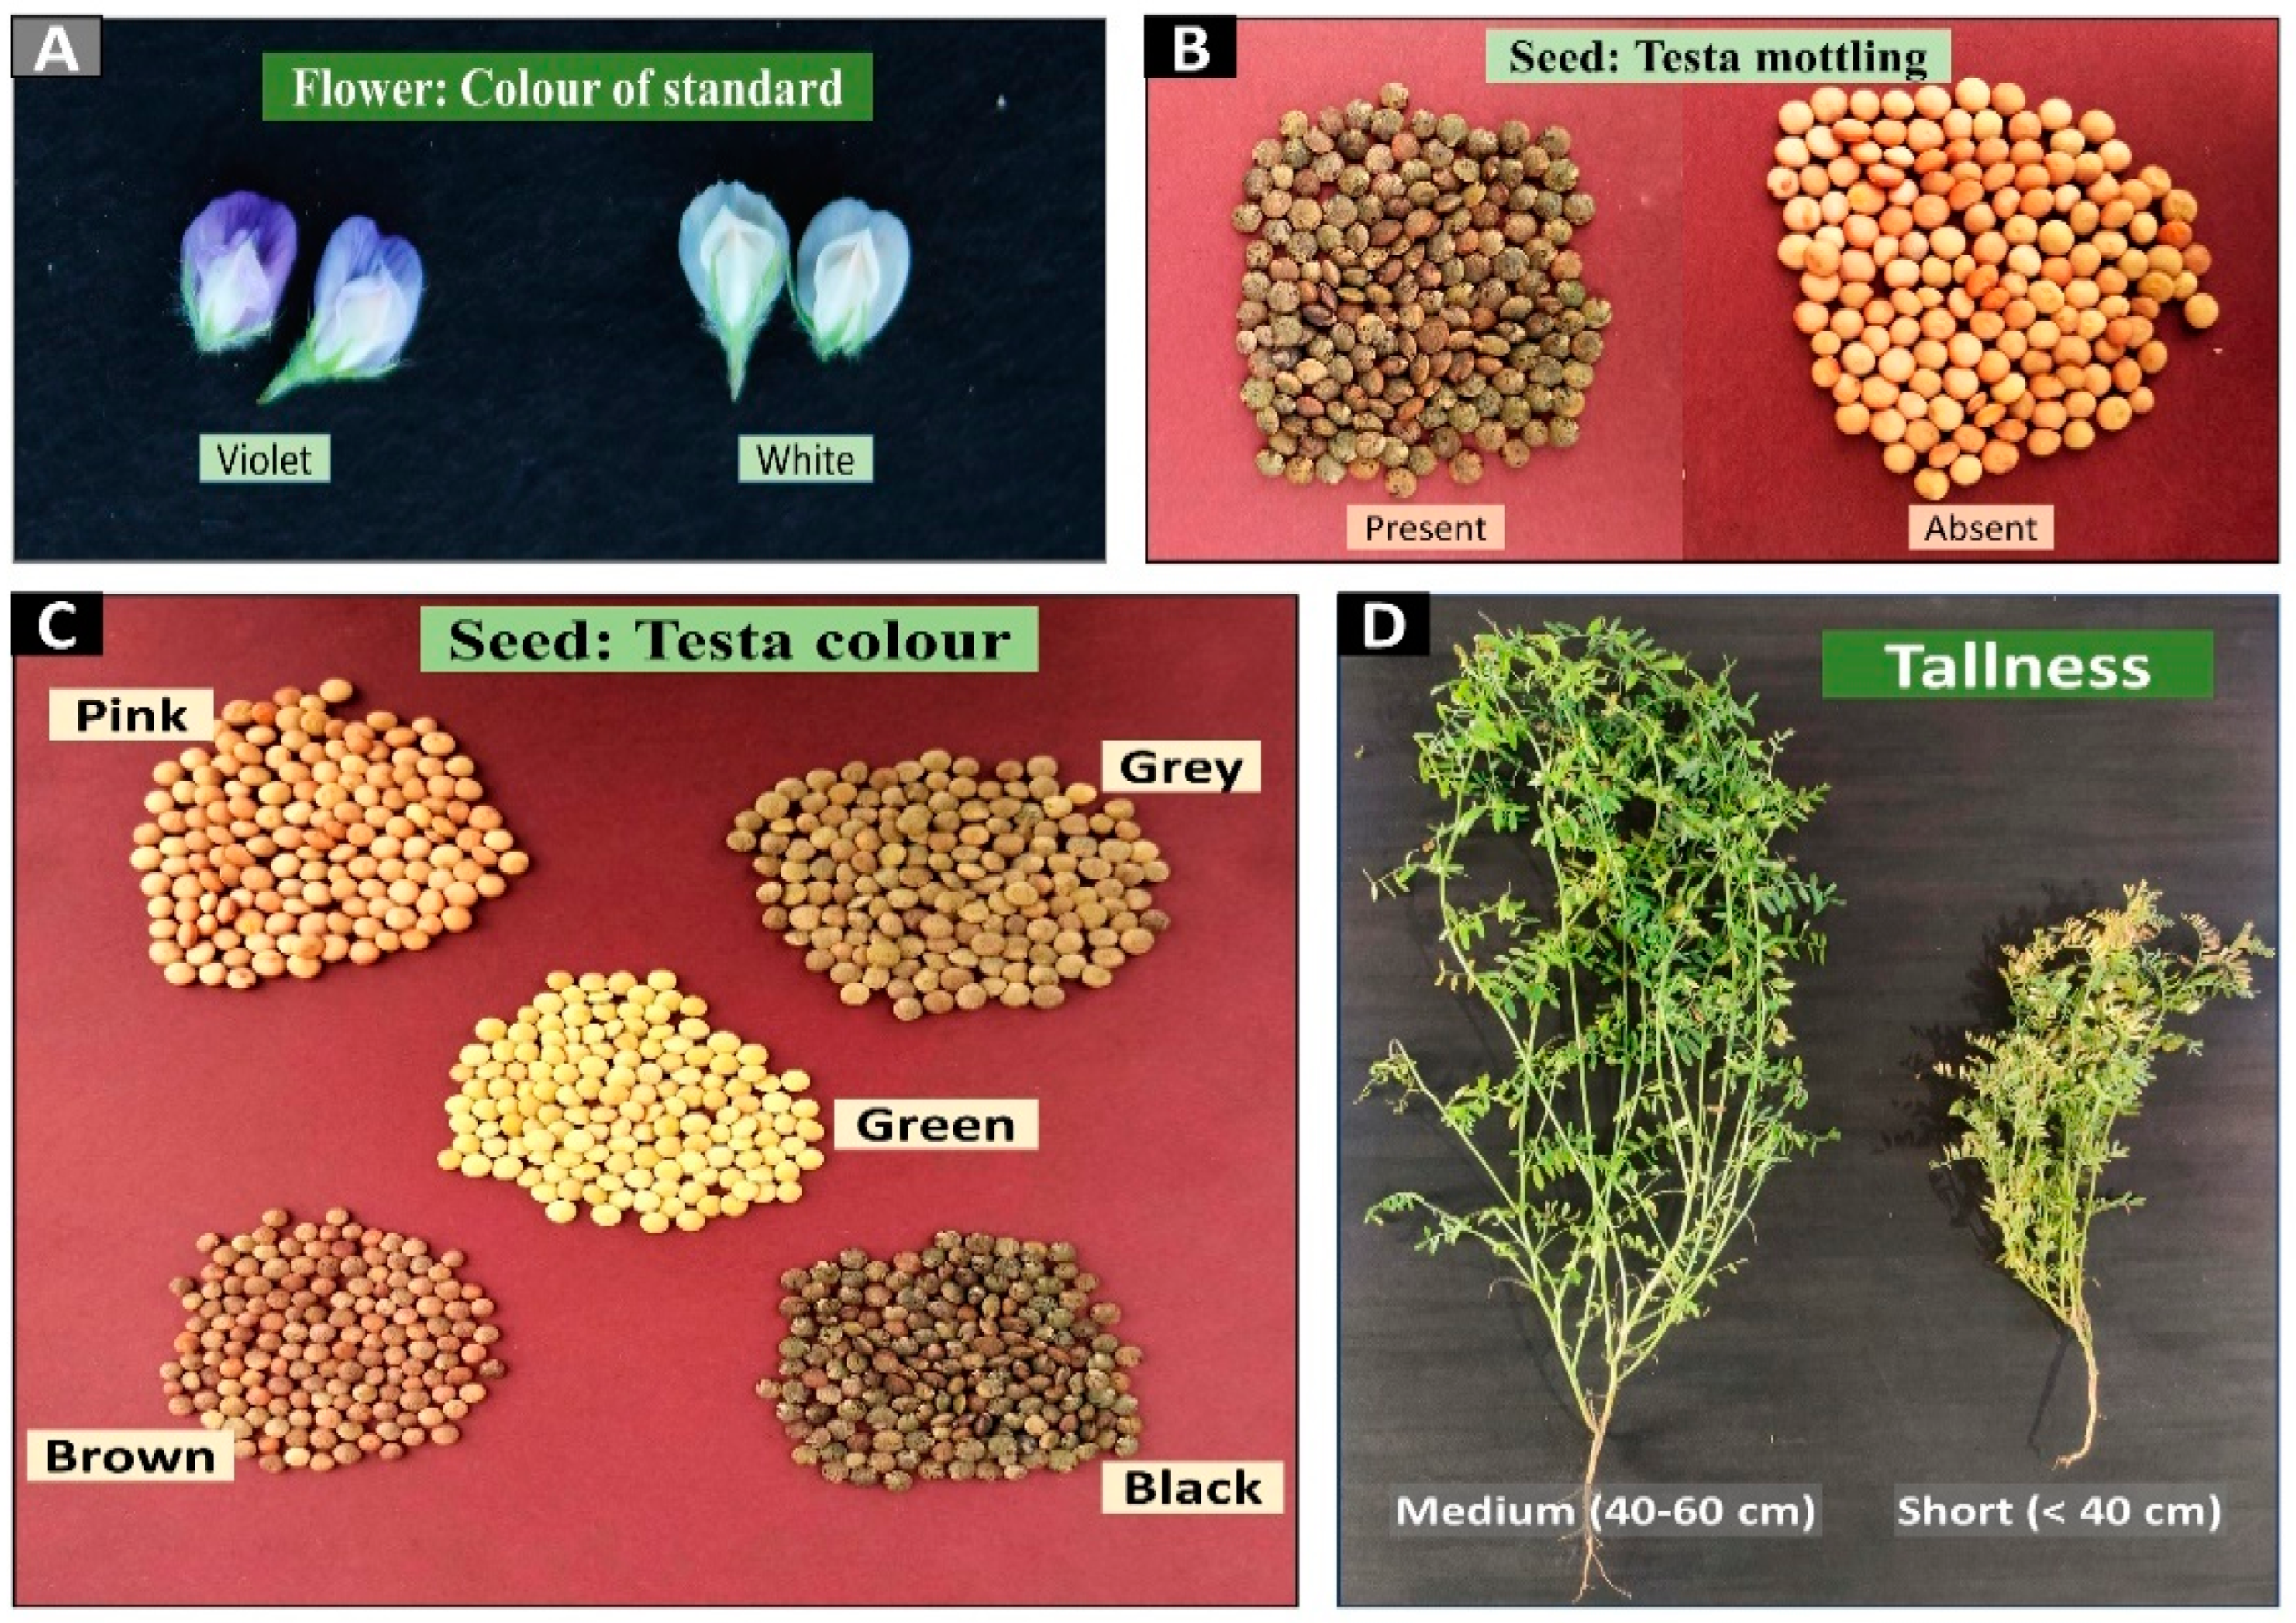
3.1. Evaluation of Genotypes Based on Qualitative Traits
3.2. Genotype and Genotype × Environment Variations Based on Quantitative Traits
3.3. Mean Performance of Lentil Genotypes across the Environments
3.4. Interrelations among Agro-Morphological Traits
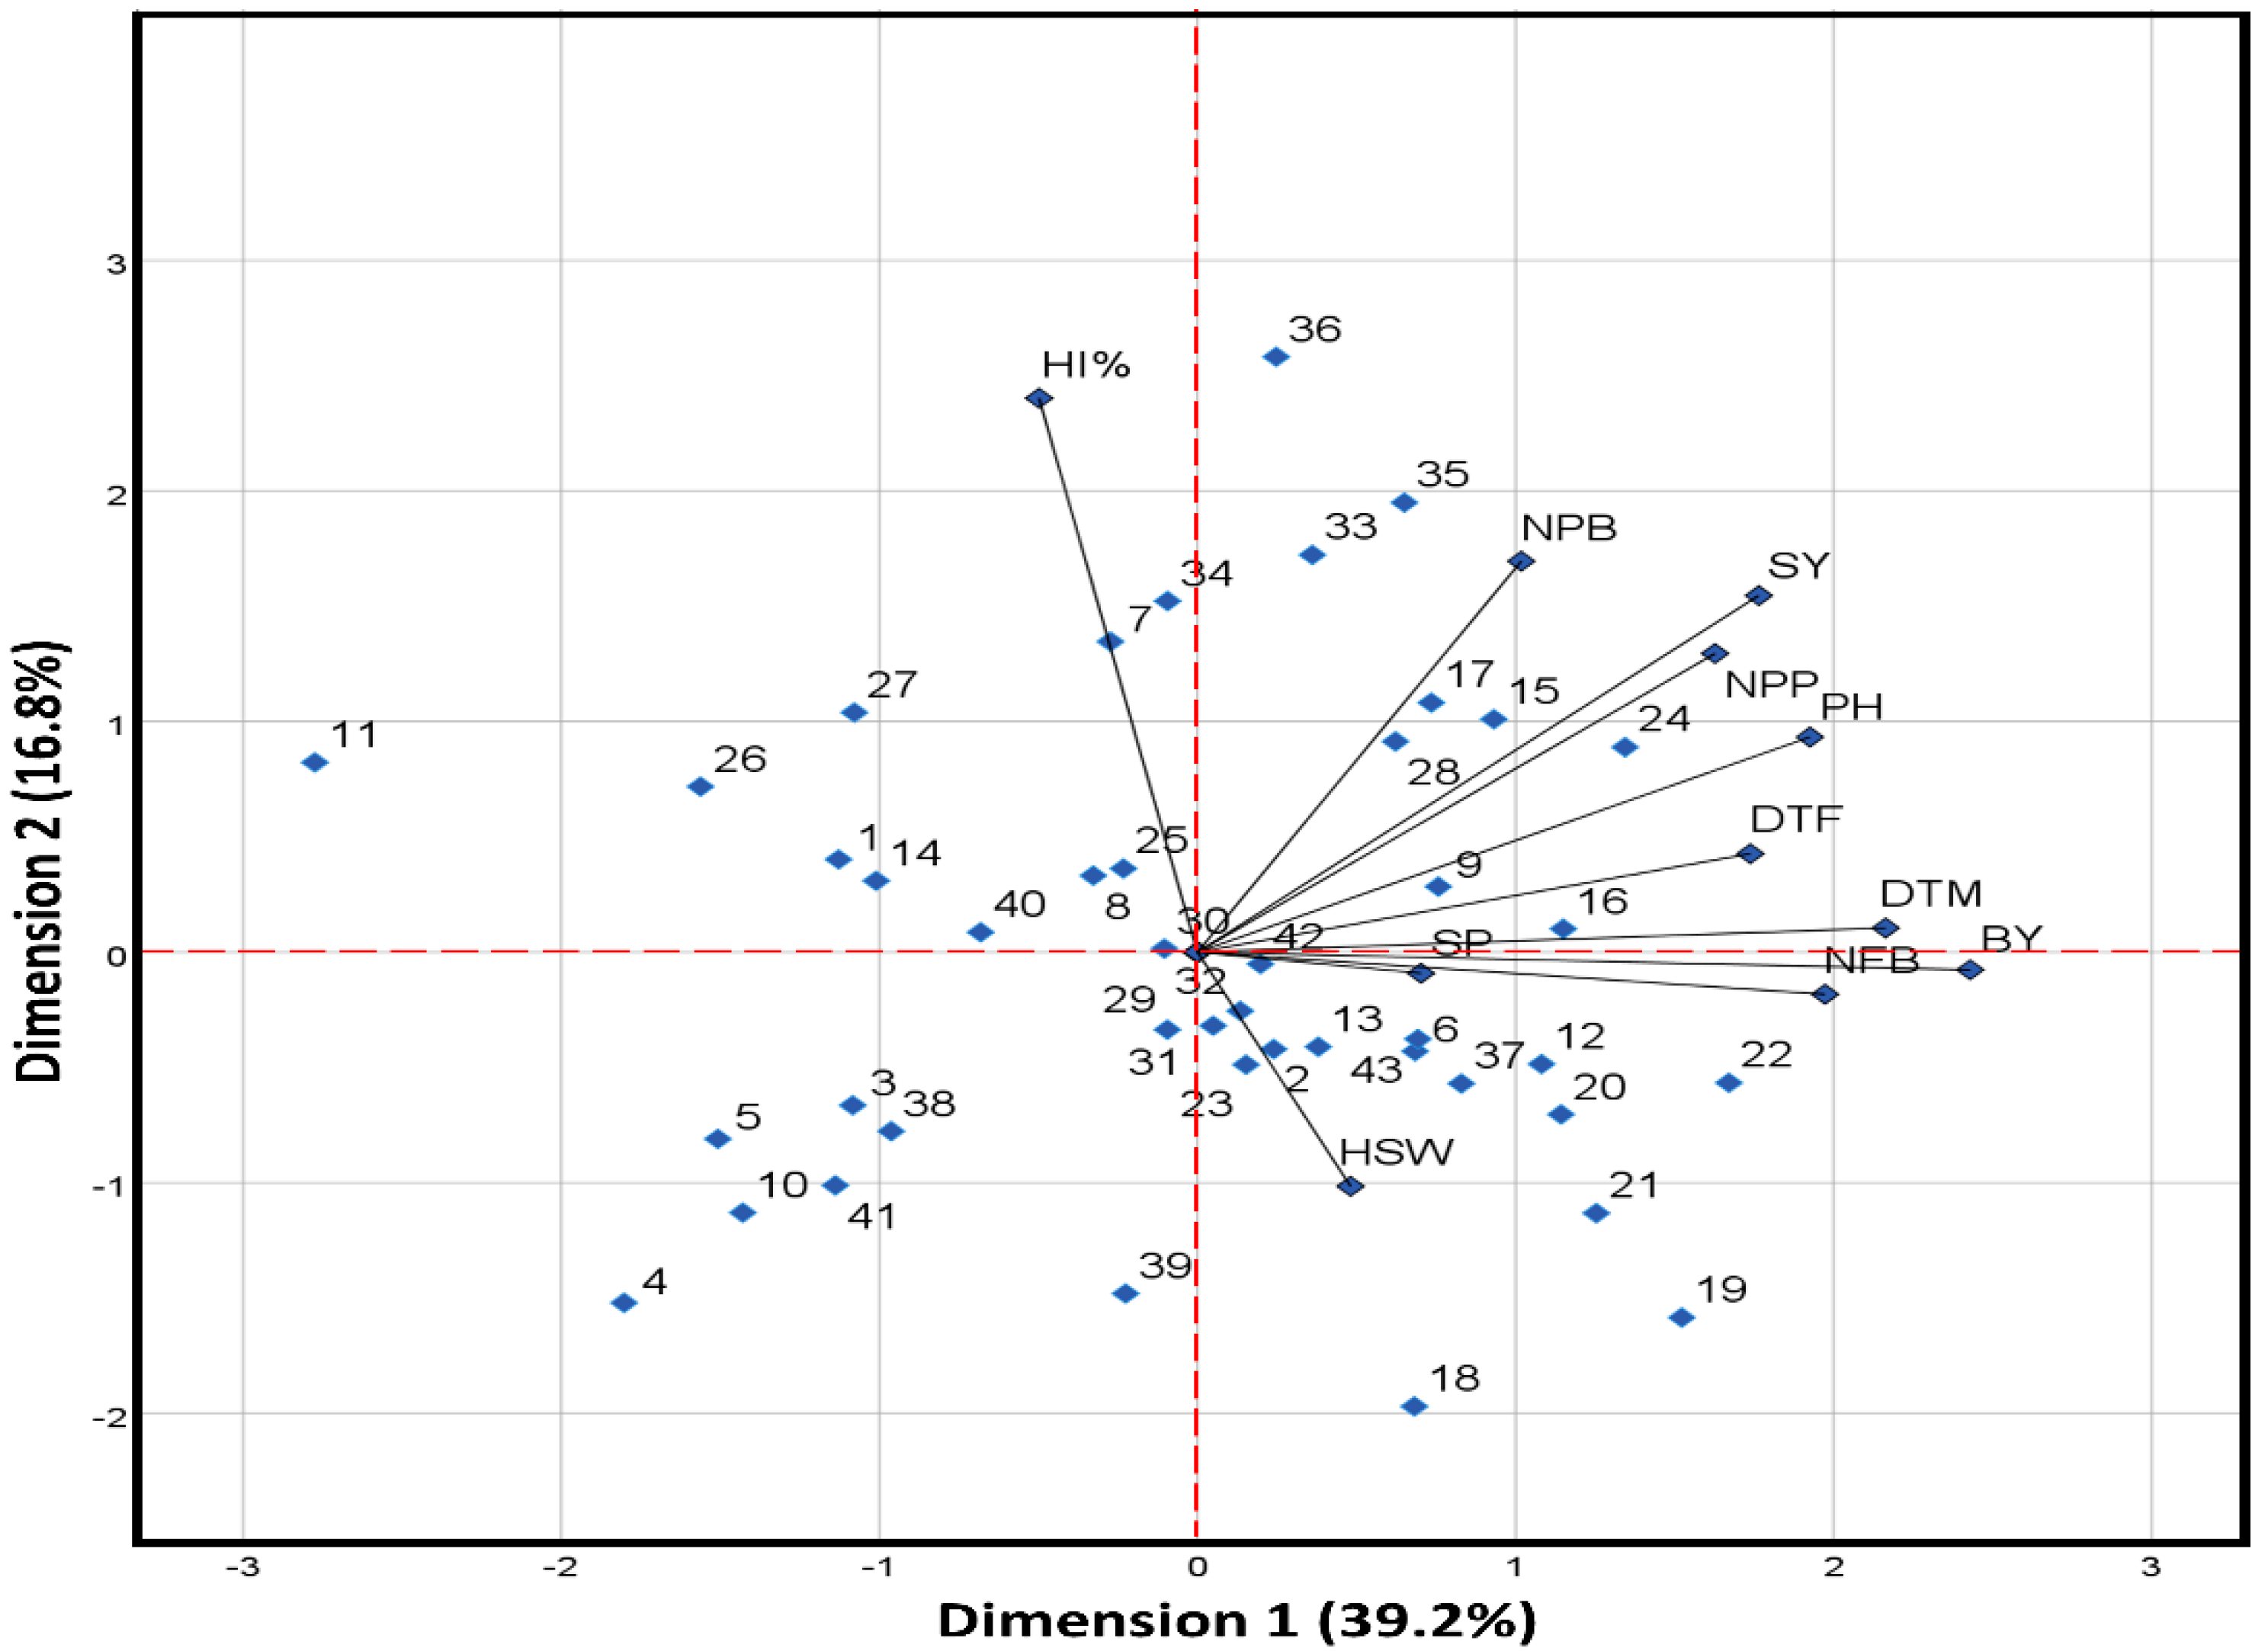
3.5. Principal Component Analysis
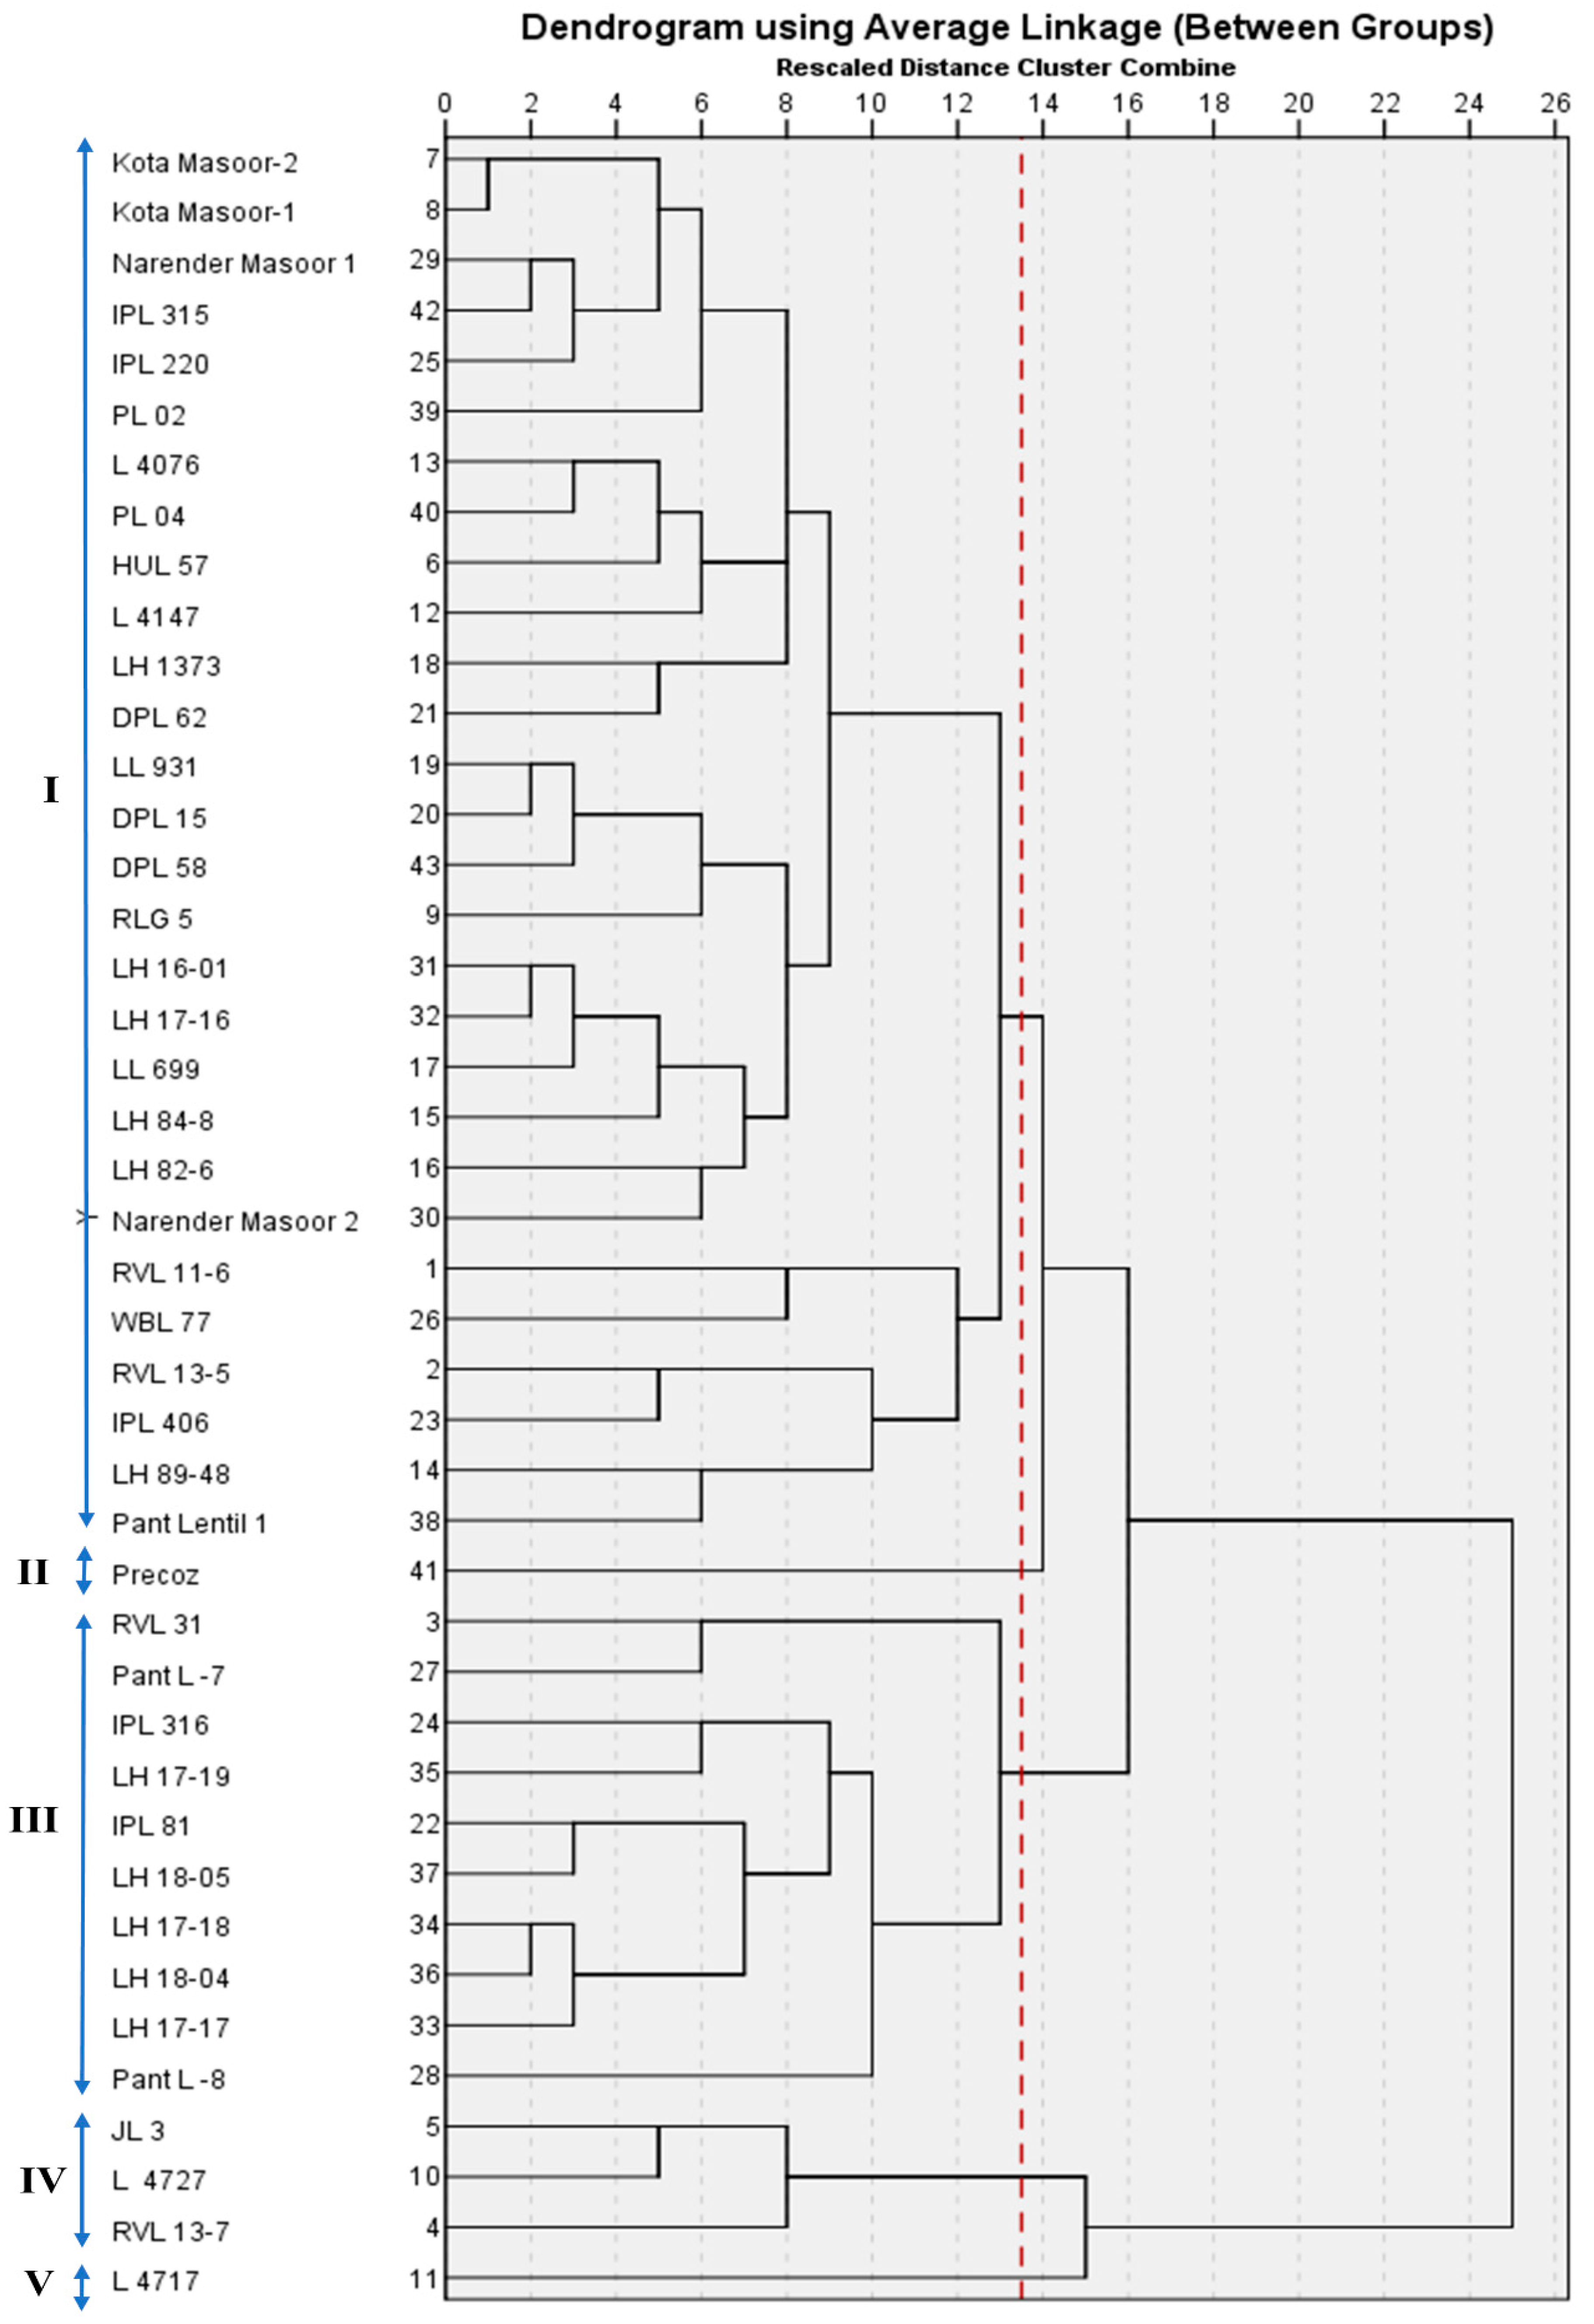
3.6. Cluster Analysis
4. Discussion
5. Conclusions
Supplementary Materials
Author Contributions
Funding
Data Availability Statement
Acknowledgments
Conflicts of Interest
References
- Cubero, J.I. Origin, domestication and evolution. In Lentils; Webb, C., Hawtin, G.C., Eds.; Commonwealth Agricultural Bureau: Slough, UK, 1981; pp. 15–38. [Google Scholar]
- Kumvanshi, S.M.; Shukla, K.C.; Valenkar, S.V.; Saraf, R.K. Crop modeling to sustain better crop harvest out of fluctuating climatic conditions of Sagar Region of Madhya Pradesh. In Proceedings of the National Conference on Biodiversity and Sustainable Utilization of Biological Resources, Sagar, Madhya Pradesh, India, 16–18 March 2001; pp. 193–197. [Google Scholar]
- Bhatty, R.S. Composition and Quality of Lentil (Lens culinaris Medik): A Review. Can. Inst. Food Sci. Technol. J. 1988, 21, 144–160. [Google Scholar] [CrossRef]
- Savage, G.P. The composition and nutritive value of Lentils (Lens culinaris). Nutr. Abstr. Rev. (Ser. A) 1988, 58, 320–343. [Google Scholar]
- Quinn, M.A. Biological nitrogen fixation and soil health improvement. In The Lentil: Botany, Production and Uses; Erskine, W., Muehlbauer, F.J., Ashutosh, S., Sharma, B., Eds.; CABI Publishing: Oxfordshire, UK, 2009; pp. 229–247. ISBN 9781845934873. [Google Scholar]
- Szczebyło, A.; Halicka, E.; Jackowska, M.; Rejman, K. Analysis of the Global Pulses Market and Programs Encouraging Consumption of This Food. Zesz. Nauk. SGGW W Warszawie—Probl. Rol. Światowego 2019, 19, 85–96. [Google Scholar] [CrossRef] [Green Version]
- FAOSTAT. 2019. Available online: https://www.fao.org/faostat/en/#home (accessed on 1 January 2022).
- INDIASTAT. 2020. Available online: https://www.indiastat.com/data/agriculture/agricultural-production (accessed on 1 January 2022).
- Kumar, J.; Gupta, S.; Dubey, S.; Gupta, P.; Sen Gupta, D.; Singh, N.P. Genetic diversity changes in Indian lentils over the times. J. Plant Biochem. Biotechnol. 2018, 27, 415–424. [Google Scholar] [CrossRef]
- Dikshit, H.K.; Singh, A.; Singh, D.; Aski, M.S.; Prakash, P.; Jain, N.; Meena, S.; Kumar, S.; Sarker, A. Genetic diversity in Lens species revealed by EST and genomic simple sequence repeat analysis. PLoS ONE 2015, 10, e0138101. [Google Scholar] [CrossRef] [Green Version]
- Kumar, S.; Gupta, S.; Chandra, S.; Singh, B.B. How wide is the Genetic Base of Pulse Crops? In Pulses in New Perspective; Ali, M., Singh, B.B., Kumar, S., Dhar, V., Eds.; ISPRD: Kanpur, India, 2004; pp. 188–210. [Google Scholar]
- Erskine, W. Lessons for breeders from land races of lentil. Euphytica 1997, 93, 107–112. [Google Scholar] [CrossRef]
- Erskine, W.; Chandra, S.; Chaudhry, M.; Malik, I.A.; Sarker, A.; Sharma, B.; Tufail, M.; Tyagi, M.C. A bottleneck in lentil: Widening its genetic base in South Asia. Euphytica 1998, 101, 207–211. [Google Scholar] [CrossRef]
- Neupane, S.; Dhakal, R.; Wright, D.M.; Shrestha, D.K.; Dhakal, B.; Bett, K.E. Strategic Identification of New Genetic Diversity to Expand Lentil (Lens culinaris Medik.) Production (Using Nepal as an Example). Agronomy 2021, 11, 1933. [Google Scholar] [CrossRef]
- Ferguson, M.E.; Robertson, L.D. Genetic diversity and taxonomic relationships within the genus Lens as revealed by allozyme polymorphism. Euphytica 1996, 91, 163–172. [Google Scholar] [CrossRef]
- Singh, M.; Bisht, I.S.; Kumar, S.; Dutta, M.; Bansal, K.C.; Karale, M.; Sarker, A.; Amri, A.; Kumar, S.; Datta, S.K. Global wild annual Lens collection: A potential resource for lentil genetic base broadening and yield enhancement. PLoS ONE 2014, 9, e107781. [Google Scholar] [CrossRef] [Green Version]
- Jing, R.; Vershinin, A.; Grzebyta, J.; Shaw, P.; Smkal, P.; Marshall, D.; Ambrose, M.J.; Ellis, T.N.; Flavell, A.J. The genetic diversity and evolution of field pea (Pisum) studied by high throughput retrotransposon based insertion polymorphism (RBIP) marker analysis. BMC Evol. Biol. 2010, 10, 44. [Google Scholar] [CrossRef] [PubMed] [Green Version]
- Sellami, M.H.; Pulvento, C.; Lavini, A. Selection of Suitable Genotypes of Lentil (Lens culinaris Medik.) under Rainfed Conditions in South Italy Using Multi-Trait Stability Index (MTSI). Agronomy 2021, 11, 1807. [Google Scholar] [CrossRef]
- Halluer, A.R.; Miranda, J.B. Quantitative Genetics in Maize Breeding, 2nd ed.; Iowa State University Press: Ames, IA, USA, 1988. [Google Scholar]
- Khichar, M.L.; Niwas, R. Practical Manual on Weather Measurement; Department of Agricultural Meteorology, CCS Haryana Agricultural University: Hisar, India, 2013. [Google Scholar]
- CCS HAU. Package of Practices for Crops of Haryana-Rabi; Chaudhary Charan Singh Haryana Agricultural University: Hisar, India, 2017; pp. 61–65. [Google Scholar]
- PPV & FRA. Guidelines for the Conduct of Test for Distinctiveness, Uniformity and Stability on Lentil (Lens culinaris Medik); Protection of Plant Varieties and Farmers’ Rights Authority (PPV & FRA), Government of India: New Delhi, India, 2007.
- Gaad, D.; Laouar, M.; Gaboun, F.; Abdelguerfi, A. Characterization of some algerians and foreign lentil accessions by qualitative traits. Hortic. Biotechnol. Res. 2018, 4, 43–47. [Google Scholar]
- Materne, M.; Siddique, K.H.M. Agroecology and Crop Adaptation. In The Lentil: Botany, Production and Uses; Erskine, W., Muehlbauer, F.J., Sarker, A., Sharma, B., Eds.; CABI Publishing: Oxfordshire, UK, 2009; pp. 47–63. [Google Scholar]
- Jawad, M.; Malik, S.R.; Sarwar, M.A.; Asadullah, M.; Hussain, I.; Khalid, R. Genetic Analysis of Lentil (Lens culinaris) Exotic Germplasm to Identify Genotypes Suitable for Mechanical Harvesting. Pakistan J. Agric. Res. 2019, 32, 152–158. [Google Scholar] [CrossRef]
- Pratap, A.; Kumar, J.; Kumar, S. Evaluation of wild species of lentil for agro-morphological traits. Legum. Res. 2014, 37, 11–18. [Google Scholar] [CrossRef]
- Choudhary, R.; Panwar, R.; Pandey, D.; Rakesh Choudhary, C.; Verma, S.; Chourasiya, V. Morphological characterization of lentil (Lens culinaris Medikus.) varieties based on six qualitative traits. J. Pharmacogn. Phytochem. 2017, 6, 1611–1615. [Google Scholar]
- Vollmann, J.; Grausgruber, H.; Ruckenbauer, P. Genetic variation for plant breeding. In Proceedings of the 17th EUCARPIA General Congress, Tulln, Austria, 8–11 September 2004. [Google Scholar]
- Sharma, S.R.; Singh, S.; Gill, R.K.; Kumar, R.; Parihar, A.K. Selection of promising genotypes of lentil (Lens culinaris Medik.) by deciphering genetic diversity and trait association. Legum. Res. 2020, 43, 764–769. [Google Scholar] [CrossRef]
- Bustos-Korts, D.; Romagosa, I.; Borràs-Gelonch, G.; Casas, A.M.; Slafer, G.A.; Van Eeuwijk, F. Genotype by environment interaction and adaptation. In Encyclopedia of Sustainability Science and Technology; Savin, R., Slafer, G.A., Eds.; Springer: New York, NY, USA, 2018; pp. 29–71. [Google Scholar]
- Nath, U.K.; Rani, S.; Paul, M.R.; Alam, M.N.; Horneburg, B. Selection of superior lentil (Lens esculenta M.) genotypes by assessing character association and genetic diversity. Sci. World J. 2014, 2014, 372405. [Google Scholar] [CrossRef] [Green Version]
- Gerrano, A.S.; Jansen van Rensburg, W.S.; Mathew, I.; Shayanowako, A.I.T.; Bairu, M.W.; Venter, S.L.; Swart, W.; Mofokeng, A.; Mellem, J.; Labuschagne, M. Genotype and genotype × environment interaction effects on the grain yield performance of cowpea genotypes in dryland farming system in South Africa. Euphytica 2020, 216, 80. [Google Scholar] [CrossRef]
- Vales, M.I.; Srivastava, R.K.; Sultana, R.; Singh, S.; Singh, I.; Singh, G.; Patil, S.B.; Saxena, K.B. Breeding for Earliness in Pigeonpea: Development of New Determinate and Nondeterminate Lines. Crop Sci. 2012, 52, 2507–2516. [Google Scholar] [CrossRef] [Green Version]
- Summerfield, R.J.; Muehlbauer, F.J.; Short, R.W. Controlled environments as an adjunct to field research on lentils (Lens culinaris). V. Cultivar responses to above- and below-average temperatures during the reproductive period. Exp. Agric. 1989, 25, 327–341. [Google Scholar] [CrossRef]
- Saxena, M.C.; Hawtin, G.C. Morphology and growth patterns. In Lentils; Webb, C., Hawtin, G.C., Eds.; Food and Agriculture Organization: Slough, UK, 1981; pp. 39–52. [Google Scholar]
- Farooq, M.; Wahid, A.; Kobayashi, N.; Fujita, D.; Basra, S.M.A. Plant drought stress: Effects, mechanisms and management. In Sustainable Agriculture; Springer: Dordrecht, The Netherlands, 2009; pp. 153–188. ISBN 9789048126651. [Google Scholar]
- Pushpavalli, R.; Zaman-Allah, M.; Turner, N.C.; Baddam, R.; Rao, M.V.; Vadez, V. Higher flower and seed number leads to higher yield under water stress conditions imposed during reproduction in chickpea. Funct. Plant Biol. 2015, 42, 162–174. [Google Scholar] [CrossRef] [PubMed]
- Shrestha, R.; Turner, N.C.; Siddique, K.H.M.; Turner, D.W. Physiological and seed yield responses to water deficits among lentil genotypes from diverse origins. Aust. J. Agric. Res. 2006, 57, 903–915. [Google Scholar] [CrossRef]
- Sehgal, A.; Sita, K.; Bhandari, K.; Kumar, S.; Kumar, J.; Vara Prasad, P.V.; Siddique, K.H.M.; Nayyar, H. Influence of drought and heat stress, applied independently or in combination during seed development, on qualitative and quantitative aspects of seeds of lentil (Lens culinaris Medikus) genotypes, differing in drought sensitivity. Plant Cell Environ. 2019, 42, 198–211. [Google Scholar] [CrossRef] [Green Version]
- Ahmadikhah, A.; Nasrollanejad, S.; Alishah, O. Quantitative studies for investigating variation and its effect on heterosis of rice. Int. J. Plant Prod. 2008, 2, 297–307. [Google Scholar] [CrossRef]
- Egli, D.B. Seed Biology and the Yield of Grain Crops; CAB International: Wallingford, UK, 1998. [Google Scholar]
- Kumar, A.; Gill, R.K.; Singh, M. Genetic variability and association analysis for various agro morphological traits in lentil (Lens culinaris m.). Legum. Res. 2020, 43, 776–779. [Google Scholar] [CrossRef]
- Kumar, P.; Vimal, S.C.; Kumar, A. Study of simple correlation coefficients for yield and its component traits in lentil (Lens culinaris Medik.). Int. J. Curr. Microbiol. Appl. Sci. 2017, 6, 3260–3265. [Google Scholar]
- Al-Aysh, F.M. Genetic variability, correlation and path coefficient analysis of yield and some yield components in landraces of lentil (Lens culinaris Medik.). Jordan J. Agric. Sci. 2014, 10, 737–750. [Google Scholar] [CrossRef]
- Kumar, J.; Srivatava, E. Impact of reproductive duration on yield and its component traits in lentil. Legum. Res. 2015, 38, 139–148. [Google Scholar] [CrossRef]
- Kumari, V.V.; Roy, A.; Vijayan, R.; Banerjee, P.; Verma, V.C.; Nalia, A.; Pramanik, M.; Mukherjee, B.; Ghosh, A.; Reja, M.H.; et al. Drought and heat stress in cool-season food legumes in sub-tropical regions: Consequences, adaptation, and mitigation strategies. Plants 2021, 10, 1038. [Google Scholar] [CrossRef]
- Singh, P.; Pandey, A. Correlation between different traits of aromatic rice (Oryza sativa L.) and their cause-effect relationship. Appl. Biol. Res. 2012, 14, 47–53. [Google Scholar]
- Bilal, M.; Jamil, M.; Ali, A.; Ilyas, M.K.; Ghafoor, A. Multivariate analysis of genetic diversity in lentil (Lens culinaris) Germplasm. Fresenius Environ. Bull. 2018, 27, 2151–2159. [Google Scholar]
- Maurya, K.S.; Kumar, S.; Choudhary, A.M.; Singh, V.; Chauhan, M.P. Diversity analysis in lentil (Lens culinaris Medik.). J. Pharmacogn. Phytochem. 2018, 7, 1958–1961. [Google Scholar]


| S.No. | Genotype | Pedigree | Type of Material | Source/Origin |
|---|---|---|---|---|
| 1 | RVL 11-6 | JL 3 × DPL 62 | Cultivar | RVSKVV, Sehore |
| 2 | RVL 13-5 | JL 3 × DPL 62 | Cultivar | RVSKVV, Sehore |
| 3 | RVL 31 | Local selection from Shajapur, MP | Cultivar | RVSKVV, Sehore |
| 4 | RVL 13-7 | JL 1 × Black Masra | Cultivar | RVSKVV, Sehore |
| 5 | JL 3 | Land race selection from Sagar, MP | Cultivar | JNKVV, Jabalpur |
| 6 | HUL 57 | Mutant of HUL 11 | Cultivar | BHU, Varanasi |
| 7 | Kota Masoor-2 | LL 1049 × RKL 11 | Cultivar | AUK, Rajasthan |
| 8 | Kota Masoor-1 | KLB 339 × SL 94-09 | Cultivar | AUK, Rajasthan |
| 9 | RLG 5 | Selection from local germplasm | Cultivar | RARI, Durgapura |
| 10 | L 4727 | Sehore 74-3 × Precoz | Cultivar | IARI, New Delhi |
| 11 | L 4717 | ILL 7617 × 91516 | Cultivar | IARI, New Delhi |
| 12 | L 4147 | (L 3875 × P4) × PKVL 1 | Cultivar | IARI, New Delhi |
| 13 | L 4076 | PL 234 × PL 639 | Cultivar | IARI, New Delhi |
| 14 | LH 89-48 (HM-1) | K 75 × L 4076 | Cultivar | CCS HAU, Hisar |
| 15 | LH 84-8 (Sapna) | L9-12 × JLS-2 | Cultivar | CCS HAU, Hisar |
| 16 | LH 82-6 (Garima) | Pusa 2 × No.- 4 | Cultivar | CCS HAU, Hisar |
| 17 | LL 699 | PL 639 × PL 77-2 | Cultivar | PAU, Ludhiana |
| 18 | LL 1373 | IPL 406 × FLIP 2004-7L | Cultivar | PAU, Ludhiana |
| 19 | LL 931 | LH 90-103 × LL 608 | Cultivar | PAU, Ludhiana |
| 20 | DPL 15 | PL 406 × L 4076 | Cultivar | IIPR, Kanpur |
| 21 | DPL 62 | JLS 1 × LG 171 | Cultivar | IIPR, Kanpur |
| 22 | IPL 81 | K 75 × PL 639 | Cultivar | IIPR, Kanpur |
| 23 | IPL 406 | DPL 35 × EC 157634/382 | Cultivar | IIPR, Kanpur |
| 24 | IPL 316 | Sehore 74-3 × DPL 58 | Cultivar | IIPR, Kanpur |
| 25 | IPL 220 | (DPL 44 × DPL 62) × DPL 58 | Cultivar | IIPR, Kanpur |
| 26 | WBL 77 | ILL 7723 × BL × 84176 | Cultivar | Berhampore, WB |
| 27 | Pant L 7 | L-4076 × DPL 15 | Cultivar | GBPUA&T, Pantnagar |
| 28 | Pant L 8 | DPL 59 × IPL 105 | Cultivar | GBPUA&T, Pantnagar |
| 29 | Narender Masoor 1 | Precoz × PL 406 | Cultivar | NDUAT, Faizabad |
| 30 | Narender Masoor 2 | Variety identified at AICRP’s workshop | Cultivar | NDUAT, Faizabad |
| 31 | LH 16-01 | Selection from RKL 605-3 | Breeding line | CCS HAU, Hisar |
| 32 | LH 17-16 | LH 07-26 × PL 01 | Breeding line | CCS HAU, Hisar |
| 33 | LH 17-17 | LH 07-26 × PL 01 | Breeding line | CCS HAU, Hisar |
| 34 | LH 17-18 | LH 07-26 × PL 01 | Breeding line | CCS HAU, Hisar |
| 35 | LH 17-19 | LH 07-26 × PL 01 | Breeding line | CCS HAU, Hisar |
| 36 | LH 18-04 | LH 07-26 × PL 01 | Breeding line | CCS HAU, Hisar |
| 37 | LH 18-05 | LH 07-26 × PL 01 | Breeding line | CCS HAU, Hisar |
| 38 | Pant Lentil 01 | PL 04 × DPL 55 | Breeding line | GBPUA&T, Pantnagar |
| 39 | PL 02 | PL 04 × DPL 55 | Cultivar | GBPUA&T, Pantnagar |
| 40 | PL 04 | UPL 175 × (PL 184 × P 288) | Cultivar | GBPUA&T, Pantnagar |
| 41 | Precoz | Argentina cultivar | Cultivar | ICARDA, Syria |
| 42 | IPL 315 | PL 4 × DPL 62 | Cultivar | IIPR, Kanpur |
| 43 | DPL 58 | PL 639 × Precoz | Breeding line | IIPR, Kanpur |
| Traits | Code | Description |
|---|---|---|
| Qualitative Traits | ||
| Foliage: Intensity of green colour | FGC | 1 = light, 2 = medium, 3 = dark |
| Stem: Anthocyanin colouration | SAC | 1 = absent, 9 = present |
| Time of flowering | TF | 3 = early (<60 days), 5 = medium (60–80 days), 7 = late (>80 days) |
| Leaf: Pubescence | LP | 1 = absent, 9 = present |
| Leaflet: Size | LS | 3 = small, 5 = medium, 7 = large |
| Plant: Growth habit | PGH | 1 = erect (compact), 3 = semi-erect, 5 = horizontal (spreading) |
| Flower: Colour of standard | FSC | 1 = white, 2 = pink, 3 = blue, 4 = violet |
| Tallness | TL | 3 = short (<40 cm), 5 = medium (40–60 cm), 7 = long (>60 cm) |
| Pod: Anthocyanin colouration | PAC | 1 = absent, 9 = present |
| Seed: Size | SS | 3 = small (<2 g), 5 = medium (2.0–2.5 g), 7 = large (2.51–3.0 g), 9 = very large (>3.0 g) |
| Seed: Testa colour | STC | 1 = green, 2 = grey, 3 = pink, 4 = brown, 5 = black |
| Seed: Testa mottling | STM | 1 = absent, 3 = present |
| Cotyledon: Colour | CC | 1 = yellow, 2 = olive green, 3 = orange |
| Quantitative Traits | ||
| Days to 50% flowering | DTF | Number of days from sowing to stage when 50% plants in the plot had at least one fully opened flower |
| Days to maturity | DTM | Number of days from sowing until when 75% of the plants in a plot had reached physiological maturity |
| Plant height (cm) | PH | Height of five randomly selected and tagged plants in cm from ground level to the tip of the plant. |
| Number of pods per plant | NPP | The average number of fully matured seed-bearing pods from five randomly selected and tagged plants |
| Number of primary branches | NPB | The average number of branches shooting out of base from five randomly selected and tagged plants |
| Number of fruiting branches | NFB | The average number of branches bearing fully matured pods from five randomly selected and tagged plants |
| Seeds per pod | SP | The average number of seed per pods taken from 10 randomly selected and tagged pods |
| 100-seed weight | HSW | Weight of a random sample of 100 seeds |
| Biological yield per plot (kg) | BY | Weight of the total dry biomass produced above ground |
| Harvest index (%) | HI | Ratio of seed yield to total dry biomass |
| Seed yield per plot (kg) | SY | Weight of seed harvested in a plot |
| Trait | State | Frequency (%) | DF | Chi-Sqaure | Genotypes |
|---|---|---|---|---|---|
| Foliage: Intensity of green colour | Light | 25.6 | 2 | 21.256 *** | RVL 31, RVL 13-7, JL 3, L 4727, LL 1373, DPL 62, WBL 77, LH 18-05, Pant Lentil 1, PL 02, Precoz |
| Medium | 65.1 | RVL 11-6, RVL 13-5, HUL 57, Kota Masoor-2, Kota Masoor-1, RLG 5, L 4717, L 4076, LH 84-8, LL 699, LL 931, DPL 15, IPL 81, IPL 316, IPL 220, Pant L -7, Pant L -8, Narender Masoor 1, Narender Masoor 2, LH 16-01, LH 17-16, LH 17-17, LH 17-18, LH 17-19, LH 18-04, PL 04, IPL 315, DPL 58 | |||
| Dark | 9.3 | L 4147, LH 89-48, LH 82-6, IPL 406 | |||
| Stem: Anthocyanin colouration | Absent | 83.7 | 1 | 19.558 *** | RVL 11-6, RVL 31, RVL 13-7, JL 3, HUL 57, Kota Masoor-2, RLG 5, L 4727, L 4717, L 4147, L 4076, LH 89-48, LH 84-8, LH 82-6, LL 699, LL 1373, LL 931, DPL 15, DPL 62, IPL 81, IPL 406, IPL 316, WBL 77, Narender Masoor 2, LH 16-01, LH 17-16, LH 17-17, LH 17-18, LH 17-19, LH 18-04, LH 18-05, Pant Lentil 1, PL 02, PL 04, Precoz, DPL 58 |
| Present | 16.3 | RVL 13-5, Kota Masoor-1, IPL 220, Pant L -7, Pant L -8, Narender Masoor 1, IPL 315 | |||
| Time of flowering | Medium (60–80 days) | 41.9 | 1 | 1.140 | RVL 11-6, RVL 13-5, RVL 31, RVL 13-7, JL 3, HUL 57, Kota Masoor-2, Kota Masoor-1, RLG 5, L 4727, L 4717, DPL 15, DPL 62, IPL 220, WBL 77, Pant L -7, Pant Lentil 1, PL 02 |
| Late (>80 days) | 58.1 | L 4147, L 4076, LH 89-48, LH 84-8, LH 82-6, LL 699, LL 1373, LL 931, IPL 81, IPL 406, IPL 316, Pant L -8, Narender Masoor 1, Narender Masoor 2, LH 16-01, LH 17-16, LH 17-17, LH 17-18, LH 17-19, LH 18-04, LH 18-05, PL 04, Precoz, IPL 315, DPL 58 | |||
| Leaflet: Size | Small | 14 | 2 | 13.163 ** | RVL 31, RVL 13-7, IPL 220, Pant L -8, Pant Lentil 1, PL 04 |
| Medium | 58.1 | RVL 11-6, RVL 13-5, JL 3, RLG 5, L 4727, L 4717, L 4147, LH 89-48, LL 699, DPL 15, DPL 62, IPL 81, IPL 316, WBL 77, Pant L -7, Narender Masoor 1, Narender Masoor 2, LH 16-01, LH 17-18, LH 17-19, LH 18-05, PL 02, Precoz, IPL 315, DPL 58 | |||
| Large | 27.9 | HUL 57, Kota Masoor-2, Kota Masoor-1, L 4076, LH 84-8, LH 82-6, LL 1373, LL 931, IPL 406, LH 17-16, LH 17-17, LH 18-04 | |||
| Plant: Growth habit | Erect (<30°) | 23.3 | 1 | 12.302 *** | RVL 13-7, RLG 5, L 4717, L 4147, LH 89-48, LL 699, Pant L -8, LH 17-16, LH 18-04, IPL 315 |
| Semi- erect (30°–60°) | 76.9 | RVL 11-6, RVL 13-5, RVL 31, JL 3, HUL 57, Kota Masoor-2, Kota Masoor-1, L 4727, L 4076, LH 84-8, LH 82-6, LL 1373, LL 931, DPL 15, DPL 62, IPL 81, IPL 406, IPL 316, IPL 220, WBL 77, Pant L -7, Narender Masoor 1, Narender Masoor 2, LH 16-01, LH 17-17, LH 17-18, LH 17-19, LH 18-05, Pant Lentil 1, PL 02, PL 04, Precoz, DPL 58 | |||
| Flower: Colour of standard | Violet | 90.7 | 1 | 28.488 *** | RVL 11-6, RVL 31, RVL 13-7, JL 3, HUL 57, Kota Masoor-2, Kota Masoor-1, RLG 5, L 4727, L 4717, L 4147, L 4076, LH 89-48, LH 84-8, LH 82-6, LL 699, RVL 13-5, LL 1373, IPL 406, LL 931, DPL 15, DPL 62, IPL 81, IPL 316, IPL 220, Pant L -7, Pant L -8, Narender Masoor 1, Narender Masoor 2, LH 16-01, LH 17-16, LH 17-17, LH 17-18, LH 17-19, LH 18-04, LH 18-05, PL 04, IPL 315, DPL 58 |
| White | 9.3 | PL 02, WBL 77, Pant Lentil 1, Precoz | |||
| Tallness | Short (<40 cm) | 20.9 | 1 | 14.535 *** | RVL 31, RVL 13-7, JL 3, L 4717, L 4147, Narender Masoor 1, Pant Lentil 1, PL 02, Precoz |
| Medium (40–60 cm) | 79.1 | RVL 11-6, RVL 13-5, HUL 57, Kota Masoor-2, Kota Masoor-1, RLG 5, L 4727, L 4076, LH 89-48, LH 84-8, LH 82-6, LL 699, LL 1373, LL 931, DPL 15, DPL 62, IPL 81, IPL 406, IPL 316, IPL 220, WBL 77, Pant L -7, Pant L -8, Narender Masoor 2, LH 16-01, LH 17-16, LH 17-17, LH 17-18, LH 17-19, LH 18-04, LH 18-05, PL 04, IPL 315, DPL 58 | |||
| Seed: Size | Small (<2.0 g) | 18.6 | 3 | 10.116 * | HUL 57, L 4717, L 4147, LH 89-48, IPL 220, WBL 77, Pant L -8, Narender Masoor 2 |
| Medium (2.0–2.5 g) | 44.2 | RVL 11-6, RVL 31, RVL 13-7, JL 3, Kota Masoor-2, Kota Masoor-1, L 4727, LH 84-8, LL 699, Narend-er Masoor 1, LH 16-01, LH 17-16, LH 17-17, LH 18-04, LH 18-05, Pant Lentil 1, PL 02, PL 04, IPL 315 | |||
| Large (2.6–3.0 g) | 25.6 | RLG 5, L 4076, LH 82-6, LL 931, DPL 15, IPL 81, IPL 316, Pant L -7, LH 17-18, LH 17-19, DPL 58 | |||
| Very large (>3.0 g) | 11.6 | RVL 13-5, LL 1373, DPL 62, IPL 406, Precoz | |||
| Seed: Testa colour | Green | 9.3 | 4 | 31.767 *** | IPL 406, Pant Lentil 1, PL 02, Precoz |
| Grey | 44.2 | RVL 31, Kota Masoor-1, RLG 5, L 4727, L 4717, L 4147, L 4076, DPL 62, IPL 220, WBL 77, Pant L -7, LH 16-01, LH 17-16, LH 17-17, LH 17-18, LH 17-19, LH 18-04, IPL 315, DPL 58 | |||
| Pink | 7.0 | RVL 13-5, LH 1373, PL 04 | |||
| Brown | 37.2 | RVL 11-6, JL 3, HUL 57, Kota Masoor-2, LH 89-48, LH 84-8, LH 82-6, LL 699, LL 931, DPL 15, IPL 81, IPL 316, Pant L -8, Narender Masoor 1, Narender Masoor 2, LH 18-05 | |||
| Black | 2.3 | RVL 13-7 | |||
| Seed: Testa mottling | Present | 83.7 | 1 | 19.558 *** | RVL 11-6, RVL 31, RVL 13-7, JL 3, HUL 57, Kota Masoor-2, Kota Masoor-1, RLG 5, L 4727, L 4717, L 4147, L 4076, LH 89-48, LH 84-8, LH 82-6, LL 699, LL 931, DPL 15, DPL 62, IPL 81, IPL 316, IPL 220, WBL 77, Pant L -7, Pant L -8, Narender Masoor 1, Narender Masoor 2, LH 16-01, LH 17-16, LH 17-17, LH 17-18, LH 17-19, LH 18-04, LH 18-05, IPL 315, DPL 58 |
| Absent | 16.3 | RVL 13-5, LL 1373, IPL 406, Pant Lentil 1, PL 02, PL 04, Precoz | |||
| Cotyledon: Colour | Olive green | 7.0 | 1 | 31.837 *** | Pant Lentil 1, PL 02, Precoz |
| Orange | 93.0 | RVL 11-6, RVL 13-5, RVL 31, RVL 13-7, JL 3, HUL 57, Kota Masoor-2, Kota Masoor-1, RLG 5, L 4727, L 4717, L 4147, L 4076, LH 89-48, LH 84-8, LH 82-6, LL 699, LL 1373, LL 931, DPL 15, DPL 62, IPL 81, IPL 406, IPL 316, IPL 220, WBL 77, Pant L -7, Pant L -8, Narender Masoor 1, Narender Masoor 2, LH 16-01, LH 17-16, LH 17-17, LH 17-18, LH 17-19, LH 18-04, LH 18-05, PL 04, IPL 315, DPL 58 |
| Source of Variation | DF | DTF | DTM | PH | NPP | NPB | NFB | SP | HSW | BY | HI | SY |
|---|---|---|---|---|---|---|---|---|---|---|---|---|
| Season | 1 | 1138.62 *** | 8104.33 *** | 1635.08 *** | 253.02 ns | 0.92 *** | 1634.58 *** | 0.07 * | 4,912,248.06 ns | 113.34 *** | 5858.33 *** | 1.15 *** |
| Replication | 2 | 7.41 * | 22.96 *** | 3.93ns | 39.51 ns | 0.07 ns | 3.13 ns | 0.03 ns | 0.04 ns | 0.99 ** | 32.66 ns | 0.07 ** |
| Genotype | 42 | 62.46 *** | 63.64 *** | 216.71 *** | 1037.55 *** | 0.43 *** | 25.49 *** | 0.19 *** | 1.15 *** | 1.52 *** | 84.06 *** | 0.19 *** |
| Genotype × Season | 42 | 7.78 *** | 35.19 *** | 68.99 *** | 712.40 *** | 0.32 *** | 14.49 *** | 0.01 ns | 0.09 *** | 0.40 *** | 42.35 *** | 0.08 *** |
| Error | 170 | 1.57 | 2.73 | 7.44 | 85.62 | 0.05 | 3 | 0.01 | 0.03 | 0.13 | 12.7 | 0.01 |
| Genotype | DTF | Genotype | DTM | Genotype | PH | Genotype | NPP | ||||||||
|---|---|---|---|---|---|---|---|---|---|---|---|---|---|---|---|
| Y1 | Y2 | Mean | Y1 | Y2 | Mean | Y1 | Y2 | Mean | Y1 | Y2 | Mean | ||||
| Top Ten Genotypes | |||||||||||||||
| WBL 77 | 75.3 | 70.7 | 73 | L 4717 | 116.0 | 108.7 | 112.3 | RLG 5 | 50.5 | 56.7 | 53.6 | LH 17-19 | 123.1 | 157.1 | 140.1 |
| L 4717 | 78.3 | 70.3 | 74.3 | L 4727 | 122.3 | 112.0 | 117.1 | LH 18-05 | 54.1 | 50.5 | 52.4 | IPL 316 | 144.2 | 135.5 | 139.9 |
| Kota Masoor-2 | 76.3 | 73.0 | 74.7 | RVL 11-6 | 122.3 | 116.3 | 119.3 | LH 82-6 | 48.3 | 55.8 | 52.1 | Pant L -8 | 136.4 | 127.0 | 131.7 |
| IPL 220 | 78.3 | 71.7 | 75 | RVL 31 | 120.7 | 118.3 | 119.5 | IPL 81 | 58.5 | 45.5 | 52.0 | Pant L -7 | 118.9 | 143.3 | 131.1 |
| JL 3 | 76.0 | 74.0 | 75 | WBL 77 | 123.7 | 116.0 | 119.8 | LH 17-19 | 53.0 | 49.1 | 51.1 | LH 17-17 | 125.4 | 133.5 | 129.5 |
| RVL 31 | 76.7 | 74.0 | 75.3 | RVL 13-7 | 119.3 | 121.0 | 120.1 | LH 17-17 | 57.5 | 44.1 | 50.8 | LH 17-18 | 113.8 | 141.3 | 127.6 |
| RVL 13-7 | 77.0 | 74.3 | 75.7 | JL 3 | 121.7 | 119.7 | 120.7 | LH 18-04 | 50.2 | 50.4 | 50.3 | IPL 81 | 126.2 | 128.2 | 127.2 |
| Kota Masoor-1 | 77.7 | 74.0 | 75.8 | Pant L -7 | 127.3 | 114.7 | 121 | LH 84-8 | 52.3 | 47.6 | 49.9 | LH 18-04 | 128.5 | 125.8 | 127.1 |
| L 4727 | 79.0 | 72.7 | 75.8 | PL 04 | 125.3 | 117.7 | 121.5 | RVL 13-5 | 53.1 | 46.1 | 49.7 | LH 18-05 | 119.9 | 131.4 | 125.7 |
| Pant L -7 | 78.0 | 73.7 | 75.8 | Precoz | 127.7 | 117.7 | 122.7 | IPL 406 | 55.9 | 42.1 | 49.1 | RVL 31 | 105.5 | 140.9 | 123.2 |
| Bottom Five Genotypes | |||||||||||||||
| LH 17-16 | 85.7 | 80.0 | 82.83 | LH 17-17 | 135.7 | 119.0 | 127.3 | Narender Masoor 1 | 39.5 | 37.5 | 38.5 | Pant Lentil 1 | 108.6 | 81.9 | 95.3 |
| LH 82-6 | 84.7 | 83.7 | 84.17 | LL 931 | 134.0 | 121.0 | 127.5 | JL 3 | 39.2 | 33.3 | 36.3 | JL 3 | 105.0 | 75.5 | 90.3 |
| L 4147 | 85.3 | 84.0 | 84.67 | IPL 81 | 134.3 | 121.0 | 127.7 | Precoz | 30.7 | 29.0 | 29.87 | L 4717 | 98.9 | 79.6 | 89.3 |
| LL 699 | 86.7 | 84.3 | 85.5 | PL 02 | 134.3 | 121.3 | 127.8 | RVL 13-7 | 32.7 | 25.4 | 29.03 | L 4727 | 91.8 | 85.6 | 88.7 |
| Pant L -8 | 86.0 | 85.0 | 85.5 | DPL 15 | 135.3 | 121.0 | 128.1 | L 4717 | 32.1 | 23.2 | 27.67 | RVL 13-7 | 95.8 | 71.2 | 83.5 |
| Mean | 81.1 | 76.9 | 79.0 | Mean | 129.9 | 118.7 | 124.3 | Mean | 46.5 | 41.4 | 44.0 | Mean | 114.3 | 112.3 | 113.3 |
| STD | 3.46 | 3.64 | 4.12 | STD | 5.23 | 3.00 | 7.05 | STD | 7.02 | 7.38 | 7.62 | STD | 15.45 | 21.21 | 18.54 |
| SE (m) | 0.30 | 0.32 | 0.26 | SE (m) | 0.46 | 0.26 | 0.44 | SE (m) | 0.62 | 0.65 | 0.47 | SE (m) | 1.36 | 1.87 | 1.15 |
| CV (%) | 4.3 | 4.7 | 5.2 | CV (%) | 4.0 | 2.5 | 5.7 | CV (%) | 15.1 | 17.8 | 17.3 | CV (%) | 13.5 | 18.9 | 16.4 |
| Genotype | NPB | Genotype | NFB | Genotype | SP | Genotype | HSW | ||||||||
|---|---|---|---|---|---|---|---|---|---|---|---|---|---|---|---|
| Y1 | Y2 | Mean | Y1 | Y2 | Mean | Y1 | Y2 | Mean | Y1 | Y2 | Mean | ||||
| Top Ten Genotypes | |||||||||||||||
| DPL 58 | 3.87 | 3.20 | 3.53 | LL 1373 | 25.9 | 15.2 | 20.6 | HUL 57 | 1.90 | 1.97 | 1.93 | LL 1373 | 3.54 | 3.47 | 3.50 |
| LH 17-19 | 3.40 | 3.67 | 3.53 | DPL 62 | 22.4 | 17.8 | 20.1 | Narender Masoor 2 | 1.87 | 1.97 | 1.92 | Precoz | 3.34 | 3.44 | 3.39 |
| LH 18-04 | 3.73 | 3.20 | 3.47 | HUL 57 | 21.9 | 16.7 | 19.3 | IPL 81 | 1.90 | 1.87 | 1.88 | IPL 406 | 3.48 | 3.11 | 3.30 |
| RVL 11-6 | 3.87 | 2.87 | 3.37 | LH 84-8 | 22.3 | 14.2 | 18.3 | LH 17-16 | 1.93 | 1.83 | 1.88 | DPL 62 | 3.23 | 3.03 | 3.13 |
| LL 699 | 3.07 | 3.53 | 3.3 | IPL 81 | 22.7 | 13.8 | 18.2 | Pant L -8 | 1.83 | 1.87 | 1.85 | RVL 13-5 | 3.20 | 2.90 | 3.05 |
| Kota Masoor-2 | 3.67 | 2.87 | 3.27 | L 4147 | 21.7 | 14.5 | 18.2 | LH 17-19 | 1.83 | 1.87 | 1.85 | Pant L -7 | 2.67 | 2.93 | 2.80 |
| L 4147 | 3.20 | 3.13 | 3.17 | IPL 316 | 18.7 | 17.3 | 18.0 | WBL 77 | 1.83 | 1.87 | 1.85 | DPL 58 | 2.76 | 2.72 | 2.74 |
| LH 17-17 | 2.93 | 3.33 | 3.13 | LH 16-01 | 20.6 | 15.1 | 17.9 | L 4147 | 1.83 | 1.83 | 1.83 | DPL 15 | 2.79 | 2.64 | 2.72 |
| IPL 220 | 3.33 | 2.87 | 3.1 | Pant L -8 | 23.7 | 11.9 | 17.8 | LL 931 | 1.80 | 1.87 | 1.83 | LL 931 | 2.81 | 2.55 | 2.68 |
| IPL 316 | 2.93 | 3.20 | 3.07 | LH 18-05 | 19.3 | 15.6 | 17.5 | RVL 11-6 | 1.73 | 1.87 | 1.8 | LH 82-6 | 2.83 | 2.52 | 2.67 |
| Bottom Five Genotypes | |||||||||||||||
| LL 931 | 2.47 | 2.67 | 2.57 | IPL 406 | 16.1 | 10.8 | 13.5 | LH 17-18 | 1.40 | 1.43 | 1.42 | L 4717 | 1.68 | 1.91 | 1.79 |
| LL 1373 | 2.40 | 2.67 | 2.53 | Pant Lentil 1 | 14.2 | 11.0 | 12.6 | RVL 13-7 | 1.40 | 1.23 | 1.32 | IPL 220 | 1.80 | 1.65 | 1.73 |
| L 4727 | 2.40 | 2.67 | 2.53 | Precoz | 11.9 | 12.3 | 12.1 | LH 17-17 | 1.33 | 1.27 | 1.3 | L 4147 | 1.69 | 1.75 | 1.72 |
| RVL 13-7 | 2.60 | 2.47 | 2.53 | LH 89-48 | 13.8 | 10.0 | 11.9 | IPL 406 | 1.23 | 1.33 | 1.28 | Narender Masoor 2 | 1.70 | 1.73 | 1.71 |
| PL 02 | 2.27 | 2.47 | 2.37 | L 4717 | 12.5 | 10.0 | 11.3 | Pant L -7 | 1.23 | 1.27 | 1.25 | Pant L -8 | 1.74 | 1.67 | 1.7 |
| Mean | 2.99 | 2.87 | 2.93 | Mean | 18.4 | 13.4 | 15.9 | Mean | 1.62 | 1.65 | 1.64 | Mean | 2.46 | 2.46 | 2.46 |
| STD | 0.45 | 0.35 | 0.40 | STD | 3.37 | 2.41 | 3.86 | STD | 0.20 | 0.20 | 0.20 | STD | 0.50 | 0.52 | 0.47 |
| SE (m) | 0.04 | 0.03 | 0.03 | SE (m) | 0.30 | 0.21 | 0.24 | SE (m) | 0.02 | 0.02 | 0.01 | SE (m) | 0.04 | 0.05 | 0.03 |
| CV (%) | 14.9 | 12.2 | 13.8 | CV (%) | 18.3 | 18.0 | 24.3 | CV (%) | 12.6 | 12.2 | 12.4 | CV (%) | 20.1 | 21.1 | 19.1 |
| Genotype | BY | Genotype | HI | Genotype | SY | ||||||
|---|---|---|---|---|---|---|---|---|---|---|---|
| Y1 | Y2 | Mean | Y1 | Y2 | Mean | Y1 | Y2 | Mean | |||
| Top Ten Genotypes | |||||||||||
| LL 931 | 4.740 | 3.450 | 4.096 | L 4717 | 45.4 | 43.1 | 44.2 | IPL 316 | 1.429 | 1.316 | 1.373 |
| DPL 15 | 5.237 | 2.756 | 3.996 | LH 18-04 | 38.1 | 48.9 | 43.5 | LH 18-04 | 1.410 | 1.283 | 1.347 |
| IPL 316 | 4.757 | 3.187 | 3.972 | LH 17-19 | 33.8 | 47.0 | 40.4 | LH 17-19 | 1.297 | 1.304 | 1.301 |
| DPL 62 | 4.683 | 3.186 | 3.935 | Kota Masoor-2 | 36.4 | 43.7 | 40.0 | LL 699 | 1.293 | 1.294 | 1.294 |
| IPL 81 | 4.977 | 2.831 | 3.905 | LH 17-18 | 33.2 | 46.4 | 39.8 | LH 84-8 | 1.337 | 1.243 | 1.290 |
| L 4147 | 4.447 | 3.264 | 3.855 | WBL 77 | 38.0 | 39.4 | 38.7 | LH 82-6 | 1.298 | 1.261 | 1.280 |
| LH 82-6 | 4.387 | 3.197 | 3.79 | LH 17-17 | 34.4 | 41.7 | 38.1 | Kota Masoor-2 | 1.521 | 0.966 | 1.244 |
| RLG 5 | 4.163 | 3.115 | 3.638 | Pant L -7 | 33.0 | 42.3 | 37.6 | Pant L -8 | 1.292 | 1.192 | 1.242 |
| L 4076 | 4.120 | 3.076 | 3.599 | LH 84-8 | 32.2 | 42.9 | 37.6 | IPL 81 | 1.301 | 1.131 | 1.216 |
| IPL 315 | 4.463 | 2.718 | 3.592 | Kota Masoor-1 | 31.3 | 43.8 | 37.6 | IPL 220 | 1.381 | 1.036 | 1.209 |
| Bottom Five Genotypes | |||||||||||
| Precoz | 2.673 | 2.512 | 2.593 | LL 1373 | 22.5 | 37.3 | 29.9 | L 4727 | 0.902 | 0.732 | 0.817 |
| RVL 11-6 | 3.313 | 1.861 | 2.588 | Pant Lentil 1 | 31.7 | 28.1 | 29.9 | Precoz | 0.796 | 0.825 | 0.811 |
| RVL 31 | 2.977 | 1.870 | 2.423 | L 4727 | 27.6 | 31.5 | 29.53 | JL 3 | 0.933 | 0.685 | 0.809 |
| L 4717 | 2.673 | 1.728 | 2.201 | LH 18-05 | 26.5 | 31.9 | 29.17 | RVL 31 | 0.777 | 0.709 | 0.743 |
| RVL 13-7 | 2.217 | 1.762 | 1.991 | LL 931 | 21.1 | 36.7 | 28.9 | RVL 13-7 | 0.651 | 0.560 | 0.606 |
| Mean | 3.887 | 2.561 | 3.224 | Mean | 29.8 | 39.3 | 34.6 | Mean | 1.138 | 1.005 | 1.072 |
| STD | 0.74 | 0.52 | 0.92 | STD | 5.61 | 5.24 | 7.22 | STD | 0.22 | 0.23 | 0.24 |
| SE (m) | 0.07 | 0.05 | 0.06 | SE (m) | 0.49 | 0.46 | 0.45 | SE (m) | 0.02 | 0.02 | 0.01 |
| CV (%) | 19.0 | 20.2 | 28.5 | CV (%) | 18.8 | 13.3 | 20.9 | CV (%) | 19.2 | 23.3 | 22.0 |
| Trait | DTF | DTM | PH | NPP | NPB | NFB | SP | HSW | BY | HI | SY |
|---|---|---|---|---|---|---|---|---|---|---|---|
| DTF | 1 | ||||||||||
| DTM | 0.482 ** | 1 | |||||||||
| PH | 0.434 ** | 0.672 ** | 1 | ||||||||
| NPP | 0.398 ** | 0.464 ** | 0.529 ** | 1 | |||||||
| NPB | 0.334 * | 0.245 | 0.460 ** | 0.455 ** | 1 | ||||||
| NFB | 0.365 * | 0.424 ** | 0.391 ** | 0.458 ** | 0.234 | 1 | |||||
| SP | 0.253 | 0.094 | 0.059 | 0.208 | 0.220 | 0.249 | 1 | ||||
| HSW | −0.027 | 0.230 | 0.159 | 0.002 | −0.180 | 0.132 | −0.445 ** | 1 | |||
| BY | 0.417 ** | 0.677 ** | 0.608 ** | 0.455 ** | 0.289 | 0.541 ** | 0.277 | 0.119 | 1 | ||
| HI | 0.024 | −0.191 | 0.040 | 0.279 | 0.390** | −0.181 | 0.038 | −0.0393 ** | −0.189 | 1 | |
| SY | 0.414 ** | 0.517 ** | 0.574 ** | 0.600 ** | 0.548** | 0.344 * | 0.256 | −0.175 | 0.765 ** | 0.467 ** | 1 |
| Trait | Dimension | ||
|---|---|---|---|
| 1 | 2 | 3 | |
| BY | 0.891 | −0.028 | 0.092 |
| DTM | 0.793 | 0.038 | −0.165 |
| NFB | 0.723 | −0.067 | 0.212 |
| PH | 0.706 | 0.342 | −0.328 |
| SY | 0.647 | 0.567 | 0.102 |
| DTF | 0.637 | 0.157 | 0.153 |
| NPP | 0.597 | 0.475 | −0.028 |
| HI | −0.183 | 0.881 | 0.127 |
| NPB | 0.373 | 0.622 | 0.096 |
| SP | 0.258 | −0.033 | 0.843 |
| HSW | 0.176 | −0.372 | −0.755 |
| Eigen value | 4.308 | 1.847 | 1.268 |
| Variance % | 39.2 | 16.8 | 11.5 |
| Cumulative | 39.2 | 56.0 | 67.5 |
| Cluster | No. of Genotypes | Name of Genotypes |
|---|---|---|
| Cluster I | 28 | RVL 11-6, RVL 13-5, HUL 57, Kota Masoor-2, Kota Masoor-1, RLG 5, L 4147, L 4076, LH 89-48, LH 84-8, LH 82-6, LL 699, LL 1373, LL 931, DPL 15, DPL 62, IPL 406, IPL 220, WBL 77, Narender Masoor 1, Narender Masoor 2, LH 16-01, LH 17-16, Pant Lentil 1, PL 02, PL 04, IPL 315, DPL 58 |
| Cluster II | 1 | Precoz |
| Cluster III | 10 | RVL 31, IPL 81, IPL 316, Pant L -7, Pant L -8, LH 17-17, LH 17-18, LH 17-19, LH 18-04, LH 18-05 |
| Cluster IV | 3 | RVL 13-7, JL 3, L 4727 |
| Cluster V | 1 | L 4717 |
| Cluster | I | II | III | IV | V |
|---|---|---|---|---|---|
| I | 24.85 | ||||
| II | 36.40 | - | |||
| III | 39.14 | 57.22 | 23.72 | ||
| IV | 50.29 | 41.33 | 75.41 | 13.61 | |
| V | 74.02 | 54.13 | 94.69 | 37.46 | - |
| Cluster | DTF | DTM | PH (cm) | NPP | NPB | NFB | SP | HSW (g) | BY (kg) | HI (%) | SY (kg) |
|---|---|---|---|---|---|---|---|---|---|---|---|
| I | 79.13 | 125.07 | 44.63 | 111.01 | 2.93 | 16.18 | 1.67 | 2.45 | 3.36 | 33.97 | 1.09 |
| II | 80.67 | 122.67 | 29.85 | 108.58 | 2.73 | 12.12 | 1.67 | 3.39 | 2.59 | 31.47 | 0.81 |
| III | 80.10 | 125.07 | 47.50 | 130.28 | 3.08 | 16.42 | 1.60 | 2.49 | 3.24 | 36.73 | 1.15 |
| IV | 75.50 | 119.33 | 36.01 | 87.48 | 2.64 | 14.62 | 1.46 | 2.46 | 2.50 | 30.69 | 0.74 |
| V | 74.33 | 112.33 | 27.67 | 89.25 | 2.63 | 11.25 | 1.60 | 1.79 | 2.20 | 44.25 | 0.96 |
Publisher’s Note: MDPI stays neutral with regard to jurisdictional claims in published maps and institutional affiliations. |
© 2022 by the authors. Licensee MDPI, Basel, Switzerland. This article is an open access article distributed under the terms and conditions of the Creative Commons Attribution (CC BY) license (https://creativecommons.org/licenses/by/4.0/).
Share and Cite
Sharma, R.; Chaudhary, L.; Kumar, M.; Yadav, R.; Devi, U.; Amit; Kumar, V. Phenotypic Diversity Analysis of Lens culinaris Medik. Accessions for Selection of Superior Genotypes. Sustainability 2022, 14, 5982. https://doi.org/10.3390/su14105982
Sharma R, Chaudhary L, Kumar M, Yadav R, Devi U, Amit, Kumar V. Phenotypic Diversity Analysis of Lens culinaris Medik. Accessions for Selection of Superior Genotypes. Sustainability. 2022; 14(10):5982. https://doi.org/10.3390/su14105982
Chicago/Turabian StyleSharma, Rajat, Lakshmi Chaudhary, Mukesh Kumar, Rajesh Yadav, Uma Devi, Amit, and Vinay Kumar. 2022. "Phenotypic Diversity Analysis of Lens culinaris Medik. Accessions for Selection of Superior Genotypes" Sustainability 14, no. 10: 5982. https://doi.org/10.3390/su14105982
APA StyleSharma, R., Chaudhary, L., Kumar, M., Yadav, R., Devi, U., Amit, & Kumar, V. (2022). Phenotypic Diversity Analysis of Lens culinaris Medik. Accessions for Selection of Superior Genotypes. Sustainability, 14(10), 5982. https://doi.org/10.3390/su14105982