Article

Assessment of Coastal Locations Safety Using a Fuzzy Analytical Hierarchy Process-Based Model

by
Alberto D. Dávila-Lamas
1,
José J. Carbajal-Hernández
1,*,
Luis P. Sánchez-Fernández
1,
Virginia B. Niebla-Zatarain
2 and
César A. Hoil-Rosas
1
1
Centro de Investigación en Computación, Instituto Politécnico Nacional, Av. Juan de Dios Bátiz, s/n, Nueva, Industrial Vallejo, Gustavo A. Madero, Mexico City 07738, Mexico
2
Instituto Tecnológico de Estudios Superiores de los Cabos, Gandhi, San José del Cabo 23483, Mexico
*
Author to whom correspondence should be addressed.
Sustainability 2022, 14(10), 5972; https://doi.org/10.3390/su14105972
Submission received: 1 April 2022 / Revised: 7 May 2022 / Accepted: 9 May 2022 / Published: 14 May 2022

Abstract

:
Worldwide tourist beaches have been an ideal destination for people searching for a recreational place to visit; however, several conditions could generate risks for these visitors. At present, the main efforts to assess these risks and prevent people from danger are essentially focused on monitoring tidal height in the zone, ignoring other risk sources. Therefore, this work generates an overall evaluation that considers the tidal height, bathymetry, temperature, solar radiation, and wind speed, establishing a relationship between parameters and safe beach conditions using a fuzzy logic approach. In addition, this paper presents the design and implementation of a computational model, based on a fuzzy analytical hierarchy process (FAHP), to evaluate coastal and climatological parameters involved in tourist safety, which can be continuously monitored. Tourist beaches in South Baja California, México, with diverse environmental and coastal conditions, were assessed with the proposed model, providing several safety scenarios that contrast the results between sites and demonstrate the capacity of the model to evaluate them. The evaluation, obtained as a result of the computational model, presents information about the safety conditions in the assessed zone, considering the possible risks for all the parameters analyzed, which could be presented to beach visitors to prevent dangerous situations and avoid accidents.

1. Introduction

In several countries, tourism has become an essential economic income, and beaches are considered an important part of the tourist sector. Particularly in México, this industry grew by 12.7% in 2017 with the arrival of 3.4 million international tourists [1]; 73% of the economic income associated with tourism proceeded from beach areas in this country [2]. Notwithstanding the attractive beach and weather conditions, occasional natural events, such as red tide, sea, or environmental conditions, could represent a risk for tourism activities. At present, most of the efforts to assess security in coastal zones are limited to monitoring the height of the waves, and few metrics define if the conditions are safe for tourist activities. One of the most popular ways of assessing a beach location is the flag color-coding. Unfortunately, in a large number of tourist destinations, safety signs do not exist; moreover, some tourists ignore them, or do not know how to interpret them when they do exist, and this leads to many accidents being reported in these zones. Consequently, there is a need for a continuous assessment of safety conditions in tourist beach zones that considers the physical characteristics of the zone and its weather conditions. In this sense, some questions can be raised to determine if it is possible to improve the assessment of beach conditions using different oceanological parameters instead of just tidal height. Likewise, can different levels of hazardous conditions be assessed to alert visitors? To this end, we hypothesize that a model based on monitoring parameters with different importance levels and preferences can help determine good or bad beach conditions to provide real-time information about better and safer places for visitors.
A study of the existing risks in coastal locations in Australia and their signage is presented in [3]; in this paper, results of beach user interviews are presented, demonstrating that almost half the visitors did not even see the signals. Hammerton [4], by using interviews, determined that 82% of the participants knew someone who had drowned and that a significant number of the total drownings took place in the wave-dominated coastline of the analyzed cases in Ghana. Another study presented by Silva-Cavalcanti [5] analyzed the locations of warning signals and the locations of drowning incidents, finding that the safety conditions did not always correspond with the warning signs. Different criteria have been defined to evaluate the safety level of areas for tourist activities. Nevertheless, there is a need to create tools for risk detection and the evaluation of suitable conditions for tourist activities in coastal zones, based on climate and physical parameters, and present them in an easily understandable way.
Some evaluations of coastal areas have been carried out from different perspectives. Considering beach quality, Leatherman [6] presented a ranking of beaches, taking into account 50 physical, biological, and human parameters evaluated quantitatively, adapting the evaluation methodology from [7] designed for river scenery. Looking also for beach quality, Micallef [8] described a quantitative assessment in the region of Andalusia, Spain, that considers five beach parameters considered relevant, but only one of them forecasts safety. The evaluation of this one parameter contemplates the existence of infrastructure features and neglects the environmental or sea conditions. In the results of the works just mentioned, the evaluator perspective and preferences had importance, since the appraisal of some parameters comes from subjective judgments. Campuzano [9] made characterizations of the Bahia Blanca in Argentina, employing data analysis and numerical modeling to improve the understanding of the dominant hydrodynamic processes in the area, providing useful information for the management of the area.
Moreover, taking into account coastal landscape assessment, Ergin, [10] defined 26 parameters to evaluate coastal scenery through surveys of tourists and landscape perception experts in Turkey and the UK. For each parameter, five ranges of values or attributes were established. The parameters are integrated using a fuzzy logic approach (FLA), providing a general assessment that overcomes subjectivity and uncertainty. The mentioned methodology was applied to assess the landscape in coastal zones from the Western Black Sea, and the results were published in Ergin [11].
In México, the analysis for coastal safety assessment is limited to the observation of the tide, calculation of the amount of stool, and the Blue Flag certification [12], but there are few incipient models to integrate this study or provide results with important variables related to the safety of tourism in coastal zones. A first approach was proposed in [13], where a safety index for coastal areas was proposed by analyzing tide, bathymetry, temperature, and wind speed; the parameters are integrated by employing an analytical hierarchy process approach for importance weight assessment. However, the parameters themselves do not define a safety condition as a whole, which is needed to determine when site conditions are dangerous or safe, using a site and priority classification.
On the other hand, multi-criteria decision making (MCDM) models are utilized in problems with multi-criteria dimensions, where each criterion can be quantitative or qualitative, and could present conflict with other input. Therefore, the output must be a compromise [14]. For these properties, MCDM models have been applied with success in several disciplines, such as medicine, business, government, and environmental management. Particularly, in this last discipline, MCDM has solved complex problems; for example, in [15], Deveci used a CODAS based model to identify the best rehabilitation solution for abandoned mines, and in [16], the same author made a modification to the WASPAS model, applying Einstein norms in a fuzzy environment over triangular fuzzy numbers to assign priorities to climate change mitigation strategies in urban mobility planning. Furthermore, the most popular variety of MCDM model, especially in environmental science, is the AHP methodology [17], which is flexible in considering a group of factors to combine the opinion of many experts, reducing complex problems into simple pairwise comparisons between elements [18].
This paper presents the design of a computational model that assesses safety in coastal zones for the practice of tourist activities considering physical, oceanographic, and climatological variables, where the importance of each parameter is pondered and with the aim of providing information to visitors in an easy and understandable format that other evaluations do not consider, improving the actual safety evaluations and addressing the flaws. The relative importance of each evaluated parameter is assigned with a fuzzy analytical hierarchy process (FAHP) methodology because of its capacity to consider a group of factors and the opinion of many experts simultaneously, as well as prioritize the elements that have more impact on the overall evaluation. Then, all the parameters are integrated with a fuzzy logic approach, obtaining a Beach Safety Index (BSI) as a result. This paper considers the region of Los Cabos as a case study; this destination is located in the south of the Baja California peninsula, México, and it is one of the most important tourist destinations in the country, where tourism is the main source of income for the region. The climate conditions and favorable tide for surfing attract thousands of tourists each year, but not all beaches are adequate for bathing. The data provided from the existing infrastructure for the monitoring of physical and climate conditions, in addition, to the information obtained from previous research works [19], are entered as inputs to the model. Temperature, solar radiation, wind speed, bathymetry, and tide height were the parameters selected for analysis and safety evaluation.
The rest of the paper has been structured as follows: Section 2 explains the considerations for coastal safety conditions in tourist locations, as well as the model building process. Section 3 describes the implementation of the proposed model and the data used for assessing specific beaches, and Section 4 presents the discussions and suggests further work.

Literature Review

Several works have provided methodologies for beach assessment. In Table 1, a summary of these works found in the literature is presented as it relates to the problem of the safety assessment of the beach zones and the MCDM models, as well as their principal contributions.

2. Materials and Methods

2.1. Sampling Site

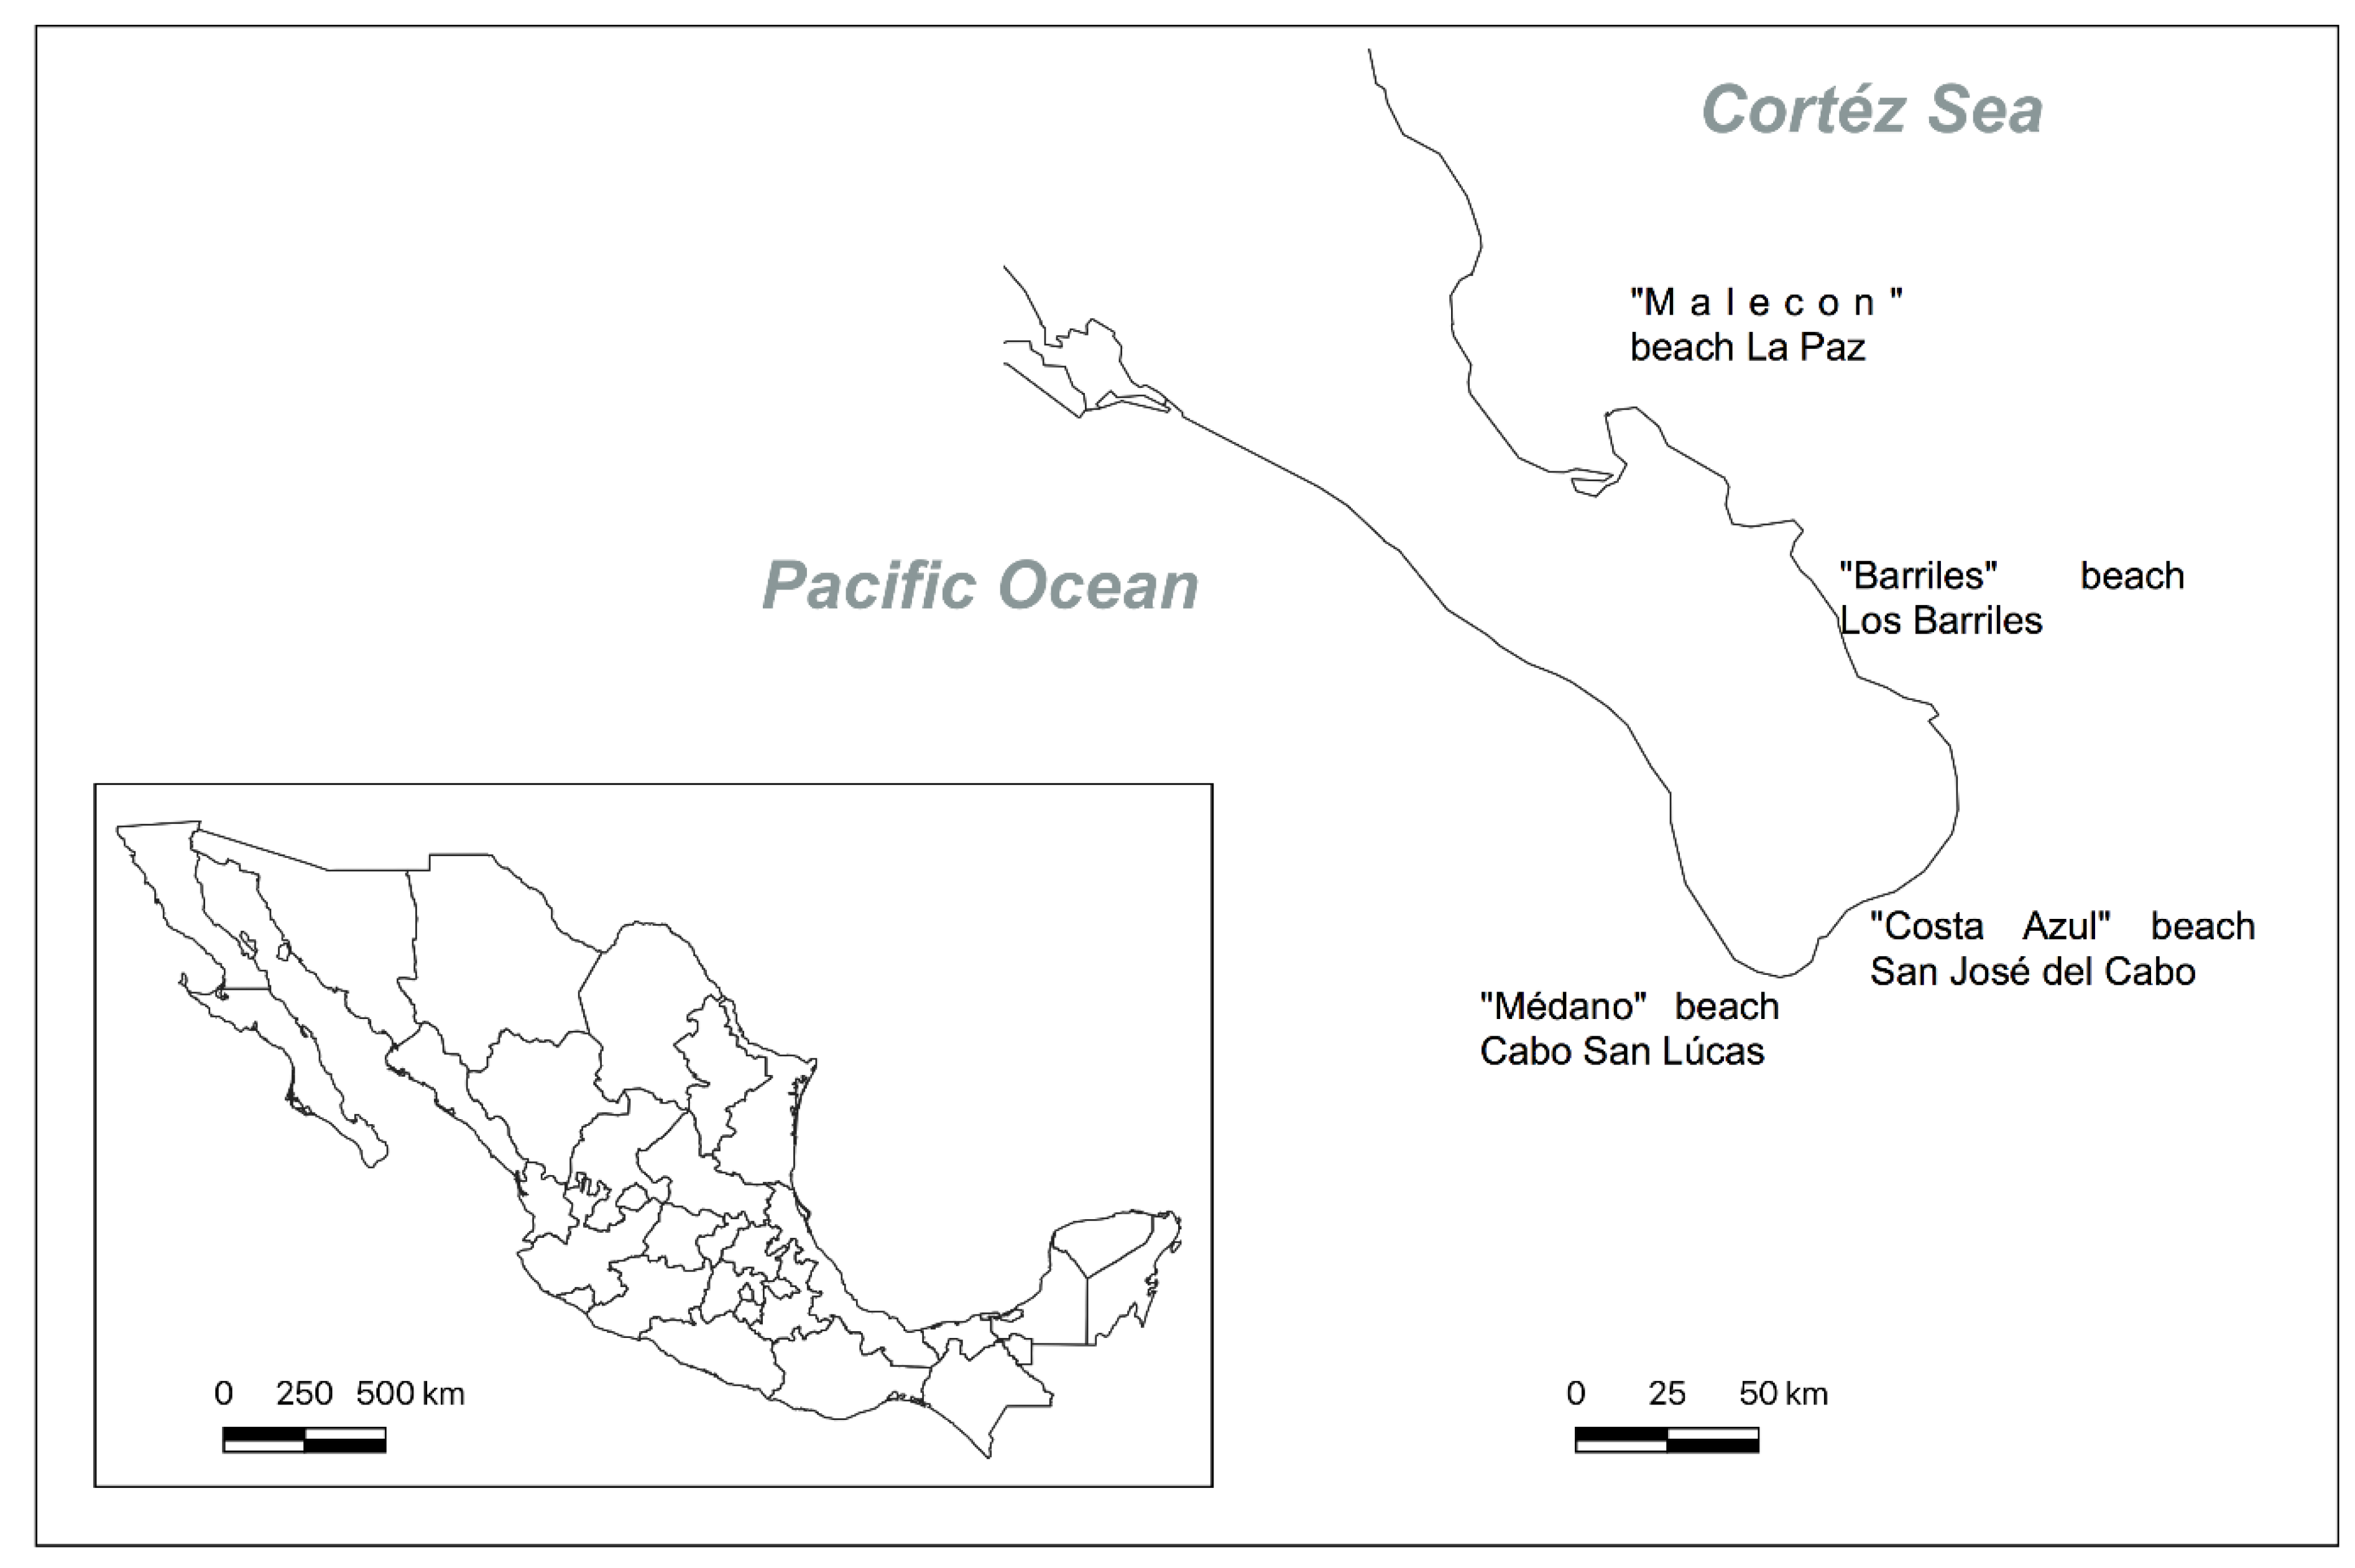
The regions of Los Cabos and La Paz, located in the state of South Baja California, México, are annually visited by thousands of international and domestic tourists. The most popular destinations in this region are Cabo San Lúcas, San Jose del Cabo, La Paz, and Los Barriles. These sites are also the most populated in the state (besides Los Barriles, with only 1674 residents): La Paz, with 250,141, Cabo San Lúcas, with 202,694, and San José del Cabo, with 136,285 residents, according to the local government statistics [20]; for these reasons, they have been considered as sampling sites for this study. Facilities in these locations provide information about weather and ocean measurements, and the closeness of different tourist sites is ideal for our proposal. The beaches in South Baja California are attractive to tourists because of their enjoyable scenery, hot and dry climate, and turquoise waters. However, several differences exist between the beaches of the region, from low deep bays, with low tide in La Paz, to open sea beaches, where swimming or bathing activities are extremely dangerous, such as in San Jose City (Figure 1). Different activities can be practiced depending on the characteristics of a particular zone; some places are ideal for swimming and sunbathing, while others are better for the practice of aquatic sports. Climate and oceanographic conditions at these sites are continuously monitored, providing data that can be used to evaluate the safety of the area. The sampling sites were chosen to take into account the variety of conditions between sampling sites and the importance of the destinations for the tourism industry.

2.2. Factor Analysis

Beach safety assessment depends on several factors, where the behaviors of the involved parameters each have a different impact because the risk involved in the behavior of some parameters is greater than others. In this work, three principal factors are considered to assign the relative importance between parameters, but in contrast with the methods in [13], factors taken into consideration are the principal risks in beach zones. The first contemplated factor is the drowning risk. The next factor is the environmental risk, where environmental conditions are not desirable, such as high wind speed or high solar radiation. The third analyzed factor is red tide risk, the presence of algal blooms that cause skin irritation. In this sense, factors are denominated as follows:
  • F1: Drowning risk;
  • F2: Environmental risk;
  • F3: Red tide risk.
In this work, five parameters have been identified as common to the studied factors and the most relevant to compute a safety evaluation. Their importance lies in the fact that they can be automated and monitored for data acquisition purposes. These parameters are tide, temperature, wind speed, solar radiation, and bathymetry. The tide and bathymetry are related to the drowning risk [21,22,23], the temperature and wind speed are associated with the red tide risk, and wind speed and solar radiation are mainly associated with the environmental risk. Although in the literature, a high number of parameters are assessed, they correspond to static observations, such as sand type, relief, and beach material, among others [6,10]. This work has the aim of monitoring parameters that present dynamic behaviors and can change the safety conditions on the beach; this set will be continuously monitored.
Different categories and optimal ranges of each parameter have been defined in Table 2. These classifications are based on the international scales for sea conditions defined by the World Meteorological Organization (WMO) [24], Encyclopedia Britannica [25], and information collected from research works [26,27,28], and the health recommendations come from and World Health Organization (WHO) [29]. These categories include different status types presented in beach locations dedicated to tourism.

2.3. Model Architecture

In general, computational models for beach assessments have been developed only for aesthetic purposes [8,11]. For this reason, this work proposes a safety indicator through a fuzzy logic approach which, due to this technique, is well adapted to environmental problems in which uncertainty is used for modeling parameters with different ranges of validity.
The relative importance between parameters and factors is assigned by employing the FAHP methodology, aiming to eliminate subjectivism in the weighting procedure. The model architecture is shown in Figure 2 and is formed by four principal stages. The first stage obtains the data inputs for each parameter. The next stage is the fuzzy assessment, where each input is evaluated in its optimal scale, retrieving a normalized output. In the third stage, each fuzzy output is multiplied by an importance weight obtained through the FAHP methodology. The last stage integrates all the outputs, retrieving as output a normalized index that represents the safety label in the evaluated coastal zone.

2.4. Fuzzy Logic Approach

Usually, the modeling of environmental parameters is complex, and the development of a mathematical equation can be a hard task. Fuzzy logic has overcome this issue, classifying parameters according to a certain grade against Boolean evaluations, where only one true or false range can be defined as a value that varies from a bad to an excellent condition. In this case, all parameters are normalized in more understandable ranges, which can be used as inputs on the same scale, being easier to process. The purpose of the fuzzy assessment is to evaluate each parameter according to its scale and optimal level, transforming the measured values into a [0, 1] range. This normalizes all parameter ranges and scales [30]. Fuzzy expressions were defined for the normalization of each parameter, setting the limits based on the permissible ranges, as detailed in Table 2. A letter was assigned to refer to each of the parameters: d refers to the tide, t to temperature, s to wind speed, r to solar radiation, and b to bathymetry; the expressions are assigned as follows:
μ ( d ) = m a x { min ( 1 , d d d d d d c ) ,   0 }
μ ( s ) = m a x { min ( s s a s b s a , 1 , s d s s d s c ) ,   0 }
μ ( b ) = m a x { min ( 1 , b d b b d b c ) ,   0 }
μ ( t ) = m a x { min ( t t a t b t a , 1 , t d t t d t c ) ,   0 }
μ ( r ) = m a x { min ( 1 , r d r r d r c ) ,   0 }

2.5. Importance Comparison Rules

To assign the relative importance weights with the FAHP methodology, verbal comparisons of importance are made between factors and independently between parameters, considering each factor, and then these comparisons are transformed into fuzzy triangular functions using Table 3, as defined by Wang [31]. An important consideration for the analysis is that if a first element is considered more important at any level of the scale than a second element, the comparison of the second element against the first is the reciprocal function.

2.6. Fuzzy Analytical Hierarchy Process Modelling

The safety evaluation of beaches can be defined according to the importance of each oceanographic parameter. For this purpose, an analysis of parameters with a high impact on the safety assessment is proposed. The fuzzy analytic hierarchy process methodology (FAHP) was proposed by Laarhoven and Pedryez [32], extending Saaty’s AHP theory [33], establishing the importance of comparisons using fuzzy functions, represented by a set of numbers denoted as (l, m, u) and denominated triangular fuzzy numbers. The membership function of a fuzzy triangular number M in R, μ M ( x ) : R [ 0 ,   1 ] is described by the equation:
μ M ( x ) = { x m l l m l     x   [ l ,   m ] , x m u u m u     x   [ m ,   u ] ,                     0                                 o t h e r   c a s e
where l m u , l and u represent the upper and lower value of the triangular function, respectively, and m represents the value with the maximum membership. The range of M is delimited by the set elements, consequently { x   R   |   l < x < u } . If l = m = u , the set is not a fuzzy number by convention (Table 3).
Several approaches have been proposed to obtain the importance weights using the FAHP methodology. This work employs the extent analysis method developed by Chang [34], and detailed in [35], computing the mathematical operations as described by Deng [36]. The first step is to order the importance comparisons, in the form of triangular fuzzy numbers, in a positive reciprocal pairwise matrix ( A = M g i j ), with n × n dimensions, as follows:
A =   P 1     P 2   P n P 1 P 2 P n [ M g 1 1 M g 1 2 M g 1 n M g 2 1 M g 2 2 M g 2 2 M g n 1 M g n 2 M g n n ]
The value of the synthetic extent for the ith object is calculated using Equation (8); M g i 1 ,   M g i 2 ,   M g i m are defined as values of the extent analysis of the ith object of m objectives.
S i = j = 1 m M g i j · [ i = 1 n j = 1 m M g i j ] 1
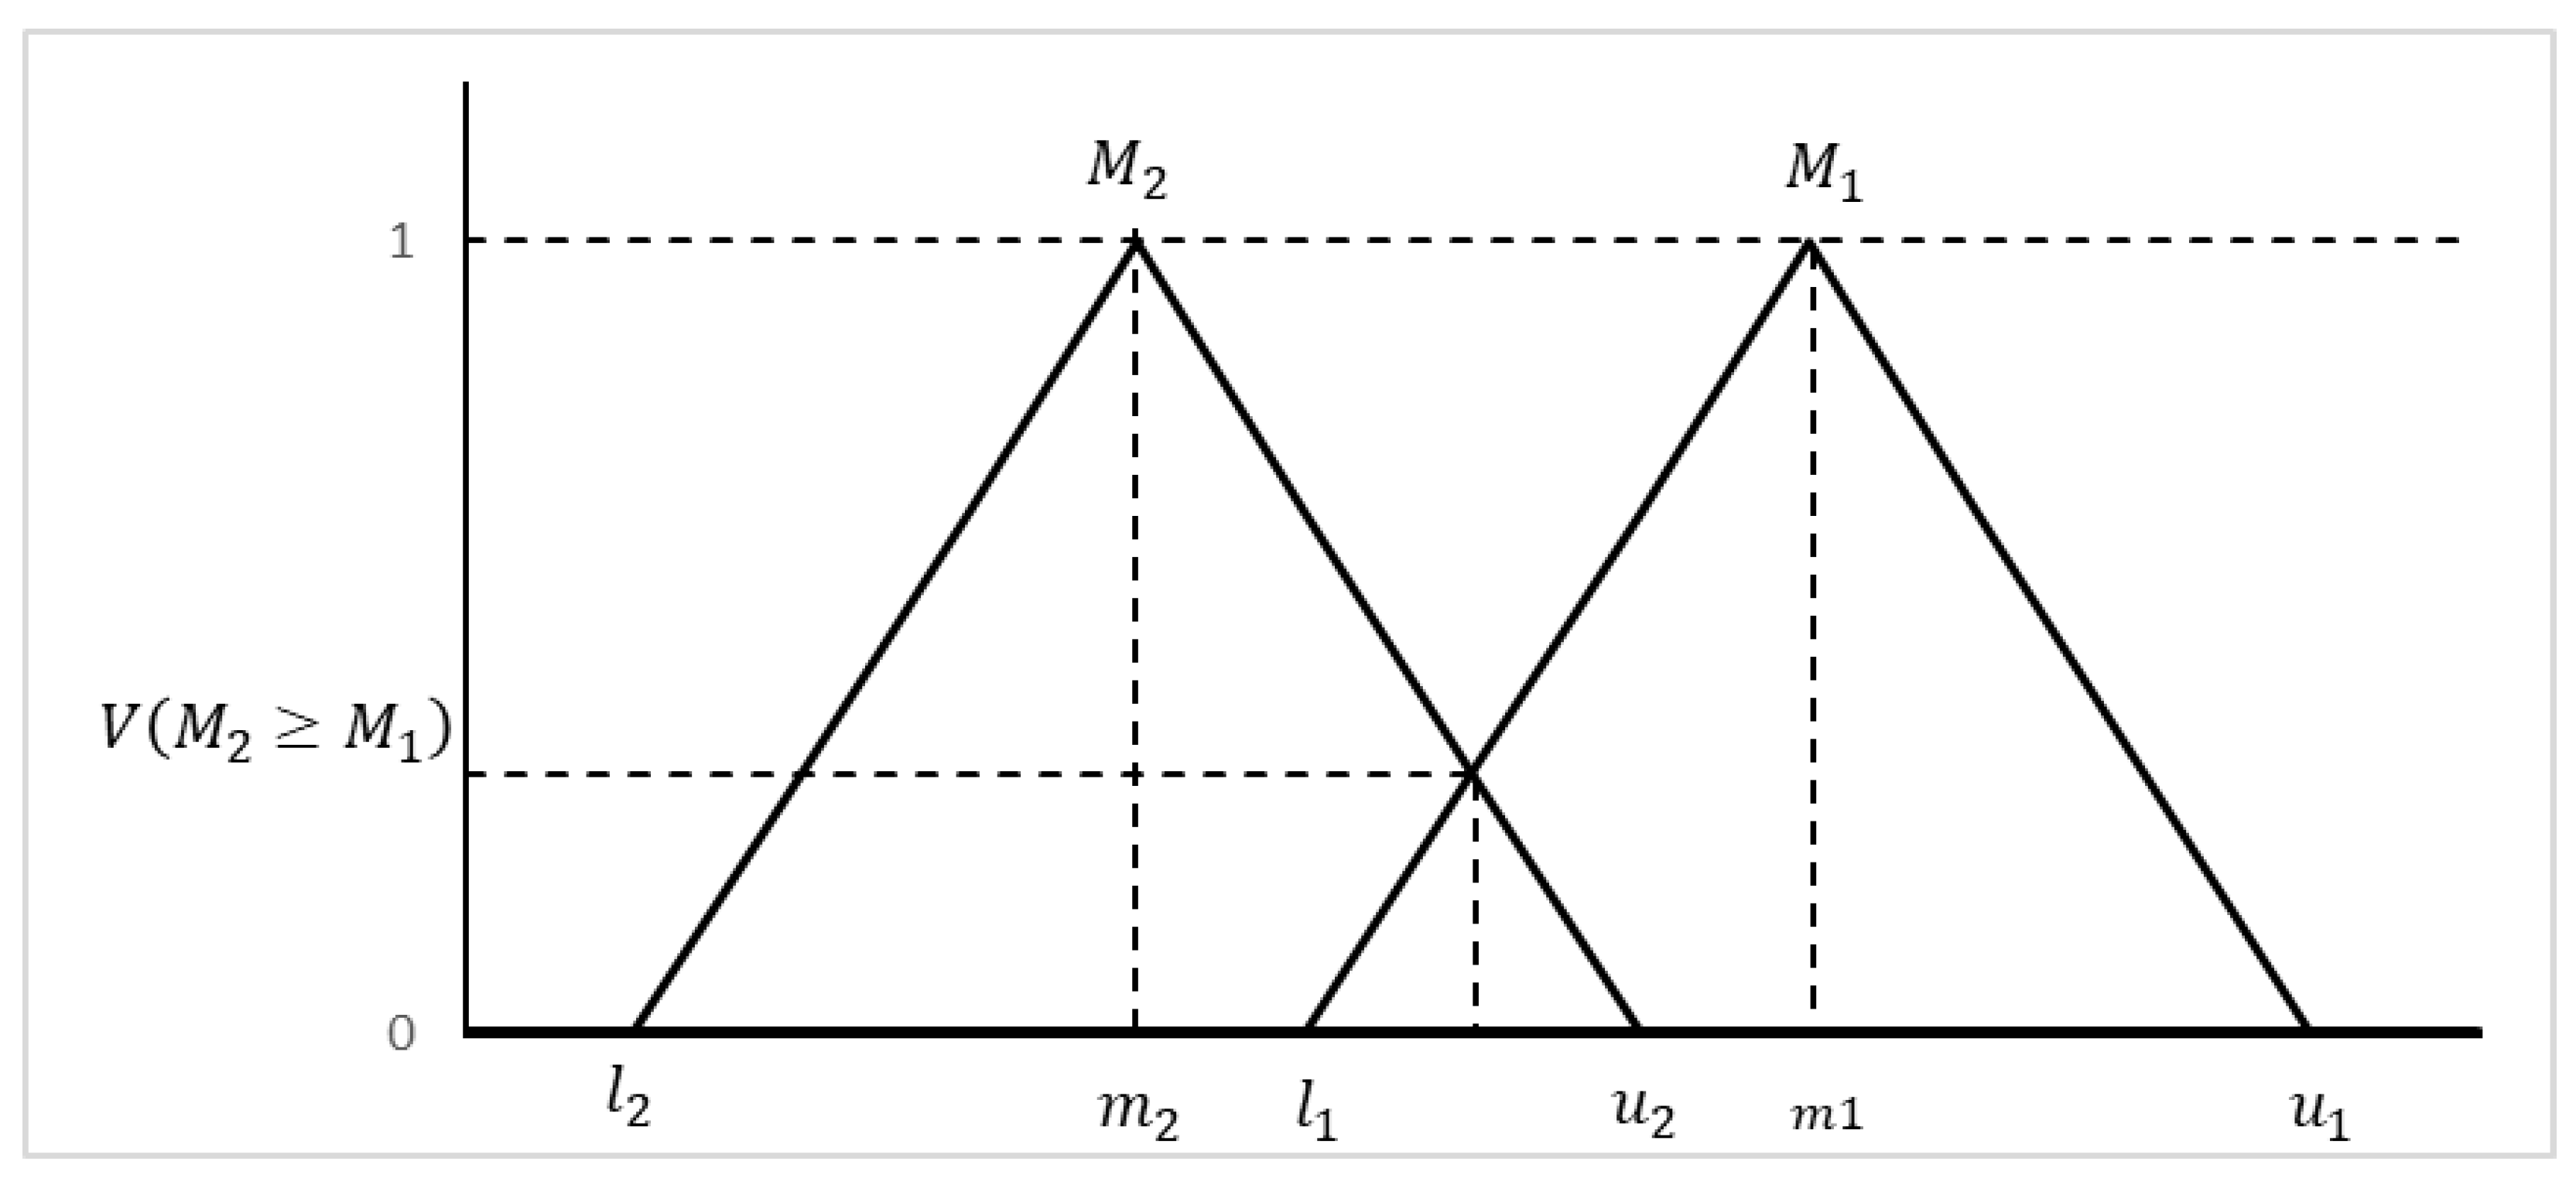
The possibility degree of M 1 M 2 represents the membership value for the intersection of the fuzzy functions M 1 and M 2 . This definition is shown in Figure 3 and described mathematically in the next expression:
V ( M 1 M 2 ) = s u p x y [ m i n ( μ M 1 ( x ) ,   μ M 2 ( y ) ) ]
Since M1 and M2 are convex fuzzy numbers:
V ( M 1 M 2 ) = 1 i f m 1 m 2
V ( M 2 M 1 ) = h g t ( M 1 M 2 ) V ( M 2 M 1 ) = l 1 u 2 ( m 2 u 2 ) ( m 1 l 1 )
The possibility degree for a convex fuzzy number to be greater than k convex fuzzy numbers can be assumed as:
d ( A i ) = m i n V ( S i S k )
where k = 1, 2, …, n; k i . The d ( A i ) values for all the objectives are appended in a vector W . The final weight vector W is obtained by normalizing the values of W :
W = ( d ( A 1 ) ,   d ( A 2 ) , ,   d ( A n ) ) T

2.7. Weights Calculation

Defining importance criteria is not an easy task, and it must be done based on the judgment of experts on the subject. In this work, the opinions of 12 experts on beach locations were collected through questionaries. Considerations about relationships of importance among factors and parameters for the assessment of safety in coastal tourist zones were provided by 4 academics from ITES (Instituto Técnológico de Estudios Superiores), Los Cabos [37], dedicated to beach conservation from tourist and civil protection profiles, with expertise between 10 and 15 years; 4 academics from CICIMAR (Centro Interdisciplinario de Ciencias Marinas) [38] focused on marine biology and oceanography, with experience between 8 and 13 years; and 4 lifesavers that belong to the Mexican Fund for Tourism Promotion (Fondo Nacional de Fomento al Turismo) [39] and the Federal Marine Zone (Zona Federal Marítima) [40], with 5 years of experience. Although the 12 experts’ work is focused on beach zones, they have different profiles, and their judgments are established from different perspectives of the problem, which are contained in the overall statements of safety, avoiding bias or tendency to only one opinion or perspective; furthermore, several studies have been developed with smaller groups of experts [41]. The questionnaire was applied in four stages: in the first, the risk danger is determined by employing verbal pairwise comparisons for Saaty’s scale [33]. In the following three stages, the relative impact of each parameter against the others, considering one risk at the time, is also defined with verbal pairwise comparisons. The results for the questionnaires are presented as pairwise fuzzy numbers shown in Table 4, Table 5, Table 6 and Table 7, transforming the linguistic comparisons into fuzzy functions according to the criteria defined by [31]. In this case, the comparisons between factors are established in Table 4. The relationships of importance between parameters are presented in Table 5, Table 6 and Table 7, defining each of the factors as decision criteria, respectively.
According to the drowning risk factor (F1), bathymetry has been considered as the most important parameter because beaches that present high inclinations are non-optimal for any visitor, and some swimming requirements are needed to have a minimal risk; the second-highest importance is assigned to the tide, as shown in Table 5. In the case of environmental risk factor (F2), solar radiation is assigned with the greatest weight of relative importance, as can be seen in Table 6. The second more important parameter is the wind speed. Finally, in the comparison taking into account red tide risk (F3), wind speed and temperature are the most important parameters due to their influence on the appearance of red tide, as seen in Table 7. The general weight priorities are calculated by combining the importance weights of Table 4, Table 5, Table 6 and Table 7 according to the sum of the weight multiplication, where the resulting importance weights show the unity. The result is presented in Table 8.

2.8. Beach Safety Index

The final step is to create a method of assessing safety according to an understandable score. In this sense, the beach safety index (BSI) provides a final value between the [0, 1] range. The BSI provides a score of “1” when all the parameter conditions are in their optimal range; contrastingly, if one or more parameters present non-optimal values, the score decreases, reaching “0” when the safety conditions of the zone are completely unsuitable for the practice of tourist activities. The BSI index involves the complete parameter set evaluations, integrating partial scores into a global result. The FAHP weights amplify or attenuate the negative impact of each parameter according to its importance level, generating a score concerning the safety condition in that location. According to this, the integration of the evaluated parameters in the BSI index is described by:
B S I = i = 1 n μ i ( k ) W i k
where k refers to a parameter,   μ i ( k ) is the fuzzy function to normalize the measured values for the parameter k, defined in Section 3.1, and W i k is the importance weight calculated using the FAHP methodology for the parameter k. By replacing each parameter in Equation (14), the following expression results:
S I = μ ( d ) W d + μ ( t ) W t + μ ( s ) W s + μ ( r ) W r + μ ( b ) W b
where d refers to the tide, t is the temperature, s is wind speed, r is radiation, and b is bathymetry. Replacing the calculated weights in Equation (15), the safety index can be rewritten as follows:
S I = 0.278   μ ( d ) + 0.124 ( t ) + 0.166 μ ( s ) + 0.109   μ ( r ) + 0.323 μ ( b )

3. Results and Discussions

3.1. Data Collection

To show the safety index (SI) performance, a database of collected measurements was created using measurements obtained from meteorological stations (Vantage Vue Weather Station) at sampling sites located on Médano Beach at Cabo San Lúcas, Costa Azul Beach at San Jose del Cabo, Malecon Beach at La Paz, and Barriles Beach at Los Barriles. Likewise, measurements obtained from Meteoblue [42] and Windy [43] websites complemented the required data information. The proposed database contains 336 register samples for each place, with measurements at every hour from the 7th to the 20th of October 2019. Each register includes values for temperature, wind speed, solar radiation, tide, and bathymetry.

3.2. Parameter Analysis

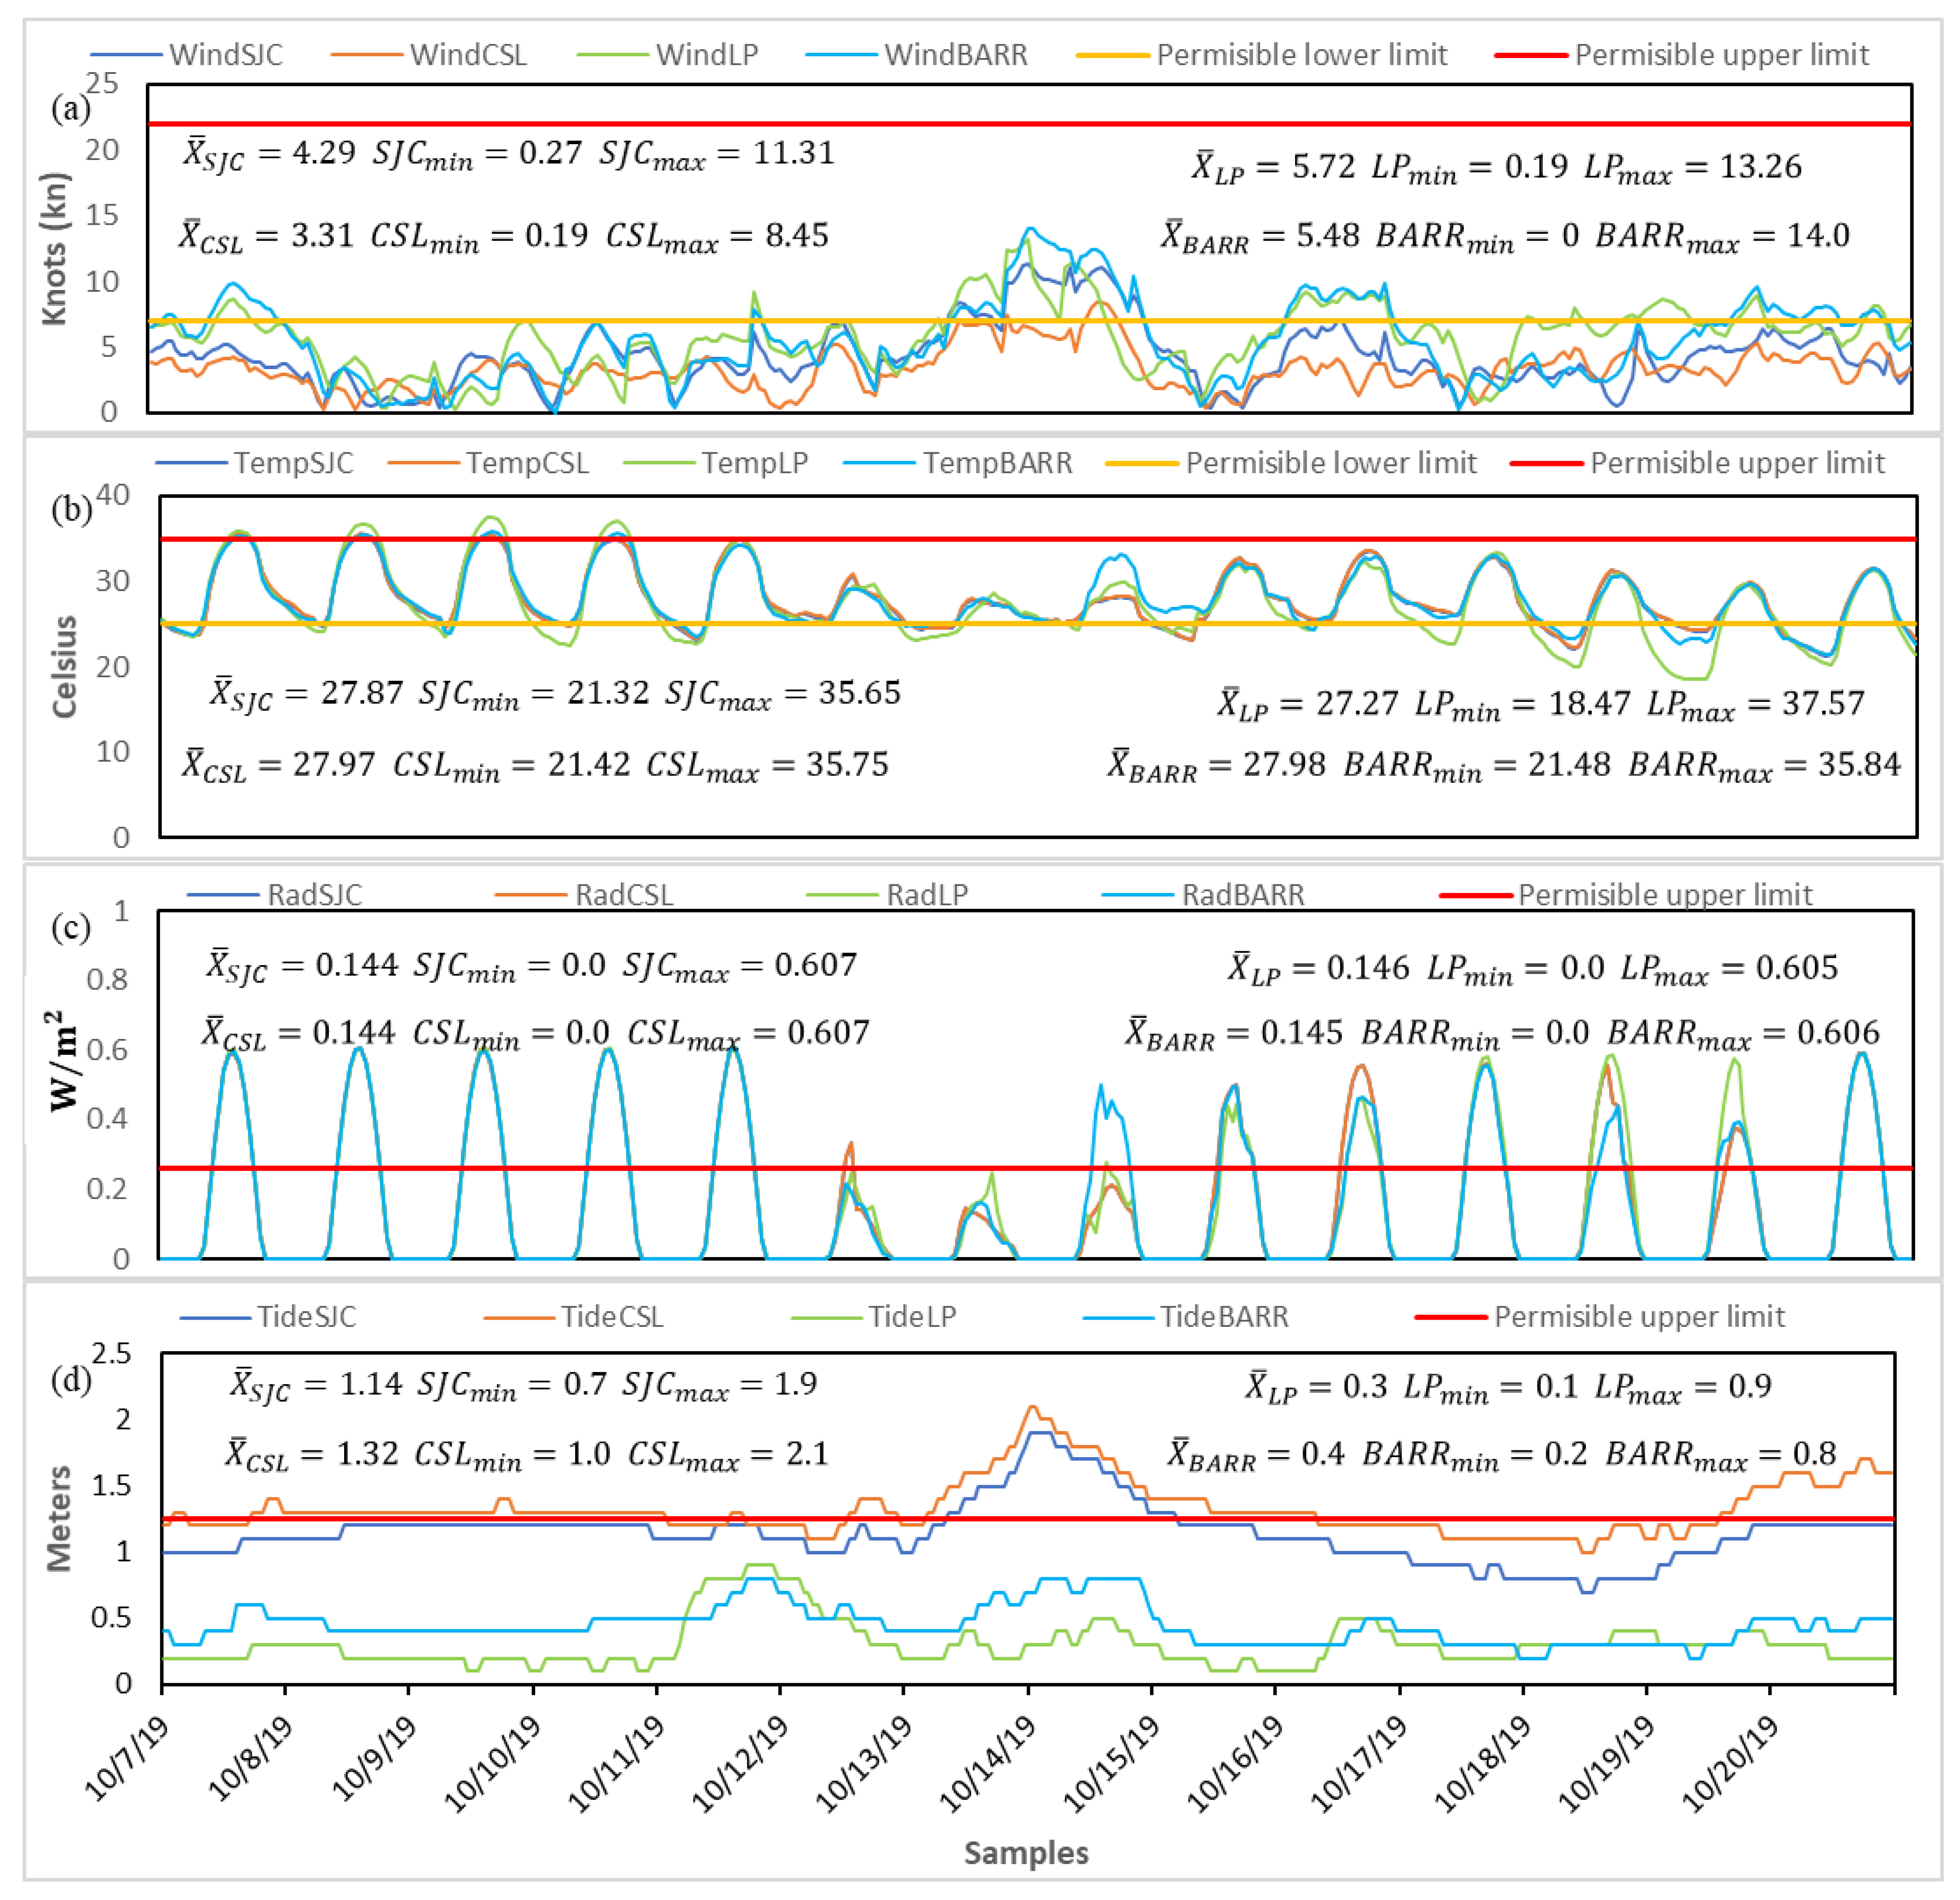
In Figure 4, database information is represented as signals, where parameter dynamics can be observed. According to the permissible limits defined in Table 1, the wind speed was below the optimal range at almost all the measurement times and for all the locations. This is a condition that increases the probability of red tide presence, representing one of the assessed risks for the practice of tourist activities. The higher mean value of wind speed during the sampling period was registered on Malecon Beach (Figure 4a). Temperature presented a fluctuating behavior, which can be explained due to sunset and sunrise conditions (Figure 4b). Only a few samples per day exceed the permissible limits. Since the sampling sites are in the same region, the temperature signals were measured with similarity. Solar radiation (Figure 4c) showed similar behavior in the four places almost all the time, usually reaching values out of the optimal range at midday. The tide is presented in Figure 4d, where higher waves were measured at the Costa Azul and Médano sites. In some cases, the high waves were out of the optimal range. For Malecon and Barriles beaches, the tide was low, which means a good condition for tourist activities. On some days, the obtained values from these sites increased the tide safety conditions; however, they were never cataloged as dangerous. In the sampling sites, the maximum depth allowed for tourists to swim was defined as 2 m.

3.3. Fuzzy Assessment

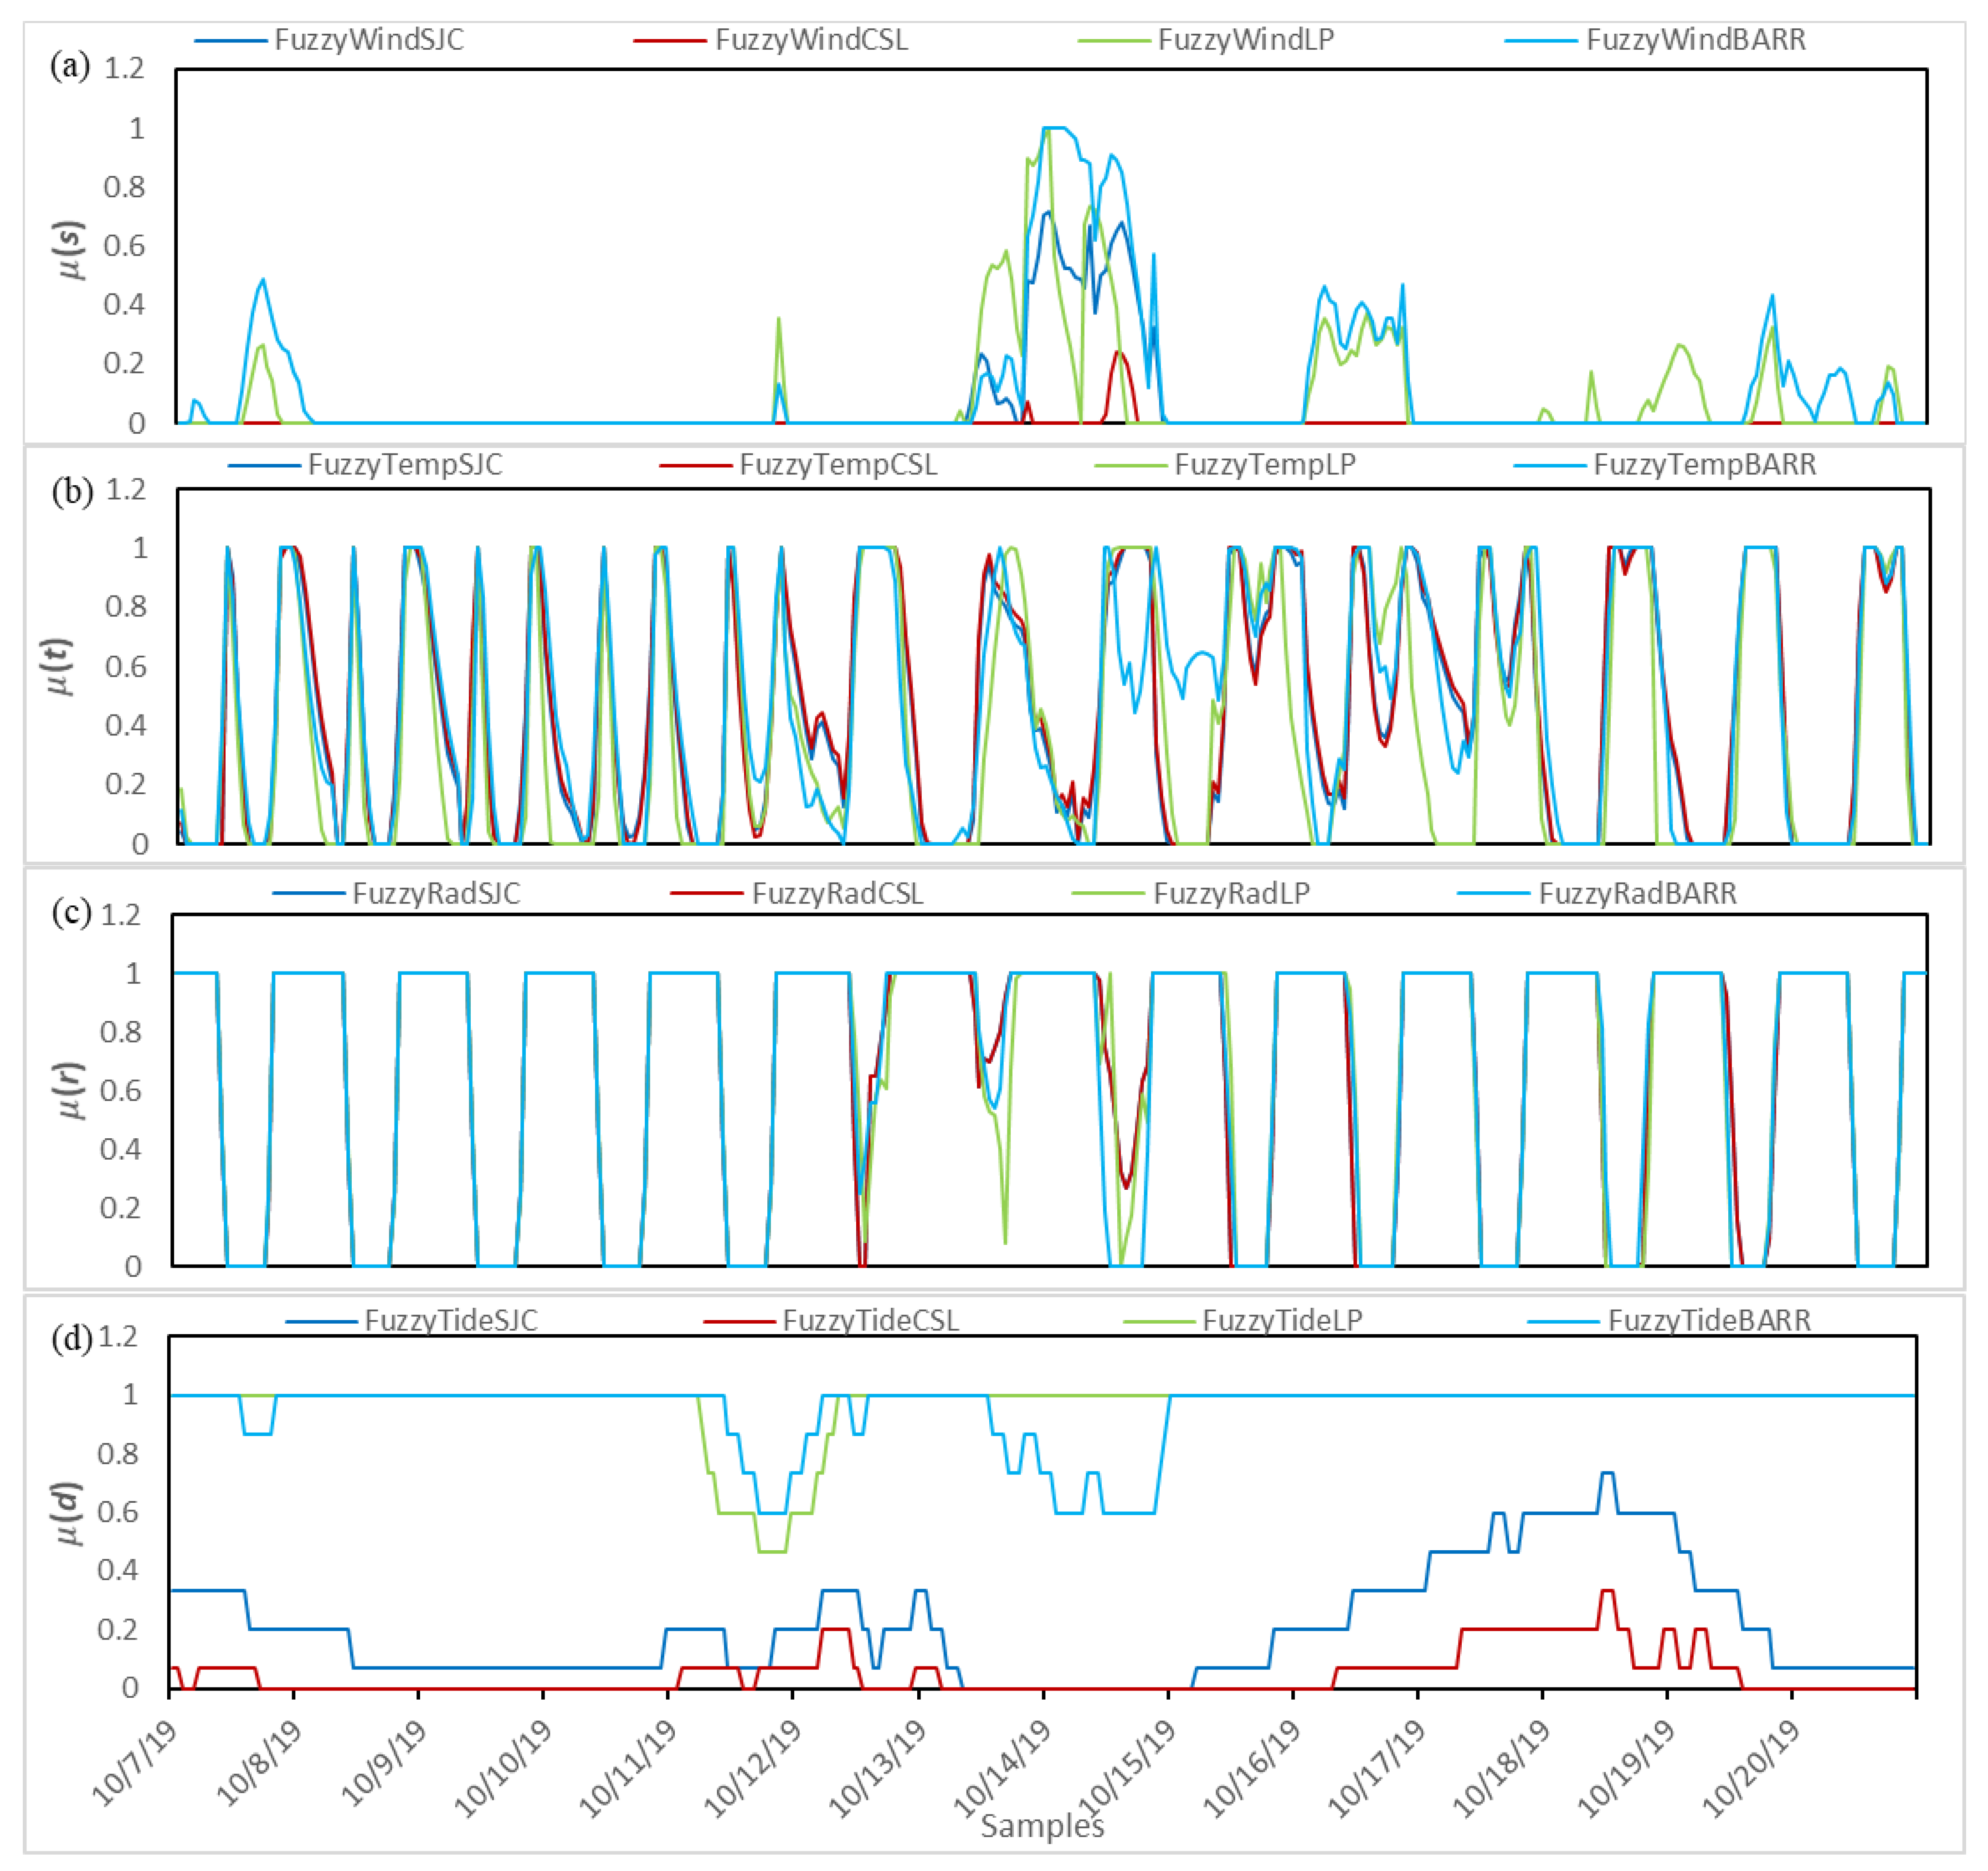
The results of assessing the measured values for each parameter, using their respective fuzzy expressions, Equations (1)–(5), are shown in Figure 5. The fuzzy assessment for wind speed indicated that the conditions of this parameter, in a great part of the sampled period, were bad because it was almost always out of the optimal range (Figure 5a). Figure 5b shows a highly variable behavior that corresponds with the measured signal of temperature changes during the sampled period; since high temperatures are out of the optimal range, these moments were considered as bad conditions of temperature for safety. Similarly, in the solar radiation fuzzy assessment (Figure 5c), the daily variations can be observed and the high radiation values are evaluated as a bad condition for safety. In the case of the tide, the fuzzy assessment scored 1 in a great portion of the sampled period for Malecon and Barriles, while in the other two sites, the evaluation varied between values from 0 to 0.73 (Figure 5c). Fuzzy evaluations are integrated into the BSI index, and the final assessments are computed and explained in the following section.

3.4. Beach Safety Index (BSI)

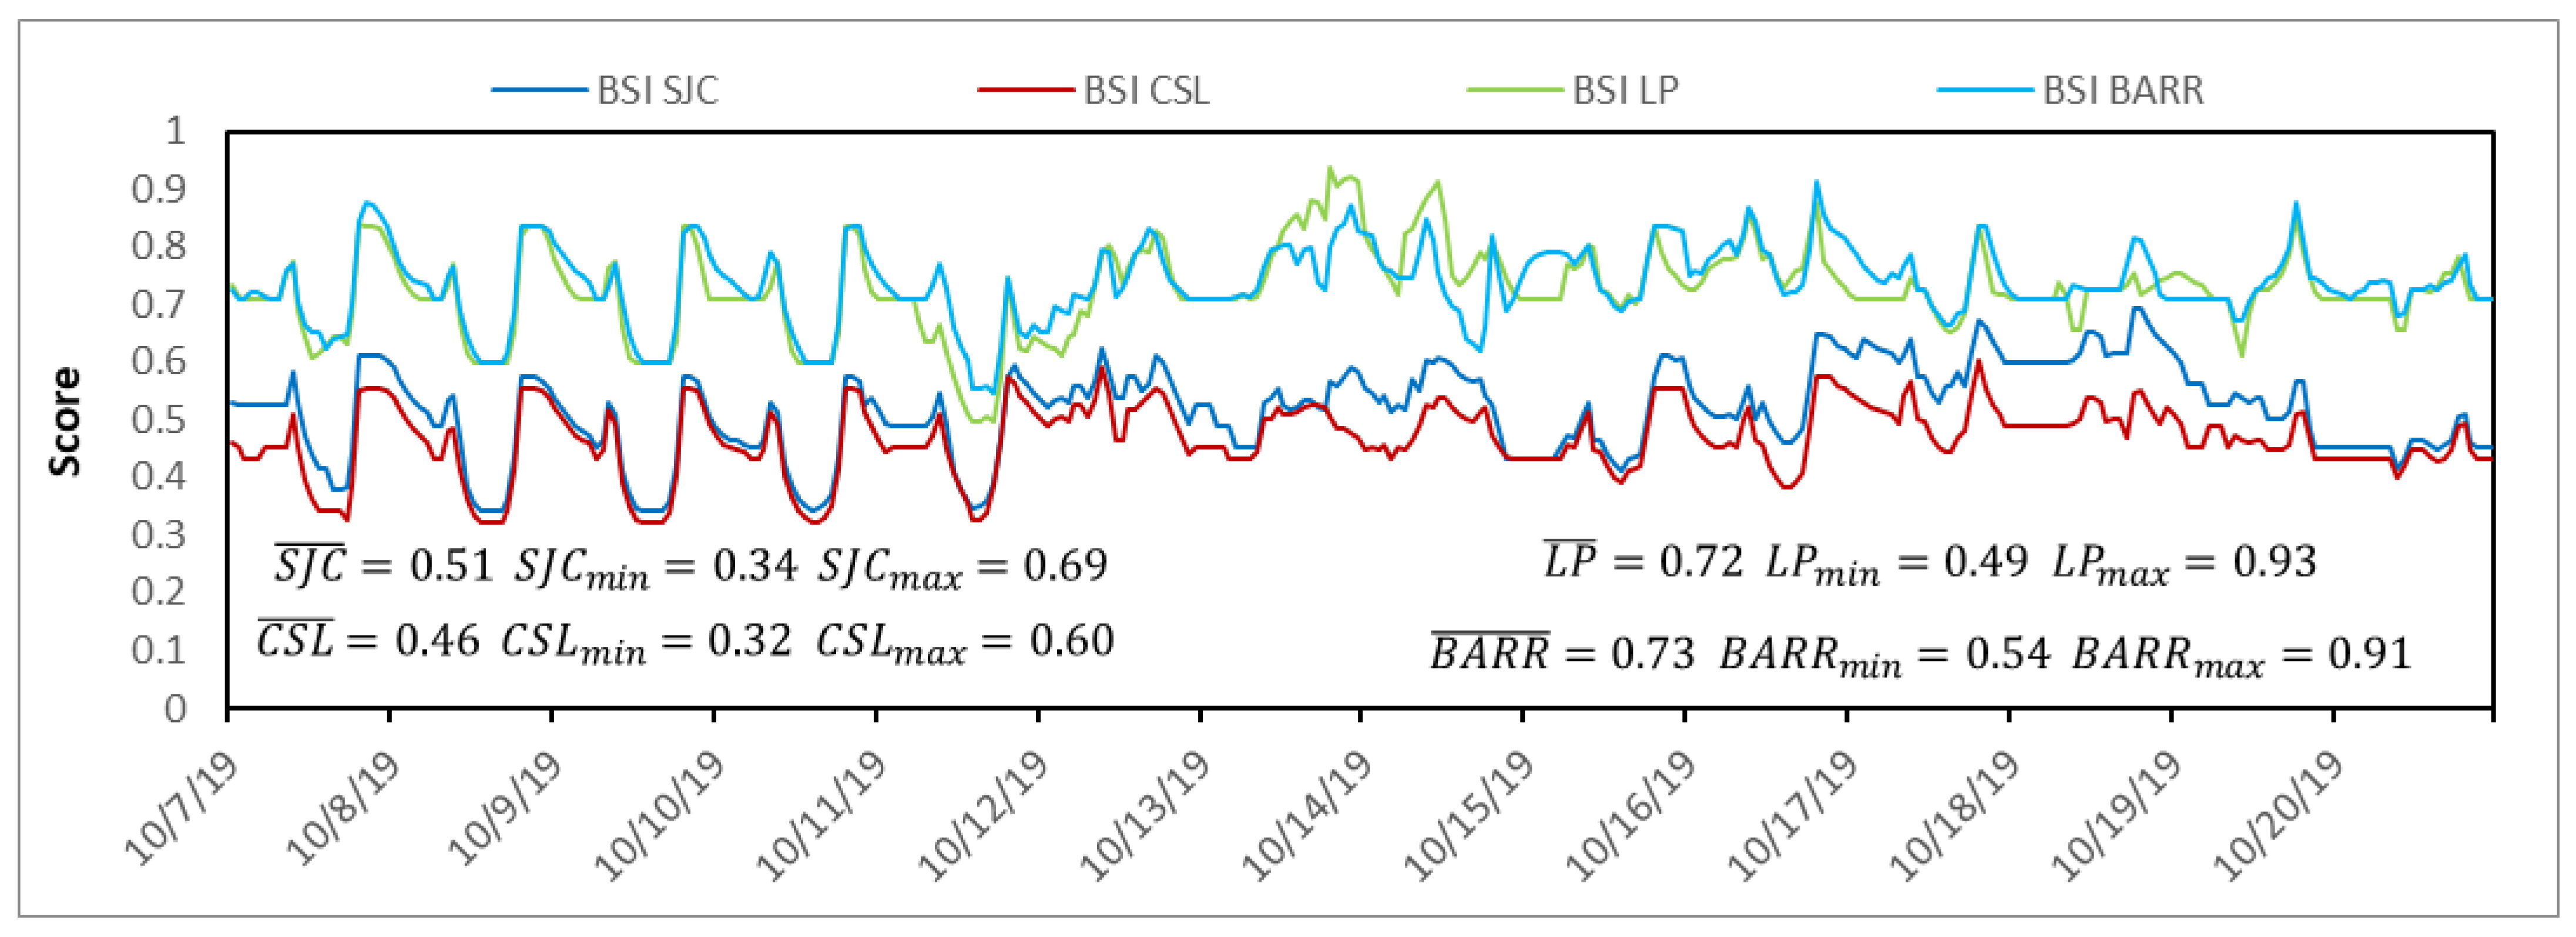
The BSI integrates the fuzzy evaluations of all the parameters with the importance weights obtained from the FAHP analysis using Equation (16). Since the weights and the parameter inputs are normalized, the obtained output is a number between the [0, 1] range, 0 being the worst case of safety conditions, and 1 the optimal safety conditions. If all parameters are in the optimal range, then the score will be 1; otherwise, it will decrease when one or more parameters fall out of the optimal range. If the BSI score is a value between 0.85 and 1, the safety conditions are considered excellent; between 0.7 and 0.84, good; from 0.5 to 0.69, regular; from 0.25 to 0.49, bad; and values from 0 to 0.24 are considered very dangerous safety conditions. The negative effect of undesirable conditions in temperature, wind speed, and radiation can be noticed in the BSI score; however, those changes have little influence on the safety index response. In contrast, the behavior of the index is affected in great measure by tide and bathymetry variations, because the weights obtained in the FAHP process for these parameters are significantly higher than those calculated for the other parameters. The safety conditions during the testing dates at Malecon and Barriles beaches were from regular to excellent conditions almost all the time good; the minimum value was assessed on October 11th and the better conditions were registered on October 14 and 15; Malecon Beach safety conditions were better than the other sites because the tide height was lower, as can be seen in Figure 4d). Costa Azul and Médano beaches show similar behavior in the BSI evaluation, registering conditions as regular and bad in the sampled period. The minimum values for both sites were on October 10; on this day, the measured values were out of the optimal ranges, yielding a low score in the fuzzy assessment (Figure 5). The beach safety index variations for the sampled sites are displayed in Figure 6; the mean, maximum, and minimum values for each site are included.
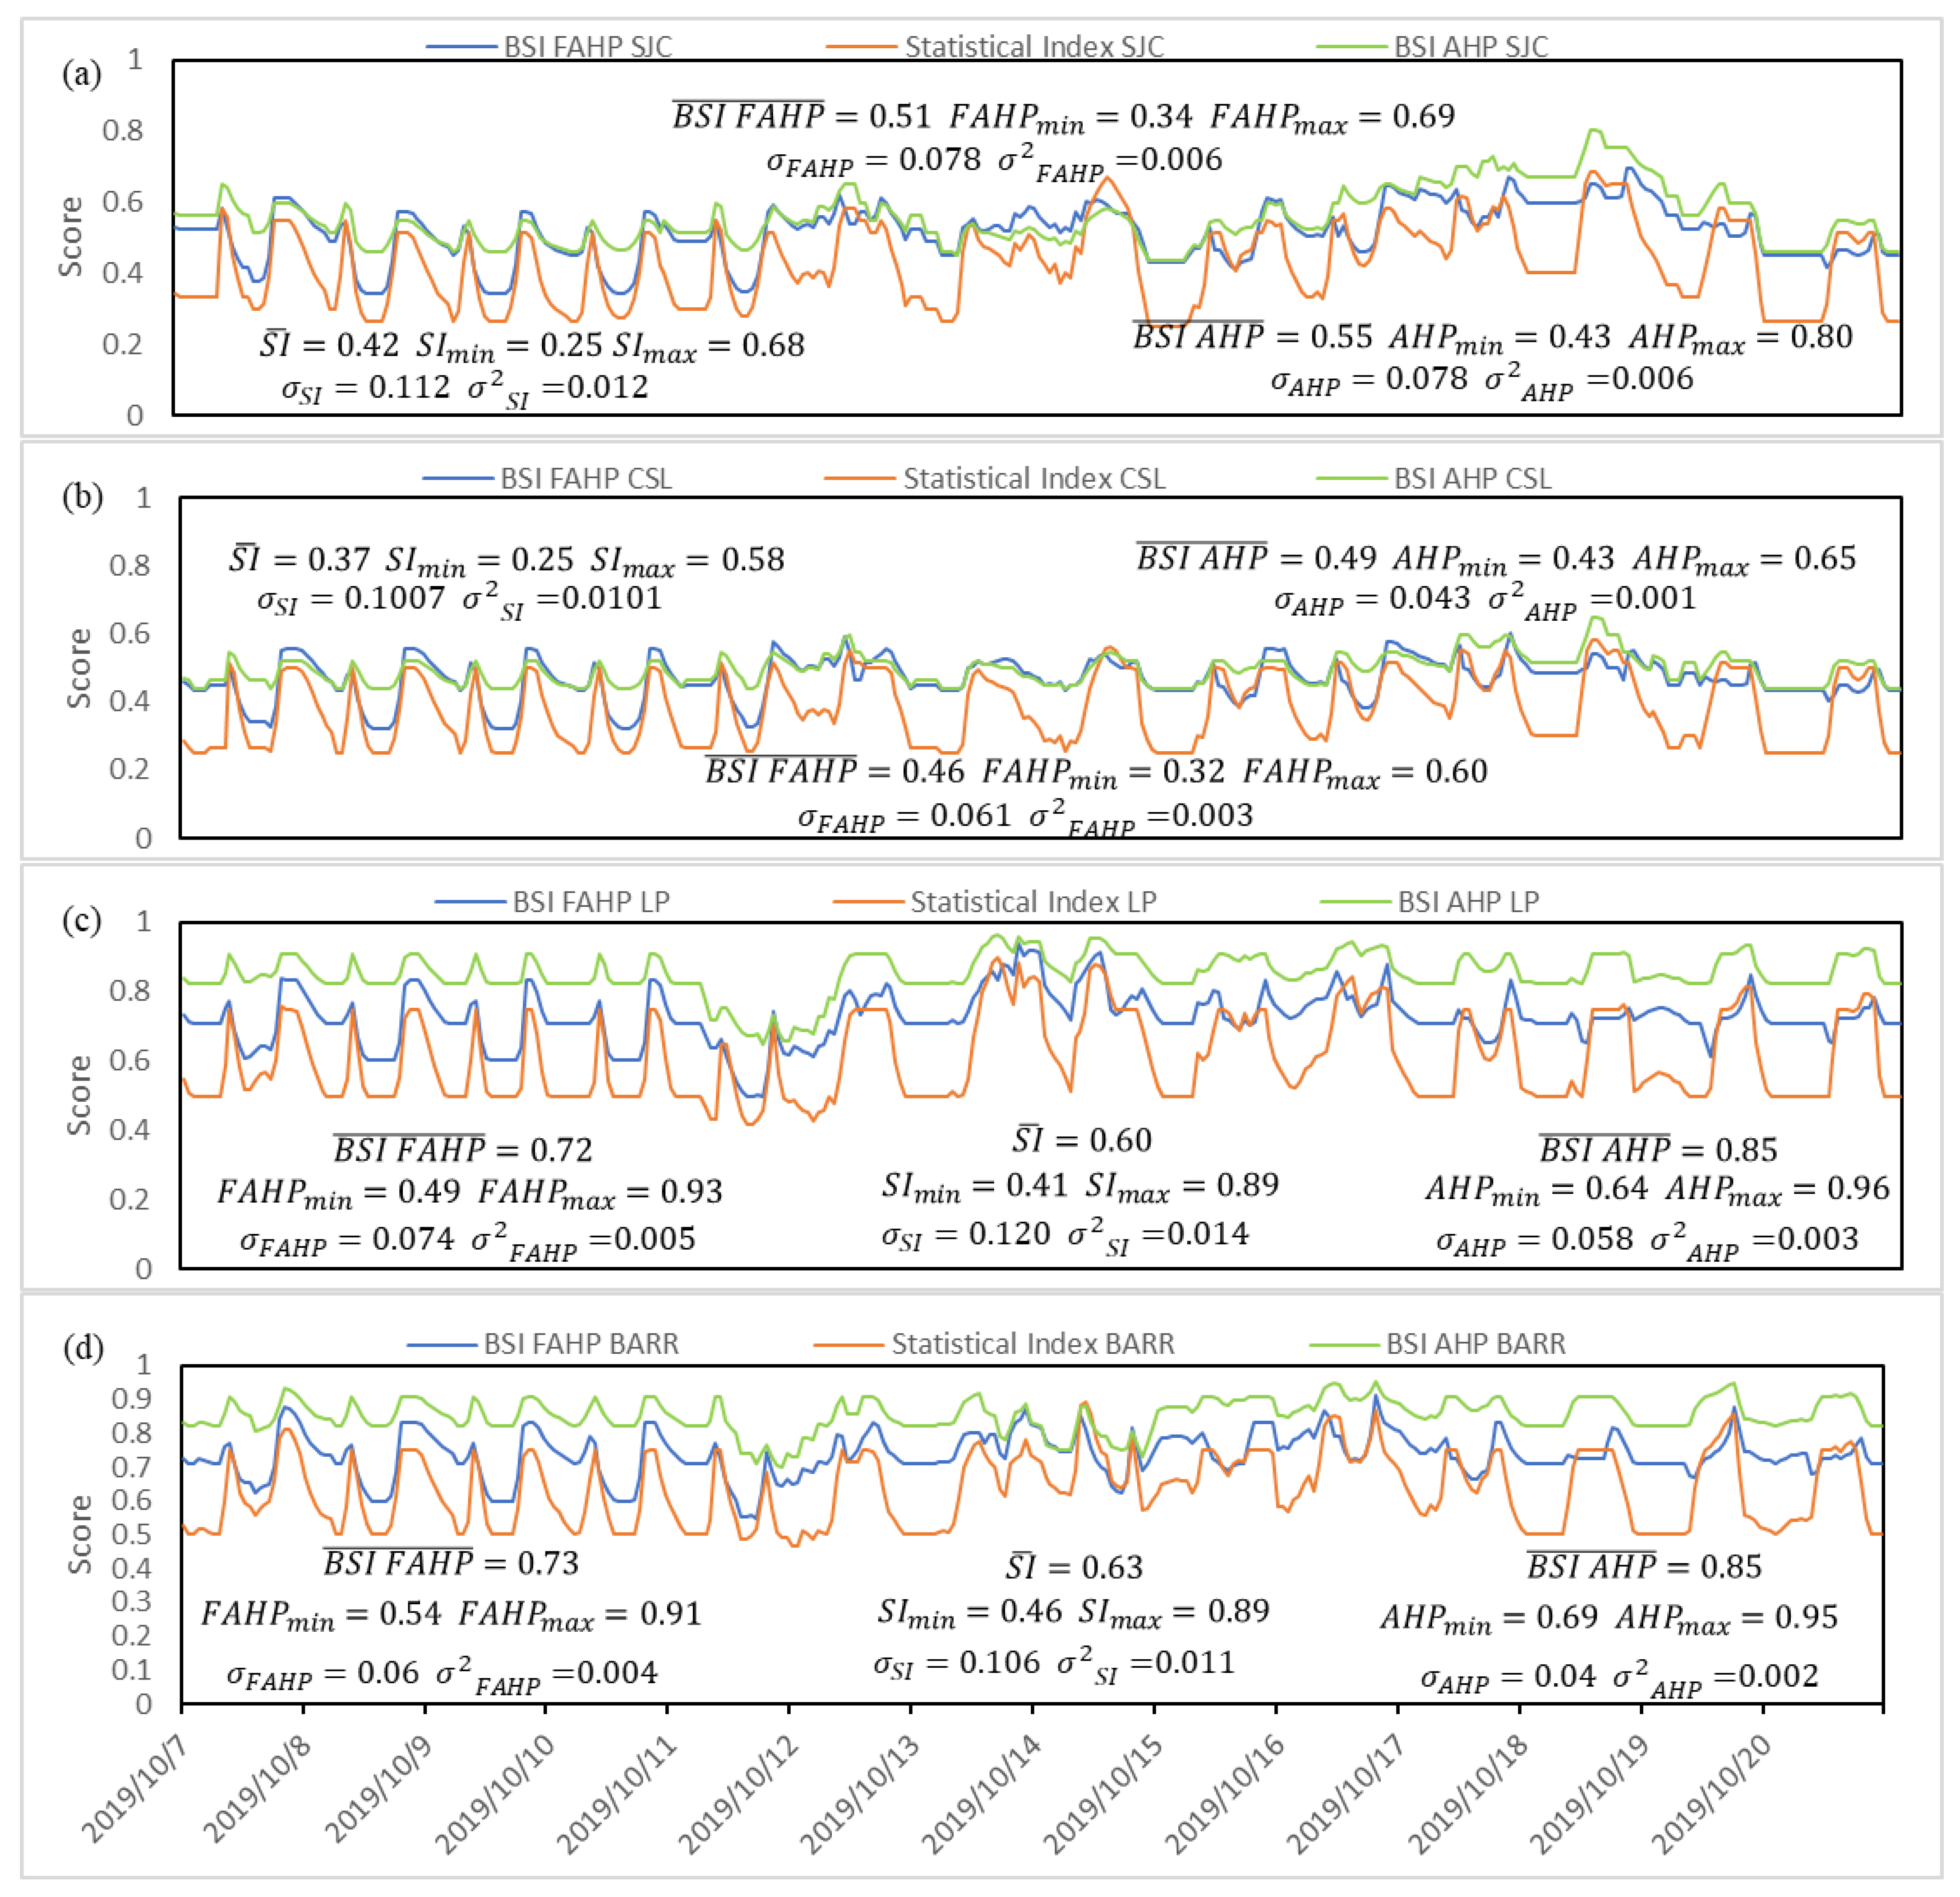
To validate the proposed approach, an index was generated using the methodology proposed by [6], taking into account only the four parameters considered in this study. This index is denominated as the statistical index (SI). Simultaneously, the proposed index is also compared against the approach presented by Dávila-Lamas [13], which also considers four parameters. For the three indexes, the fuzzy inputs are the same. The evolution of the BSI for Médano, Costa Azul, and Malecon beaches are shown in Figure 7, respectively, and are compared with the results of the SI and AHP models. The differences in the behavior of both indexes correspond to the differences in weights assigned for each model, while in the SI, all the parameters have the same weight. The proposed fuzzy AHP methodology calculates different weights for each parameter according to its relative importance, which is different from that calculated with the AHP approach because of the methodology differences and the changes in factor definitions and considerations. Moreover, the solar radiation is not considered in any of the comparison models. The statistical index retrieves a lower score for several samples, due to the fact that most of the parameters are out of their optimal ranges, and the weights assigned for all the parameters are equal. The BSI FAHP score is higher in these cases because the weight for those parameters is lower than the weights assigned for bathymetry and tide. Because of the above, the statistical model presented lower minimums and mean values, while the maximum values are almost equal to those obtained with BSI FAHP. In the case of the AHP index, the values obtained are generally greater than the ones calculated with the SI and BSI FAHP. Nevertheless, dangerous situations related to temperature, wind speed, and radiation are mostly ignored, since these parameters were assigned with a low importance weight. The BSI FAHP proposed in this work assigns weights of relative importance, in contrast with the SI, and considers the most common risks that can affect a beach visitor as criteria for defining the priority for each parameter, avoiding the risks associated when the parameters with lower importance are underestimated, contrary to the AHP index, and taking solar radiation into account.
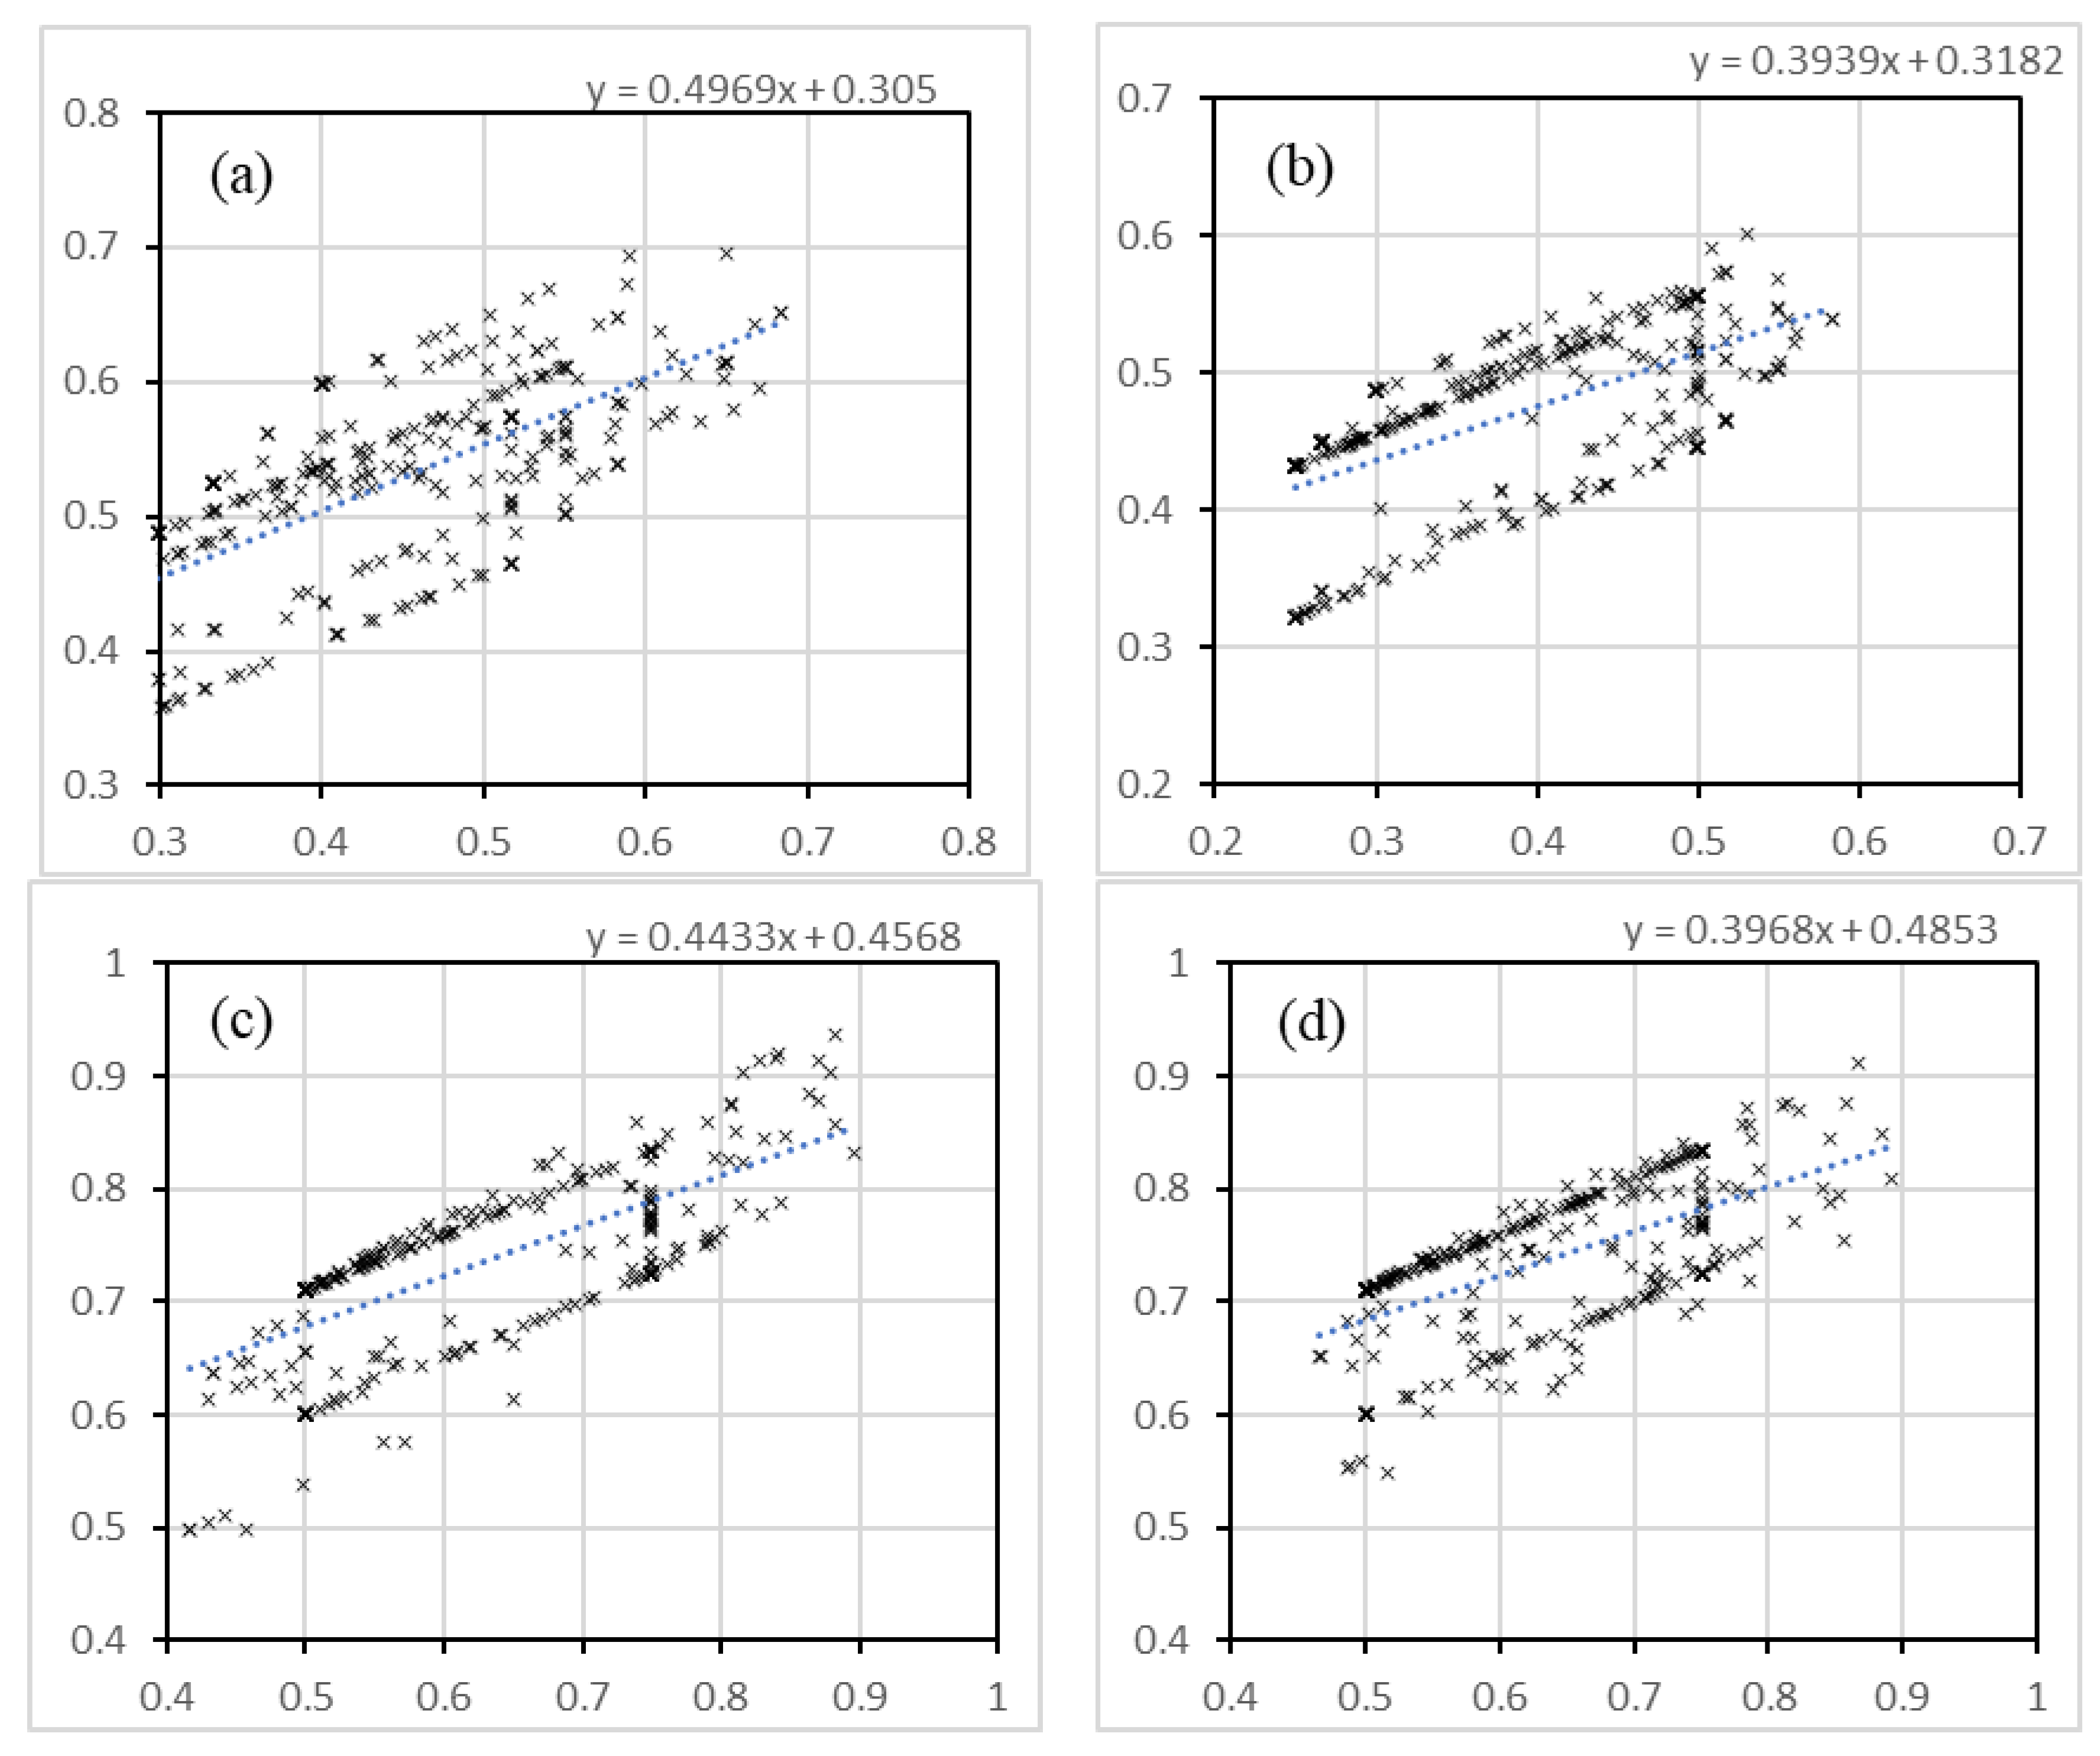
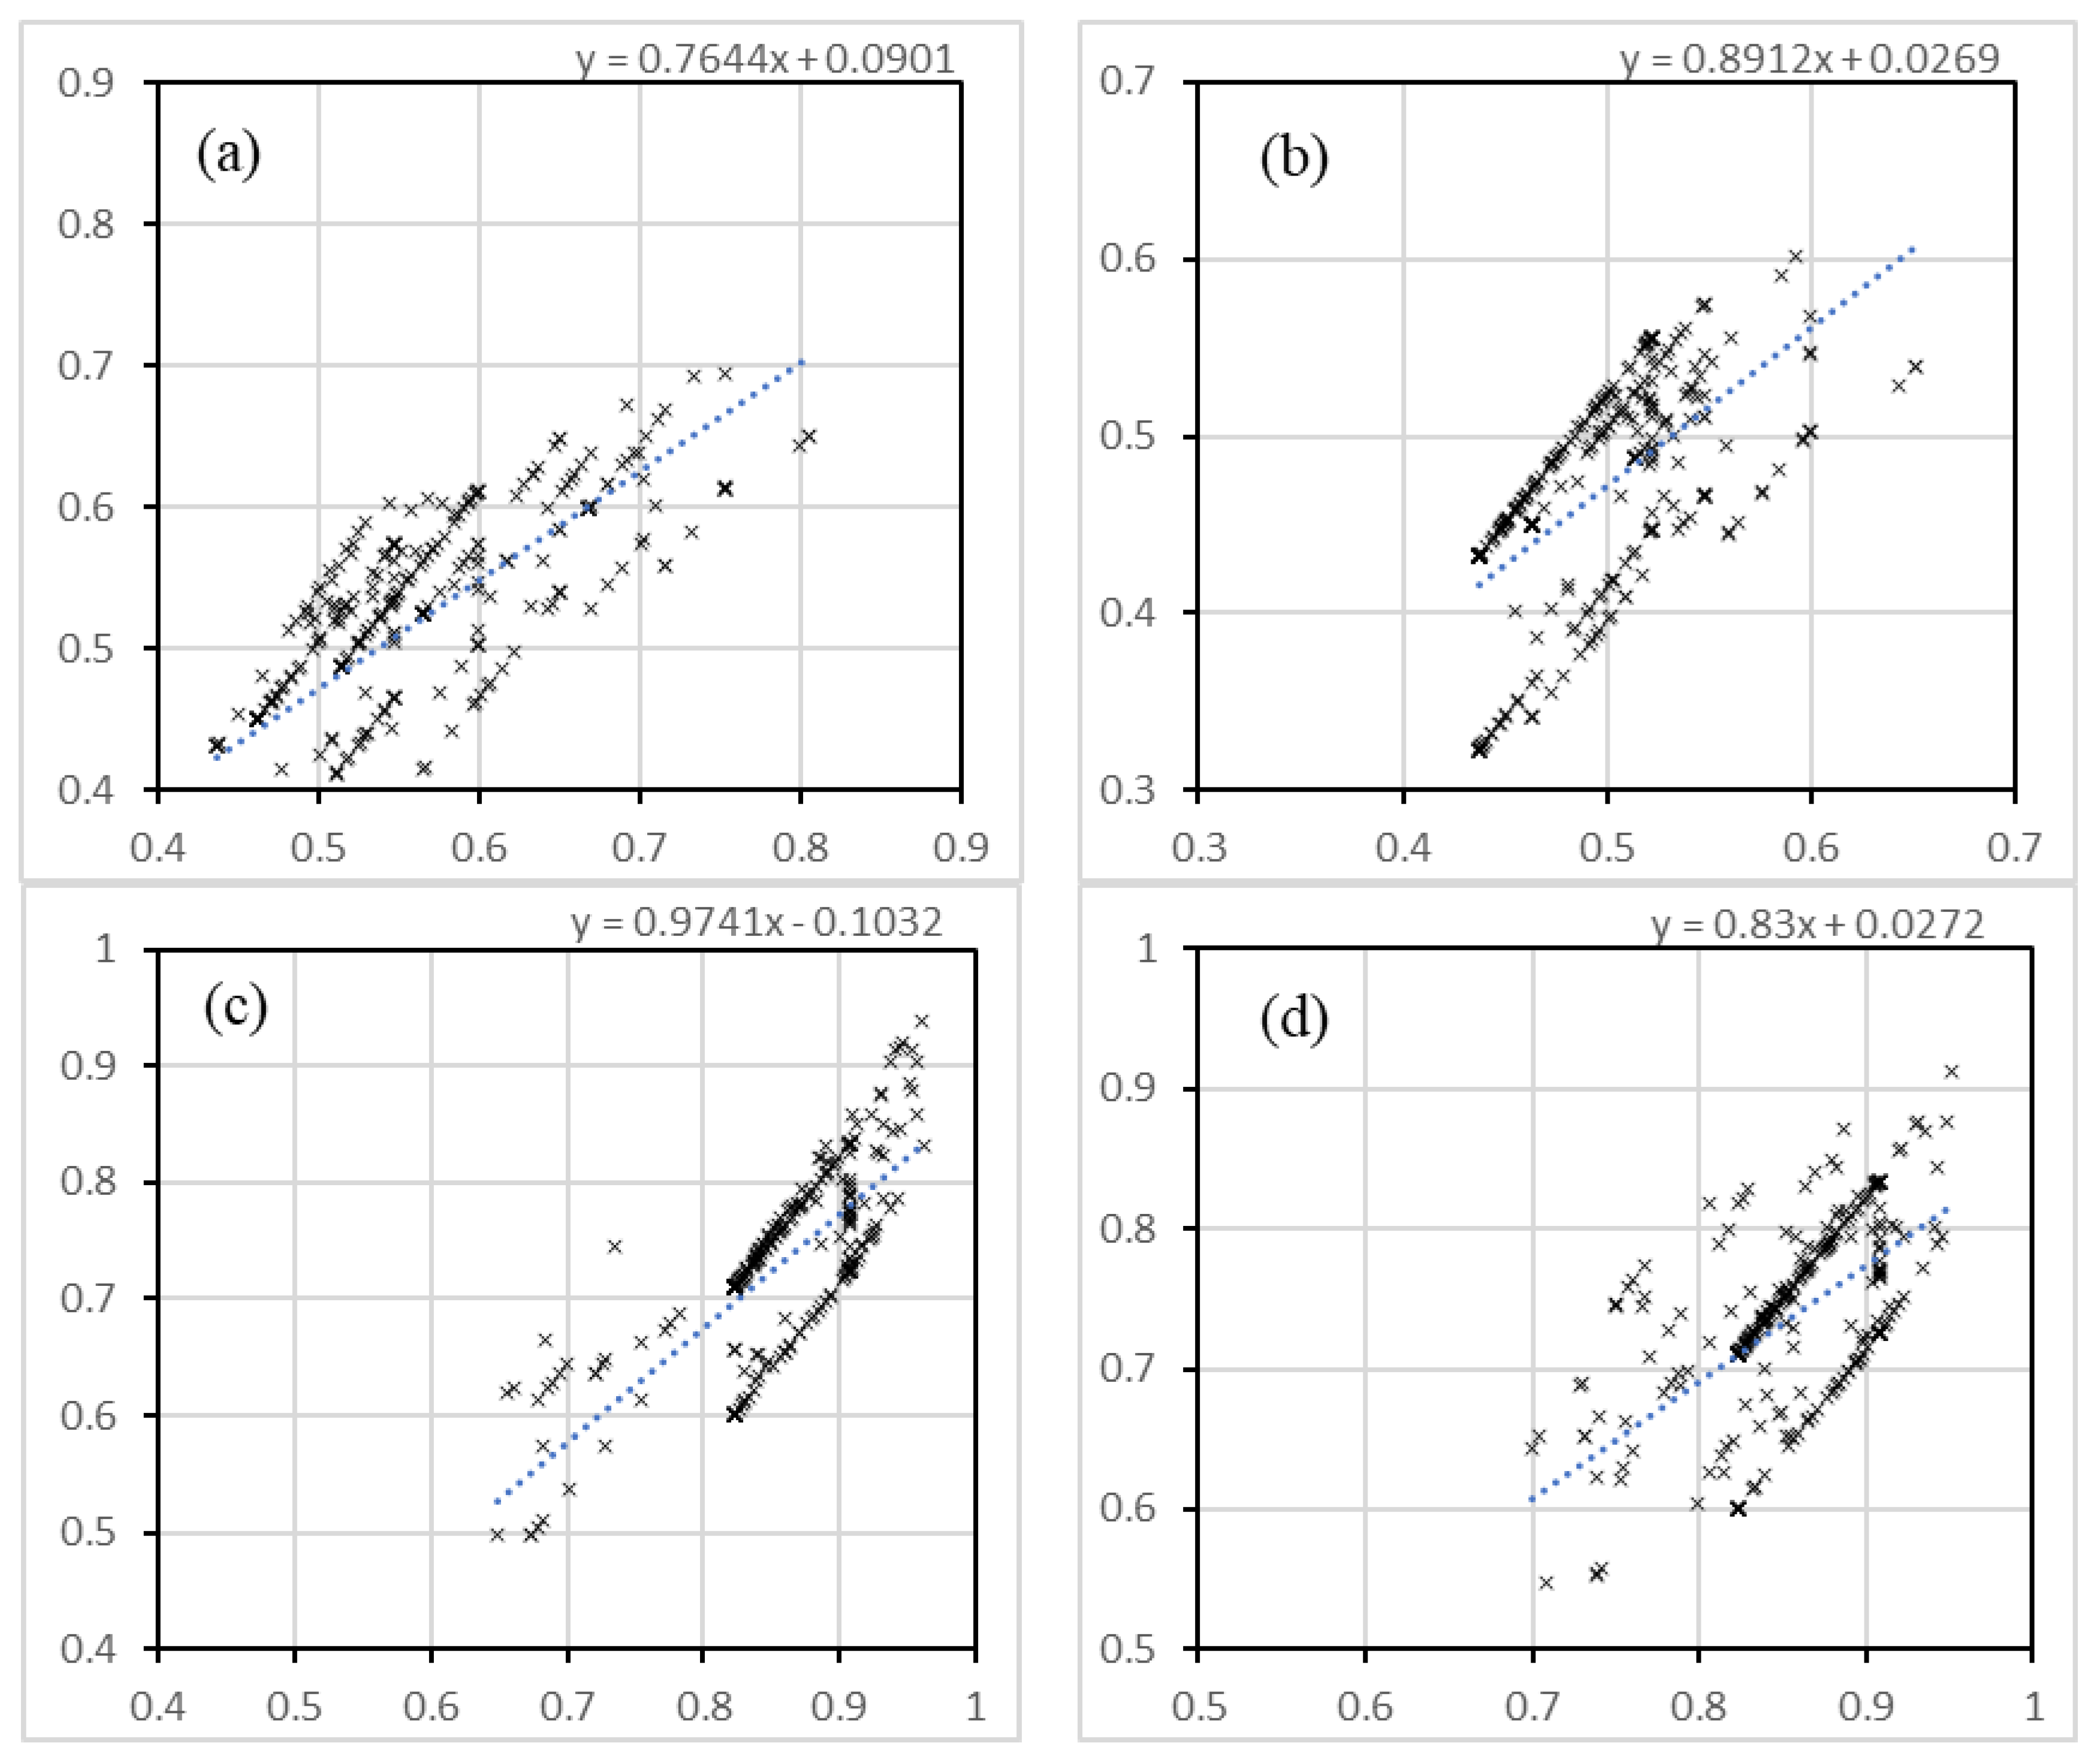
The standard deviation and variance were higher in the statistical index ( σ S I and σ 2 S I ), in comparison with the values obtained for the BSI FAHP model ( σ F A H P and σ 2 F A H P ), which are slightly greater than the ones obtained using the AHP approach ( σ A H P and σ 2 A H P ). Figure 8 shows the correlation between the SI and BSI FAHP indexes, while Figure 9 presents the correlation between BSI FAHP and BSI AHP; these plots are obtained by graphing the values of each comparison model against the values obtained with the BSI FAHP. In Table 9, some numerical examples of the more significant differences in the values obtained with both indexes are detailed, along with their input parameters.
Coastal studies are mainly focused on assessing tourist considerations about beach scenery [10,11] or beach quality [6], and while safety is one of the factors evaluated by some works [8], it is evaluated by subjective judgments, or by considering the presence or absence of personnel and infrastructure for attending emergencies. These evaluations neglect the natural events that could represent a risk for beach visitors. In contrast, the approach proposed in this work evaluates the safety conditions based on the analysis, study, and integration of physical, meteorological, and oceanographic parameters that can be monitored continuously. While in the work proposed by Micallef [8], safety is defined considering the capacity of response in case of emergency, in the approach presented in this paper, the definition of this aspect is derived from the monitoring of natural conditions on the beach, providing preventive information. Because of these differences, the BSI FAHP could not be directly and numerically compared against the previously mentioned works. While the Leatherman approach [6] considers the parameters studied in this work, its evaluation is not for safety, but the methodology for integrating all the parameters is used to generate the statistical index. The BSI provides a continuous assessment as opposed to the evaluations found in the literature, which only represent the conditions during the analysis. Thus, variations in these conditions and the risks involved in them are not taken into account. The results and comparisons against other models show the capability and advantages of the BSI index for risk assessment, providing relevant information about the safety conditions present in a beach zone and detecting good or bad moments during visits to these zones.

4. Conclusions

The computational model for the calculation of the BSI index proposed in this paper evaluates the safety conditions in beach zones, considering three principal risks for the tourist as factors, and five climatological and physical variables for the definition and calculation of each risk. The results of its implementation in four sites in Baja California Sur, México, are presented and discussed, successfully detecting the differences between the particular safety conditions of each of the sampling sites. Furthermore, continuous monitoring enables the model to reveal variations in the safety conditions during the sampling period. The proposal given in this work has been developed to provide information about excellent or bad conditions for tourist activities on beaches, taking into consideration the oceanographic and meteorological conditions at the site. The principal limitations of the case study detailed in this work are the variety in safety conditions, limited by the characteristics of the sampling sites and sampling period. Although the model generated in this research was applied to assess the safety of Mexican tourist beaches, it can be used in any tourist coastal zone in the world, simply by replacing input data with those of the locations of interest. This will allow for the testing of the model in a wider variety of conditions. For future work, more parameters have been proposed to be studied and analyzed, such as harmful wildlife, or ocean aspects; however, to consider more parameters in the FAHP methodology, the whole analysis must to be performed from the start. On the other hand, the integration of other techniques and computational models for better analysis is also proposed, such as the geospatial analysis, which could help improve the accuracy and granularity of the results, geographically differentiating the results in a beach zone. This model could be implemented to display to beach visitors the resultant evaluation in the form of a color-coded score, helping visitors to have a better understanding of the safety conditions in the location, and as a consequence, to avoid dangerous moments and areas, preventing accidents and providing a safe visit to tourist beaches. Safety and risk management has proven to be an efficient strategy of local administrations to improve the tourism offerings of their destinations, and consequently, to increase their regional economies.
Author Contributions

Conceptualization, L.P.S.-F.; Investigation, C.A.H.-R.; Project administration, V.B.N.-Z.; Writing—original draft, A.D.D.-L.; Writing—review & editing, J.J.C.-H. All authors have read and agreed to the published version of the manuscript.

Funding

This research was funded by Secretaría de Investigación y Posgrado del Instituto Politécnico Nacional under the grant number 20221917.

Informed Consent Statement

Informed consent was obtained from all subjects involved in the study.

Data Availability Statement

The data presented in this study are available on request from the corresponding author.

Acknowledgments

The authors wish to thank the following institutions for their support in developing this work: the Secretaría de Investigación y Posgrado del Instituto Politécnico Nacional (IPN), under the grants 20221917, and the National Council of Science and Technology (CONACYT), México.

Conflicts of Interest

The authors declare no conflict of interest.

References

  1. Secretaria de Turismo (SECTUR). Resultados de la Actividad Turística Enero 2018. 2018. Available online: http://www.datatur.sectur.gob.mx/SitePages/versionesRAT.aspx (accessed on 16 January 2019).
  2. Banco de México. Extracto del Reporte Sobre las Economías Regionales Enero—Marzo 2018. pp. 10–13. Available online: http://www.banxico.org.mx/ (accessed on 16 January 2019).
  3. Matthews, B.; Andronaco, R.; Adams, A. Warning signs at beaches: Do they work? Saf. Sci. 2014, 62, 312–318. [Google Scholar] [CrossRef]
  4. Hammerton, C.E.; Brander, R.W.; Dawe, N.; Riddington, C.; Engel, R. Approaches for beach safety and education in Ghana: A case study for developing countries with a surf coast. Int. J. Aquat. Res. Educ. 2013, 7, 8. [Google Scholar] [CrossRef] [Green Version]
  5. Silva-Cavalcanti, J.S.; Costa, M.F.; Pereira, P.S. Rip currents signaling and users behavior at an overcrowded urban beach. Ocean Coast. Manag. 2018, 155, 90–97. [Google Scholar] [CrossRef]
  6. Leatherman, S. Beach rating: A methodological approach. J. Coast. Res. 1997, 13, 253–258. [Google Scholar]
  7. Leopold, L. Quantitative Comparison of Some Aesthetic Factors among Rivers; US Geological Survey: Washington, DC, USA, 1969; Volume 620.
  8. Micallef, A.; Williams, A.; Gallego, J. Bathing area quality and landscape evaluation on the Mediterranean coast of Andalucia, Spain. J. Coast. Res. 2011, 61, 87–95. [Google Scholar] [CrossRef]
  9. Campuzano, F.J.; Pierini, J.O.; Leitão, P.C.; Gómez, E.A.; Neves, R.J. Characterization of the Bahía Blanca estuary by data analysis and numerical modelling. J. Mar. Syst. 2014, 129, 415–424. [Google Scholar] [CrossRef]
  10. Ergin, A.; Karaesmen, E.; Micallef, A.; Williams, A.T. A new methodology for evaluating coastal scenery: Fuzzy logic systems. Area 2004, 36, 367–386. [Google Scholar] [CrossRef]
  11. Ergin, A.; Özölçer, İ.; Şahin, F. Evaluating coastal scenery using fuzzy logic: Application at selected sites in Western Black Sea coastal region of Turkey. Ocean Eng. 2010, 37, 583–591. [Google Scholar] [CrossRef]
  12. Blue Flag. 2019. Available online: http://www.blueflag.org (accessed on 10 October 2019).
  13. Dávila-Lamas, A.D.; Carbajal-Hernández, J.J.; Sánchez-Fernández, L.P.; Hoil-Rosas, C.A. Analytical Hierarchy Process Based Model for Safety Assessment of Coastal Touristic Locations. In Mexican Conference on Pattern Recognition; Springer: Cham, Switzerland, 2019; pp. 357–367. [Google Scholar]
  14. Dadda, A.; Ouhbi, I. A decision support system for renewable energy plant projects. In Proceedings of the 2014 International Conference on Next Generation Networks and Services (NGNS), Casablanca, Morocco, 28–30 May 2014; pp. 356–362. [Google Scholar]
  15. Deveci, M.; Gokasar, I.; Parada, P.R.B. A Comprehensive Model for Socially Responsible Rehabilitation of Mining Sites Using Q-rung Orthopair Fuzzy Sets and Combinative Distance-based Assessment. Expert Syst. Appl. 2022, 200, 117155. [Google Scholar] [CrossRef]
  16. Deveci, M.; Pamucar, D.; Gokasar, I.; Isik, M.; Coffman, D.M. Fuzzy Einstein WASPAS approach for the economic and societal dynamics of the climate change mitigation strategies in urban mobility planning. Struct. Chang. Econ. Dyn. 2022, 61, 1–17. [Google Scholar] [CrossRef]
  17. Huang, I.B.; Keisler, J.; Linkov, I. Multi-criteria decision analysis in environmental sciences: Ten years of applications and trends. Sci. Total Environ. 2011, 409, 3578–3594. [Google Scholar] [CrossRef] [PubMed]
  18. Ramanathan, R. A note on the use of the analytic hierarchy process for environmental impact assessment. J. Environ. Manag. 2001, 63, 27–35. [Google Scholar] [CrossRef] [PubMed] [Green Version]
  19. Secretaria de Turismo (SECTUR). Estudio de la Vulnerabilidad y Programa de Adaptación ante la Variabilidad Climática y el Cambio Climático en diez Destinos Turísticos Estratégicos, así Como Propuesta de un Sistema de Alerta Temprana a Eventos Hidrometeorológicos Extremos. 2014. Available online: http://www.sectur.gob.mx/wp-content/uploads/2014/09/SECCION-V.-LOS-CABOS.pdf (accessed on 5 February 2019).
  20. Gobierno de Baja California Sur. (z.d.). Población. Sistema Estatal Para la Planeación del Estado de Baja California Sur. Available online: http://sig.bcs.gob.mx/seip/app/estadistica_inf_estra_pob.htm (accessed on 22 April 2022).
  21. Castelle, B.; Scott, T.; Brander, R.W.; McCarroll, R.J. Rip current types, circulation and hazard. Earth-Sci. Rev. 2016, 163, 1–21. [Google Scholar] [CrossRef]
  22. Drozdzewski, D.; Shaw, W.; Dominey-Howes, D.; Brander, R.; Walton, T.; Gero, A.; Sherker, S.; Goff, J.; Edwick, B. Surveying rip current survivors: Preliminary insights into the experiences of being caught in rip currents. Nat. Hazards Earth Syst. Sci. 2012, 12, 1201–1211. [Google Scholar] [CrossRef] [Green Version]
  23. Drozdzewski, D.; Roberts, A.; Dominey, D.; Brander, R. The experiences of weak and non-swimmers caught in rip currents at Australian beaches. Aust. Geogr. 2015, 46, 15–32. [Google Scholar] [CrossRef]
  24. World Meteorological Organization. The Beaufort Scale of wind force. WMO Commission for Maritime Meteorology. Mar. Sci. Aff. Rep. 1970, 3, 1–22. [Google Scholar]
  25. Encyclopaedia Britannica. Douglas Scale|Oceanography. 2018. Available online: https://www.britannica.com/science/Douglas-scale (accessed on 16 June 2020).
  26. Alonso, R. Hidrología y Condiciones Ambientales que Determinan la Proliferación de Dinoflagelados Causantes de Marea roja en la Bahía de Mazatlán, Sin., México; National Council for Science and Technology: Mexico City, Mexico, 2004.
  27. Rodríguez, L. Revisión del fenómeno de Marea Roja en Chile. Rev. Biol. Mar 1985, 21, 173–197. [Google Scholar]
  28. Kim, D.; Matsuyama, Y.; Nagasoe, S.; Yamaguchi, M.; Yoon, Y.; Oshima, Y.; Imada, N.; Honjo, T. Effects of temperature, salinity and irradiance on the growth of the harmful red tide dinoflagellate Cochlodinium polykrikoides Margalef (Dinophyceae). J. Plankton Res. 2004, 26, 61–66. [Google Scholar] [CrossRef]
  29. World Health Organization (WHO); International Commission on Non-Ionizing Radiation Protection. Global Solar UV Index: A Practical Guide; WHO: Geneva, Switzerland, 1995. [Google Scholar]
  30. Gutiérrez, J.; Riss, W.; Ospina, R. Lógica Difusa como herramienta para la bioindicación de la calidad del agua con macroinvertebrados acuáticos en la sabana de Bogotá-Colombia/Application of fuzzy logic as bioindication tool for the water quality with aquatic macroinvertebrates in the Sabana de Bogotá-Colombia. Caldasia 2004, 26, 161–172. [Google Scholar]
  31. Wang, Y.; Jung, K.; Yeo, G.; Chou, C. Selecting a cruise port of call location using the fuzzy-AHP method: A case study in East Asia. Tour. Manag. 2014, 42, 262–270. [Google Scholar] [CrossRef]
  32. Van Laarhoven, P.; Pedrycz, W. A fuzzy extension of Saaty’s priority theory. Fuzzy Sets Syst. 1983, 11, 229–241. [Google Scholar] [CrossRef]
  33. Saaty, T.L. Decision making with the analytic hierarchy process. Int. J. Serv. Sci. 2008, 1, 83–98. [Google Scholar] [CrossRef] [Green Version]
  34. Chang, D. Applications of the extent analysis method on fuzzy AHP. Eur. J. Oper. Res. 1996, 95, 649–655. [Google Scholar] [CrossRef]
  35. Veerabathiran, R.; Srinath, K.A. Application of the extent analysis method on fuzzy AHP. Int. J. Eng. Sci. Technol. 2012, 4, 3472–3480. [Google Scholar]
  36. Deng, H. Multicriteria analysis with fuzzy pairwise comparison. Int. J. Approx. Reason. 1999, 21, 215–231. [Google Scholar] [CrossRef] [Green Version]
  37. ITES. Instituto Técnológico de Estudios Superiores. 2019. Available online: http://www.itesloscabos.edu.mx (accessed on 5 February 2019).
  38. CICIMAR. Centro Interdisciplinario de Ciencias Marinas. 2019. Available online: https://www.cicimar.ipn.mx/ (accessed on 5 February 2019).
  39. FONATUR. Fondo Nacional de Fomento al Turismo. 2019. Available online: https://www.gob.mx/fonatur (accessed on 5 February 2019).
  40. Los Cabos, B.C.S.; ZOFERMAT. Zona Federal Marítima; Governmental Organization: Mexico City, Mexico, 2019.
  41. Dano, U.L. Flash Flood Impact Assessment in Jeddah City: An Analytic Hierarchy Process Approach. Hydrology 2020, 7, 10. [Google Scholar] [CrossRef] [Green Version]
  42. Weather West End—Meteoblue. Available online: https://www.meteoblue.com (accessed on 5 May 2022).
  43. Windy as Forecasted. Available online: https://www.windy.com (accessed on 5 May 2022).
Figure 1. Sampling sites monitored: Médano Beach in Cabo San Lúcas, Costa Azul Beach in San Jose del Cabo, Malecon Beach in La Paz, and Barriles Beach in Los Barriles, all located at Southern Baja California, México.
Sustainability 14 05972 g001
Figure 2. Flowchart of the proposed model used for computing the BSI index.
Sustainability 14 05972 g002
Figure 3. Definition of possibility degree functions M1 and M2.
Sustainability 14 05972 g003
Figure 4. Parameter measurements were used for assessing safety conditions in México: Costa Azul Beach in San Jose del Cabo (SJC), Médano Beach in Cabo San Lúcas (CSL), and Malecon Beach in La Paz (LP). (a) Wind speed (b) Temperature (c) Solar radiation (d) Tide.
Sustainability 14 05972 g004
Figure 5. Fuzzy assessment for input parameters. (a) Wind speed (b) Temperature (c) Solar radiation (d) Tide.
Sustainability 14 05972 g005
Figure 6. Safety assessment using the BSI index for the Costa Azul, Médano, Malecon, and Barriles beaches.
Sustainability 14 05972 g006
Figure 7. Safety assessment using the BSI FAHP index compared against the SI and the BSI AHP. (a) Costa Azul Beach at San José del Cabo. (b) Médano Beach at Cabo San Lúcas. (c) Malecon Beach at La Paz. (d) Barriles Beach at Los Barriles.
Sustainability 14 05972 g007
Figure 8. Correlation between the BSI FAHP and the statistical index. (a) Costa Azul Beach at San José del Cabo. (b) Médano Beach at Cabo San Lúcas. (c) Malecon Beach at La Paz. (d) Barriles Beach at Los Barriles.
Sustainability 14 05972 g008
Figure 9. Correlation between the BSI FAHP and BSI AHP. (a) Costa Azul Beach at San José del Cabo. (b) Médano Beach at Cabo San Lúcas. (c) Malecon Beach at La Paz. (d) Barriles Beach at Los Barriles.
Sustainability 14 05972 g009
Table 1. Literature Summary.
AuthorContribution
Matthews et al. (2014) [3]Analysis of interviews with beach visitors; almost half of them did not see safety signals.
Hammerton et al. (2013) [4]Analysis of interviews with local people; 82% of them knew someone who had drowned. A significant number of drownings occurred on the wave-dominated coast.
Silva-Cavalcanti et al. (2018) [5]Study of incidents location. Safety conditions do not correspond to the warning signals.
Leatherman (1997) [6]General beach evaluation and ranking of quality.
Micallef et al. (2011) [8]Quantitative assessment of beach quality. Safety is evaluated considering the infrastructure and response capacity for an emergency.
Campuzano et al. (2014) [9]Characterization of Bahia Blanca, Argentina, employing numerical modeling and data analysis to improve understanding of the dominant hydrodynamic process.
Ergin et al. (2010) [11]An assessment model was developed for analyzing visual scenery for beaches in Turkey using fuzzy logic.
Dávila-Lamas et al. (2019) [13]Safety index based on AHP methodology and considering bathymetry, tide, temperature, and wind speed.
Deveci et al. (2022) [15]CODAS-based model to identify the best rehabilitation solution for abandoned mines.
Deveci et al. (2022)WASPAS-based model to prioritize climate change mitigation strategies for urban planning.
Huang et al. (2011) [17]Comparison between MCDM models.
Table 2. Permissible ranges for safety parameters.
Safety ParametersCategoriesOptimal RangeUnitsFuzzy Limits
abcd
Tide (d)Slight0–1.25m000.52.5
Moderate
Rough
Temperature (t)Tempered28–31°C25283135
Warm
Wind (s)Calm7–22knots7131722
Light breeze
Breeze
Radiation (r)Low0–0.075W/ m 2 000.0750.262
Moderate
High
Bathymetry (b)Exposed0–2.5m002.55
Very Shallow
Shallow
Table 3. Linguistic scale conversion to triangular fuzzy functions.
Linguistic ScaleFuzzy ScaleReciprocal
Just Equal(1, 1, 1)(1, 1, 1)
Equally important(1/2, 1, 3/2)(2/3, 1, 2)
Moderately important(1, 3/2, 2)(1/2, 2/3, 1)
Strongly important(3/2, 2, 5/2)(2/5, 1/2, 2/3)
Very strongly important(2, 5/2, 3)(1/3, 2/5, 1/2)
Absolutely important(5/2, 3, 7/2)(2/7, 1/3, 2/5)
Table 4. Comparison levels between factors.
FactorF1F2F3Weight
F1: Drowning risk(1, 1, 1)(3/2, 2, 5/2)(2, 5/2, 3)0.7639
F2: Environmental risk(2/5, 1/2, 2/3)(1, 1, 1)(1/2, 1, 3/2)0.0825
F3: Red tide risk(1/3, 2/5, 1/2)(2/3, 1, 2)(1, 1, 1)0.1536
Sum:1
Table 5. Parameter comparison according to F1: drowning risk.
ParameterDtsrbWeight
(d) Tide(1, 1, 1)(3/2, 2, 5/2)(1, 3/2, 2)(3/2, 2, 5/2)(2/3, 1, 2)0.3341
(t) Temp(2/5, 1/2, 2/3)(1, 1, 1)(2/3, 1, 2)(1, 1, 1)(1/3, 2/5, 1/2)0.0765
(s) Wind(1/2, 2/3, 1)(1/2, 1, 3/2)(1, 1, 1)(1/2, 1, 3/2)(2/5, 1/2, 2/3)0.1101
(r) Rad(2/5, 1/2, 2/3,)(1, 1, 1)(2/3, 1, 2)(1, 1, 1)(1/3, 2/5, 1/2)0.0765
(b) Bat(1/2, 1, 3/2)(2, 5/2, 3)(3/2, 2, 5/2)(2, 5/2, 3)(1, 1, 1)0.4027
Sum:1
Table 6. Parameter comparison according to F2: environmental risk.
ParameterDtsbrWeight
(d) Tide(1, 1, 1)(2/3, 1, 2)(1/2, 2/3, 1)(1/3, 2/5, 1/2)(1, 1, 1)0.1066
(t) Temp(1/2, 1, 3/2)(1, 1, 1)(2/3, 1, 2)(2/5, 1/2, 2/3)(1/2, 1, 3/2)0.1636
(s) Wind(1, 3/2, 2)(1/2, 1, 3/2)(1, 1, 1)(2/3, 1, 2)(1, 3/2, 2)0.2479
(r) Rad(2, 5/2, 3)(3/2, 2, 5/2)(1/2, 1, 3/2)(1, 1, 1)(2, 5/2, 3)0.3753
(b) Bat(1, 1, 1)(2/3, 1, 2)(1/2, 2/3, 1)(1/3, 2/5, 1/2)(1, 1, 1)0.1066
Sum:1
Table 7. Parameter comparison according to F3: red tide risk.
ParameterDtsbrWeight
(d) Tide(1, 1, 1)(2/5, 1/2, 2/3)(1/3, 2/5, 1/2)(2/3, 1, 2)(1/2, 1, 3/2)0.0907
(t) Temp(3/2, 2, 5/2)(1, 1, 1)(2/3, 1, 2)(1, 3/2, 2)(2, 5/2, 3)0.3391
(s) Wind(2, 5/2, 3)(1/2, 1, 3/2)(1, 1, 1)(3/2, 2, 5/2)(5/2, 3, 7/2)0.4039
(r) Rad(1/2, 1, 3/2)(1/2, 2/3, 1)(2/5, 1/2, 2/3)(1, 1, 1)(1, 3/2, 2)0.1291
(b) Bat(2/3, 1, 2)(1/3, 2/5, 1/2)(2/7, 1/3, 2/5)(1/2, 2/3, 1)(1, 1, 1)0.0372
Sum:1
Table 8. Parameter comparison considering all factors and weights.
ParameterdtsRbFactor Weightsdtsrb
Factors
F10.33410.07650.11010.07650.40270.76390.2550.0580.0840.0580.308
F20.10660.16360.24790.37530.10660.08250.0090.0140.020.0310.009
F30.09070.33910.40390.12910.03720.15360.0140.0520.0620.020.006
Final score10.2780.1240.1660.1090.323
Table 9. Numerical comparison between evaluations for the BSI and SM indexes.
NoDateTimePlaceTideWind SpeedTempRadSIConditionBSI AHPConditionBSI FAHPCondition
18 October 201920:00CSL1.32.1429.1600.5Regular0.52Regular0.55Regular
29 October 201905:00LP0.22.3324.3600.5Regular0.82Good0.71Good
39 October 201909:00LP0.20.8630.410.170.75Good0.90Excellent0.77Good
411 October 201919:00BARR0.87.828.350.050.68Regular0.76Good0.74Good
514 October 201900:00SJC1.911.0025.3200.44Bad0.50Regular0.55Regular
614 October 201909:00CSL1.86.3627.30.070.44Bad0.50Regular0.52Regular
714 October 201911:00BARR0.812.4531.330.410.85Excellent0.83Good0.75Good
814 October 201913:00SJC1.711.0728.000.200.66Regular0.58Regular0.59Regular
915 October 201913:00LP0.14.3431.670.390.70Good0.89Excellent0.70Good
1016 October 201909:00LP0.28.4827.740.080.79Good0.92Excellent0.85Excellent
1116 October 201910:00BARR0.39.3028.940.160.84Good0.94Excellent0.84Good
1216 October 201921:00CSL1.21.9427.9600.51Regular0.54Regular0.57Regular
1317 October 201915:00BARR0.32.3633.010.510.62Regular0.86Excellent0.66Regular
1418 October 201912:00SJC0.72.4330.60.510.68Regular0.80Good0.65Regular
1519 October 201912:00CSL1.22.0628.410.310.51Regular0.54Regular0.46Bad
1619 October 201913:00SJC14.6229.090.580.58Regular0.65Regular0.53Regular
1719 October 201915:00LP0.37.4429.650.410.76Good0.91Excellent0.73Good
1819 October 201916:00BARR0.38.6829.630.310.82Good0.93Excellent0.77Good
1920 October 201908:00SJC1.26.3622.510.020.26Bad0.46Bad0.45Bad
2020 October 201910:00CSL1.52.3727.330.320.44Bad0.50Regular0.41Bad
Publisher’s Note: MDPI stays neutral with regard to jurisdictional claims in published maps and institutional affiliations.