Article

Learning Loss Recovery Dashboard: A Proposed Design to Mitigate Learning Loss Post Schools Closure

by
Tahani I. Aldosemani
1,* and
Ahmed Al Khateeb
2
1
Department of Educational Studies, College of Education, Prince Sattam Bin Abdulaziz University, Al-Kharj 16278, Saudi Arabia
2
Department of English, College of Arts, King Faisal University, Al Ahsa 31982, Saudi Arabia
*
Author to whom correspondence should be addressed.
Sustainability 2022, 14(10), 5944; https://doi.org/10.3390/su14105944
Submission received: 22 February 2022 / Revised: 11 April 2022 / Accepted: 9 May 2022 / Published: 13 May 2022
(This article belongs to the Special Issue Post-pandemic Technology Enhanced Language Learning)

Abstract

:
Research has shown the effectiveness of designing a Learning Analytics Dashboard (LAD) for learners and instructors, including everyone’s levels of progress and performance. An intertwined relationship exists between learning analytics (LA) and the learning process. Understanding information or data about learners and their learning journey can contribute to a deeper understanding of learners and the learning process. The design of an effective learning dashboard relies heavily on LA, including assessment of the learning process, i.e., gains and losses. A Learning Loss Recovery Dashboard (LLRD) can be designed as an instructional tool, to support the learning process as well as learners’ performance and their academic achievement. The current project proposes a LLRD prototype model to deal with potential learning loss; increase the achievement of learning outcomes; and provide a single, comprehensive learning process, where schools can evaluate and remedy any potential learning loss resulting from the distance-learning period that was caused by the COVID-19 pandemic. This systematic dashboard prototype functions to determine learning gains by K–12 learners. It is expected that the implementation of the proposed dashboard would provide students, teachers, and educational administrators with an integrated portal, for a holistic and unified remedial experience for addressing learning loss.

1. Introduction

LAD is an instrument that enables school personnel to distinguish learning deficiencies via a convenient method, by offering advanced analytical approaches, e.g., visual representation of interaction [1]. Instructors need to be familiar with interpreting and observing different forms of visualizations (i.e., charts and graphs), which can represent the development of learners [2]. Vieira et al. [3] have proposed that the sound design of LAD should embrace a thorough analysis of diverse data, to result in numerous visualizations that would help instructors to identify effective facilitation approaches and what learners might lose throughout the process of learning. Furthermore, Gutiérrez et al. [4] and Zheng et al. [5] stated the value of LAD for teaching efficiency, learning outcomes, and support of efficient decision-making. It is, also, considered an enabler for identifying at-risk learners or groups, making the process more effortless and less time-consuming [6].
LAD depends primarily on the field of Learning Analytics (LA), which has been dealt with extensively as a promising methodology for analyzing digital data and adaptive learning environments [7]. LA deals with the analysis of structured (motivational measures of academic procrastination) and unstructured (students’ posts on social media) data, as well as information related to learners and their educational institutions, for the purpose of understanding and optimizing learning, including the context in which it occurs [8]. Rienties and Toetenel [9] state that LA improves instructors’ design practices. LA empowers both instructors and learners to enhance human judgment [10]. Charleer et al. [11] suggest that LA dashboards could be used as powerful metacognitive tools for learners, to consider the required efforts that should be invested in the learning activities and to set goals in order to attain learning outcomes.
Nevertheless, this concept is spreading, broadly, to include several potential definitions. For example, Hwang et al. [12] refer to LA as “the analysis and interpretation of educational data, such as the logs recorded in learning management systems, the interactive contents recorded in online discussion forums, or the learning process captured on video, to provide constructive feedback to learners, instructors or educational policymakers” (p. 134). Liu et al. [13], also, assert that LA is “a conceptual framework and as a part of our Perception education used to analyze and predict students’ performance and provide timely interventions based on student learning profiles” (p. 221). This definition is congruent with the aim of the current research, as it focuses on the role of LA in providing more satisfactory learning outcomes and lessening learning loss. The current study focuses on the use of LA by instructors and learners in K–12 education, with the purpose of using LA to detect learning loss among learners and determine how such learning loss can be addressed. This paper is a conceptual discussion of system design for the learner experience, to mitigate the impact of potential learning loss post-COVID-19 pandemic. The prototype design is explained in the paper, and the implementation will be reported in another study, after applying the conceptual design.
LAD should be designed and evaluated as a set of pedagogical tools, to catalyze change based on the multiple categories of LA, as outlined by the Society for Learning Analytics Research (SOLAR). Such categories are as follows: (1) The diagnostic analytics tool discovers underlying patterns in the data, to find key performance indicators and metrics to support student engagement. (2) The descriptive analytics tool provides insight into the past and descriptive reports for stakeholders. (3) The predictive analytics tool aims to understand underlying patterns in historical data as well as apply statistical models and algorithms to examine relationships. Last, and most advanced, (4) the prescriptive analytics tool provides advice regarding possible outcomes by recommending choices, using machine learning, business rules, and other types of computational models.
LAD aimed at instructors informs them of a learner’s status and progress, facilitating class management, provision of feedback, and evaluation and grading. Dashboards aimed at learners are mainly used as a tool to increase their awareness of their performance and enhance their ability to self-regulate their learning to achieve learning goals. LAD has been defined as ‘the measurement, collection, analysis, and reporting of data about learners and their contexts, for purposes of understanding and optimizing learning and the environments in which it occurs’ (Siemens & Gaševíc, [14], p. 1). One of the main challenges related to LA is that it is not deeply grounded in the learning sciences [15]. LA acts as a ‘middle space’ [16] where technology intersects with learning sciences, so it should be approached as an educational approach guided by pedagogy and not vice versa. Emphasis has been placed on the computation of the data and generating predictive models. Now there is a need for more attention on learning and LA, with student outcomes at the center and the focus of improvement endeavors [17]. According to Wise [18], learners need four principles of pedagogical learning analytics for useful interpretation of data and productive use of LA: integration, agency, reference frame, and dialogue. As far as the reference frame is concerned, Jivet [19] identified three types of reference frames: (i) social, i.e., comparison with other peers; (ii) achievement, i.e., in terms of goal achievement; and (iii) progress, i.e., comparison with an earlier self. The three reference frames are, also, classified by the planned time of comparison. The social reference frame focuses on the present, facilitating the learner’s comparison of their current performance levels to their peers at the same point in time. The achievement reference frame is future-based and directs learners to aim for goals. Finally, the progress reference frame is anchored in the past; learners rely on it to evaluate their previous achievements.
Among the most recommended practices for the design and integration of LA, based on the learning sciences, is the design of dashboards as pedagogical tools that enhance awareness and reflection, as a means to catalyze changes in the cognitive, behavioral, and emotional competences. Educational concepts from the learning sciences should be used to motivate design decisions. Dashboards should be customized to provide the same support to all users. This requires identifying the group of learners that will benefit the most in the planning stage, before customizing the design, accordingly. More importantly, dashboard evaluation should use data triangulation to validate its effects with self-reported data, tracked data, and assessment data, all of which should influence the assessment of the design features based on educational concepts [2,20]. Evidence shows that LAD should move away from a ‘one-size-fits-all’ approach. Design should incorporate external factors, including instructional conditions and timeliness of feedback, as well as internal factors, including goals and self-efficacy, all of which affect the academic success of learners [21,22].
Therefore, the driving forces for conducting this study rely on the necessity to, appropriately, employ the effectiveness of LA to measure learning loss through designing an accurate dashboard. The identification of a unique dashboard for every learner is essential, since every individual student’s learning trajectory leading up to the pandemic was different. Another motivation for this study is to determine the current learning trajectories, to projected learning trajectories that likely would have occurred if learning was not interrupted by the pandemic, which is considered as a key to assessing learning loss and setting up a growth recovery plan.

2. Related Work and Background (Needs for Designing a Learning Analytics Dashboard—LAD)

School closures, due to the COVID-19 pandemic, have left over a billion students out of school. Most school campuses closed due to the pandemic, with either an abrupt or staggered transition to distance education during the 2020–2021 school year, with increasing global concerns upon re-opening. Furthermore, learning loss is expected to be more significant for low-income students and members of vulnerable groups, given the disparities in technology access, attendance, and live instruction for distance learning, during the school year affected by the pandemic. The pandemic has amplified most educational challenges, with most systemic mechanisms for accurate reporting of critical knowledge and skills acquired and reflected in the school curriculum.
Learning loss can be defined as the difference between a current learning level versus the ideal or normal condition. In this case, it is the difference between the learning that occurred during disruption and the learning that would have taken place in a COVID-19-free school year. [23]. This shows the difficulty of measuring learning loss, since with normal schooling conditions, the comprehensive standardized tests that cover a sample of grade-level typical results can be compared to COVID-19-free school year results, revealing the difference by grade, subject area, and student group. This will facilitate tracking the impact and its possible consequences [24]. However, this typical understanding of learning loss can be measured through the identification of grade level, subject area, and student group, to determine the difference and its effect on students’ entering new grade-level content each year [25]. This measurement cannot be applicable to learning loss caused by the pandemic disruption, due to the difference between achievement and comprehensive standardized-exam-testing goals.
Learning loss can affect students’ readiness in their next grade-level transition and can cause evident difficulties accessing content each year. [26]. The learning loss measurement should consider students’ assessment on learning outcomes, according to state standards, as well as the potential learning loss resulting from school closure, representing that those two achievement gaps are expected [27]. Educational policies and decision makers should consider gaps in proficiency levels, to identify the impact of these gaps on the performance of the education system and to examine the magnitude of these gaps for larger systemic losses [28]. This requires huge efforts to be made on students’ reentry, which should include customized plans of diagnosis for proper proficiency placement and extensive testing mechanisms, in addition to plans for the remediation and reorganization of school days and hours. There is also a need to adopt new learning models, with teaching strategies that combine face-to-face and online teaching with informal testing, to address COVID-19-related achievement gaps, focus on high-quality classroom assessment systems, and implement powerful formative assessment practices [29].
The long-term impact of the pandemic on students will depend in large part on the steps that school-system leaders take now to mitigate and address the potential learning loss. Students will also need help to offset losses that have occurred through high-density tutoring or more personalized mastery-based programs. Given the breadth and scope of learning loss, systemic solutions must be implemented as part of the recovery [30]. Among the most recommended recovery strategies is the implementation of pre-assessment and post-assessment plans, comparing students’ progress and achievements between the two assessments after teaching them through a designed, unit-based curriculum for what is deemed essential knowledge and skills for each unit throughout the year. However, some students may arrive with the required knowledge and skills. The regular coverage of the curriculum will not guarantee learning and will consume teachers’ time and efforts. Therefore, evidence rather than time of learning will be the best method of measuring curricular attainment. In addition, it is imperative to support such measurements with readiness plans to address this expected loss and to prepare recovery and intervention plans [31].
The Center for Research on Education Outcomes (CREDO) at the Hoover Institution of Stanford University estimated the magnitude of student-level learning losses in 19 states through the development of measures of what achievement scores would have been in Spring 2020 within a pandemic-free school semester and estimates of students’ achievement at the point in mid-March 2020 during schools’ closure, and from the mid-March point. Additional adjustments for further learning loss to the end of the school year and the third set of estimates were based on school-specific factors, such as the summer learning loss students experienced in the past, applying the same pace of loss to the remainder of the 2019–2020 school year.
The findings on learning losses support four general inferences. First, the findings indicate that if learning loss equals a full year of learning, then recovery of the 2019–2020 losses could take years. Second, the wide variation among schools means that the traditional models of classroom-based instruction of one size fits all and fixed pace approaches will not be sufficient to meet the needs of students. New approaches must be implemented to ensure high-quality instruction is available in different contexts, as different skills are required in different settings. Third, there is a critical need for rigorous student-level diagnostic assessments. In addition, regular progress and achievement checks are required and must be aligned with previous assessment mechanisms to plan recovery. Fourth, schools with the largest estimates of learning loss are the least expected to set recovery plans on their own and to plot their own way forward. Reliance on independent school efforts will not support equitable achievements.
There are expected contributions to be made with the LLRD, mainly to reduce the negatives of learning loss, since such automated-oriented tutoring system could provide a tutoring package and a toolkit for coaching that deliver timely, useful, and relevant feedback to compensate learning loss. According to Fernández-Nieto, et al. [32] a learning dashboard can be used as a useful tool to visually display important information on a single screen so that it can be observed immediately.
Furthermore, a review of the most recent developments in LADs, focusing on research published from 2018 to 2021, yielded a total of 17 papers out of 600 papers in the literature [33] targeting learners and instructors. Among the five key assertions grounded in the dashboard literature is the need to bridge a gap regarding evidence of the positive outcomes for learners. In addition, there is a need to examine evaluation efforts regarding the utility of LADs. The review framework adopts a scheme that analyzes the descriptive, predictive, and analytical functionalities supported by the reported evidence, outlining the effectiveness of LADs on learning outcomes. The descriptive and predictive dashboards helped students to perform better in the formative assessment [34] identified at risk-students [35,36], and significantly supported students’ academic performance in their courses [36].
KaraoglanYilmaz & Yilmaz [37] argued that providing analytics reports through LADs positively increased student motivation. Han et al. [38] highlighted that LADs monitored students’ learning progress and facilitated necessary interventions for students who needed additional assistance. Majumdar et al. [39] showed an engagement score as an aggregate value across several student interaction measures and facilitated generating prescriptive reports for students based on the engagement score. More sophisticated prescriptive algorithm-based and data-driven analytics are yet to emerge [33].
According to Susnjak et al. [33], the reported effectiveness and value assessment of LADs in the literature have been examined and piloted qualitatively upon various LAD implementations [2,36,38,40,41,42,43,44,45,46]. LADs have also been tested quantitatively through statistical analyses that showed that LAD usage had a positive impact on learning outcomes [34,36,38,47].
For example, Bodily et al. [2] designed and implemented a student-facing learning analytics dashboard to support students learning in online environments with two distinct components: a content dashboard to help students identify gaps in their content knowledge and a skills recommender dashboard to help students improve their metacognitive strategies. The dashboards were evaluated with focus groups and a perceptions survey. The evaluation showed that students were positive in their perceptions of the dashboards, with 79% of the students finding them user-friendly, engaging, helpful, and informative. Further, they reported that only 25% of students used the dashboard multiple times and recommended implementing motivation and student support strategies identified and discussed in our framework.
Gras et al. [41] focused on a student dashboard design process to decrease student dropout, collecting 88 student opinions through a questionnaire. Among the key features students would use in a dashboard, 99% selected features that display their performance, and 56% expressed willingness to use a feature that shows peer comparison. The authors recommend keeping this feature optional and on-demand-only for students. Our proposed dashboard prototype leverages this feature to create a gamified learning experience for the learner, rather than using it for mere peer comparison purposes.
Han et al. [38] developed two dashboards for students and instructors. These enabled students to monitor their collaborative activity process through adaptive feedback and helped the instructor provide adaptive support at the right time. The effectiveness of the dashboards was examined in a university class with 88 students (56 females, 32 males) for four weeks. The findings indicate the usefulness of learning analytics dashboards in improving collaborative learning through adaptive feedback and support. Students’ perceived group processes were significantly enhanced by using the dashboards: Participation (t (84) = 3.352, p < 0.01), Interaction (t (84) = 3.778, p < 0.001), and Group Regulation (t (84) = 7.868, p < 0.001). Using the dashboard system significantly improved Group Achievement, Quality of Group Activity (t (21) = 7.241, p < 0.001), and Perceived Group Performance (t (84) = 4.593, p < 0.001). Students had a positive attitude toward the dashboard and perceived it as valuable and easy to use. In addition, individual learning significantly improved, according to the paired t-tests on individual learning. The dashboard system effectively improved Situational Interest (t (84) = 2.773, p < 0.01) and Perceived Learning Outcomes (t (84) = 4.268, p < 0.001). This result indicates that the dashboard promoted group learning and individual learning.
Han et al. [38] recommended that the information provided through a dashboard needs to be organized within theory-based critical indicators regarding the effectiveness of the learning process. In addition, students’ activity data needs to be utilized to support their learning process based on educational theory. Moreover, they recommended that the system should not provide extensive instructional feedback or guidance during the learning process, in order to enhance students’ regulation skills.
Kokoç & Altun [36] developed and integrated a prescriptive learning dashboard within an e-learning environment. The participants consisted of 126 higher education students enrolled in the 12-week Computer Networks and Communication course. Data gathered through logs, and academic performances of learners, were analyzed with data mining techniques. The study concludes that interaction with the prescriptive learning dashboard had significant effects on learners’ academic performance. Further, the artificial neural networks algorithm yielded the best performance for predicting academic performance. The results suggest that prescriptive learning dashboards can be integrated into online courses as an instructional aid to enhance learners’ performance and leverage the learning design in e-learning environments.
Naranjo et al. [44] introduced CloudTrail-Tracker, an open-source platform to obtain enhanced usage analytics from a shared Amazon Web Service account. The tool provides the instructor with a visual dashboard that depicts all students’ aggregated usage of resources during a specific time frame, as well as individual students’ activities. Based on a satisfaction survey of 64 participants and usage analytics, the students positively reported the tool’s usefulness. They highlighted its potential for semi-automated assessment and student self-awareness of their training progress.
In Ulfa et al. [46], a learning analytics dashboard improved learning interaction, impacting learning success. Tests were conducted on 67 students, and questionnaires were distributed and then analyzed using descriptive methods. The result highlights that most students who take online learning using the learning analytics dashboard perceived it as useful for self-evaluations of their interaction and facilitating their learning management. The results of the study showed that most participants agreed that LAD can provide helpful information on their interactions with Learning Content (M = 4.15, SD = 0.557) and Learning Environment (M = 4.13, SD = 0.457), as well as identifying learning challenges during their learning process (M = 3.88, SD = 0.477).
Aljohani et al. [47], through an empirical investigation, examined the potential of LAD. Student-centered LADs were integrated within LMS through a proposed framework that exploited cognitive computing using four indicators: frequency of accessing the LMS; frequency of accessing the discussion board; the number of threads added to the discussion board; and quiz results. A total of 86 students participated voluntarily. In the control group, 43 used the teacher-centered analytical dashboard provided by the LMS. In the experimental group, the other 43 students used the student-centered learning analytics dashboard to learn about their performance. The results highlight the effectiveness of the student-centered learning analytics dashboard in enhancing students’ engagement and access to the course. It was more effective than the teacher-centered analytical dashboard in improving their summative assessment results.
Fleur et al. [34] developed a LAD and designed an intervention that relies on goal orientation and social comparison. Subjects can see a prediction of their final grade in a course and how they perform compared to classmates with similar goal grades. First-year Bachelor’s students were recruited (n = 79) and randomly assigned to either the treatment group (access to LAD) or the control group (no access). Those with access to the dashboard expressed higher motivation levels than those without access. Further, they outperformed their peers as the course progressed and achieved higher final grades. This study’s results indicate that learner-oriented dashboards are technically practical tools and may benefit learners.
KaraoglanYilmaz &Yilmaz [37] examined the effect of LADs on the learners’ transactional distance and motivation. The experimental design research was carried out on 81 university students. The students were randomly assigned to the experimental and control groups. While the students in the experimental group were provided feedback on the weekly LAD results, no feedback about the LAD results was provided to the students in the control group. Research data were obtained through a transactional distance scale and motivated strategies for learning questionnaires. The results showed that providing metacognitive feedback support to learners regarding LAD results positively decreases transactional distance and increases motivation.

3. Theoretical Background

This conceptual design of the proposed approach to mitigate potential learning loss amid the COVID-19 pandemic adopts design thinking as a theoretical approach, to strategically tackle this educational challenge and offer a practical solution that stems from the consideration of users’ needs. Further, the backward-instructional design underpins the proposed LLRD prototype, as it provides guidance for instruction and designing learning experiences, starting from the outputs of instruction.

3.1. The Design Thinking Approach

The LLRD discussed in this paper adopts the principles of the design-thinking approach through the non-linear, iterative process, via the diagnostic, descriptive, predictive, and, finally, perspective phase. This final phase informs the next round of learning loss assessment, starting, again, with the diagnostic phase to identify and measure learners’ next required learning objectives, based on their achievements in the previous learning session. The design-thinking approach is, also, considered as most useful to tackle ill-defined problems through its five phases: understand the user’s needs, define the problem, ideate solutions, develop a prototype, and test solutions [48]. This proposed prototype of LLRD stemmed from the consideration of users’ needs, to reduce the time and efforts of teachers and education professionals to evaluate and remedy learning loss because of students being away from school for a long period of time. Furthermore, there is no one size that fits all; providing a system that evaluates students’ learning loss individually will personalize learning and enhance students’ learning with the most needed knowledge and skills. This study also defined the problem facing learners, teachers, and educational administrators, for how to effectively cope with potential learning loss post-COVID-19, after schools’ reopening, and how to provide effective remedial solutions. Further, this study ideated a solution based on assigning a distinct learning path on an LMS (LLRD), with special features and a predefined learner’s journey, through four key phases and an experience-evaluation mechanism for teachers and administrators. The final testing stage of the design-thinking approach can be applied, by testing this proposed LLRD prototype that will be reported in future applications.

3.2. Backward Instructional Design

The proposed LLRD prototype follows backward-design principles, with the focus on the outputs of instruction. It provides guidance for instruction and designing learning experiences from the first stage. The system asks students to choose and identify learning goals, and it generates learning and assessment, accordingly. The backward design eliminates unnecessary activities or tasks, purposefully providing instruction and assessment that aligns with the overarching goals of the course, and leverages what students will need to know and understand during the design process [49]. The LLRD was developed according to the three key stages of backward design: identify desired results through the first diagnostic phase of the dashboard, determine acceptable evidence through the outcomes of the descriptive and predictive phase, and plan learning experiences and instruction through the perspective phase.

4. Methodology

The literature identified key methodological approaches for conceptual studies, as conceptual papers, typically, draw on multiple concepts, literature dimensions, and theories that serve different purposes and roles [50]. Conceptual papers focus on proposing new relationships among constructs, to develop complete arguments on these constructs rather than evaluating them empirically [51]. One critical factor, which serves to satisfy the conceptual paper methodological approach, is to explicate the key steps in the argument and clarify the conceptualization. The process of the phenomenon is through simple and logical coherence. The methodology of conceptualization adopted in this paper is the Theory Synthesis [52], which supports achieving conceptual integration across multiple theories or literature streams, to provide an enhanced view of the phenomenon and link previously unconnected pieces. This paper summarizes and integrates the existing knowledge of the potential challenge facing schools after schools’ closure post-COVID-19 pandemic, linking it to extant effective remedial measures exploiting the power of learning management systems and the design-thinking approach. In sum, this paper summarized and encapsulated the discussion on the learning-loss challenge and linked remedial solutions to the design-thinking principles applied to the learning-experience domain in Learning Management Systems and Learning Assessment Dashboards. The research questions guiding this study are:
  • How can potential learning loss post-COVID-19 pandemic be mitigated, utilizing the design-thinking approach in redesigning the learning experience for an LMS?
  • How can learners’ experience with the LMS be adapted, to support learning recovery after having potential learning loss post-COVID-19 pandemic?

5. System Architecture (Designing a Learning Analytics Dashboard—LAD)

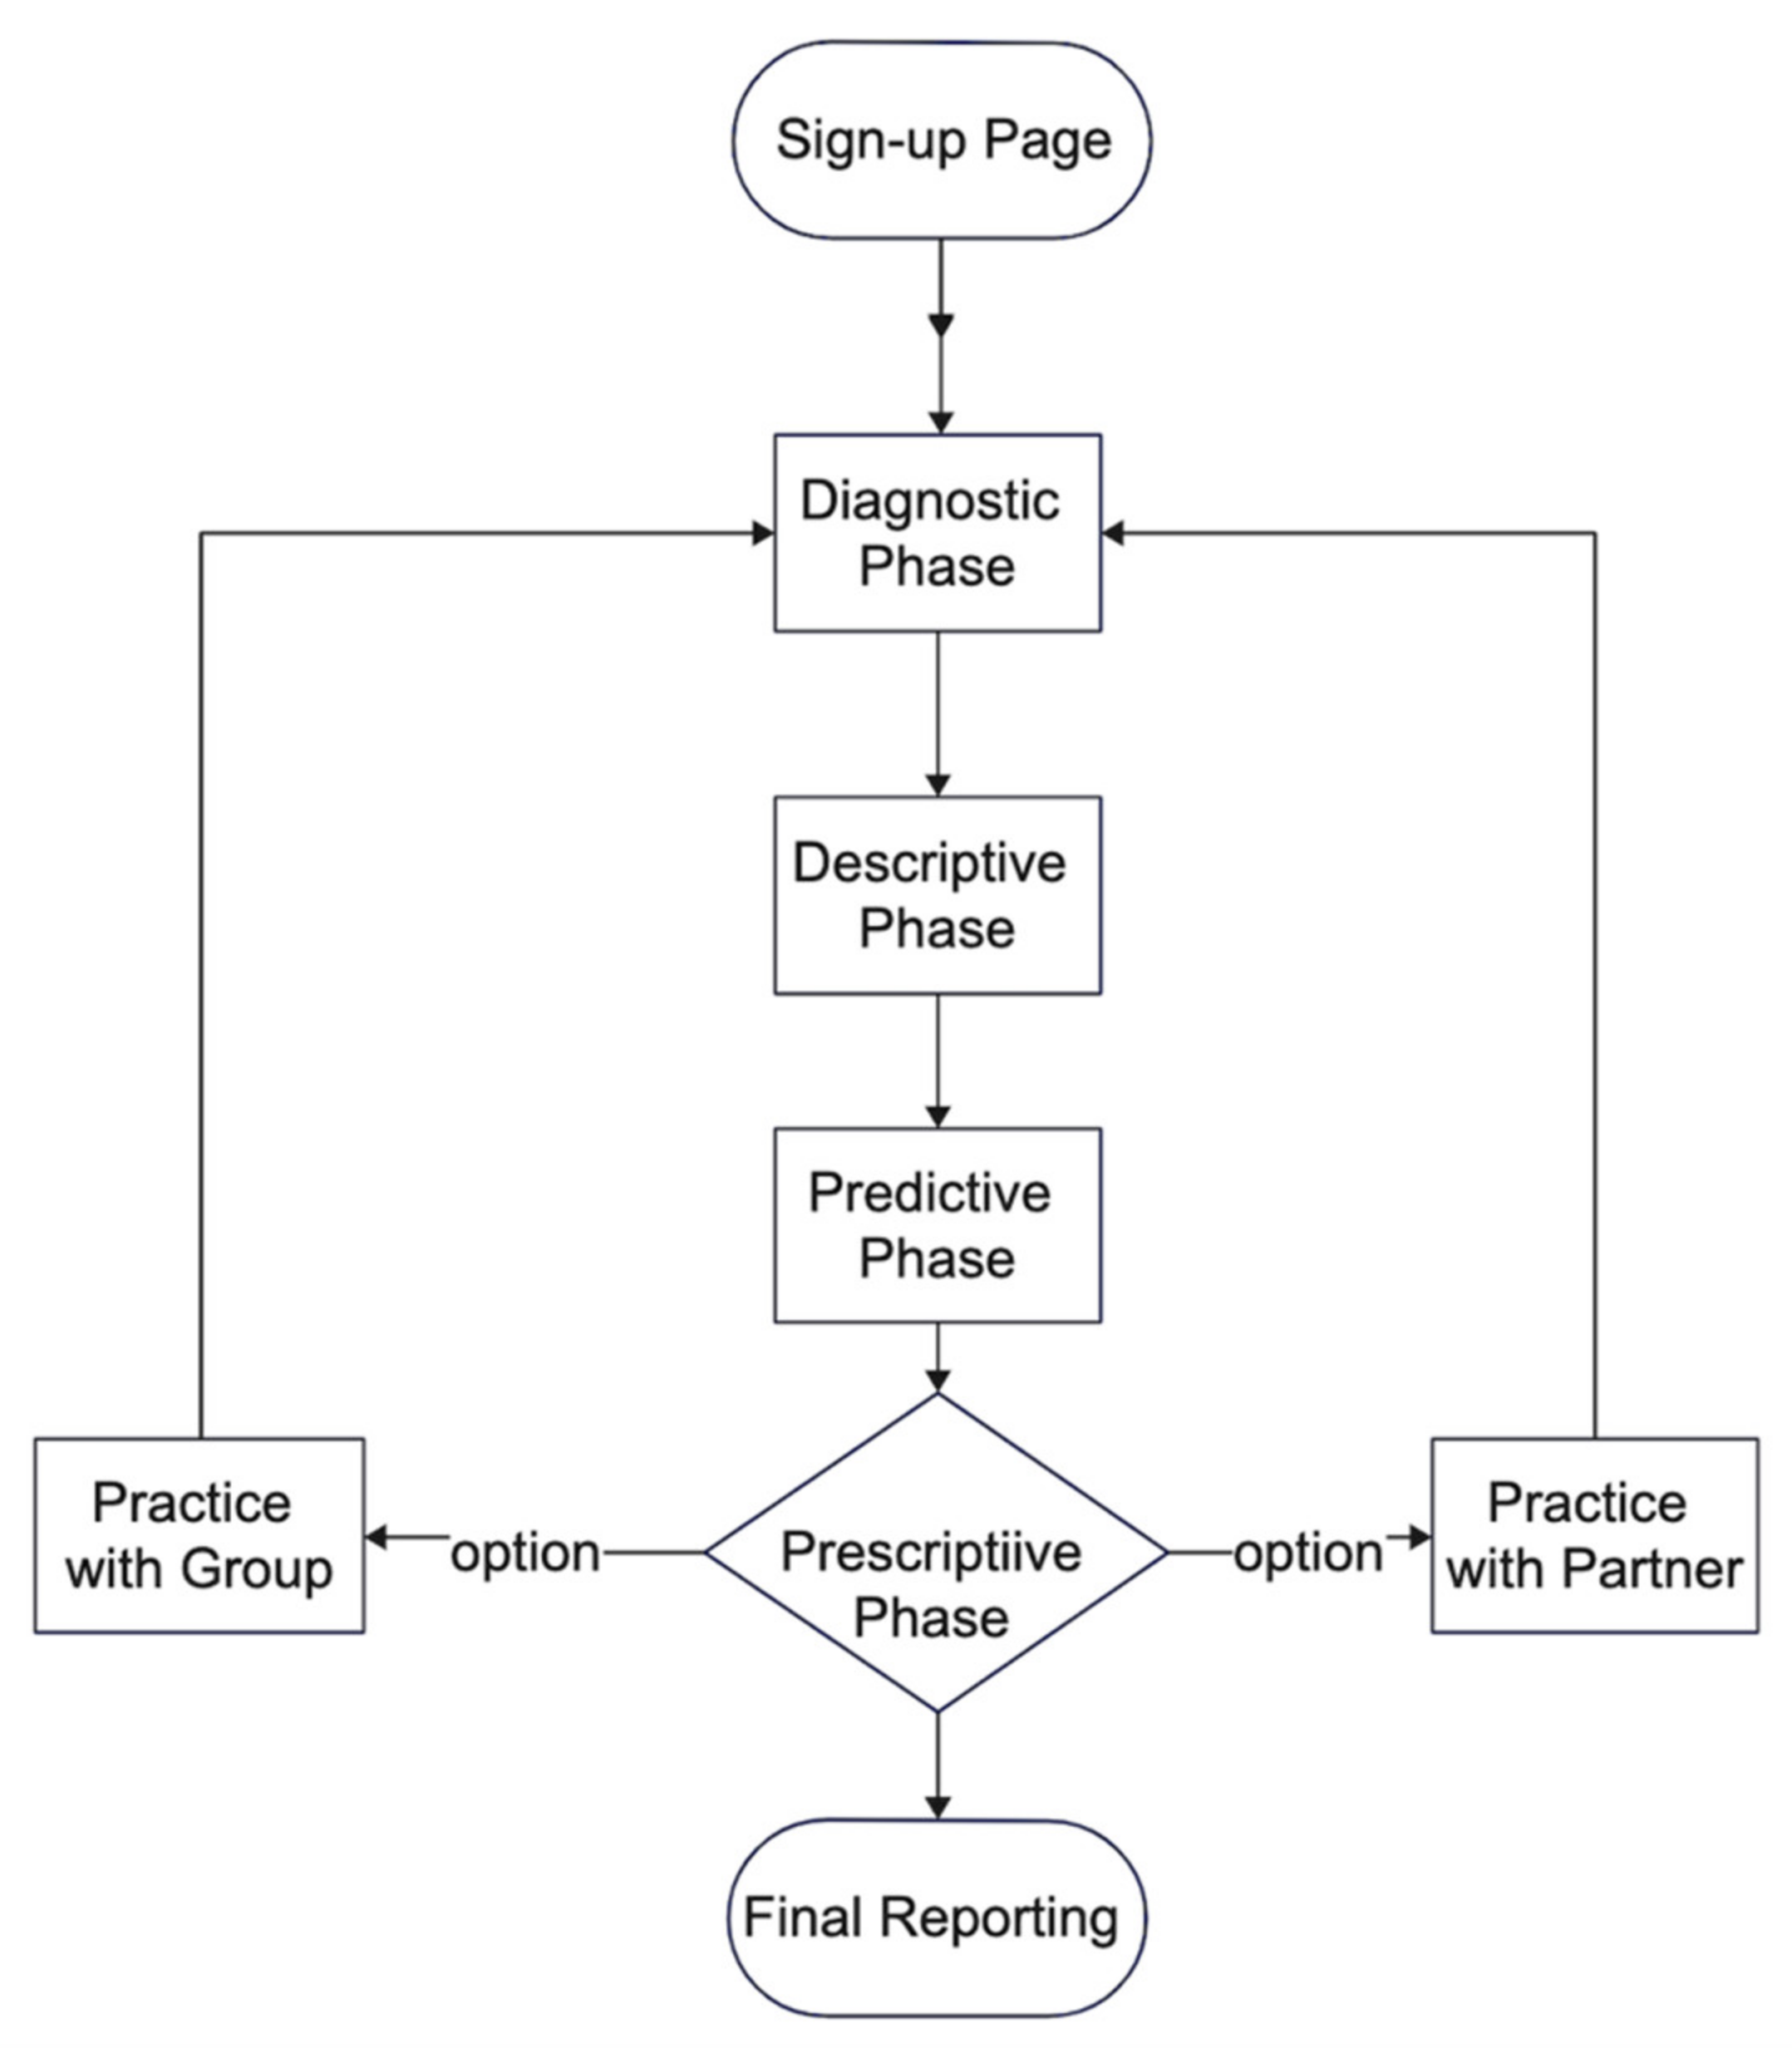
5.1. Prototype Architecture
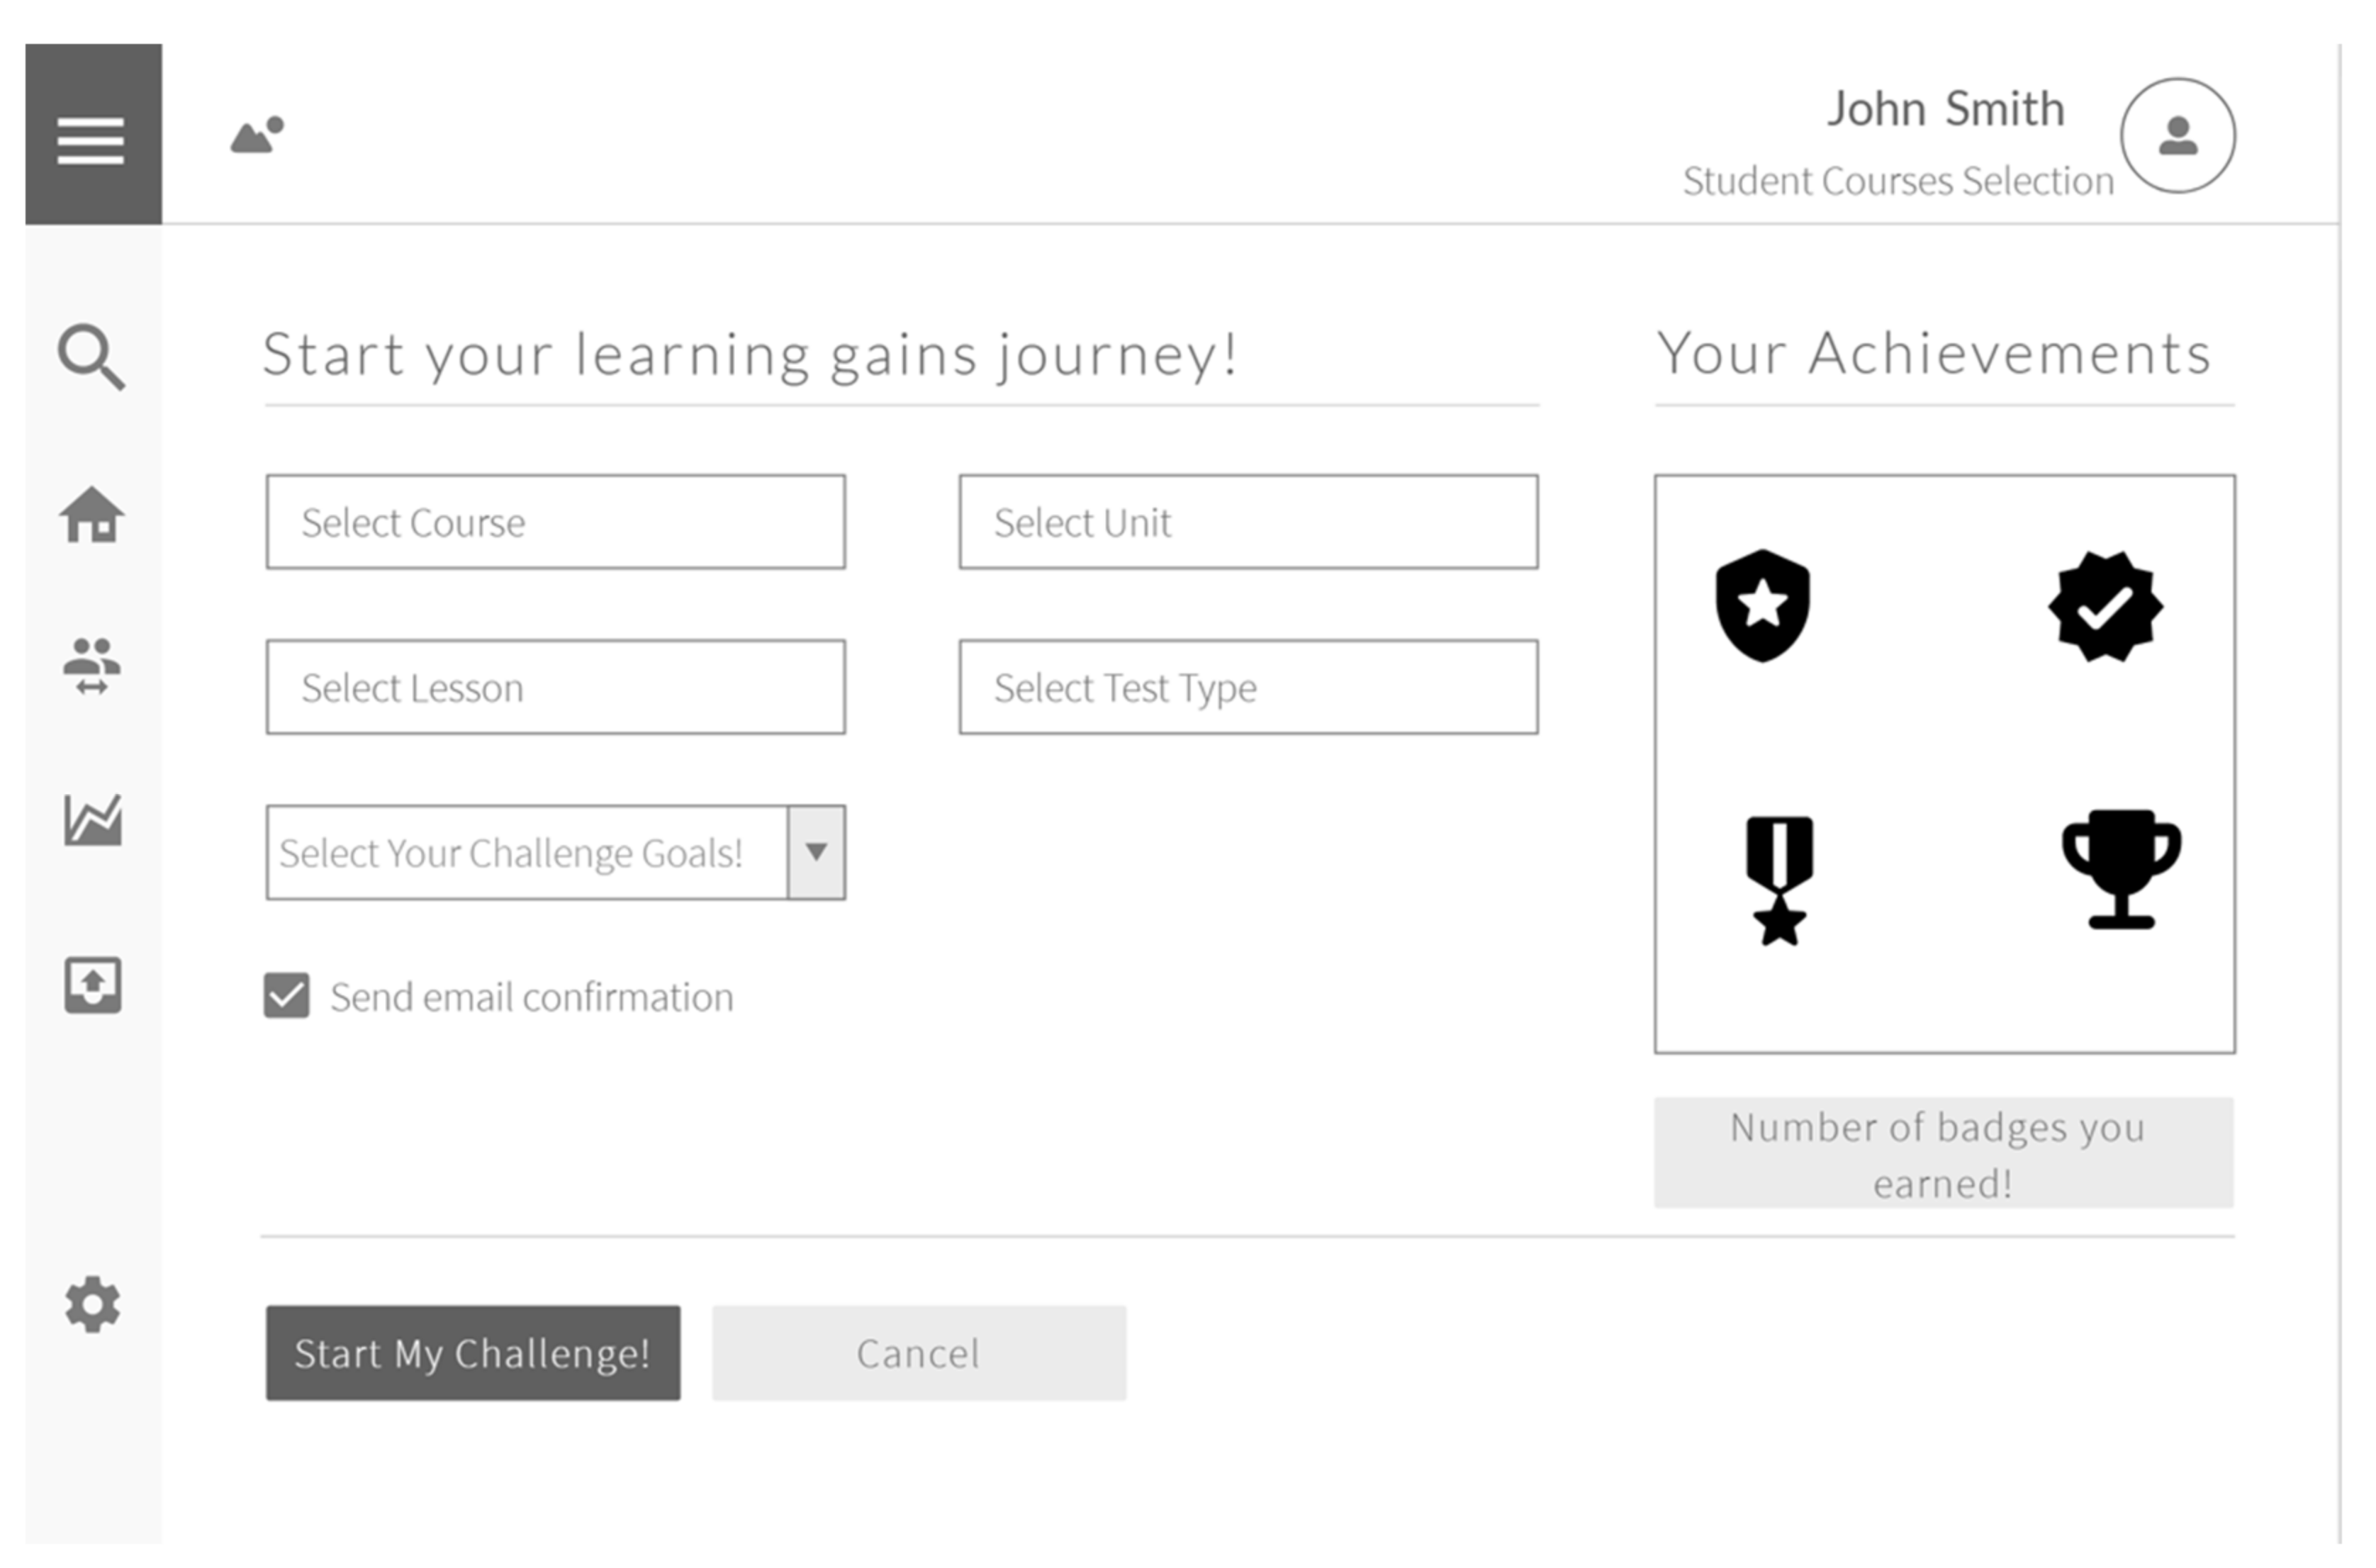
The prototype architecture, basically, encompasses six phases, starting with the sign-up page followed by the diagnostic phase, descriptive phase, predictive phase, prescriptive phase, and the final reporting phase, which are discussed in detail in the next sections.

5.2. Sign-Up Page

Utilizing the principles of design thinking and instructional design, and based on the previously discussed literature on LAD, the LLRD prototype model begins with a simple registration page. Here, students fill in personal information, such as name, profile picture, grade, level, class, school name, and student identification number (Figure 1). This page is assigned as an initial (introductory) page of the portal, if the system is distinctly planned as a separate portal from the LMS. However, the system can be best applied as a building block for an integrated solution or an add-on to the LMS, to ensure compatibility with a student identification system, existing implemented online courses, and a central exam system. This page helps learners identify their previous learning outcomes through centralized pre-assessment tests, which are generated through an automated bank of questions. This defining page can be designed to exploit the social reference frame to show learners’ data in comparison to the whole class, either for individuals or peers in collaborative learning settings, or to be compared to previous graduates of the same course.
The other suggested pages of the system, as described below, are integrated pages within the LMS. They open with an encouragement statement. Starting the learning-loss-recovery journey with a welcome statement attracts and motivates students to the portal and provides a positive impression of the tasks required by the student. LAD can be explored through indicators that provide useful visualizations for users and stakeholders. These indicators can be categorized into action, result, social, content, context, and learner categories. Park and Jo [53] reviewed related studies on LADs from 2005 to 2013, to get an overview of the important features of state-of-the-art LADs. Those criteria include intended goals and target users, data extraction and mining, visualization, and evaluation. Visualized information in LAD influences user psychology and behavior, driving effective teaching and learning. The target users determine the particular intended goals, and the application of sophisticated data mining algorithms allows them to make decisions effectively [54]. The techniques used previously primarily provide diagnostic, descriptive, predictive, and prescriptive analytics. The user journey throughout the system and system interface pages is discussed in detail below.

5.3. Diagnostic Phase (1st Page Interface)

The first page interface should provide a pre-assessment of students’ level of learning loss. On this page, students log in to the system and select the course they are willing to start with, to enhance their learning, as well as the unit and lesson of their choice. They also select the test type, whether it is a short or long test, multiple choice, or any type of objective test, as shown in Figure 2. Students can choose their challenge goals, which are linked to students’ learning outcomes. This page also can include a record of collected badges of students’ progress, achievements, and the number of completed courses, to encourage their self-regulated learning skills and metacognitive skills, as well as to motivate them to challenge themselves to take and retake course exams. This self-regulated learning experience can enhance students’ 21st-century skills, such as critical thinking, decision-making, problem solving, and lifelong learning. Teachers should acknowledge students’ achievement badges during class, through the course LMS page, through announcements, or through an integrated achievement board on the course main page. These achievements can also be announced during in-person class time in blended learning classrooms.

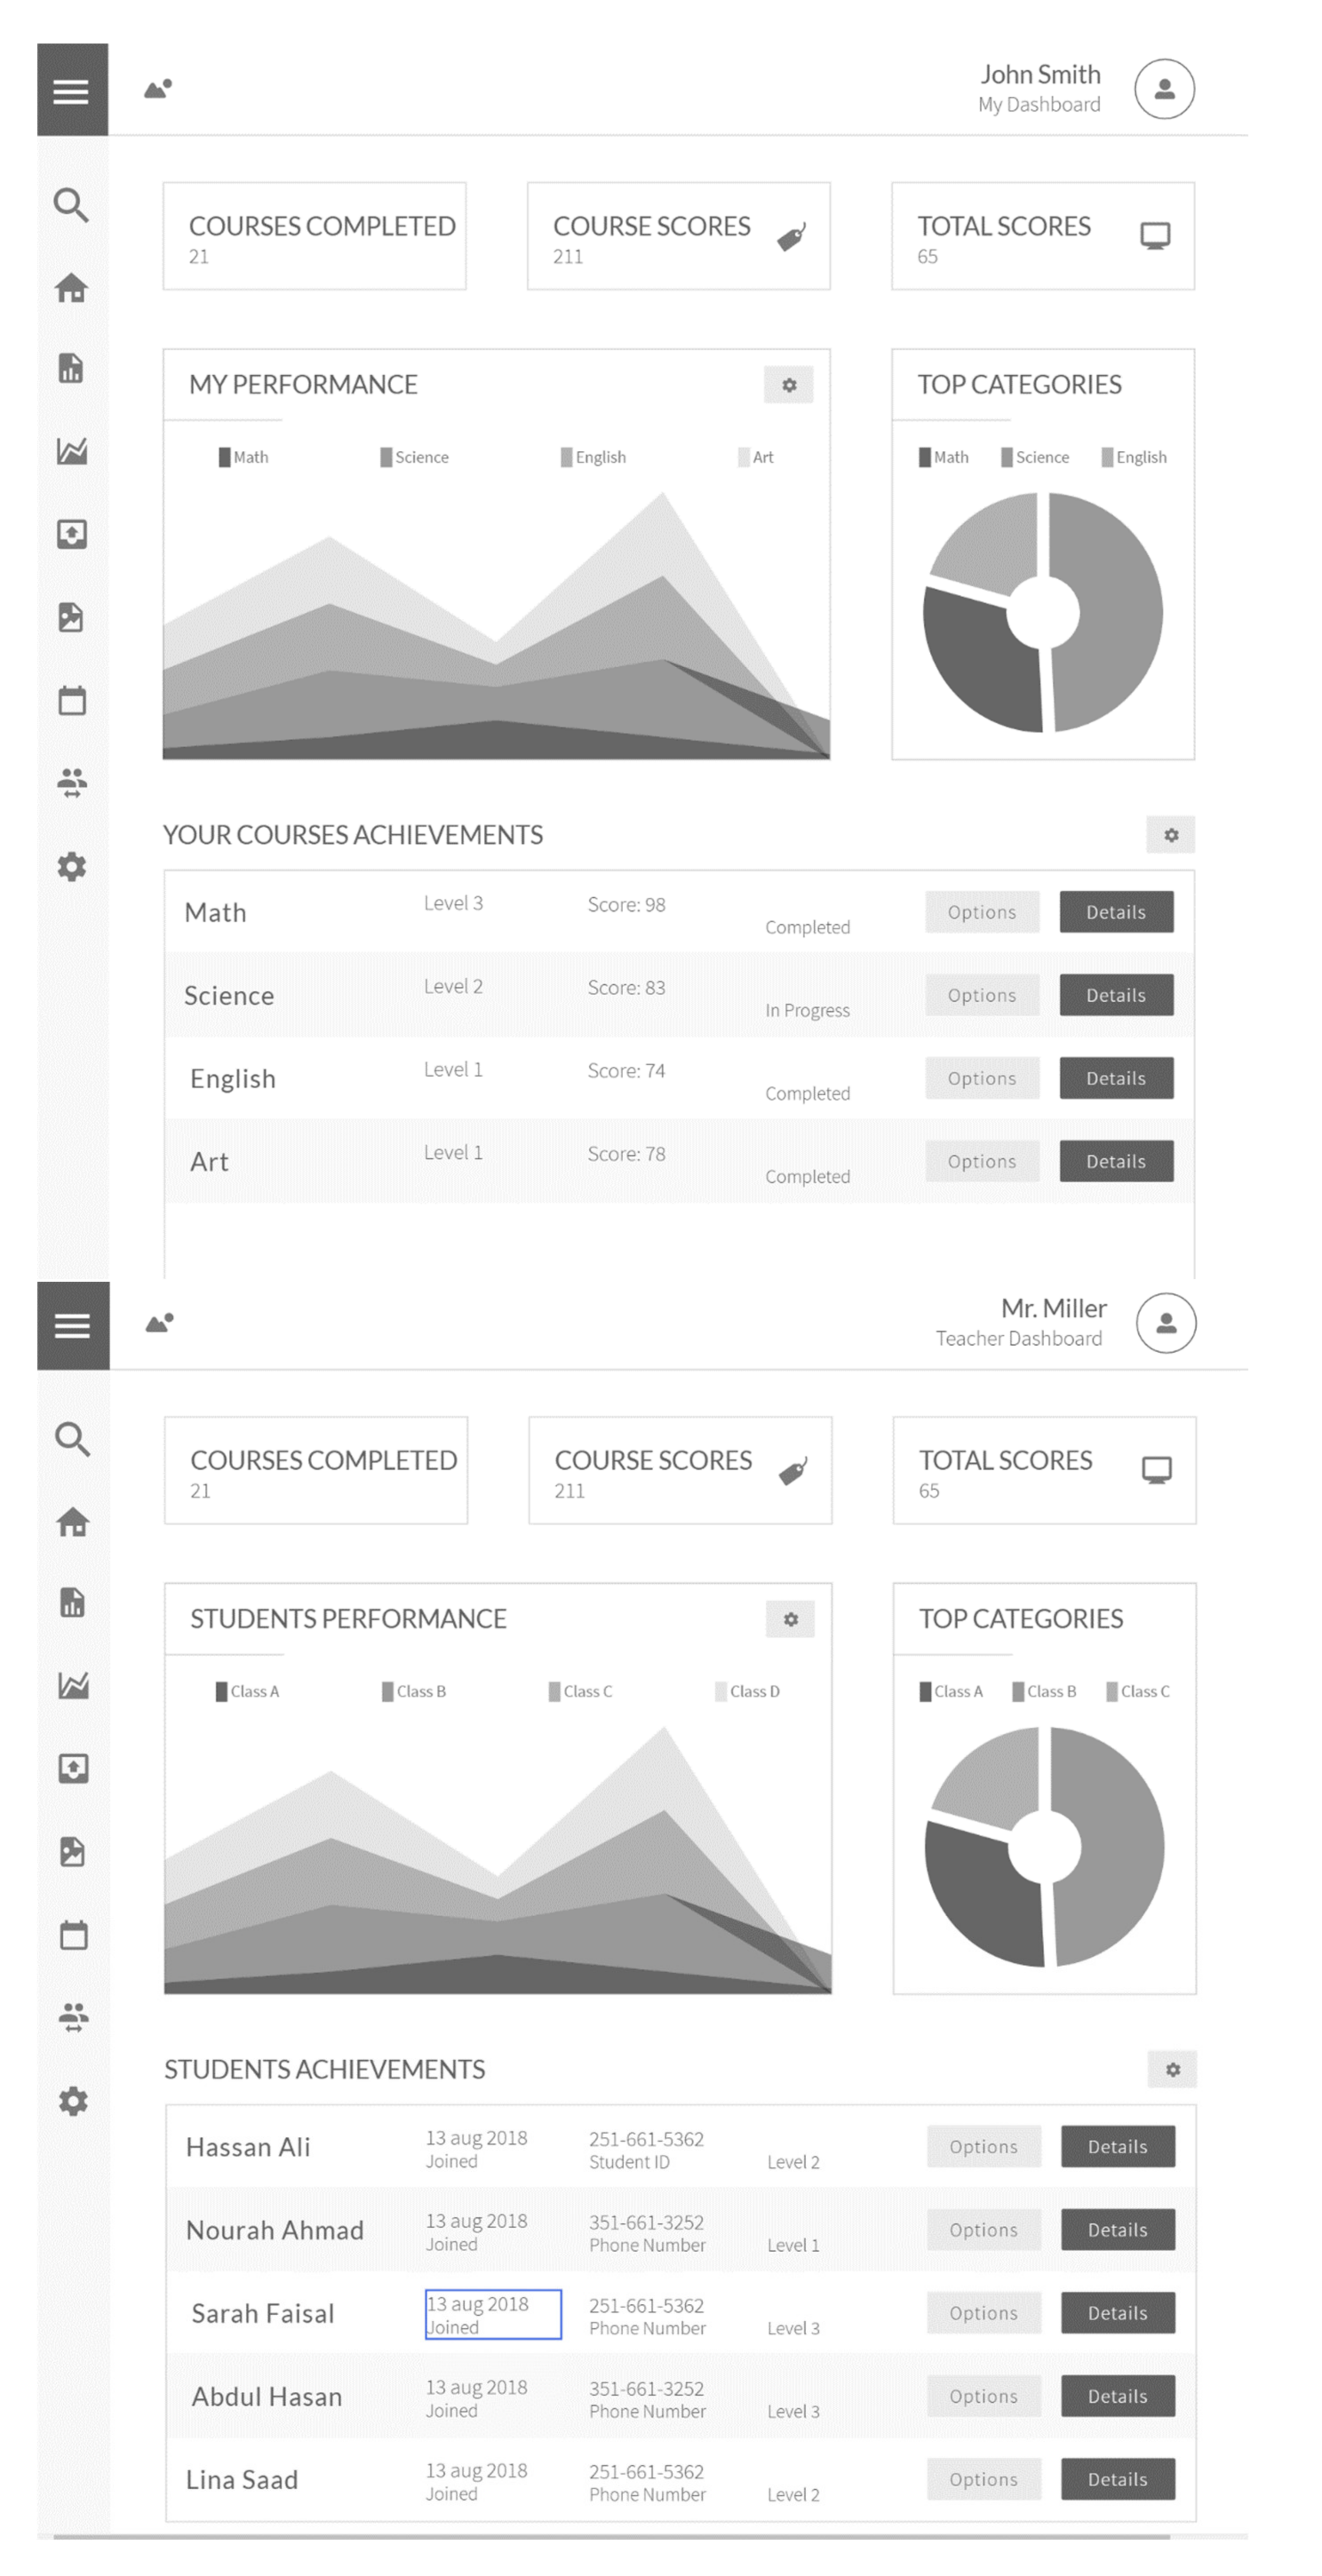
5.4. Descriptive Phase (2nd Page Interface)

The second page interface shows the results of the previous phase and offers students a program of study that is based on students’ previous choices, automatically generated by the system, as seen in Figure 3. The program can include the subject components in different units or micro units. Courses can also be chunked into micro-content and short quizzes, to encourage students to self-test their knowledge and skills through a simulation of ungraded final tests, quizzes, and activities, such as low-stake exams, to encourage students’ practice of course content. This stage of the system acts as the critical phase of potential required innervation and represents the Zone of Proximal Development (ZPD), where background knowledge is observed and measured, before information, knowledge, and understanding are analyzed for instructional intervention. This stage leads to obtaining meaningful feedback for teachers and facilitates the identification of the level of learning loss, in terms of its breadth and depth. It provides indicators for learning standards and goals for instruction, and facilitates setting an obtainable performance level toward achieving learning retention.
Throughout this phase, learners should be placed in a certain aptitude level, according to four levels: (1) Platinum, (2) Gold, (3) Silver, and (4) Bronze. In other words, the system generates recovery plans according to students’ competence levels in the subject matter. The system also opens up immediate access to an Instructions page, with detailed information on instructional units and modules, estimated completion time, and grade distribution. The Backward Instructional Design can be effective at this stage, in identifying the learning outcomes and assessment methods to help students master the most important concepts, without overburdening them with identifying results, determining acceptable evidence, and planning learning experiences and instruction. Teachers can monitor students’ progress accessing instructional materials, number of views, interactions, number of activities performed, etc. This stage of information displayed on the dashboard can be designed based on achievement of the learning activity reference frame, for goals set either by the teacher or by learners themselves. Presenting learners’ performance in learning-outcomes achievement links it to skills, content, and performance mastery. Developing a descriptive LAD through an LMS is a movement toward extending to other dimensions, such as applying prediction models, including logs of activities in informal and open-learning environments [53].
Other enrichment courses can be provided for students through the dashboard and give them the freedom to enrich their learning loss recovery plan. Widely analyzed dashboards revealed that there is little support for goal setting and planning, as almost no dashboard allowed learners to manage self-set goals. Furthermore, social framing at this stage is more common than achievement framing. Comparison with peers can stimulate students’ motivation to work harder and increase their engagement, sometimes by ‘inducing a feeling of being connected with and supported by their peers’ [55] Through this framing, the learning loss recovery process will be created through a gamified experience, for students to compete with other colleagues or have self-competition and collect progress badges and certificates to be compared with peers based on achievement goal orientation theory. This theory distinguishes between mastery and performance orientations, as the motivation behind engagements in an achievement task [56]. In contrast to learners who set mastery goals and focus on learning the material and mastering the tasks, learners who have performance goals are more focused on demonstrating their ability by measuring their skills in comparison to others. LA dashboards should contextualize the data in terms of goals achieved and use different groups of peers as a frame of reference.

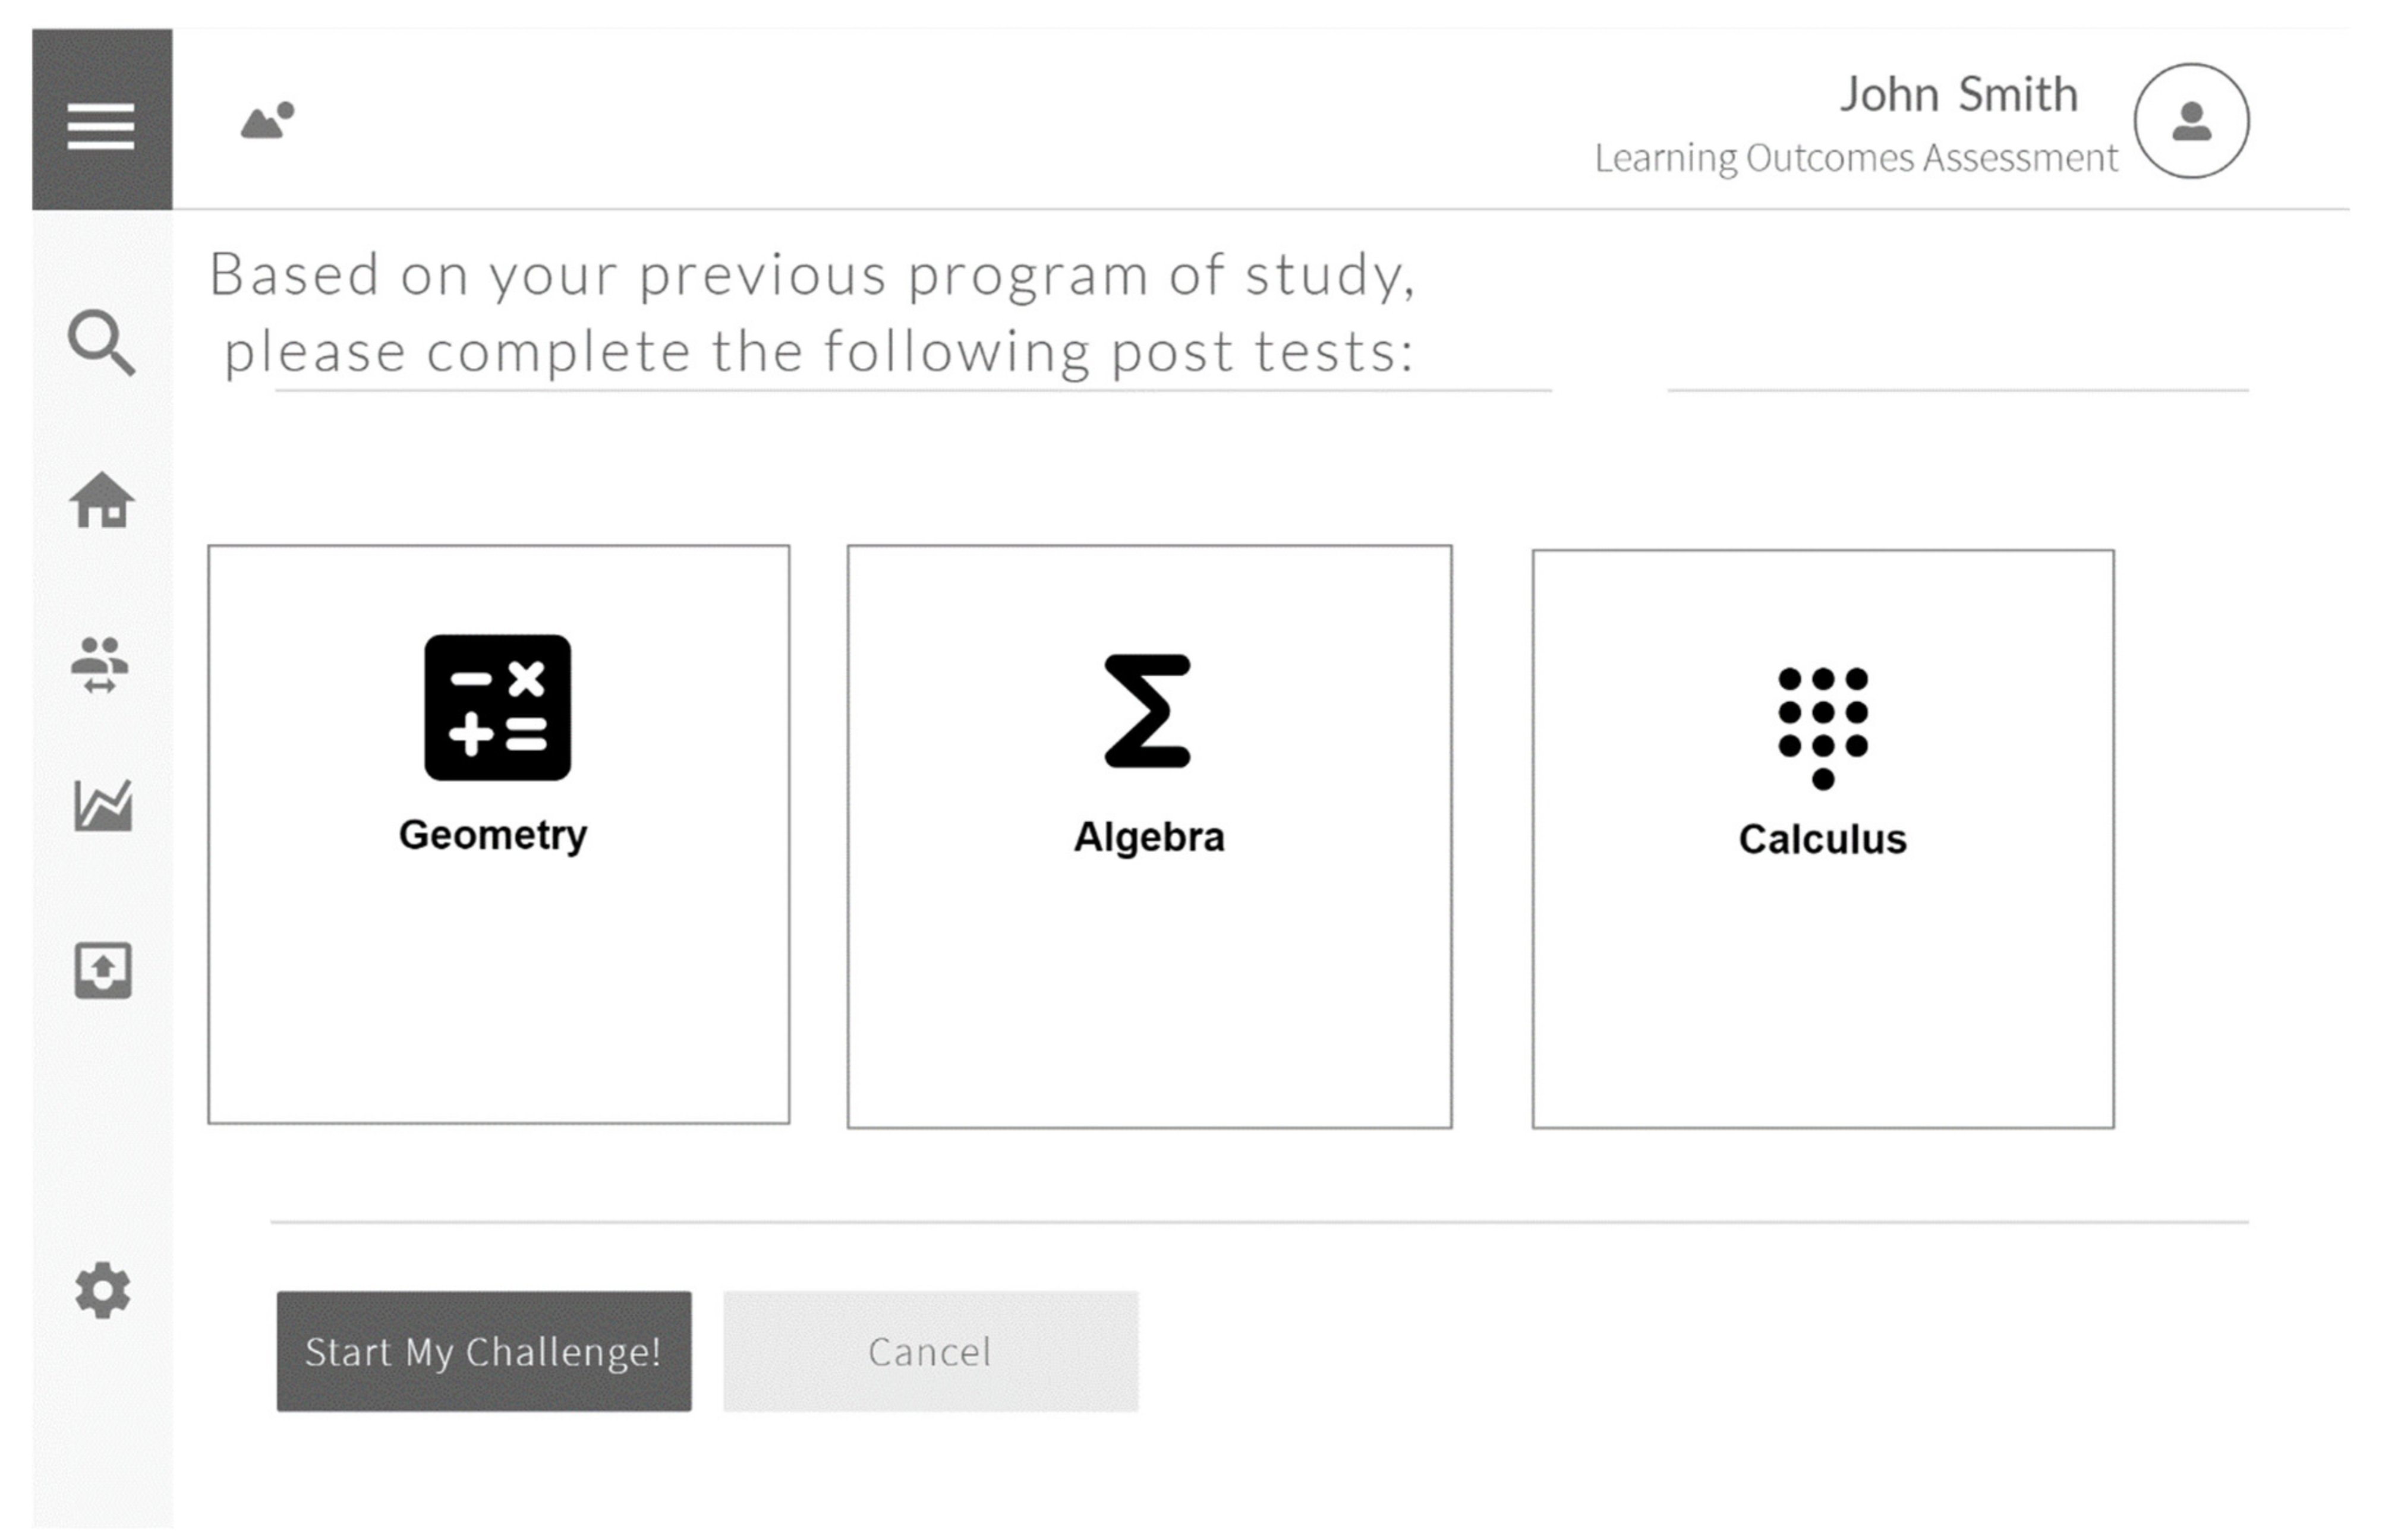
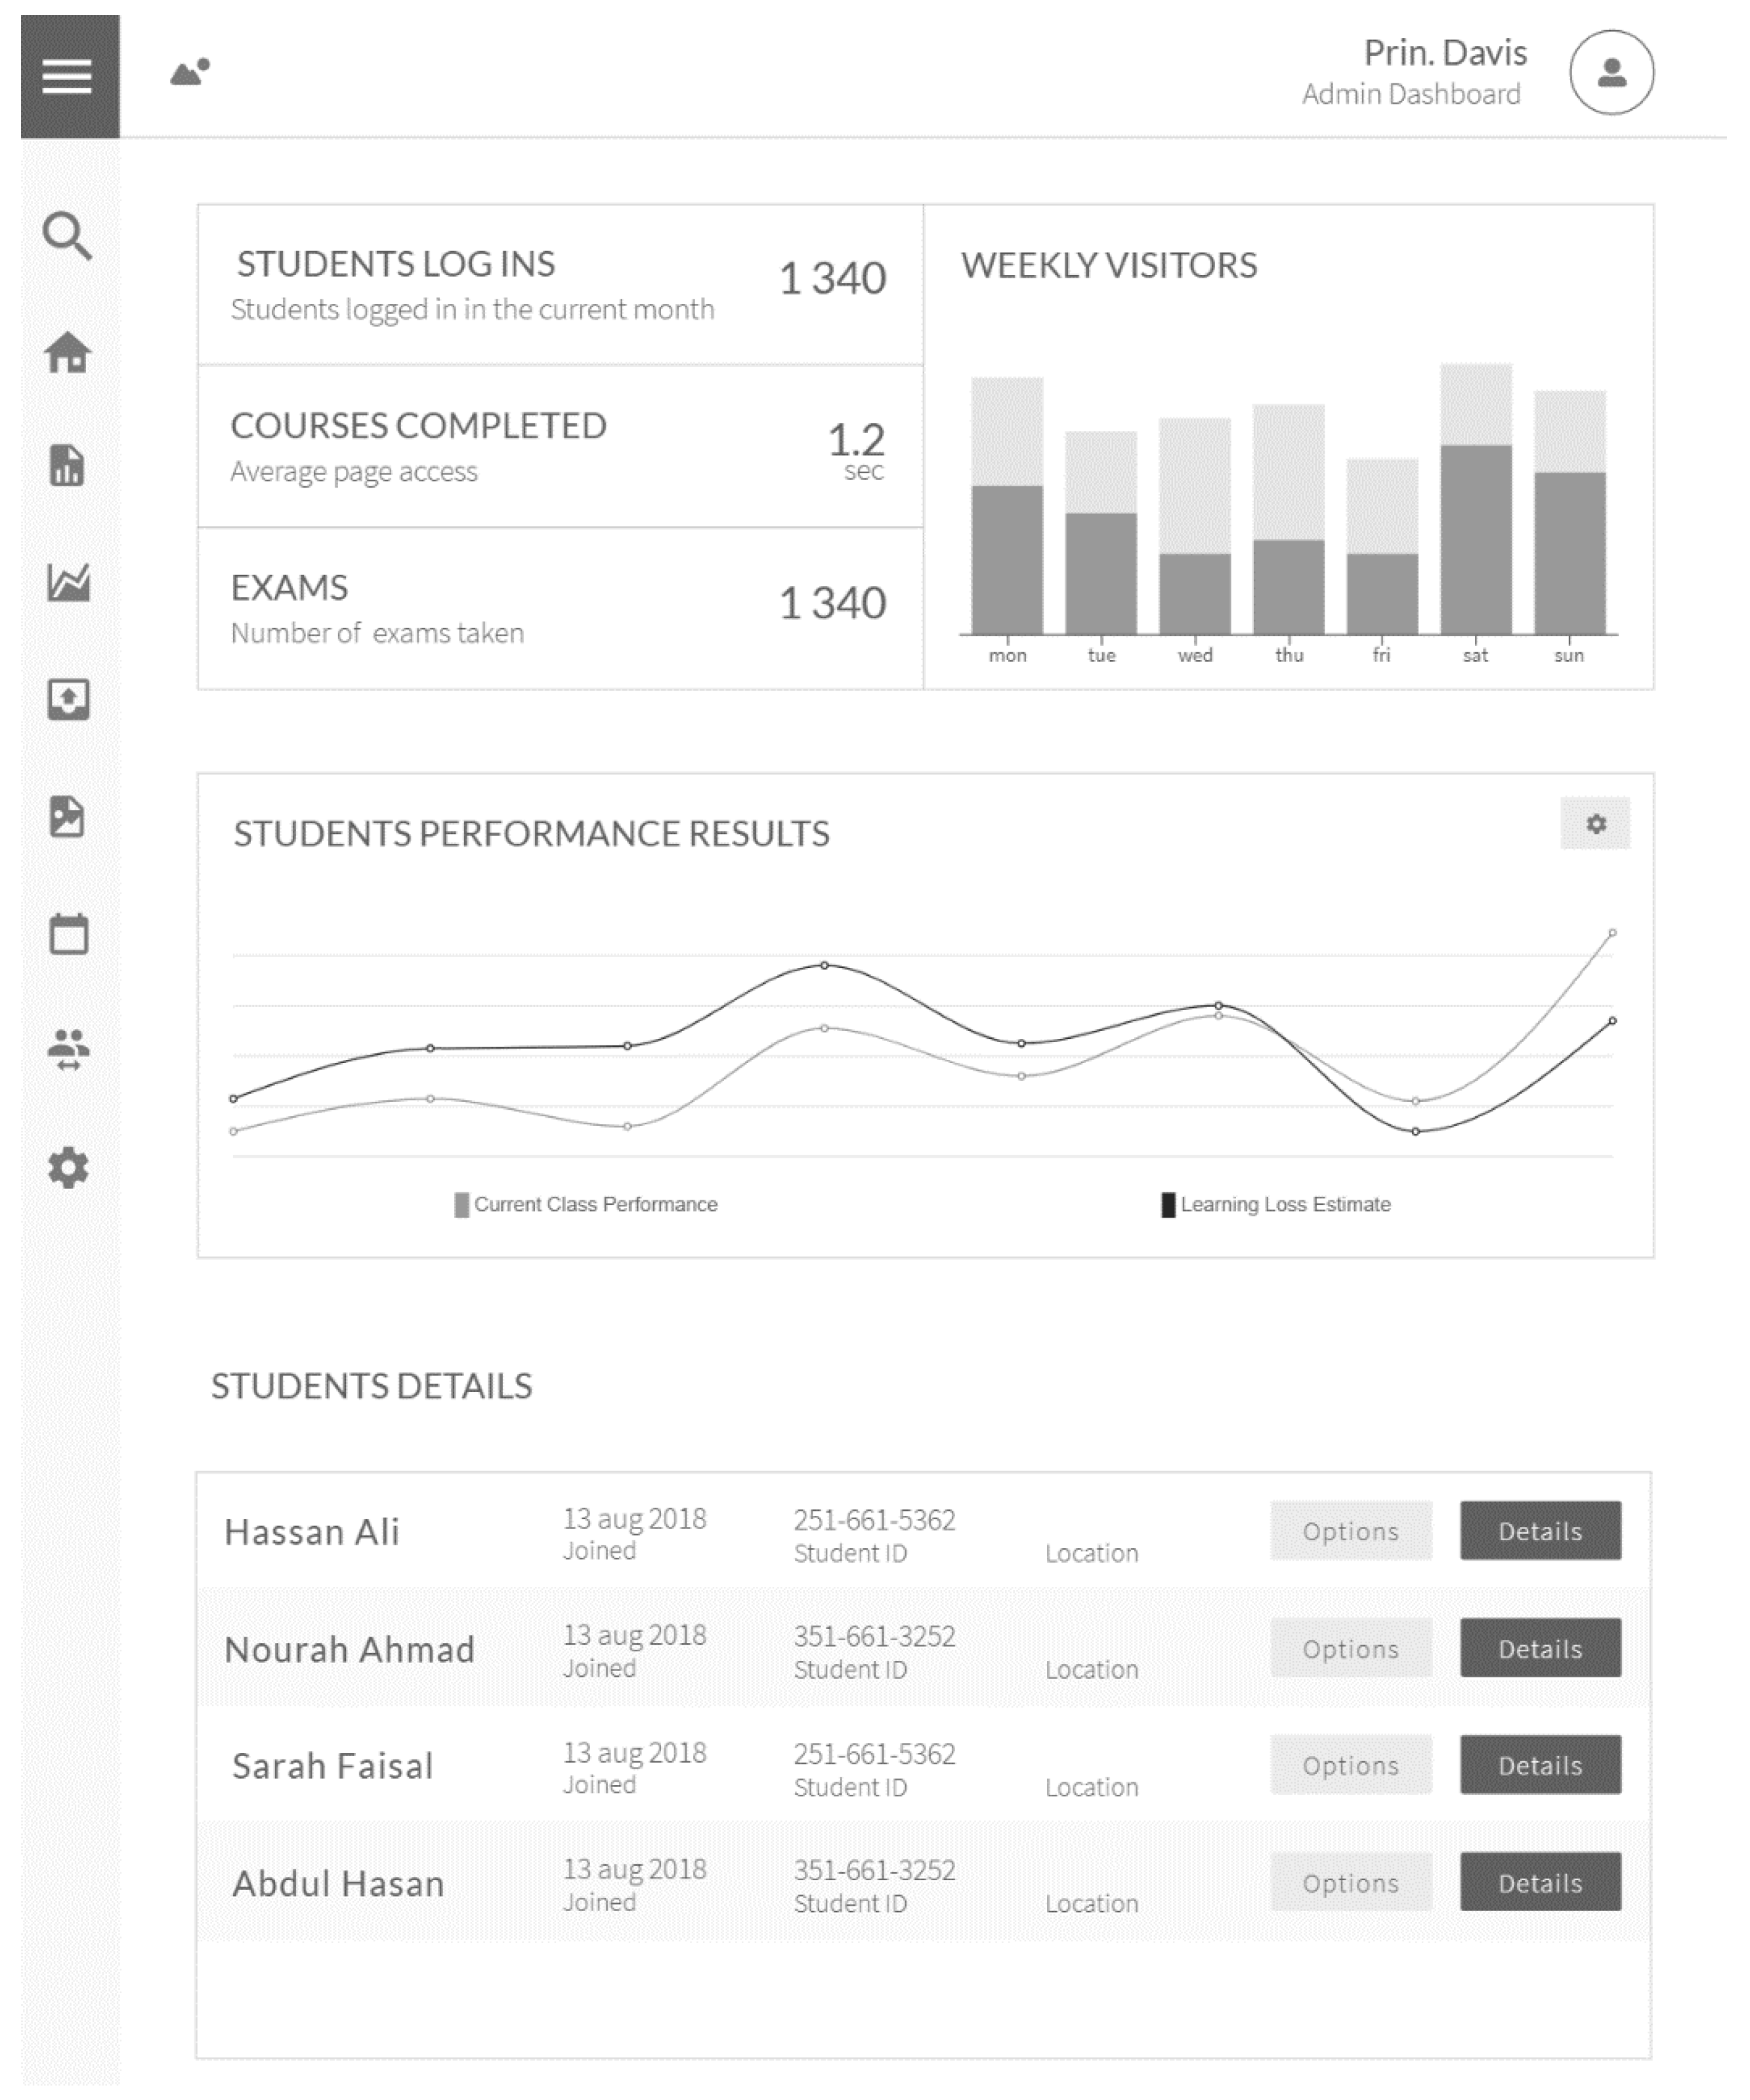
5.5. Predictive Phase (3rd Page Interface)

Predictive analytics aims to understand the underlying patterns in the historical data as well as apply statistical models and algorithms to examine relationships. The predictive phase of the process generates feedback on the expected future performance by students, depending on their performance on previous assessment stages. It provides predictions on their progress and the likelihood of their achievement of learning outcomes, based on previous assessment results and outcomes, as shown in Figure 4. Automated feedback is a crucial component for the development of self-regulated learning skills [57]. Online learning environments support learners’ progress and learning self-regulation skills through the data generated by the system tracking their performance [58,59]. A very low percentage of learning dashboards focus on learners, due to the contrasting purposes for dashboard usage among learners and teachers.

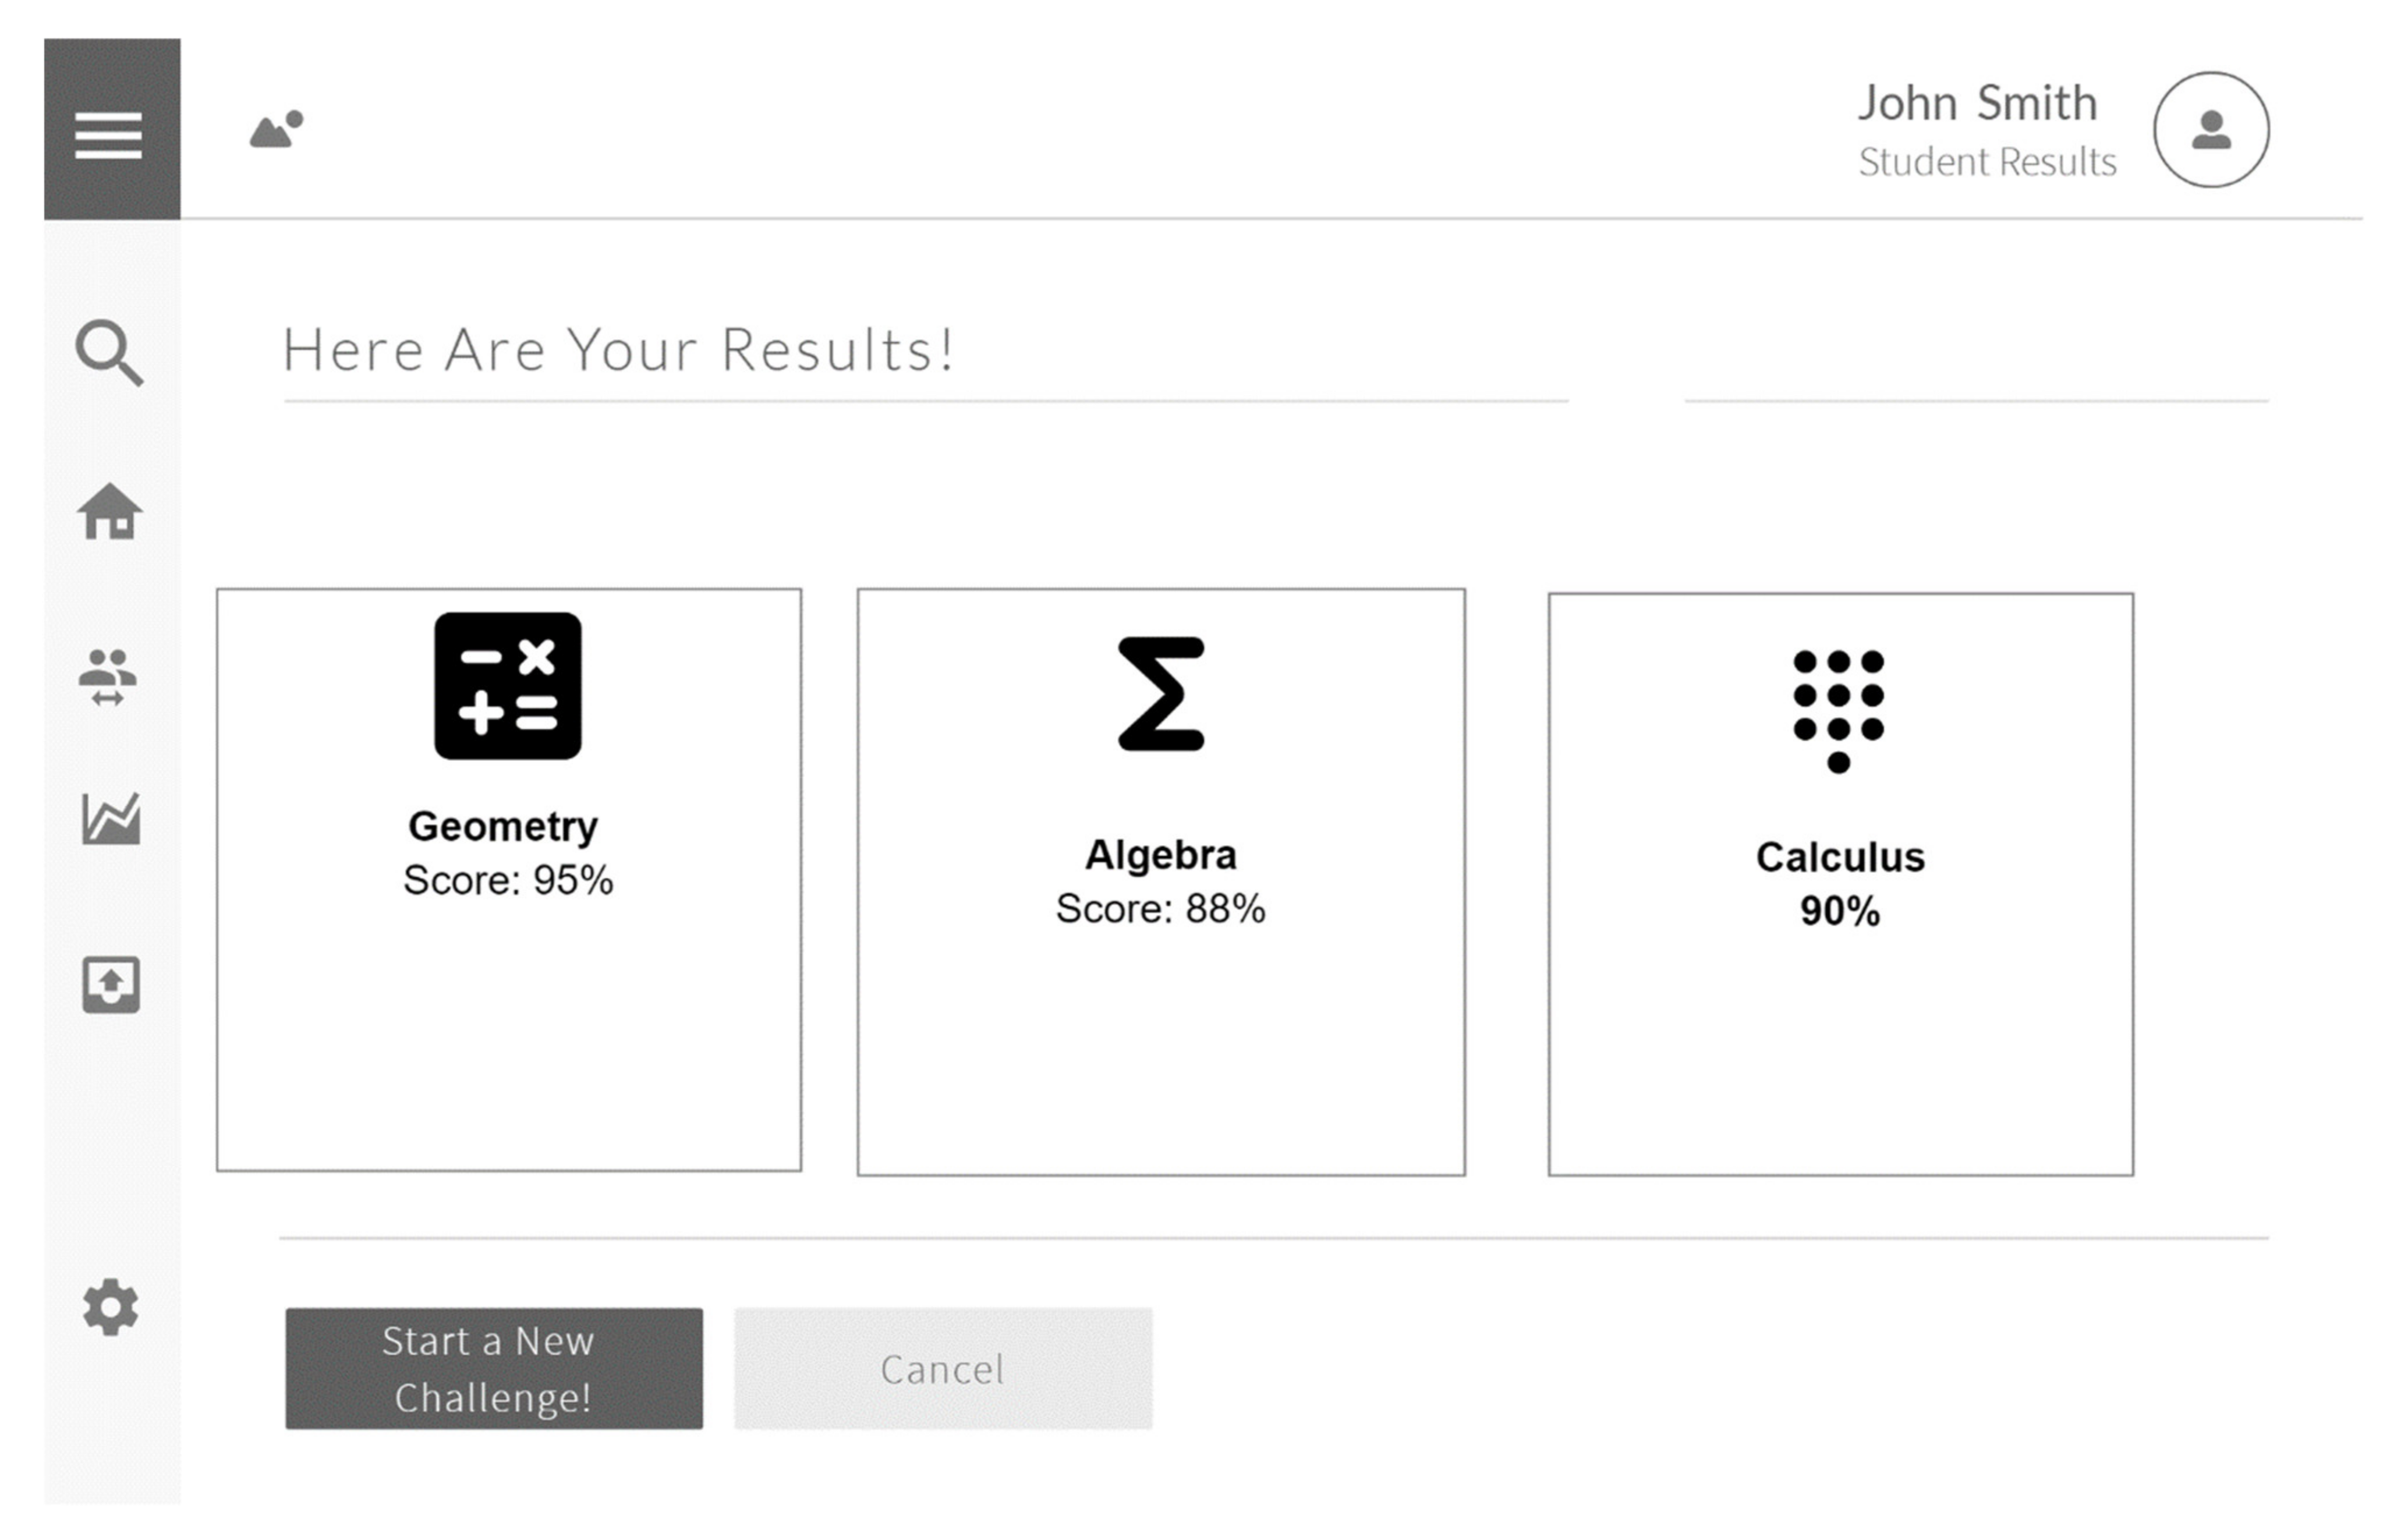
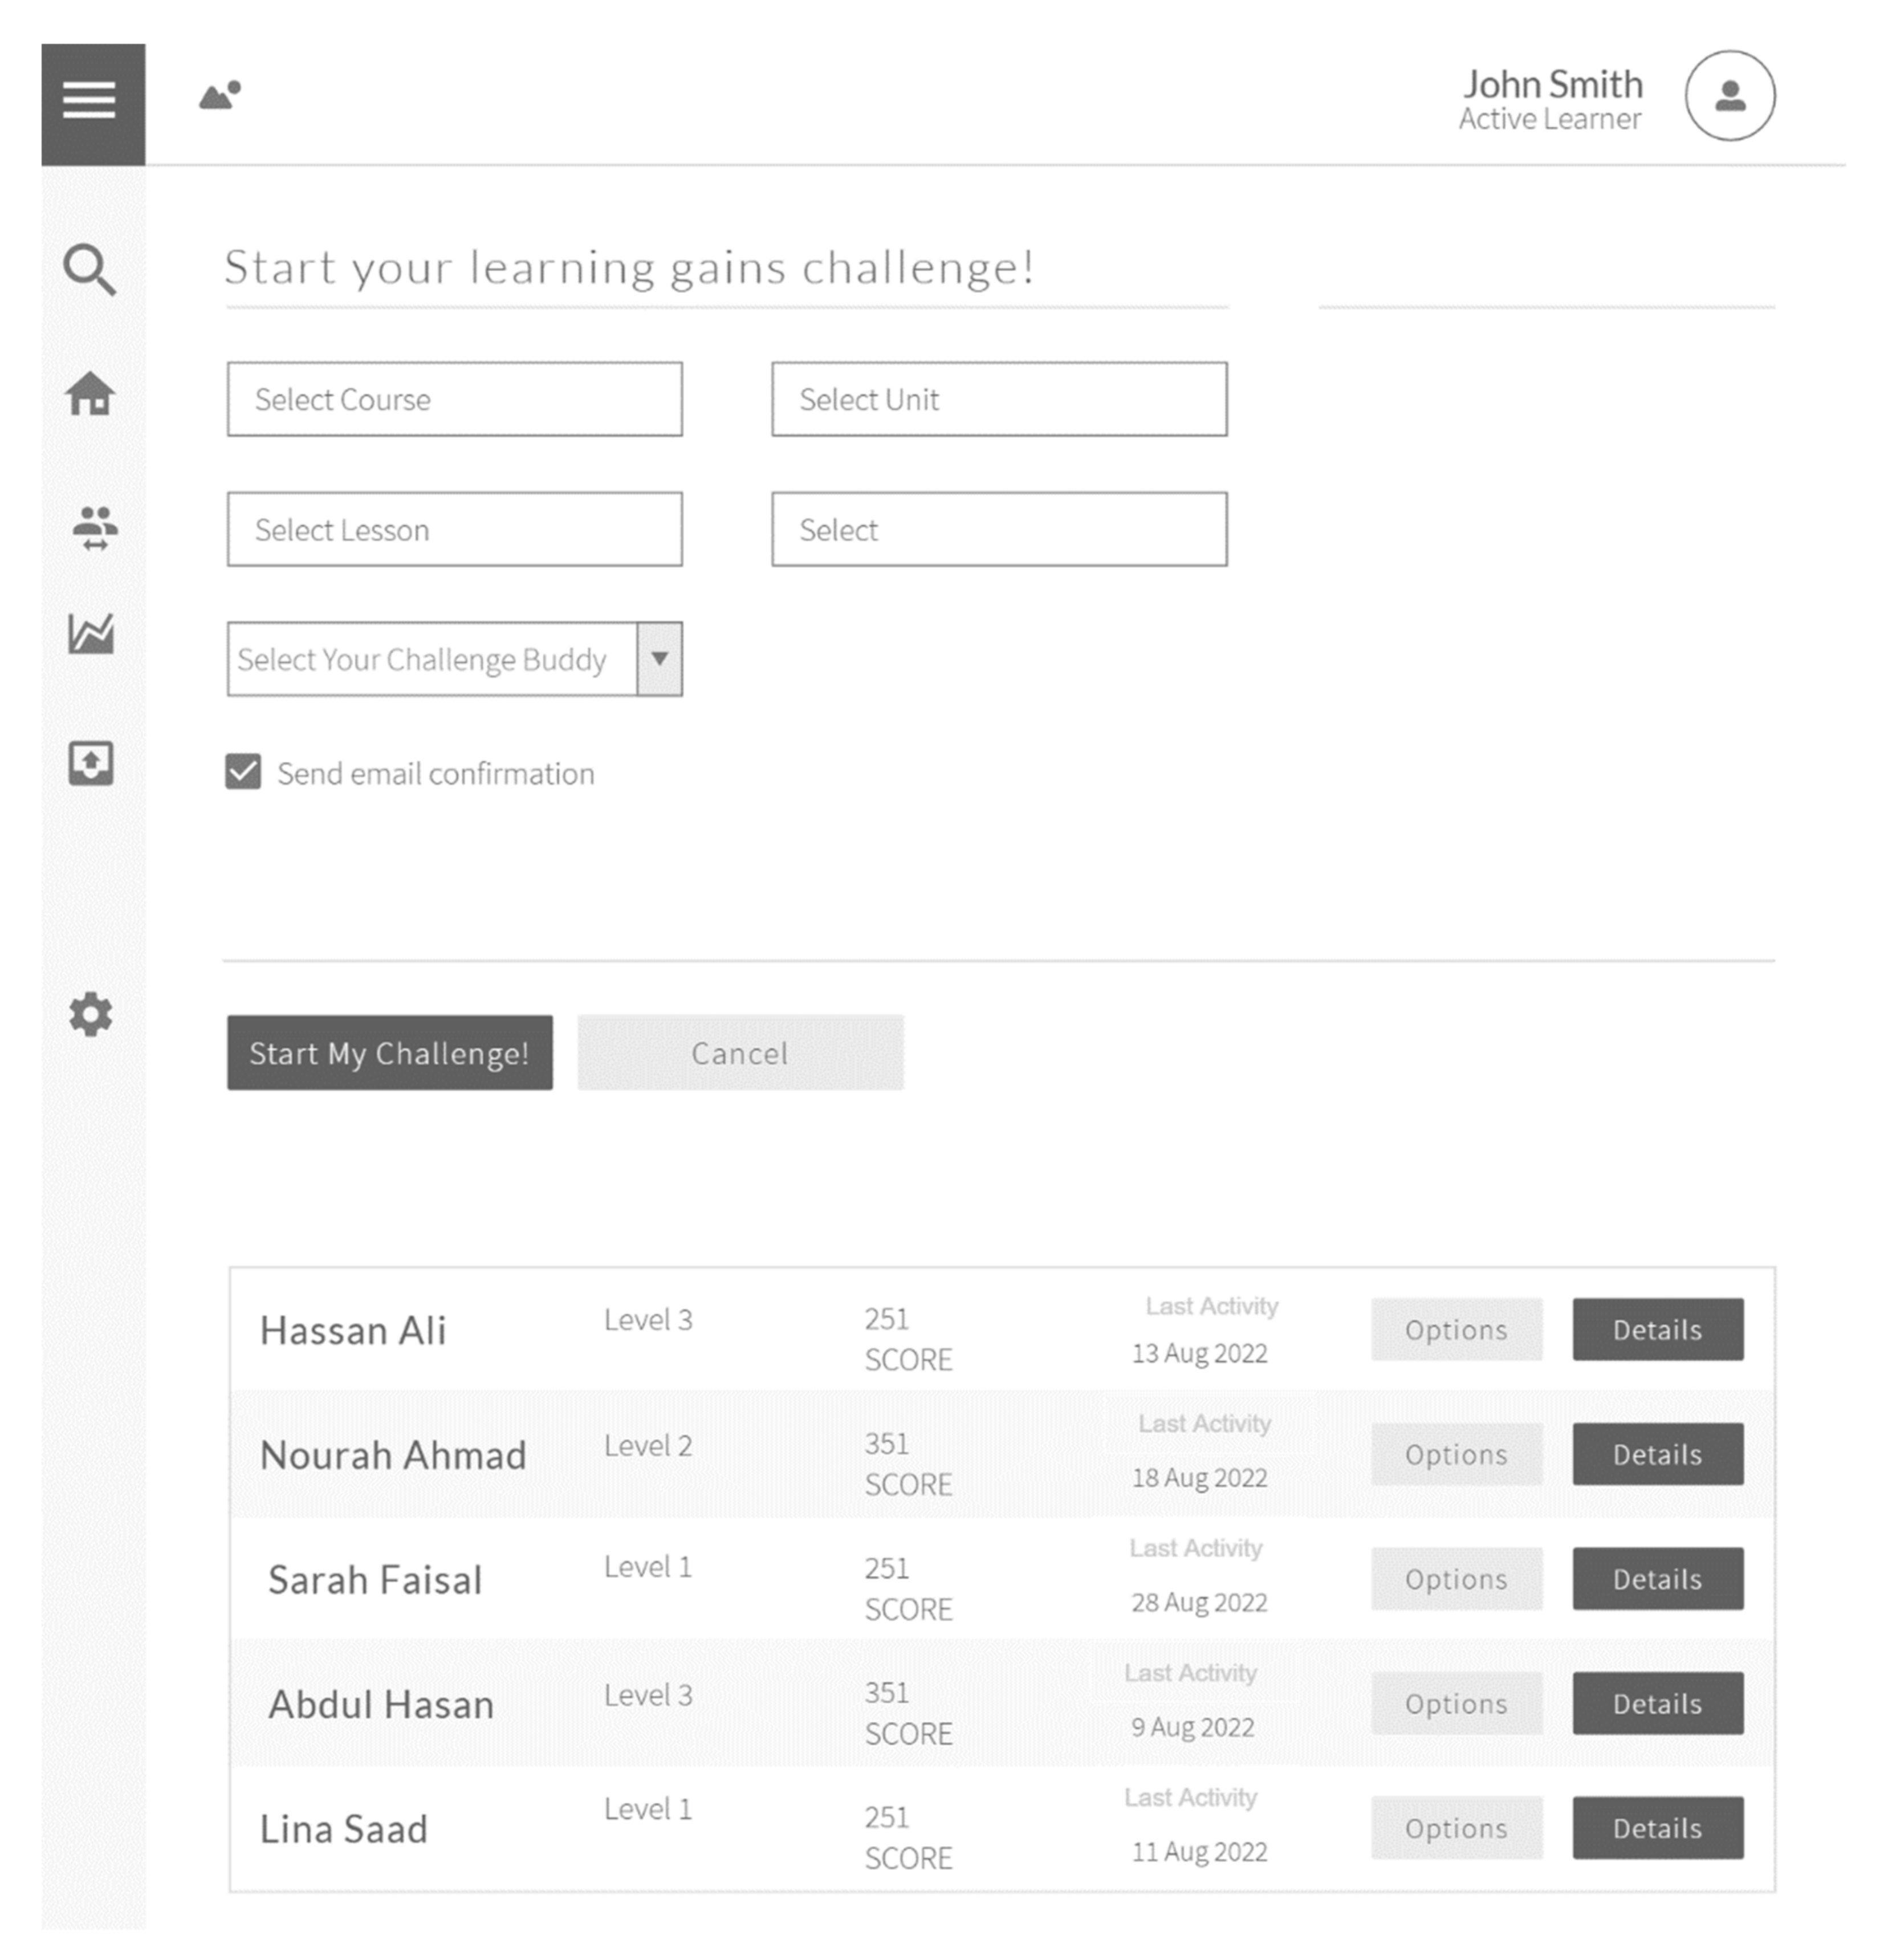
5.6. Prescriptive Phase (4th Page Interface)

The fourth page interface enables students to take or re-take previous tests, based on what they have learned through the automatically prescribed program in previous descriptive stages. They can check their progress after learning and practice, through the customized learning program, according to their level of learning loss, as it is tailored to their individual preferences and instructional needs. Results can be shared on the main page of the course LMS, to encourage and motivate other students to compete with their colleagues. System outcomes can also be programmed to be posted on the achievement dashboard throughout the system. Teachers can provide support and one-on-one feedback during the in-person sessions of the class. The results can inform instruction and remedial learning plans.
This phase contains post-assessment test questions, to measure the achievement of previous school-level learning outcomes. Students can see their progress and course completion tasks, as presented in Figure 5. A final report and certificate show student progress and achievement. The teacher can then accept the completion grade or direct the student to repeat the course. Students’ performance on a grade level can be measured and compared to previous cohorts, prior to the pandemic, at the same grade level. Students’ performance on an individual level can be evaluated by the number of learning outcomes they were able to attain. The progress frame of reference can provide learners with the ability to visualize their progress over time and access their historical data.
Throughout this phase, the system can provide students with an option to learn by completing exercises with a partner or group of students. Students can then view the progress and achievements of their colleagues, to enhance their motivation to use the system. Students can also choose to lock or unlock their personal achievements, until they reach advanced progress on the system. Such learning opportunities enhance social learning and competitiveness among students, through a gamified learning experience, as presented in Figure 6. Both teachers and school administrators can view students’ progress and import reports of individuals or groups as presented in Figure 7. Final grades or outcomes can be added to the current-year academic progress in the teacher or administrator dashboard. Recent studies show that it is better not to teach previous content to remedy learning loss; teaching new content yields the best results [26].

6. Evaluation (Issues to Consider for a Learning Analytics Dashboard—LAD)

It is known that the learning process involves a sufficient mastery of knowledge, skills, and competencies. A successful learning process depends largely on theoretical cornerstones, which should be taken into consideration by instructional designers and policy makers. Such components, which are crucial for determining the process of learning and its success include the (1) teachers’ role, (2) learners’ performance role, and (3) digital content role.

6.1. Teachers’ Role

The teacher’s role is maintained through monitoring students’ performance, facilitating potential challenges, answering ambiguous questions, and discussing periodical and summative reports with students. Sedrakyan et al. [60] indicated that learners need both task-related feedback that improves learning outcomes and process-related feedback that informs the needs for behavioral change from their teachers. Through instructional scaffolding, teachers offer support to enhance learning and aid with mastering tasks. As students learn new skills, they build their experiences and knowledge systematically. Teachers support students for better self-paced learning and serve as knowledge activators and facilitators of skills acquisition. Zheng et al. [5] have shown the influence of teachers’ thoughts and feelings on the process of achieving the objectives of learning, the nature of the process of collaborative learning, and how learning can be achieved in the best possible manner. Teachers provide a link between students’ learning needs and what is taught in-class and out-of-class (online).

6.2. Learners’ Performance Role

Learners’ performance plays a key role throughout the process of learning, which vastly depends on learning useful content. It can be sustained through self-regulated learning. Tempelaar, Rienties, and Nguyen [61] asserted that LA is a contributor for providing predictions concerning learners’ performance; it has become crucial to situate smart learning goals for the possible assessment of learners’ efforts. According to Zimmerman (1990), self-regulated learning refers to self-created emotions, feelings, and behaviors, which are seen as contributors to achieving the learning goals. These emotions include anger, enjoyment, anxiety, frustration, curiosity, confusion, and surprise. It is vital to understand the differences between learning goals and performance goals Learning goals [62] typically consist of a learning component, demonstrating acquisition of knowledge, skills, or a change in behavior. Learning goals focus the learners’ attention on processes and the strategies to acquire them. In contrast, performance goals consist of a component related to completing a task on hand, without focusing on the role of strategies in completing tasks [62]. Both goals are crucial to minimize learning loss and to activate learners’ performance, when a recovery plan is initiated.

6.3. Digital Content Role

In addition to the roles of learners and teachers mentioned earlier, digital content is considered a crucial factor to enable the process of learning. The design of digital content is a collaborative process that is shared among teachers, instructional supervisors, and instructional designers, to ensure the quality of the content delivered. Recommended units for accomplishing the most-needed learning outcomes, through selective multimodal content, and supporting self-regulated learning, include videos, quizzes, webinars, and tests, for each subject area. The existence of high-quality digital content largely depends on the technologies and tools used to keep the participants interested and motivated. Digital content has become clearer with the advent of Web 2.0 technologies, as they enable users to create, remix, and share such online-based content in much more flexible ways than before, confirming that such technologies are spaces for social interactions. According to Fansury et al. [63], digital content comes in a variety of formats, including ‘text or writing, images, videos, audio, or a combination that is converted by the reader into code so that it can be read, displayed, or played by a digital machine or computer’ (p. 3). Such digitally oriented content should be considered when designing modules or units, so they may support the processes of formative and summative assessment.

7. Discussion

The proposed LLRD prototype has several potentials, and it serves the achievement of multiple educational goals. It facilitates students’ acquisition and improvement of self-regulated learning skills, provides learners with focused and short learning courses utilizing microlearning strategies, acts as the critical phase of potential required innervation, and supports motivating students and raising their engagement with the subject matter according to gamification principles.

7.1. Self-Regulated Learning

The LLRD prototype facilitates students’ acquisition and improvement of self-regulated learning skills [64]. Academically successful students are those who are confident in their learning skills and self-regulated learning, as well as those who are able to exert control on their learning and manage it in a self-reliant manner [65,66]. They perceive learning as a systematic and controllable process and are able to define their learning objectives. They take responsibility for achieving their learning goals and maintain proactiveness in dealing with learning challenges and difficult study conditions [67]. These behaviors of self-efficacy and active involvement in planning the acquisition of knowledge and maintaining continuous self-evaluation will support students to be independent and life-long learners with 21st-century skills. The LLRD facilitates students to take full control of their learning, employ motivational strategies more extensively, and effectively strategize the learning process [68]. The proposed LLRD supports the improvement of self-regulated learning skills, enabling learners to increase their chances for remedial loss efforts and for reinforcement in future-learning processes. Learning sessions can be self-paced, but, initially, scheduled for students by their teachers, who can help plan the start and end dates.

7.2. Microlearning

The LLRD prototype is designed to provide learners with focused and short learning courses, utilizing microlearning strategies. Microlearning refers to short learning activities with microcontent [69], which involve teaching and learning through small learning units and short-term educational activities. Through microlearning, learners control what and when they are learning. This supports learners’ creation, transfer, and retention of knowledge [70]. It, also, encourages continuous lifelong learning, and it can bridge the gap between formal and informal learning [71]. Prior research identified that millennial-generation students require new pedagogical strategies. They expect their education to be immediate, interactive, and enriched by group activities. This generation is more engaged in learner-centered classroom environments, and technology is one of the most engaging tools for them. The LLRD prototype design is ideated to provide learners with microcontent and learning tasks with a “small, manageable chunk of information more regularly” [72], to suit millennial students’ learning needs and strategies.

7.3. Scaffolding ZPD

The third stage of the LLD prototype acts as the critical phase of potential required innervation. It represents the zone of proximal development, where background knowledge is observed and measured; then, information, knowledge, and understanding are analyzed for instructional intervention. This stage leads to obtaining meaningful feedback for teachers and facilitates the identification of the level of learning loss in terms of its breadth and depth, providing indicators of learning standards and goals for instruction. It, also, facilitates setting the obtainable performance level for achieving learning retention. The Zone of Proximal Development (ZPD) is “the distance between the actual developmental level as determined by independent problem solving and the level of potential development as determined through problem-solving under adult guidance, or in collaboration with more capable peers” [73], (p. 86). Vygotsky believed that when a student is in the zone of proximal development for a particular task, providing the appropriate assistance will give the student enough of a “boost” to achieve the task. One of the most effective strategies to assist learners to move through the zone of proximal development is through scaffolding, which consists of supportive activities provided for learners as they are led through the ZPD. Support is tapered, when the students are able to complete the task again on their own, so they will be able to achieve the learning goal beyond their unassisted efforts. The LLRD stages provide the appropriate assistance students need, as identified by the system.

7.4. Gamification

The LLRD prototype is designed around the concept of gamification, which is the application of game-design elements and game principles in non-game contexts; some classic game elements are points, badges, and leaderboards. Gamification helps to motivate students and make them more engaged with the subject matter. According to gamification theory, learners learn best when they have goals, targets, and achievements to reach for in a way they perceive as fun [74]. The game-based elements in the LLRD include point scoring, peer competition, and score tables. These elements drive sustained engagement, encourage students to test their knowledge, promote self-teaching, and support using technology, to streamline teachers’ workload and make learners more visible through progress indicators. The LLRD prototype is designed around giving points for students that are meeting learning-outcomes objectives. Through this points system, students move up through the ranks, creating competition within the classroom, while working on gaining any potential knowledge or skills lost from distance learning during the pandemic. Through the gamified learning experience, while students are working on learning loss, other students are, also, enabled to compare and reflect on their personalized performance. Students feel they have ownership over their learning, and teachers can collect data, track progress, and tailor rules. Teachers can utilize students’ progression through levels and checkpoints, to provide support and focus for struggling students.

8. Conclusions

Studies from several countries suggest that school shutdowns put students up to six months behind the academic milestones their cohorts would typically be expected to reach. COVID-19 could result in a loss of between 0.3 and 0.9 years of schooling, adjusted for quality, bringing down the effective years of basic schooling that students achieve during their lifetime from 7.9 years to between 7.0 and 7.6 years. Additionally, without effective practical actions when students return to school, approximately $10 trillion of lifecycle earnings could be lost for this cohort of learners, which will increase their potential for dropping out of school [30]. One of the practical actions, to reduce the negative consequences of the pandemic, is to adopt this planned prototype of LLRD or similar solutions. It is designed for K–12 learners and their teachers, to lessen the negative consequences of COVID-19 on students’ performance and to alleviate potential academic loss due to school interruptions. This prototype adopts several instructional approaches, educational theories, and thinking frameworks, including the design-thinking approach, backward-instructional design, self-regulated learning, microlearning, scaffolding ZPD, and gamification. However, there are several limitations that are worth discussing, and these limitations, also, illustrate improvements that can be done in the future to improve this conceptual-system design. The proposed LAD should be examined empirically through different lenses. It can be improved, by collecting stakeholders’ perspectives, to enrich the design before implementation, with suggested improvements from different users’ evaluations and feedback. Further, it can be implemented through pilot application within limited parameters, such as one or two classes and a small sample size, to assess the strengths and weakness of the LAD and collect input for improvement. In addition, teachers as well as administrative and technical teams need to support integration during implementation and provide their feedback on each system phase. Finally, artificial intelligence technology and adaptive learning systems can leverage the system used to measure and lessen the learning loss impact, according to each learner’s needs, tailoring the experience to an individual learner’s characteristics.

Author Contributions

Conceptualization, T.I.A. and A.A.K.; methodology, T.I.A. software, T.I.A. and A.A.K.; validation, T.I.A. and A.A.K.; formal analysis, T.I.A. and A.A.K.; investigation, T.I.A. and A.A.K.; resources, T.I.A. and A.A.K.; data curation, T.I.A. and A.A.K.; writing—original draft preparation, T.I.A. and A.A.K.; writing—review and editing, A.A.K.; visualization, T.I.A. supervision, T.I.A. and A.A.K. A project administration, T.I.A.; funding acquisition, T.I.A. and A.A.K. All authors have read and agreed to the published version of the manuscript.

Funding

This research received no external funding.

Institutional Review Board Statement

Not applicable.

Informed Consent Statement

Not applicable.

Data Availability Statement

Not applicable.

Conflicts of Interest

The authors declare no conflict of interest.

References

  1. Bao, H.; Li, Y.; Su, Y.; Xing, S.; Chen, N.; Rosé, C. The effects of a learning analytics dashboard on teachers’ diagnosis and intervention in computer-supported collaborative learning. Technol. Pedagog. Educ. 2021, 30, 287–303. [Google Scholar] [CrossRef]
  2. Bodily, R.; Verbert, K. Review of research on student-facing learning analytics dashboards and educational recommender systems. IEEE Trans. Learn. Technol. 2017, 10, 1–15. [Google Scholar] [CrossRef]
  3. Vieira, C.; Parsons, P.; Byrd, V. Visual learning analytics of educational data: A systematic literature review and research agenda. Comput. Educ. 2018, 122, 119–135. [Google Scholar] [CrossRef]
  4. Gutiérrez, F.; Seipp, K.; Ochoa, X.; Chiluiza, K.; De Laet, T.; Verbert, K. LADA: A learning analytics dashboard for academic advising. Comput. Hum. Behav. 2020, 107, 105826. [Google Scholar] [CrossRef]
  5. Zheng, J.; Huang, L.; Li, S.; Lajoie, S.P.; Chen, Y.; Hmelo-Silver, C.E. Self-regulation and emotion matter: A case study of instructor interactions with a learning analytics dashboard. Comput. Educ. 2021, 161, 104061. [Google Scholar] [CrossRef]
  6. Choi, S.P.; Lam, S.S.; Li, K.C.; Wong, B.T.M. Learning analytics at low cost: At-risk student prediction with clicker data and systematic proactive interventions. J. Educ. Technol. Soc. 2018, 21, 273–290. [Google Scholar]
  7. Aguilar, S.J. Learning analytics: At the nexus of big data, digital innovation, and social justice in education. TechTrends 2018, 62, 37–45. [Google Scholar] [CrossRef]
  8. Romero, C.; Ventura, S. Educational data mining and learning analytics: An updated survey. WIREs Data Min. Knowl. Discov. 2020, 10, e1355. [Google Scholar] [CrossRef]
  9. Rienties, B.; Toetenel, L. The Impact of 151 Learning Designs on Student Satisfaction and Performance: Social Learning (Analytics) Matters. In Proceedings of the Sixth International Conference on Learning Analytics and Knowledge, Online, 25 April 2016; pp. 339–343. [Google Scholar] [CrossRef] [Green Version]
  10. Baker, R. Using Learning Analytics in Personalized Learning. In Handbook on Personalized Learning for States, Districts, and Schools; Murphy, M., Redding, S., Twyman, J.S., Eds.; Center on Innovations in Learning, Temple University: Philadelphia, PA, USA, 2016; pp. 165–174. Available online: https://www.adi.org/downloads/Personalized_learning_entirehandbook.pdf (accessed on 10 September 2021).
  11. Charleer, S.; Klerkx, J.; Duval, E.; De Laet, T.; Verbert, K. Creating Effective Learning Analytics Dashboards: Lessons Learnt. In Adaptive and Adaptable Learning: European Conference on Technology Enhanced Learning; Verbert, K., Sharples, M., Klobučar, T., Eds.; Springer: New York, NY, USA, 2016; pp. 42–56. [Google Scholar]
  12. Hwang, G.J.; Chu, H.C.; Yin, C. Objectives, methodologies and research issues of learning analytics. Interact. Learning Environ. 2017, 25, 143–146. [Google Scholar] [CrossRef] [Green Version]
  13. Liu, M.; Kang, J.; Zou, W.; Lee, H.; Pan, Z.; Corliss, S. Using data to understand how to better design adaptive learning. Technol. Knowl. Learn. 2017, 22, 271–298. [Google Scholar] [CrossRef]
  14. Siemens, G.; Gaševíc, D. Guest editorial–learning and knowledge analytics. Educ. Technol. Soc. 2012, 15, 1–2. [Google Scholar]
  15. Marzouk, Z.; Rakovic, M.; Liaqat, A.; Vytasek, J.; Samadi, D.; Stewart-Alonso, J.; Ram, I.; Woloshen, S.; Winne, P.H.; Nesbit, J.C. What if learning analytics were based on learning science? Australas. J. Educ. Technol. 2016, 32, 6. [Google Scholar] [CrossRef] [Green Version]
  16. Suthers, D.; Verbert, K. Learning Analytics as a “Middle Space”. In Proceedings of the Third International Conference on Learning Analytics and Knowledge, Leuven, Belgium, 8–12 April 2013; pp. 1–4. [Google Scholar] [CrossRef]
  17. Gasevic, D.; Tsai, Y.S.; Dawson, S.; Pardo, A. How do we start? An approach to learning analytics adoption in higher education. Int. J. Inf. Learn. Technol. 2019, 36, 342–353. [Google Scholar] [CrossRef] [Green Version]
  18. Wise, A.F. Designing Pedagogical Interventions to Support Student use of Learning Analytics. In Proceedings of the Fourth International Conference on Learning Analytics and Knowledge, Online, 24 March 2014; pp. 203–211. [Google Scholar] [CrossRef]
  19. Jivet, I. The Dashboard That Loved Me: Designing Adaptive Learning Analytics for Self-Regulated Learning. Ph.D. Thesis, Open Universiteit, Heerlen, The Netherlands, 2021. [Google Scholar]
  20. Schwendimann, B.A.; Rodriguez-Triana, M.J.; Vozniuk, A.; Prieto, L.P.; Boroujeni, M.S.; Holzer, A.; Gillet, D.; Dillenbourg, P. Perceiving learning at a glance: A systematic literature review of learning dashboard research. IEEE Trans. Learn. Technol. 2016, 10, 30–41. [Google Scholar] [CrossRef]
  21. Winne, P.H. A metacognitive view of individual differences in self-regulated learning. Learn. Individ. Differ. 1996, 8, 327–353. [Google Scholar] [CrossRef]
  22. Gašević, D.; Dawson, S.; Rogers, T.; Gasevic, D. Learning analytics should not promote one size fits all: The effects of instructional conditions in predicting academic success. Internet High. Educ. 2016, 28, 68–84. [Google Scholar] [CrossRef] [Green Version]
  23. Brooks, S.K.; Smith, L.E.; Webster, R.K.; Weston, D.; Woodland, L.; Hall, I.; Rubin, G.J. The impact of unplanned school closure on children’s social contact: Rapid evidence review. Eurosurveillance 2020, 25, 2000188. [Google Scholar] [CrossRef] [Green Version]
  24. Viner, R.M.; Russell, S.J.; Croker, H.; Packer, J.; Ward, J.; Stansfield, C.; Mytton, O.; Bonell, C.; Booy, R. School closure and management practices during coronavirus outbreaks including COVID-19: A rapid systematic review. Lancet Child Adolesc. Health 2020, 4, 397–404. [Google Scholar] [CrossRef]
  25. Von Hippel, P.T.; Hamrock, C. Do test score gaps grow before, during, or between the school years? Measurement artifacts and what we can know in spite of them. Sociol. Sci. 2019, 6, 43–80. [Google Scholar] [CrossRef] [Green Version]
  26. Kuhfeld, M.; Soland, J.; Tarasawa, B.; Johnson, A.; Ruzek, E.; Liu, J. Projecting the potential impacts of COVID-19 school closures on academic achievement. Educ. Res. 2020, 49, 549–565. [Google Scholar] [CrossRef]
  27. Adams-Prassl, A.; Boneva, T.; Golin, M.; Rauh, C. Inequality in the impact of the coronavirus shock: Evidence from real time surveys. J. Public Econ. 2020, 189, 104245. [Google Scholar] [CrossRef]
  28. Andrew, A.; Cattan, S.; Costa Dias, M.; Farquharson, C.; Kraftman, L.; Krutikova, S.; Phimister, A.; Sevilla, A. Inequalities in children’s Experiences of home learning during the COVID-19 lockdown in England. Fisc. Stud. 2020, 41, 653–683. [Google Scholar] [CrossRef]
  29. Grätz, M.; Lipps, O. Large loss in studying time during the closure of schools in Switzerland in 2020. Res. Soc. Stratif. Mobil. 2021, 71, 100554. [Google Scholar] [CrossRef]
  30. Azevedo, J.P.; Hasan, A.; Goldemberg, D.; Iqbal, S.A.; Geven, K. Simulating the Potential Impacts of COVID-19 School Closures on Schooling and Learning Outcomes: A Set of Global Estimates. Available online: https://pubdocs.worldbank.org/en/798061592482682799/covid-and-education-June17-r6.pdf (accessed on 5 September 2021).
  31. Von Hippel, P.T. How will the coronavirus crisis affect children’s learning? Unequally. Educ. Next 2020, 22, 2. Available online: https://www.educationnext.org/how-will-coronavirus-crisis-affect-childrens-learning-unequally-covid-19/ (accessed on 10 December 2021).
  32. Fernández-Nieto, G.M.; Kitto, K.; Buckingham Shum, S.; Martinez-Maldonado, R. Beyond the Learning Analytics Dashboard: Alternative Ways to Communicate Student Data Insights Combining Visualisation, Narrative and Storytelling. In Proceedings of the LAK22: 12th International Learning Analytics and Knowledge Conference, Online, 21–25 March 2022; pp. 219–229. [Google Scholar]
  33. Susnjak, T.; Ramaswami, G.S.; Mathrani, A. Learning analytics dashboard: A tool for providing actionable insights to learners. Int. J. Educ. Technol. High Educ. 2022, 19, 12. [Google Scholar] [CrossRef]
  34. Fleur, D.S.; van den Bos, W.; Bredeweg, B. Learning Analytics Dashboard for Motivation and Performance. In Lecture Notes in Computer Science; Springer: New York, NY, USA, 2020; pp. 411–419. [Google Scholar] [CrossRef]
  35. Baneres, D.; Rodriguez, M.E.; Serra, M. An early feedback prediction system for learners at-risk within a first-year higher education course. IEEE Trans. Learn. Technol. 2019, 12, 249–263. [Google Scholar] [CrossRef]
  36. Kokoç, M.; Altun, A. Effects of learner interaction with learning dashboards on academic performance in an e-learning environment. Behav. Inf. Technol. 2021, 40, 161–175. [Google Scholar] [CrossRef]
  37. Karaoglan Yilmaz, F.G.; Yilmaz, R. Learning analytics as a metacognitive tool to influence learner transactional distance and motivation in online learning environments. Innov. Educ. Teach. Int. 2020, 58, 575–585. [Google Scholar] [CrossRef]
  38. Han, J.; Kim, K.H.; Rhee, W.; Cho, Y.H. Learning analytics dashboards for adaptive support in face-to-face collaborative argumentation. Comput. Educ. 2021, 163, 104041. [Google Scholar] [CrossRef]
  39. Majumdar, R.; Akçapınar, A.; Akçapınar, G.; Flanagan, B.; Ogata, H. LAViEW: Learning Analytics Dashboard Towards Evidence-based Education. In Proceedings of the 9th International Conference on Learning Analytics and Knowledge, Tempe, AZ, USA, 4–8 May 2019; Society for Learning Analytics Research (SoLAR): Irvine, CA, USA, 2019; pp. 1–6. [Google Scholar]
  40. Chatti, M.A.; Muslim, A.; Guliani, M.; Guesmi, M. The LAVA Model: Learning Analytics Meets Visual Analytics. In Advances in Analytics for Learning and Teaching; Springer: New York, NY, USA, 2020. [Google Scholar] [CrossRef]
  41. Gras, B.; Brun, A.; Boyer, A. For and by Student Dashboards Design to Address Dropout. 2020. Available online: https://hal.inria.fr/hal-02974682 (accessed on 12 October 2021).
  42. He, H.; Dong, B.; Zheng, Q.; Li, G. VUC. In Proceedings of the ACM Conference on Global Computing Education, Online, 9 May 2019; pp. 99–105. [Google Scholar] [CrossRef]
  43. Kia, F.S.; Teasley, S.D.; Hatala, M.; Karabenick, S.A.; Kay, M. How patterns of students dashboard use are related to their achievement and self-regulatory engagement. In Proceedings of the Tenth International Conference on Learning Analytics and Knowledge, Online, 23 March 2020; pp. 340–349. [Google Scholar] [CrossRef] [Green Version]
  44. Naranjo, D.M.; Prieto, J.R.; Moltó, G.; Calatrava, A. A visual dashboard to track learning analytics for educational cloud computing. Sensors 2019, 19, 2952. [Google Scholar] [CrossRef] [Green Version]
  45. Owatari, T.; Shimada, A.; Minematsu, T.; Hori, M.; Taniguchi, R. Real-time learning analytics dashboard for students in online classes. In Proceedings of the International Conference on Teaching, Assessment, and Learning for Engineering (TALE), Takamatsu, Japan, 8–11 December 2020. [Google Scholar] [CrossRef]
  46. Ulfa, S.; Fattawi, I.; Surahman, E.; Yusuke, H. Investigating learners’ perception of learning analytics dashboard to improve learning interaction in online learning system. In Proceedings of the 5th International Onference on Education and Technology (ICET), Online, 4–5 October 2019. [Google Scholar] [CrossRef]
  47. Aljohani, N.R.; Daud, A.; Abbasi, R.A.; Alowibdi, J.S.; Basheri, M.; Aslam, M.A. An integrated framework for course adapted student learning analytics dashboard. Comput. Hum. Behav. 2019, 92, 679–690. [Google Scholar] [CrossRef]
  48. Mueller-Roterberg, C. Handbook of Design Thinking: Tips and Tools for How to Design Thinking; Independently Published: Chicago, IL, USA, 2018. [Google Scholar]
  49. Wiggins, G.; McTighe, J. Backward Design. In Understanding by Design; ASCD: Alexandria, VA, USA, 1998; pp. 13–34. [Google Scholar]
  50. Jaakkola, E. Designing conceptual articles: Four approaches. AMS Rev. 2020, 10, 18–26. [Google Scholar] [CrossRef] [Green Version]
  51. Gilson, L.L.; Goldberg, C.B. Editors’ comment: So, what is a conceptual paper? Group Organ. Manag. 2015, 40, 127–130. [Google Scholar] [CrossRef] [Green Version]
  52. MacInnis, D.J.; De Mello, G.E. The concept of hope and its relevance to product evaluation and choice. J. Mark. 2005, 69, 1–14. [Google Scholar] [CrossRef]
  53. Park, Y.; Jo, I.H. Development of the learning analytics dashboard to support students’ learning performance. J. Univers. Comput. Sci. 2015, 21, 110–133. [Google Scholar] [CrossRef]
  54. Ali, L.; Asadi, M.; Gaševíc, D.; Jovanovíc, J.; Hatala, M. Factors influencing beliefs for adoption of a learning analytics tool: An empirical study. Comput. Educ. 2013, 62, 130–148. [Google Scholar] [CrossRef]
  55. Venant, R.; Vidal, P.; Broisin, J. Evaluation of learner performance during practical activities: An experimentation in computer education. In Proceedings of the 16th IEEE International Conference on Advanced Learning Technologies, Austin, TX, USA, 25–28 July 2016; pp. 237–241. [Google Scholar] [CrossRef] [Green Version]
  56. Pintrich, P.R. Multiple goals, multiple pathways: The role of goal orientation in learning and achievement. J. Educ. Psychol. 2000, 92, 544–555. [Google Scholar] [CrossRef]
  57. Butler, D.L.; Winne, P.H. Feedback and self-regulated learning: A theoretical synthesis. Rev. Educ. Res. 1995, 65, 245–281. [Google Scholar] [CrossRef]
  58. Winne, P.H. Learning Analytics for Self-Regulated Learning. In Handbook of Learning Analytics; Lang, C., Siemens, G., Wise, A., Gašević, D., Eds.; Society for Learning Analytics Research: Online, 2017; pp. 241–249. [Google Scholar]
  59. Ochoa, X.; Wise, A.F. Supporting the shift to digital with student-centered learning analytics. Educ. Technol. Res. Dev. 2021, 69, 357–361. [Google Scholar] [CrossRef]
  60. Sedrakyan, G.; Malmberg, J.; Verbert, K.; Järvelä, S.; Kirschner, P.A. Linking learning behavior analytics and learning science concepts: Designing a learning analytics dashboard for feedback to support learning regulation. Comput. Hum. Behav. 2020, 107, 105512. [Google Scholar] [CrossRef]
  61. Tempelaar, D.; Rienties, B.; Nguyen, Q. The contribution of dispositional learning analytics to precision education. Educ. Technol. Soc. 2021, 24, 109–122. [Google Scholar]
  62. Schunk, D.H. Attributions as motivators of self-regulated learning. In Motivation and Self-Regulated Learning: Theory, Research, and Applications; Schunk, D.H., Zimmerman, B.J., Eds.; Routledge: London, UK, 2008; pp. 245–266. [Google Scholar]
  63. Fansury, A.H.; Januarty, R.; Ali Wira Rahman, S. Digital content for millennial generations: Teaching the English foreign language learner on COVID-19 pandemic. J. Southwest Jiaotong Univ. 2020, 55, 3. [Google Scholar] [CrossRef]
  64. Zimmerman, B.J.; Martinez-Pons, M. Construct validation of a strategy model of student self-regulated learning. J. Educ. Psychol. 1988, 80, 284–290. [Google Scholar] [CrossRef]
  65. Moore, M.G. Editorial: Distance education theory. Am. J. Distance Educ. 1991, 5, 1–6. [Google Scholar] [CrossRef]
  66. Moore, M.G. Theory of transactional distance. In Theoretical Principles of Distance Education; Keegan, D., Ed.; Routledge: London, UK, 1993; pp. 22–38. [Google Scholar]
  67. Zimmerman, B.J. Self-regulated learning and academic achievement: An overview. Educ. Psychol. 1990, 25, 3–17. [Google Scholar] [CrossRef]
  68. Hodges, C.; Moore, S.; Lockee, B.; Trust, T.; Bond, A. The Difference between Emergency Remote Teaching and Online Learning. Available online: https://er.educause.edu/articles/2020/3/the-difference-between-emergency-remote-teaching-and-online-learning (accessed on 11 December 2021).
  69. Hug, T. Didactics of Microlearning: Concepts, Discourses and Examples; Waxmann Verlag: Münster, Germany, 2007. [Google Scholar]
  70. Sun, G.; Cui, T.; Yong, J.; Shen, J.; Chen, S. Drawing micro learning into MOOC: Using fragmented pieces of time to enable effective entire course learning experiences. In Proceedings of the IEEE 19th International Conference on Computer Supported Cooperative Work in Design (CSCWD), Calabria, Italy, 6–8 May 2015; pp. 308–313. [Google Scholar] [CrossRef] [Green Version]
  71. Buchem, I.; Hamelmann, H. Microlearning: A strategy for ongoing professional development. eLearning Pap. 2010, 21, 1–15. [Google Scholar]
  72. Beaudin, J.S.; Intille, S.S.; Morris, M. Microlearning on a Mobile Device. In UbiComp; Dourish, P., Friday, A., Eds.; Springer: New York, NY, USA, 2006; Volume 4206, pp. 1–2. [Google Scholar]
  73. Vygotsky, L.S. Mind in Society: The Development of Higher Psychological Processes; Harvard University Press: Cambrdige, MA, USA, 1978. [Google Scholar]
  74. Antonaci, A.; Klemke, R.; Specht, M. The effects of gamification in online learning environments: A systematic literature review. Informatics 2019, 6, 32. [Google Scholar] [CrossRef] [Green Version]
Figure 1. Design of the prototype architecture.
Sustainability 14 05944 g001
Figure 2. Sign-up page and assessment of previous learning.
Sustainability 14 05944 g002
Figure 3. Diagnostic phase—1st page interface.
Sustainability 14 05944 g003
Figure 4. Descriptive phase—2nd page interface.
Sustainability 14 05944 g004
Figure 5. Predictive phase—3rd page interface.
Sustainability 14 05944 g005
Figure 6. Prescriptive phase—4th page interface.
Sustainability 14 05944 g006
Figure 7. Overall students’ performance results.
Sustainability 14 05944 g007aSustainability 14 05944 g007b
Publisher’s Note: MDPI stays neutral with regard to jurisdictional claims in published maps and institutional affiliations.

