Article

The Effect of Cultural Orientations on Country Innovation Performance: Hofstede Cultural Dimensions Revisited?

by
Diana Escandon-Barbosa
*,
Agustin Ramirez
and
Jairo Salas-Paramo
Gestion de Organizaciones Department, Facultad de Ciencias Economicas y Administrativas, Pontificia Universidad Javeriana, Cali 760031, Colombia
*
Author to whom correspondence should be addressed.
Sustainability 2022, 14(10), 5851; https://doi.org/10.3390/su14105851
Submission received: 14 March 2022 / Revised: 4 May 2022 / Accepted: 5 May 2022 / Published: 12 May 2022
(This article belongs to the Topic Open Innovation and Entrepreneurship)

Abstract

:
Purpose. One of the perspectives that receives the most attention from studies in international business is cultural dimensions. This is due to the greater complexity and incidence of cultural aspects in economic performance. This paper explored the moderation effect of cultural orientations on the creation of innovation trajectories related to levels of innovation and their outcomes in countries from various geographical areas between 2011 and 2021. Design/Methodology/Approach. A growth trajectories model is conducted to achieve the research’s aim, considering the country’s cultural orientation, innovation inputs (institutions, human capital and research, infrastructure, market sophistication, and business sophistication), and impact on innovation output. The Global Innovation Index, Globe Project, and Global Entrepreneurship Index databases used this analysis, containing data from nations on different continents. The trajectories’ analysis approach is utilized to achieve the desired goal, which allows for the assessment of the variations in innovation trajectory across countries with cultural tendencies towards performance and humane orientation from 2011 to 2021. Findings. The literature affirms positive results for various innovation inputs, but the results show differences in innovation outputs. The difference is related to their inputs (institutions, human capital and research, infrastructure, market sophistication, business sophistication), institutions, and market sophistication. Additionally, a difference depends on the country’s performance culture, generating options to obtain higher outputs, such as knowledge and creative results. Research Limitations/Implications. Based on the results achieved, an attempt is made to provide a different perspective on innovation, especially evaluating the results over time and identifying decreasing trajectories that affect the innovation results in countries with different economic development conditions and cultural characteristics. Practical Implications. The results achieved make it possible to strengthen the analysis of the countries’ strategies regarding innovation, especially in the permanent evaluation of the results, which encourages changes in the execution of innovative activities to maintain their performance over time. Social Implications. The contributions allow us to understand the dynamics of innovation in countries’ knowledge and creative outputs over time. Originality/Value. The trajectory analysis used in the data analysis is perhaps one of the most robust techniques for a time series analysis. This allows for identifying trajectories for the study’s independent variables and their influence on a country’s innovation.

1. Introduction

One of the main concerns of institutions such as the World Bank has been introducing a platform that allows the development of innovation [1]. One of the innovation programs promoted by the European Union aims to develop an efficient system for 2021–2027, which allows monitoring, implementing, and evaluating policies to stimulate innovation. These agreements promulgated by different countries aim to achieve results and transfer knowledge that will promote competitiveness in countries worldwide.
In this way, studies carried out by different institutions have shown an effective use of funds for innovation to stimulate growth and productivity in a country. At the same time, they mark the creation of skills to work, especially for the sector of small and medium-sized companies [1]. Nevertheless, studies that delve into the main factors that stimulate or restrict business innovation activity are still required. This is related to the roles of constructs and external and internal factors that allow an adequate understanding of this phenomenon [2].
Innovation is conceived as the implementation of creative ideas that add value to the dynamics of a company [3]. In this way, innovation would include many aspects of the different processes carried out by an organization, including factors such as its culture. This is how innovation is considered a result of the interactions between different actors that allows the achievement of superior performance in the firm’s objectives.
Research in the field of innovation has considered aspects such as sustainability [3,4,5], use of technology [6,7,8], rural studies [9], social innovation [10], country studies [11,12,13], educational innovation [14,15], and political studies [16].
Each of the studies establishes ways of seeing innovation at the organizational and country levels. Additionally, there are many definitions of what innovation is, many of which remain ambiguous and can influence the development of innovation as a field of knowledge. For authors such as Singh and Aggarwal [17], several studies have shown up to 60 different types of innovation. These definitions have established innovation as a multi-phase process that transforms creative ideas into new processes and products to compete and differentiate in the marketplace. However, there is still a need to investigate what other elements are involved in innovation, emphasizing macro-level studies that consider different actors and their role in developing platforms that allow innovative processes, products, and services in other economic sectors [12].
A relevant contribution to highlight from this study is to explain the differences in performance between countries, considering the innovation theory and its postulates on how the processes of adoption, spread, and diffusion of innovations are carried out [18]. Another important aspect in the field of knowledge is the identification of the dynamics that are characteristic of both developed and developing countries, including country mapping, where various national development agencies intervene to support innovation [19]. Regarding the methodology, it is important to use other types of alternative analysis techniques in the field to those already existing.
This is the case of growth trajectory models developed under Bayesian statistics. This is because they allow interaction processes to find the path (trajectory) followed by each country in its levels of innovation created in the presence of factors that constantly change over time. Another important aspect of the growth trajectories model is its predictability, which is extended to growth patterns associated with innovation results. This approach outperforms linear growth, as it allows for the consideration of the values between the extremes, enabling the consideration of additional factors that affect innovation [20].
In this way, the first gap found in the literature is the need to identify the nature of the different inputs that allow the study of innovation at the country level [12]. Similarly, a second gap found is related to identifying behavior patterns of countries that compete strongly in the market. An example is the case of Asian and American countries using technology, market strategies, and the way they compete in their national markets through innovation. A third gap to which this study is directed is related to the trajectory analysis technique. This data analysis technique considers a set of inputs that affect the results related to innovation in each time range. In this way, it will be possible to identify countries’ groupings with specific behaviors characterized by different performance levels related to innovation.
The approach adopted by this study will allow us to respond to the three gaps found, especially to the development of the field of innovation from the country-level perspective. Similarly, this analysis considers the moderating effects of Hofstede’s cultural dimensions (Masculinity/femininity, uncertainty avoidance index, power distance index, long-term/short term orientation, individualism/collectivism, indulgence/restraint) that allow us to investigate the importance of the cultural dimension at the country level in activities related to innovation.
To achieve the objectives of this research, the paper is structured as follows: In the first part, an analysis is conducted on the different studies on innovation, particularly from the perspective of the theory of innovation and the different gaps found. In the second part, an analysis is conducted on Hofstede’s cultural dimensions and the role of innovation in cultural processes at the country level. In the third part, the approach to the methodology used and the results and conclusions of the study are discussed.

2. Theoretical Framework

2.1. Innovation Theory

The theory of innovation was introduced by Rogers in 1962, establishing four key components of the diffusion of technology: communication, social system, time, and innovation. In 2003, his approach was revalued, resulting in the definition of phases of technology diffusion: persuasion, implementation, decision, confirmation, and knowledge [21].
According to the innovation theory, every innovative adoption process in an organization considers five fundamental aspects [22]. The first aspect relates to how innovation is perceived as beneficial for an organization compared to other organizations inclined to develop innovative processes. The second aspect is associated with the relationship between innovation and values, experiences, or business processes with innovations with a high probability of acceptance. The third aspect comprises the relationship between adopting innovation and ease of use. The latter shows negative results in studies [23]. The fourth aspect focuses on the visibility of the innovation and the results obtained that were positively related to adoption. The fifth aspect is related to testing the innovation that reduces the uncertainty in the adoption process [22].
In consequence, the innovation processes that companies adopt require the consideration of the aspects of their environment, such as the institutional conditions at the country level. In the literature, it is possible to find studies that focus on identifying the factors that influence the development of country innovation. These studies have mostly focused on how various factors induce technological changes related to performance and humane orientation [24].
Other studies have found that factors that are not easily visible influence innovation at the country level. Culture appears as a fundamental element [25]. In this way, the model established by Hofstede allows the identification of dimensions that characterize the cultural dynamics. According to Andrijauskienė et al. [26], several studies support contributions to the relationship between culture and innovation. However, this approach has not been free from criticism.
According to Gallego-Álvarez and Pucheta-Martínez [27], culture has been defined as one of the most significant factors that impacts innovation at the national and international levels. Among the first analyses on the relationship between innovation and culture is that of Shane [28]. This study analyzed the relationship between the organizations’ innovation processes, considering several countries in the research, and the dimensions proposed by Hofstede. Later studies emphasized companies from different continents. These studies show that culture allows the observation of the relationship between cooperation activities carried out by other companies and how it impacts innovation activities in the countries studied [29,30].
Regarding country culture and country innovation, many studies have analyzed the relationship between Hofstede’s cultural dimensions and how innovation is stimulated [31]. Other authors have investigated the relationship between culture and companies in European countries, highlighting some cultural dimensions that are stronger than others [32]. Other studies emphasize that there should always be a cultural analysis in innovation studies since innovation involves individuals who interact with resources and the values that society establishes in the behaviors of its citizens [31,33].
However, scholars have argued that not all cultural dimensions have the same impact. Therefore, they raise the need to continue deepening studies, especially in Western countries, as culture influences innovation at the country level. Asian countries have the most significant influence on dimensions such as collectivism, which has stood out as achieving the highest results in innovation in the world. For scholars like Kaasa and Vadi [32], combining the cultural dimensions rather than analyzing the dimensions separately is necessary. Therefore, the present research explores this combination of Hofstede dimensions through the Globe Index.

2.2. Performance and Humane Orientation as Categories of the Cultural Dimension

This research considers the categorization established by the Globe project for cultural dimensions based on Hofstede’s work. This categorization considers Hofstede’s dimensions in two groups: performance and humane orientation. The performance orientation groups together the dimensions of masculinity, uncertainty avoidance, power distance, and long-term orientation. The humane orientation groups femininity, collectivism, and adds institutional environment [34].
The performance orientation considers all those aspects in which reward mechanisms are created for innovation, high standards, excellence, and performance improvement. According to [35], this type of society tends to be more materialistic, prioritizing rewards, and is characterized by ambiguous objectives. In this way, this society would oppose those with a low inclination to this type of orientation. In this case, it would be the humane orientation, which is characterized by a direction more focused on social values, family relationships, and the importance given to the quality of life [36,37].
It is possible to find in the literature that the level of development of the countries will influence the conditions for the creation of innovation opportunities. At the same time, this allows for the taking advantage of local knowledge, networks, legitimacy, and especially ensuring the expected social impact [38]. In the case of developed countries, they do not only have the necessary infrastructure for firms to operate correctly, such as support institutions, government entities, and policies [39], they also have the cultural conditions that lead them to establish effective strategies to achieve the firm’s objectives. These situations will attract the resources and the capacities required to successfully achieve innovative results [40].
For authors such as [41], the shortcomings of the conditions in which firms operate in developing countries can be overcome through the management of networks and interdependencies between actors that become part of the system. In this way, some conditions restrict business innovation activities through high existing transaction costs and market inefficiencies. For this reason, authors such as McCarthy et al. [42] state that the internal capacities and the existing resources potentiated by the environments in which they operate will improve innovation, especially in developing countries. Integrating the human aspects of the current culture in a country will allow for the combination of resources and capacities to ensure operational results in innovation, especially in developing countries.
Hypothesis 1 (H1).
Developed countries with a performance-oriented culture accumulate more innovation factors over time than developed countries with a humane-oriented culture.
Hypothesis 2 (H2).
Developing countries with a performance-oriented culture accumulate more innovation factors over time than developing countries with a humane-oriented culture.

3. Methodology

3.1. Data

This paper used three databases to develop our theoretical model: the Global Innovation Index (GII), Globe Project, and Global Entrepreneurship Index (GEI). Our study included ten years of data to estimate the growth model trajectory. The available data determined the maximum period considered in this study. However, the series time model required more than five years of data to create conclusions [43], and most of the studies in innovation have limitations about the databases or use Monte Carlo simulations to generate random data [11,44,45].
The GII data polled 131 countries on the process of innovation and its outcomes, with data from between 2011 and 2021. We used the GII to measure innovation inputs as a multidimensional concept with five factors: institutions, human capital and research, infrastructure, market sophistication, and business sophistication. Additionally, innovation results are measured as knowledge, technology, and creative outputs.

3.2. Globe Project

The Globe Project was developed to collect data from more than 17,000 managers in 62 countries. It is used to measure the cultural aspect with seven dimensions, five of which are related to Hofstede’s model. However, the Globe Project unified these dimensions into two factors: performance orientation (high level of masculinity, uncertainty avoidance, power distance, and future orientation) and humane orientation (high level of femininity, institutional, and societal collectivism).

3.3. GEI

The GEI is an annual index that assesses the state of entrepreneurship in 137 nations based on attitudes, resources, and infrastructure. This ranking shows how each country performs both domestically and internationally. We used the GEI to include the institutional conditions for creating a new business in each country. Although the GEI was developed to evaluate the entrepreneurship conditions, this database can be used by reflecting the context of a country’s progress about institutional variables such as networking (infrastructure in each country to develop new businesses and their products) and CPI (corruption perception index).

3.4. Model

Growth mixture analysis (GMA) was performed by the methods described by Gillet et al. [46]. GMA is an extended form of latent growth models [47] used to identify subgroups between countries with divergent longitudinal trajectories related to the innovation process. The growth trajectories model is relevant in our research because it will allow for the classification of various countries with initial characteristics in innovation that changed over time and will compare these characteristics; thus, this model will estimate different profiles after more than 10,000 iterations in Bayesian statistics.
Growth trajectories are divided into two parts: intercepts relating to the initial characteristics of each country in their levels of innovation and slope variables that represent the pace of growth in innovation level over time. These models relied on the Mplus default parameterization, whereby the latent variance-covariance matrix is constant between characteristics. The time residuals are invariant between countries but are allowed to vary over time.
As a result, GMA models have one to six profiles estimated using 18,000 sets of random beginning parameters, with the best 400 maintained for optimization and each given 1000 iterations [48,49]. All residual-based tests for the series were nonsignificant, with the test using the lag 1 model having a p-value of 0.101, compared to a p-value of 0.021 for the model-free test. The suggested approach is then used to examine the stability of bivariate correlations utilizing developed and developing countries from 2011 to 2021. For the 5% significance level, the fraction of unstable connections among the bivariate relationships examined is around 48%. Lower values in the Akaike information criterion (AIC), consistent Akaike information criterion (CAIC), Bayesian information criterion (BIC), and adjusted Bayesian information criterion (ABIC) mean better-fitting models and a statistically significant p-value on the bootstrap likelihood ratio test (BLRT), revealing that the model fits better than a model with fewer characteristics in similar trajectories.

4. Results

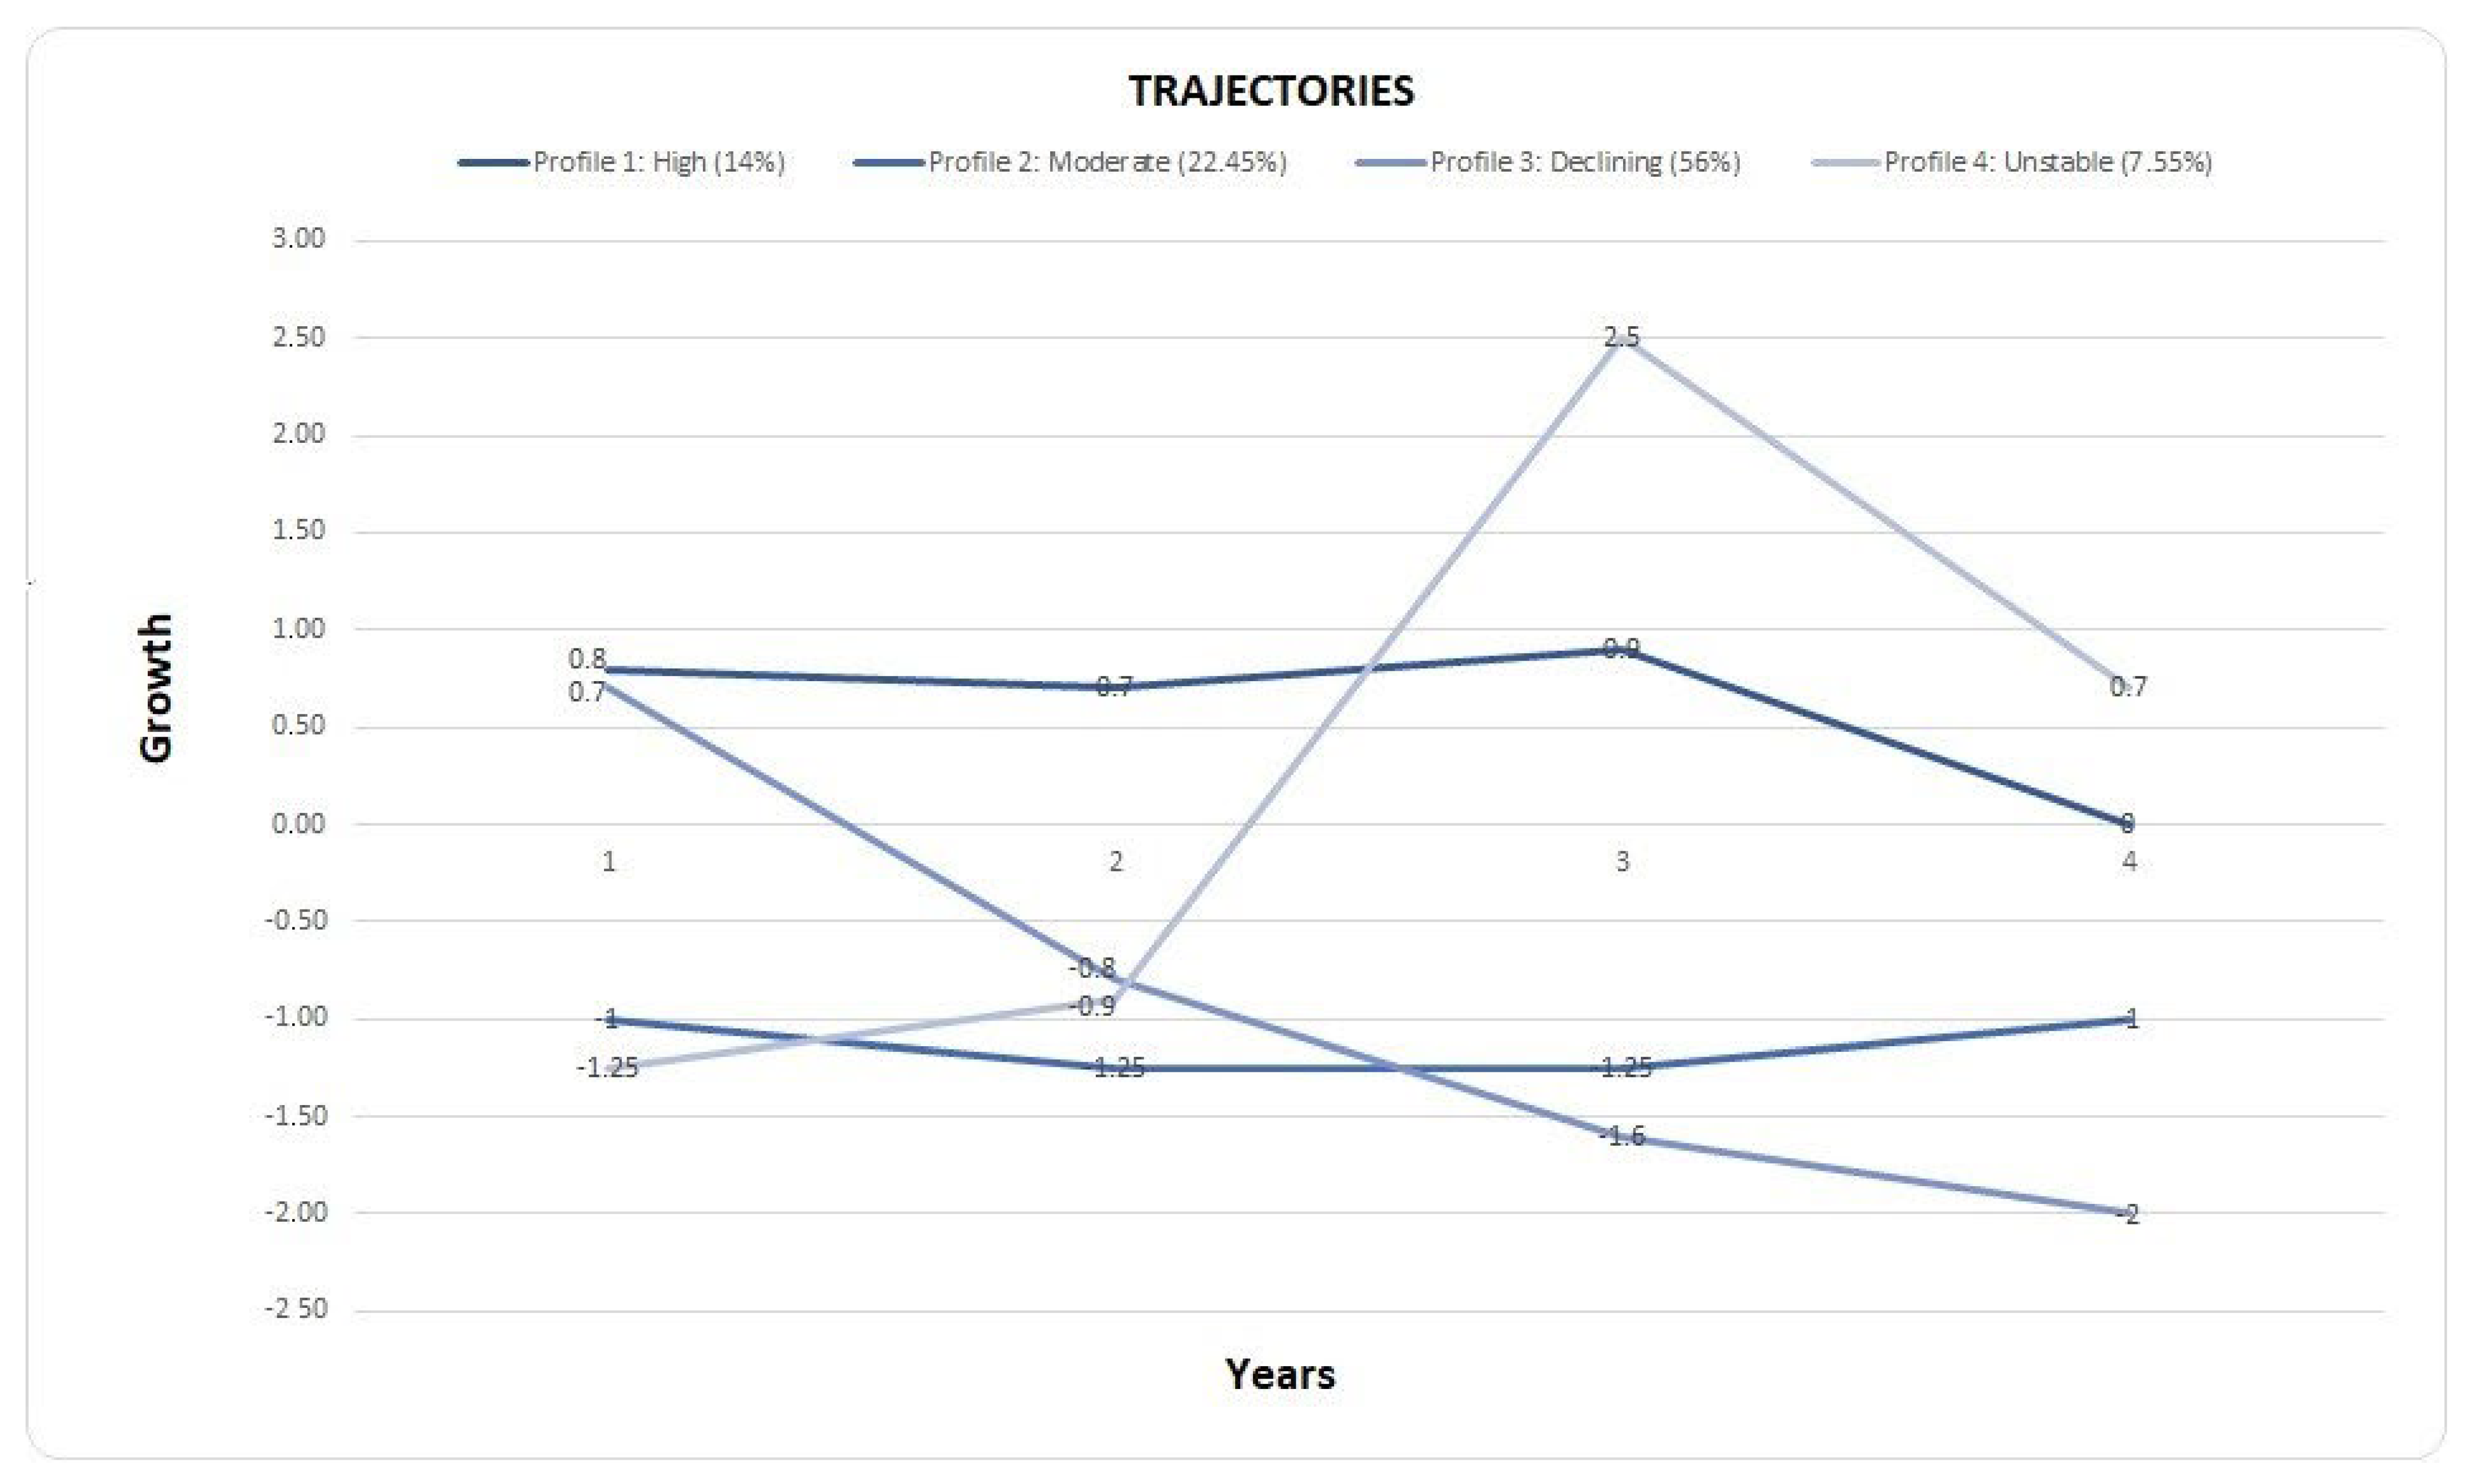
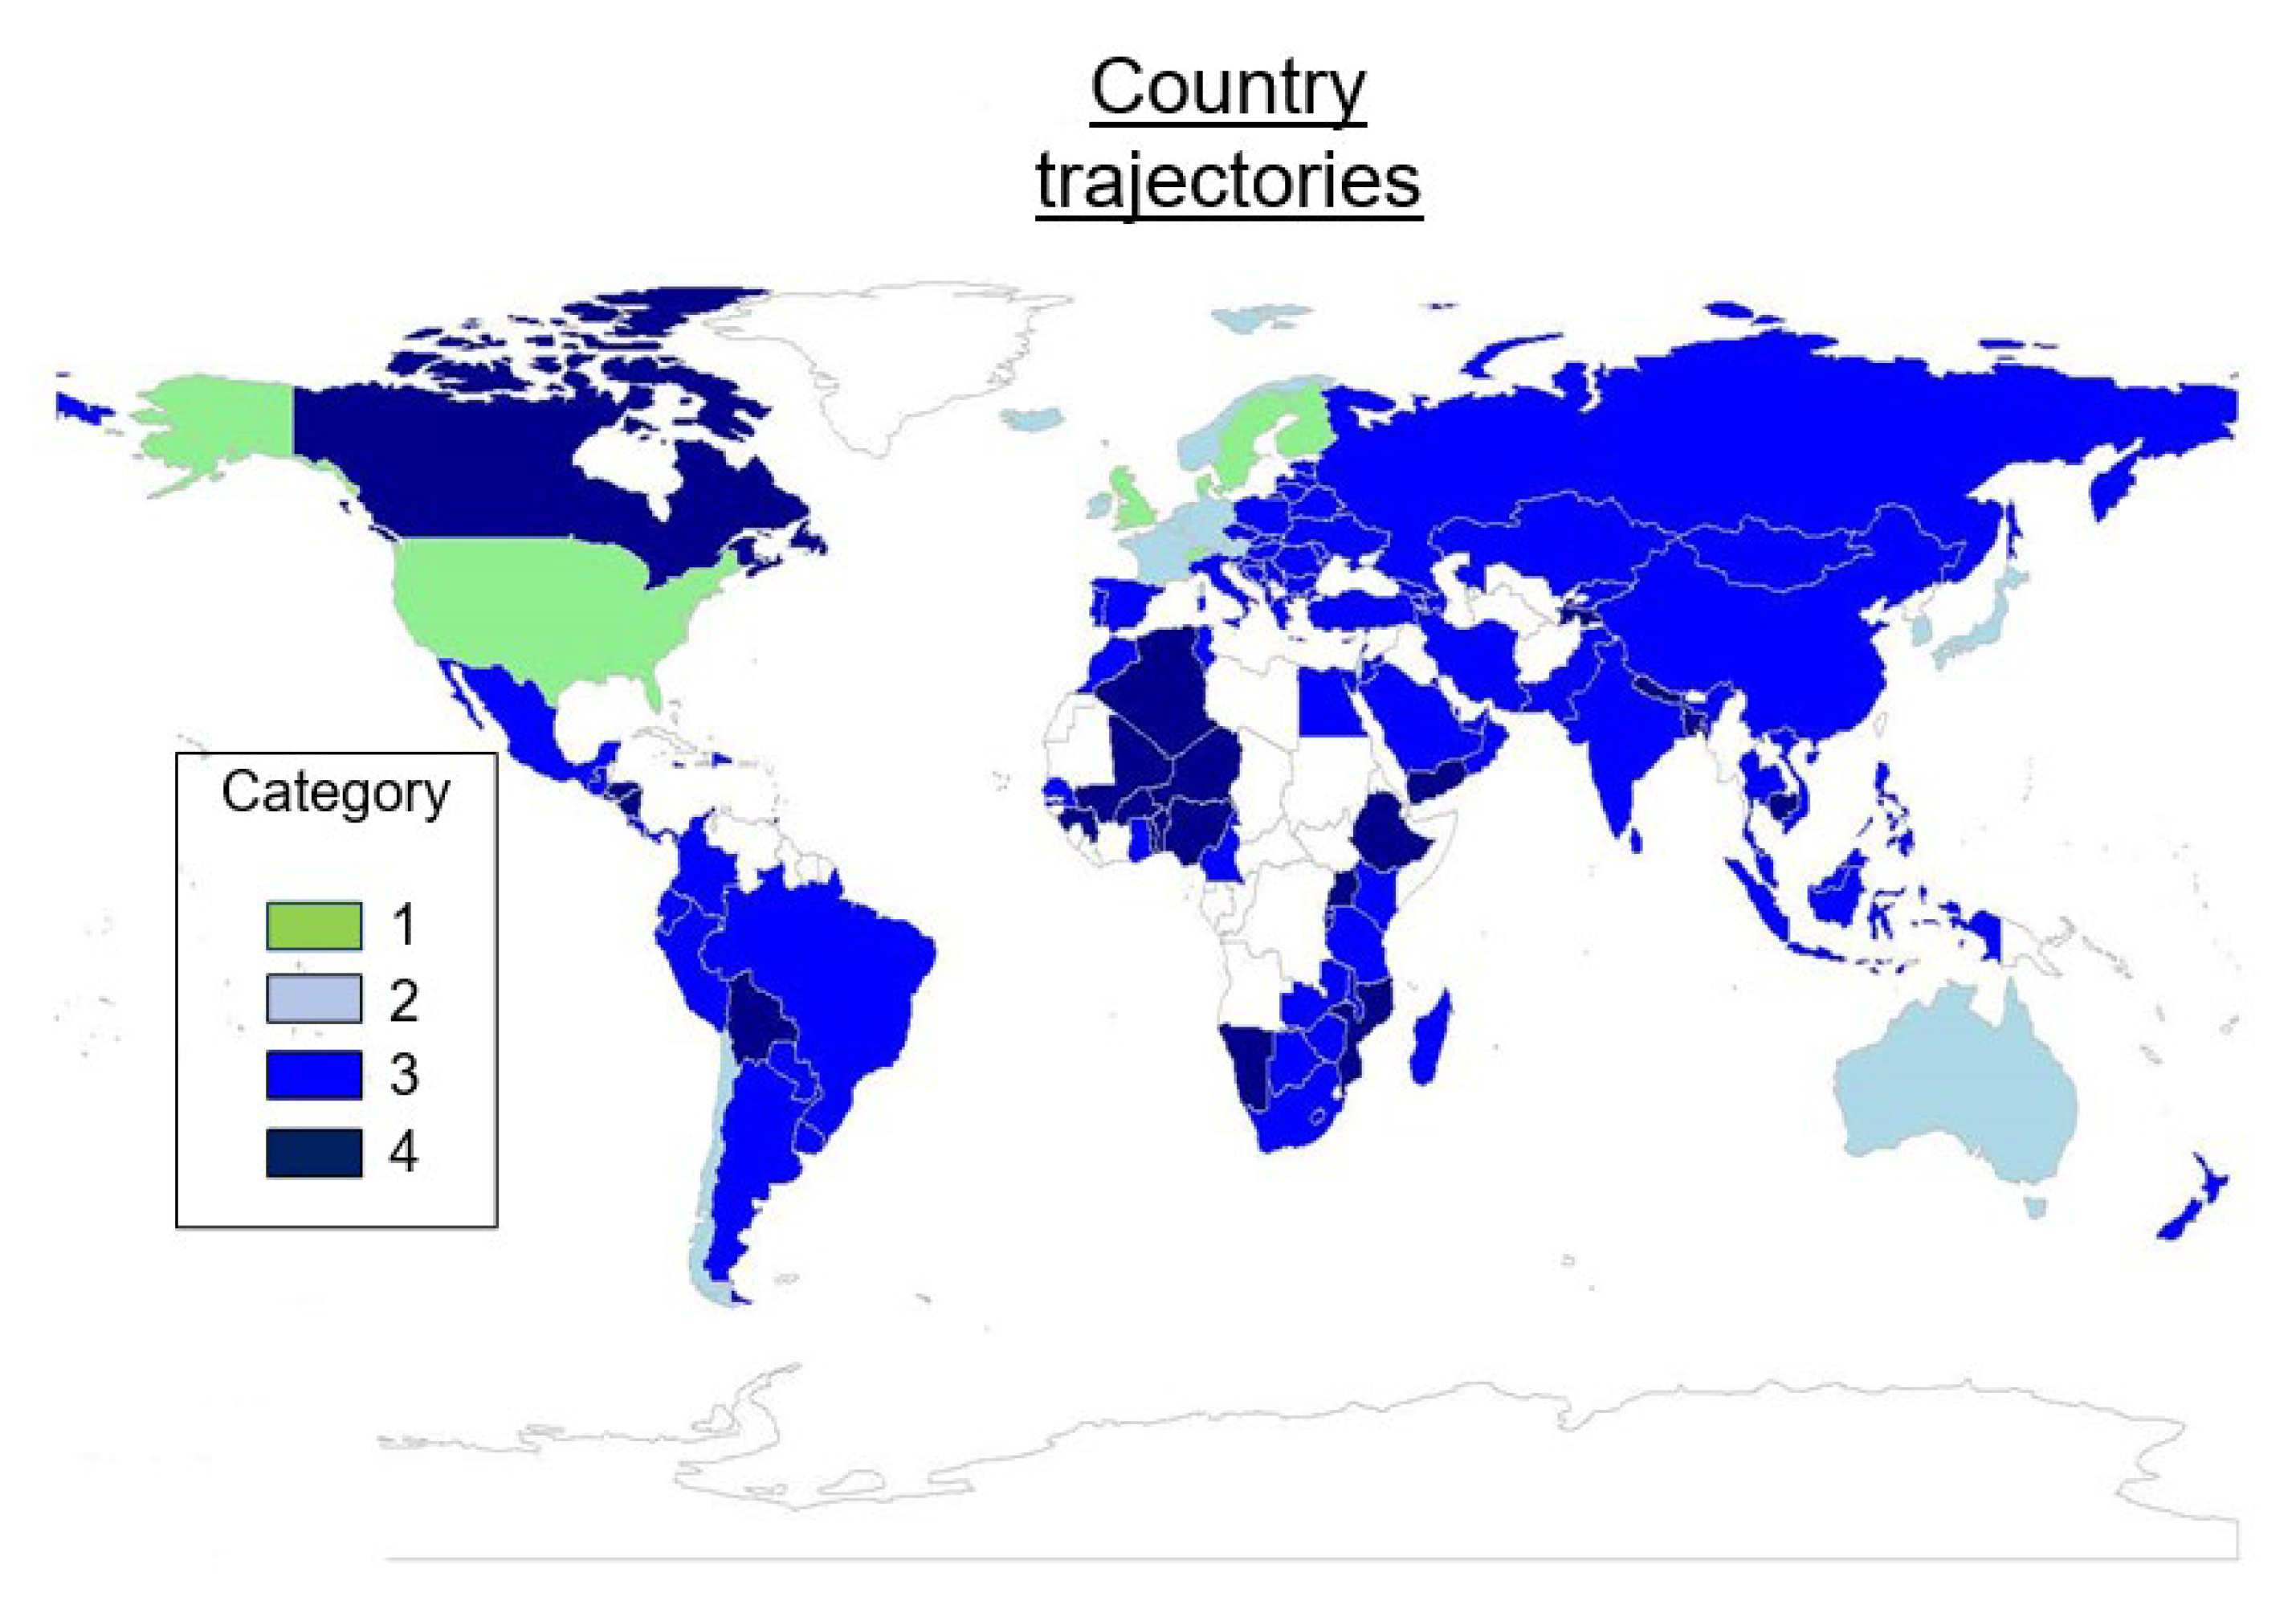
4.1. Trajectory Specification

Description of the Trajectories

Table 1 displays the goodness-of-fit of the different solutions from one to six profiles and socioeconomic variables. These findings allow us to confirm our hypotheses. The results indicate that the AIC, ABIC, and BLRT suggested increasing more profiles in our model, while the CAIC and BIC were validated to include five and four shapes, respectively. Graph 1 shows that the increase in fit reached that point around four profiles. The analysis confirmed that these results were statistically correct and increased the number of profiles between three to four. The confidence intervals generated by the growth trajectories model allow for identifying each country’s position within each trajectory. Its dominant trajectory is determined by the profile that achieves lower AIC and BLRT indicator levels after Bayesian iterations.
Table 2 displays the findings of an analysis of innovation levels among profiles. Our results revealed significant differences in innovation across the four profiles and a sequence of variations that changed with each country’s innovation inputs. In our first year (2011), overall profiles had significant differences in innovation outputs. The high profile had the lowest human inputs and the most infrastructure, followed by the moderate profile and the declining profile. Our findings reveal that countries with a performance-oriented culture have the most significant innovation inputs, such as market sophistication and business sophistication, related to a growing innovation trajectory. The moderating of performance orientation on market sophistication, on the other hand, was more essential in defining different country trajectories.
The differences between Time 2 and Time 1 were less evident. Technology and market strategies were lower and greater in Profile 1 than in the other profiles, respectively; however, this was difficult to discern in the other profiles. Furthermore, Profiles 1 and 3 began with a high level of innovation output. However, Profile 3 shows a rapidly decreasing innovation output, while Profile 1 maintained more increased innovation levels than the other profiles. Profile 4 holds down and varies over time, ending at the same beginning point. Finally, the disparities were roughly as evident as they had been at the start. The findings revealed that the preferable levels of the innovation output (high levels of overall inputs) were positively associated with increasing profiles, followed by Profile 3 and then by the declining profile, with the last difference being statistically significant for four of six outputs (t = 4.67 p < 0.001). The disparities between Profile 1 and Profile 2 differed based on which of our outputs we used, such as creative output.
The addition of a new profile resulted in unnecessary fragmentation of the previous profile, which lacked explanation capacity. Moreover, the fifth profile accounted for only 0.23% of our total sample size. As a result, we decided to keep four profiles to collect as much information as possible and adjust our model. The majority of countries are associated with Profile 3 (56%), followed by Profile 2 (22.45%), Profile 1 (14%), and Profile 4 (7.55%).
Profile 1 High (high innovation and performance-oriented nations) initially had high innovation inputs that tended to remain steady over time in most countries linked with a performance orientation. Countries included in this profile were the United States, United Kingdom, Sweden, and Canada. Profile 2 Moderate (had relatively small amounts of innovation inputs that remained steady over time) included Switzerland, France, Australia, New Zealand, Japan, Chile, and Norway. Therefore, Hypothesis 1 that affirms developed countries with a performance-oriented culture accumulate more innovation factors over time than developed countries with a humane-oriented culture is confirmed. Profiles 1 and 2 show that developed countries with more levels of performance orientation reached more levels in the innovation factors over time compared to developed countries that have more levels of humane orientation.
On the other hand, Profile 3 (declining) was the most difficult, with 56% of countries displaying purportedly high levels of innovation inputs which reduced after that. Furthermore, Profile 3 may be regarded as countries seeking to change their innovation input levels because they consistently exhibit high and low peaks across time. This category also includes nations with a stronger emphasis on social cultures, such as Brazil, India, Indonesia, Colombia, Peru, Russia, Mexico, and some African countries.
Profile 4 (unstable) identified 7.55% of countries as beginning with modest levels of innovation inputs that increased significantly over time but at a slower rate than other profiles. Countries with a humane orientation are the majority in this category; however, when compared to other groups, disparities in the levels linked with cultural orientation in these countries did not indicate significant variances. This category includes countries like Uruguay, Thailand, Ghana, Ethiopia, Laos, and Greece. Therefore, Hypothesis 2 that affirms developing countries with a performance-oriented culture accumulate more innovation factors over time than developing countries with a humane-oriented culture is confirmed.
Below, in Figure 1, it is possible to observe the different paths of trajectories for the countries analyzed. The first group stands out (Profile 1) and shows a high level of innovation, especially characterized by sustained performance over time. On the other hand, Profile 4 highlights a growing behavior in the innovation performance with a high inclination. In Profile 3, a decreasing behavior can be observed, and finally, Profile 2 shows a low innovation performance and a non-significant slope.
We identified the countries in each trajectory across all periods (see Figure 2). The green area is associated with trajectory 1 (Category 1, see Figure 2), showing high levels of innovation over time in this map, including countries like the United States, Sweden, Finland, and the United Kingdom. In Profile 2 (Category 2, see Figure 2), these countries’ groups do not consolidate innovation results, showing a decrease over time. In the Profile 3 Declining trajectory (Category 3, see Figure 2), countries have lower levels of innovation, and their results are not visible in the long term, as is the case in Colombia, Brazil, Russia, Mexico, and South Africa. In Profile 4 (Category 4, see Figure 2), countries like Uruguay, Ghana, Ethiopia, Laos, and Greece belong. These countries’ innovation levels vary, showing an unclear innovation trajectory.

5. Conclusions

This research utilized GMA to establish profiles of countries resulting from different innovation trajectories and analyze the output implications of these trajectories in connection to knowledge and creative outputs in countries with two categories, performance and humane orientation, based on levels during the previous decade in countries on different continents. The findings identified four types of countries: high (14%), moderate and stable (22.45%), declining and unstable (56%), and unstable (7.55%).
Our findings show that countries with a performance-oriented culture have the highest innovation inputs associated with an increasing innovation trajectory. Furthermore, members of the high-innovation trajectory had high total inputs, but there were significant disparities at the institutional level compared to other trajectories following market sophistication.
The moderate and declining trajectories, on the other hand, were associated with good levels in all inputs, although their levels were lower than the high profile since 2011. Furthermore, the countries in these trajectories differed in their cultural orientation; however, Profile 1 had developed countries with a performance orientation, Profile 2 had more developed countries with a high degree of humane orientation, and Profile 3 had more countries on the developing path with a high level of performance orientation. Our findings supported Setiawan’s (2020) claim that culture is the most important factor in determining how societies behave to exploit their resources and obtain more options in their innovation processes.
This study contributes to innovation theory [21] by improving knowledge of differences in innovation inputs on innovation outcomes in longitudinal trajectories across countries. Our research discovered that innovation results from a convergence of resources and factors available at several levels using this method. Strong institutions and a high level of market sophistication, on the other hand, offered more opportunities to get higher-value outcomes associated with innovation.
On the other hand, change does not frequently occur in many nations, according to these findings. Nations tend to maintain their trajectory over time since innovation inputs are associated with their performance orientation and available resources in these countries to invest in innovation. Only 9.8% had a significant shift in their trajectory (from trajectory 1 to trajectory 2). These results support the theoretical idea that innovation is a process that necessitates time, resources, and political policies [47].
Furthermore, our research responds to a recent request [21] for a deeper understanding of the innovation by studying its characteristics in countries and the consequences of their outcomes. In this regard, our findings confirm that recent studies indicate that higher institutions are linked with systematically better results in country innovation, particularly if these nations have a higher performance focus. These findings support the concept that countries with high levels of input may feel required and have more significant opportunities to provide positive levels of outcomes through patents, copyrights, and creative outputs.
Additionally, our findings provide evidence on previous studies by emphasizing the need to make changes in innovation input levels (institutions, human capital, research, infrastructure, market sophistication, and business sophistication) and take these into consideration as an essential driver of these innovation results. Indeed, the high profile was associated with the best inputs and outputs of the innovation. Still, few countries have this possibility, whereas the declining profile was associated with the worst input and limited to one type of innovation result (knowledge and few creative outputs); however, a few countries emerged with a different trajectory associated with changed institutions and business sophistication.

6. Managerial Contribution

It is important to be clear about how the different resources available to the country are key to developing capacities to carry out innovation processes at the managerial level. However, considering cultural aspects is essential to achieving companies’ strategic objectives. Another fundamental element is that institutional factors are important when establishing innovative actions and values, beliefs, and practices that determine how innovation is carried out within the company and how this could take advantage of country conditions. In the same way, the results show specific trajectories of the elements that influence innovation in a country, which allows us to consider the factors that directly drive the change processes resulting from innovative actions.

7. Limitations and Future Research Lines

It is important to be clear about how the different resources available to the organization are key to carrying out innovation processes at the managerial level. However, considering cultural aspects is essential to achieving success in the companies’ strategic objectives. Another fundamental element is that not only institutional factors are important when establishing innovative actions, but also the set of values, beliefs, and practices within the company. In the same way, the results show specific trajectories of the elements that influence innovation in a country. This allows us to consider the factors that directly drive the change processes resulting from innovative actions. We recognized that one limitation is our data, because the innovation process requires an extended spectrum to create conclusions, and 10 years of data can be limiting to our study. Still, the available databases have an average of 10 years of data, and other series time studies in the innovation field used between 5 and 10 years. Therefore, we believe that the data allowed us to create relevant conclusions. The future research line can estimate this model with more countries and data available to confirm our findings.

Author Contributions

Conceptualization, J.S.-P.; Formal analysis, D.E.-B.; Investigation, A.R. All authors have read and agreed to the published version of the manuscript.

Funding

This research received no external funding.

Institutional Review Board Statement

The study was conducted in accordance with the Declaration of Helsinki, and approved by the Institutional Review Board (or Ethics Committee) of Comité de Investigación y Ético de la Facultad de Ciencias Económicas y Administrativas, de la Pontificia Universidad Javeriana Cali (DECA-88-2021, 22 February 2021) for studies involving humans.

Informed Consent Statement

Informed consent was obtained from all subjects involved in the study.

Conflicts of Interest

The authors declare no conflict of interest.

References

  1. World Bank. World Bank Supports Croatia in Improving Effectiveness of Investments in Research, Development, and Innovation. Press Release 30 September 2021. 2021. Available online: https://www.worldbank.org/en/news/press-release/2021/09/30/world-bank-supports-croatia-in-improving-effectiveness-of-investments-in-research-development-and-innovation (accessed on 1 October 2021).
  2. Kwon, W.S.; Woo, H.; Sadachar, A.; Huang, X. External pressure or internal culture? An innovation diffusion theory account of small retail businesses’ social media use. J. Retail. Consum. Serv. 2021, 62, 102616. [Google Scholar] [CrossRef]
  3. Dwivedi, P.; Chaturvedi, V.; Vashist, J.K. Innovation for organizational sustainability: The role of HR practices and theories. Int. J. Organ. Anal. 2021, 1. [Google Scholar] [CrossRef]
  4. Aka, K.G.; Labelle, F. The Collaborative Process of Sustainable Innovations under the Lens of Actor–Network Theory. Sustainability 2021, 13, 10756. [Google Scholar] [CrossRef]
  5. Liao, Z.; Liu, Y.; Dai, J.; Li, Y. An application of the planned behavior theory to predict Chinese firms’ environmental innovation. J. Environ. Plan. Manag. 2021, 2, 1–20. [Google Scholar] [CrossRef]
  6. Gaeta, G.L.; Ghinoi, S.; Silvestri, F.; Tassinari, M. Innovation in the solid waste management industry: Integrating neoclassical and complexity theory perspectives. Waste Manag. 2021, 120, 50–58. [Google Scholar] [CrossRef]
  7. Gupta, A.K. Innovation dimensions and firm performance synergy in the emerging market: A perspective from Dynamic Capability Theory & Signaling Theory. Technol. Soc. 2021, 64, 101512. [Google Scholar]
  8. O’Callaghan, P.; Adapa, L.M.; Buisman, C. How can innovation theories be applied to water technology innovation? J. Clean. Prod. 2020, 276, 122910. [Google Scholar] [CrossRef]
  9. Burgos, A.L.; Bocco, G. Contributions to a theory of rural innovation. Cuad. Econ. 2020, 39, 219–247. [Google Scholar] [CrossRef] [Green Version]
  10. Pel, B.; Haxeltine, A.; Avelino, F.; Dumitru, A.; Kemp, R.; Bauler, T.; Kunze, I.; Dorland, J.; Wittmayer, J.; Jørgensen, M.S. Towards a theory of transformative social innovation: A relational framework and 12 propositions. Res. Policy 2020, 49, 104080. [Google Scholar] [CrossRef]
  11. Chen, J.; Yin, X.; Li, J. Firm innovation system: Paths for enhancing corporate indigenous innovation capability. Front. Eng. Manag. 2020, 7, 404–412. [Google Scholar] [CrossRef]
  12. Li, Z.; Li, J.; Chen, J.; Vinig, T. Innovation with Chinese characteristics: Theory and practice. Chin. Manag. Stud. 2020, 1. [Google Scholar] [CrossRef]
  13. Sheikh, F.A.; Bhaduri, S. Grassroots innovations in the informal economy: Insights from value theory. Oxf. Dev. Stud. 2020, 48, 85–99. [Google Scholar] [CrossRef]
  14. Perignat, E.; Meloche, A. Synonymously different: Examining business students’ implicit theories of creativity versus innovation. J. Educ. Bus. 2020, 96, 352–358. [Google Scholar] [CrossRef]
  15. Zhang, B.; Han, S.; Xu, Q.; Jiao, L. Construction of Innovation Behavior of College-Student Entrepreneurs Using Entrepreneurship and Innovation Theory Under Educational Psychology. Front. Psychol. 2021, 12, 697924. [Google Scholar] [CrossRef] [PubMed]
  16. Asenbaum, H. Rethinking Democratic Innovations: A Look through the Kaleidoscope of Democratic Theory. Political Stud. Rev. 2021, 3, 14789299211052890. [Google Scholar] [CrossRef]
  17. Singh, S.; Aggarwal, Y. In search of a consensus definition of innovation: A qualitative synthesis of 208 definitions using grounded theory approach. Innov. Eur. J. Soc. Sci. Res. 2021, 2, 1–19. [Google Scholar] [CrossRef]
  18. Matthews, J.R. Understanding indigenous innovation in rural West Africa: Challenges to diffusion of innovations theory and current social innovation practice. J. Hum. Dev. Capab. 2017, 18, 223–238. [Google Scholar] [CrossRef]
  19. Soe, R.M.; Sarv, L.; Gasco-Hernandez, M. Systematic Mapping of Long-Term Urban Challenges. Sustainability 2022, 14, 817. [Google Scholar] [CrossRef]
  20. Regnault, N.; Gillman, M.W. Importance of characterizing growth trajectories. Ann. Nutr. Metab. 2014, 65, 110–113. [Google Scholar] [CrossRef] [Green Version]
  21. Alyoubi, B.A.; Yamin, M.A. Extending the Role of Diffusion of Innovation Theory (DOI) in Achieving the Strategic Goal of the Firm with the Moderating Effect of Cost Leadership. Int. J. Syst. Dyn. Appl. 2021, 10, 1–22. [Google Scholar] [CrossRef]
  22. Bhatti, B.M.; Mubarak, S.; Nagalingam, S. Information security implications of using NLP in IT outsourcing: A Diffusion of Innovation theory perspective. Autom. Softw. Eng. 2021, 28, 12. [Google Scholar] [CrossRef]
  23. Andreeva, T.; Garanina, T.; Sáenz, J.; Aramburu, N.; Kianto, A. Does country environment matter in the relationship between intellectual capital and innovation performance? J. Bus. Res. 2021, 136, 263–273. [Google Scholar] [CrossRef]
  24. Zakari, A.; Tawiah, V.; Oyewo, B.; Alvarado, R. The impact of corruption on green innovation: The case of OECD and non-OECD countries. J. Environ. Plan. Manag. 2022, 3, 1–33. [Google Scholar] [CrossRef]
  25. Rinne, T.; Steel, G.D.; Fairweather, J. Hofstede and shane revisited. Cross-Cult. Res. 2012, 46, 91–108. [Google Scholar] [CrossRef]
  26. Andrijauskienė, M.; Dumčiuvienė, D. Hofstede’s cultural dimensions and national innovation level. DIEM Dubrov. Int. Econ. Meet. Dubrov. 2017, 3, 189–205. [Google Scholar]
  27. Gallego-Álvarez, I.; Pucheta-Martínez, M.C. Hofstede’s cultural dimensions and R&D intensity as an innovation strategy: A view from different institutional contexts. Eurasian Bus. Rev. 2021, 11, 191–220. [Google Scholar] [CrossRef]
  28. Shane, S. Cultural influences on national rates of innovation. J. Bus. Ventur. 1993, 8, 59–73. [Google Scholar] [CrossRef]
  29. Park, T.; Kim, J.Y. An exploratory study on innovation policy in eight Asian countries. J. Sci. Technol. Policy Manag. 2021, 3. [Google Scholar] [CrossRef]
  30. Sayyed, Y.; Hatamleh, M.T.; Alaya, A. Investigating the influence of procurement management in construction projects on the innovation level and the overall project performance in developing countries. Int. J. Constr. Manag. 2021, 1, 1–30. [Google Scholar] [CrossRef]
  31. Tekic, A.; Tekic, Z. Culture as antecedent of national innovation performance: Evidence from neo-configurational perspective. J. Bus. Res. 2021, 125, 385–396. [Google Scholar] [CrossRef]
  32. Kaasa, A.; Vadi, M. How does culture contribute to innovation? Evidence from European countries. Econ. Innov. New Technol. 2010, 19, 583–604. [Google Scholar] [CrossRef]
  33. Minkov, M.; Kaasa, A. A test of the revised Minkov-Hofstede model of culture: Mirror images of subjective and objective culture across nations and the 50 US states. Cross-Cult. Res. 2021, 55, 230–281. [Google Scholar] [CrossRef]
  34. Sent, E.M.; Kroese, A.L. Commemorating Geert Hofstede, a pioneer in the study of culture and institutions. J. Inst. Econ. 2022, 18, 15–27. [Google Scholar] [CrossRef]
  35. Ollier-Malaterre, A.; Sarkisian, N.; Stawiski, S.; Hannum, K.M.; Major, D.; Burke, R. Work–life balance and performance across countries: Cultural and institutional approaches. In Handbook of Work–Life Integration among Professionals; Edward Elgar Publishing: Cheltenham, UK, 2013. [Google Scholar]
  36. Tonbul, Y.; Ceylan, Ö. The School Culture in the Context of the Hofstede’s Culture Classification Investigation on Aphorisms. Eğitimde Nitel Araştırmalar Derg. 2021, 21, 104–125. [Google Scholar] [CrossRef]
  37. Heydari, A.; Laroche, M.; Paulin, M.; Richard, M.O. Hofstede’s individual-level indulgence dimension: Scale development and validation. J. Retail. Consum. Serv. 2021, 62, 102640. [Google Scholar] [CrossRef]
  38. Candi, M.; Melia, M.; Colurcio, M. Two birds with one stone: The quest for addressing both business goals and social needs with innovation. J. Bus. Ethics 2019, 160, 1019–1033. [Google Scholar] [CrossRef]
  39. Lema, R.; Kraemer-Mbula, E.; Rakas, M. Innovation in developing countries: Examining two decades of research. Innov. Dev. 2021, 11, 189–210. [Google Scholar] [CrossRef]
  40. Pérez, C.; Marín, A.; Navas-Alemán, L. The Possible Dynamic Role of Natural Resource-Based Networks in Latin American Development Strategies. In National Innovation Systems, Social Inclusion and Development; Edward Elgar Publishing: Cheltenham, UK, 2014; pp. 380–412. [Google Scholar] [CrossRef] [Green Version]
  41. Saka-Helmhout, A.; Chappin, M.M.; Rodrigues, S.B. Corporate Social Innovation in Developing Countries. J. Bus. Ethics 2021, 1, 1–17. [Google Scholar] [CrossRef]
  42. McCarthy, D.J.; Puffer, S.M. Interpreting the ethicality of corporate governance decisions in Russia: Utilizing integrative social contracts theory to evaluate the relevance of agency theory norms. Acad. Manag. Rev. 2008, 33, 11–31. [Google Scholar] [CrossRef]
  43. Blasques, F.; Gorgi, P.; Koopman, S.J. Accelerating score-driven time series models. J. Econom. 2019, 212, 359–376. [Google Scholar] [CrossRef]
  44. Sedgley, N.; Elmslie, B. Reinterpreting the Jones critique: A time series approach to testing and understanding idea driven growth models with transitional dynamics. J. Macroecon. 2010, 32, 103–117. [Google Scholar] [CrossRef]
  45. Hair, J.; Anderson, R.; Tatham, R.; Black, W. Análisis Multivariante; Prentice Hall: Madrid, Spain, 1999; Volume 491. [Google Scholar]
  46. Escandon-Barbosa, D.; Salas-Paramo, J.; Meneses-Franco, A.I.; Giraldo-Gonzalez, C. Adoption of new technologies in developing countries: The case of autonomous car between Vietnam and Colombia. Technology in Society 2021, 66, 101674. [Google Scholar] [CrossRef]
  47. Bollen, K.; Curran, P. Latent Curve Models: A Structural Equation Perspective; John Wiley & Sons: Hoboken, NJ, USA, 2006. [Google Scholar]
  48. Hipp, J.; Bauer, D. Local solutions in the estimation of growth mixture models. Psychol. Methods 2006, 11, 36. [Google Scholar] [CrossRef] [PubMed] [Green Version]
  49. Escandon-Barbosa, D.; Salas-Paramo, J.; Rialp-Criado, J. Hofstede’s cultural dimensions as a moderator of the relationship between ambidextrous learning and corporate sustainability in born global firms. Sustainability 2021, 13, 7344. [Google Scholar] [CrossRef]
Figure 1. Trajectories. Trajectories are estimated using time-invariant factor scores (M = 0; SD = 1) obtained from preliminary analyses (see online supplements for details). There were four types of innovation trajectories: high, moderate, declining, and unstable. Profile 1 (shown in dark blue) represented a high level of innovation throughout time. Profile 2 represented in cobalt color indicates a Moderate level of innovation (mean level around overtime). Profile 3 with indigo color represents a declining profile, whereas Profile 4 with sky blue color represents an unstable profile.
Sustainability 14 05851 g001
Figure 2. Country Trajectories Map. Profile 1 High degree of innovation is associated with Category 1 (green area). Countries with Moderate Innovation are represented in Category 2, which is illustrated in light blue (Profile 2). Category 3 (cobalt) represents nations with declining innovation (Profile 3), whereas Category 4 (dark blue) represents countries with unstable innovation (Profile 4).
Sustainability 14 05851 g002
Table 1. Goodness-of-fit of the different solutions.
Model GMALLAICCAICBICABICaLMRBLRT
1. Profile −1542.9103101.8203144.7433138.7453113.342--
2. Profiles−1484.8122991.6243053.4003042.4003007.4740.020<0.002
3. Profiles−1441.8442911.6802990.3122976.3142931.863<0.002<0.002
4. Profiles−1400.1102834.2242929.6982912.6972858.7150.519<0.002
5. Profiles−1381.9552805.9122918.2342898.2342834.7250.055<0.002
6. Profiles−1365.5442781.0892910.2582887.2582814.2220.227<0.002
Controls Results
Null effects−1305.7802645.5572739.4052722.4102668.433--
Effects on Profile−1295.9972649.9962910.0932781.0932689.0180.020<0.002
Effects on Profile, Intercept−1292.9862651.8722834.1532801.0932696.3740.017<0.002
Effects on Profile, Intercept, Slope number (var.)−1266.5842655.1702991.9282930.9282737.2570.050<0.002
LL: model log-likelihood; AIC: Akaike information criteria; CAIC: constant AIC; BIC: Bayesian information criteria; ABIC: sample size adjusted BIC; aLMR: adjusted Lo-Men del-Rubin likelihood ratio test; BLRT: bootstrap likelihood ratio test.
Table 2. Analysis of innovation levels among profiles.
Profile 1 (Higher) Mean [Interval]Profile 2 (Moderate) Mean [Interval]Profile 3 (Declining) Mean [Interval]Profile 4 (Unstable) Mean [Interval]Differences
Institutions * Cultural Orientation
Time 2011−0.434 [−0.504; −0.922]0.839 [0.755; 0.922]0.278 [−0.045; 0.601]1.298 [1.080; 1.512]4 > 2 > 3> 1
Time 2016−0.374 [−0.443; −0.304]0.723 [0.631; 0.810]0.740 [0.475; 1.005]0.376 [0.010; 0.744]2 = 3 = 4 > 1
Time 2021−0.337 [−0.405; −0.265]0.704 [0.617; 0.793]1.238 [1.086; 1.392]−0.309 [−0.695;0.076]3> 2 > 1 = 4
Market Sophistication * Cultural Orientation
Time 20110.586 [0.532; 0.639]−0.866 [−0.598; −0.774]−0.370 [−0.678; −0.063]−1.318 [−1.643; −0.9920]1> 3 > 2 > 4
Time 20160.518 [0.461; 0.570]−0.856 [−0.943; −0.764]−0.819 [−1.110; −0.528]−0.660 [−1.017; −0302]1 > 2 = 3 = 4
Time 20210.468 [0.412; 0.522]−0.854 [−0.948; −0.760]−1.134 [−1.385; −0.883]0.074 [−0.279; 0.427]1 > 4 > 2 > 3
Business Sophistication * Cultural Orientation
Time 20160.439 [0.377; 0.500]−0.806 [−0.886; −0.726]−0.779 [−1.045; −0.512]−0.305 [−0.640; 0.027]1 > 4 > 2 = 3
Time 20210.438 [0.469; 0.468]−0.785 [−0.856; −0.705]−1.192 [−1.396; −0.987]1.065 [0.698; 1.434]4 > 1 > 2 > 3
Cultural Orientation
Time 20160.247 [0.183; 0.310]−0.476 [−0.597; −0.356]−0.532 [−0.909; −0.157]−0.009 [−0.389; 0.371]1 > 2 = 3; 4 > 2; 1 = 4; 3 = 4
Time 20210.229 [0.173; 0.287]−0.456 [−0.570; −0.342]−0.845 [−0.246; −0.443]1.098 [0.759; 1.436]4 > 1 > 2 = 3
*: it signs represented the multiplication between two variables.
Publisher’s Note: MDPI stays neutral with regard to jurisdictional claims in published maps and institutional affiliations.

