Article

Whether Increasing Maize Planting Density Increases the Total Water Use Depends on Soil Water in the 0–60 cm Soil Layer in the North China Plain

1
Key Laboratory of Water Saving Irrigation Engineering, Ministry of Agriculture and Rural Affairs/Farmland Irrigation Research Institute, Chinese Academy of Agricultural Sciences, Xinxiang 453002, China
2
Graduate School of Chinese Academy of Agricultural Sciences, Beijing 100081, China
*
Author to whom correspondence should be addressed.
Sustainability 2022, 14(10), 5848; https://doi.org/10.3390/su14105848
Submission received: 11 April 2022 / Revised: 29 April 2022 / Accepted: 10 May 2022 / Published: 11 May 2022
(This article belongs to the Section Sustainable Water Management)

Abstract

:
Increasing planting density generally increases total water use by maize (Zea mays L.), but there are contrasting conclusions as well. To determine whether increasing planting density would increase total water use by maize, a 3-year field experiment was conducted in the North China Plain. In 2018, maize was planted at the four densities of 57,100, 66,700, 80,000, and 100,000 plants ha−1. In 2019 and 2020, another four planting densities of 27,800, 41,700, 66,700, and 111,100 plants ha−1 were selected. The results showed that increasing planting density increased leaf area index but decreased leaf stomatal conductance; maize grain yield reached the maximum at about 80,000 plants ha−1. At the VE-V6 and R3-R6 stage, soil water use occurred mainly in the 0–60 cm soil layer, and planting density showed no effect on total soil water use by maize. At the V6-R3 stage, when soil water in the 0–60 cm soil layer was sufficient to meet the evapotranspiration demand, soil water use occurred mainly in the 0–60 cm soil layer; increasing planting density did not increase total soil water use. When soil water in the 0–60 cm soil layer was insufficient and could not meet the demand of evapotranspiration, soil water use in the 60–100 cm soil layer increased greatly and kept rising with increased planting density, resulting in elevated total soil water use. Therefore, we conclude that the effect of planting density on water use by maize varies with soil water content in the 0–60 cm soil layer in the North China Plain.

1. Introduction

Maize (Zea mays L.) is currently one of the most widely grown staple crops, accounting for 60% of the world’s human consumption, livestock feed, and industrial raw materials [1,2,3]. Planting density is an important factor affecting maize grain yield and water use efficiency (WUE). The increase in planting density has been closely related to improved maize grain yield in recent decades [4,5,6].
Increased maize planting density has been associated with increased grain yield and water use efficiency through more full crop canopies and more ear m−2 [7,8], Maize is more sensitive to planting density than cereal crops with a high capacity for tiller production [9]. Planting density can be excessive due to excessive inter-plant competition for soil water, radiation, and nutrients, often resulting in weak plants, barrenness, small ears, and low yield [10,11,12,13]. Therefore, optimizing planting density is important to yield maximization and WUE.
The optimal maize planting density differs among maize genotypes and environmental conditions. Ming et al. (2017) reported that the average maize planting density in the North China Plain (NCP), which has a semi-humid climate, was approximately 62,000 plants ha−1 between the years 2009 and 2016 [14]. In terms of crop yield, Luo et al. (2019) reported that optimal planting density for maize yield varied from 85,000 to 105,000 plants ha−1 across three crop regions in China, including 93,000 plants ha−1 in the NCP [15].
Crop water use consists of crop transpiration and soil evaporation [16,17]. Evapotranspiration (ET) and soil water use increases with increased leaf area index (LAI), which increases with planting density [8,18,19,20]; transpiration may account for 70–80% of ET for a maize crop [21,22,23,24]. In some cases, planting density had little effect on total soil water use [4,25,26]. The effect of planting density on soil water use varies with stage of growth, ground cover, and crop management [4,8,25,26].
Soil water deficits are not a new concern; they have been there for centuries. Due to the high temporal and spatial variability of precipitation in the NCP, drought is often a major factor affecting maize grain yield. Under such conditions, irrigation for crops is often needed; the large amount of irrigation led to a gradual reduction in groundwater resources in the NCP, which caused a number of serious environmental and ecological problems in the region [27,28]. These issues are forcing people involved in irrigation in the NCP to look for ways to conserve water and improve WUE.
Therefore, it is of great value to study the effect of maize planting density on water-use characteristics for rational utilization of water resources. This 3-year field experiment investigates the effects of maize planting density on ET, soil water content, grain yield, and yield components. The objective of this research is to determine whether increasing planting density increases total water of maize in the NCP.

2. Materials and Methods

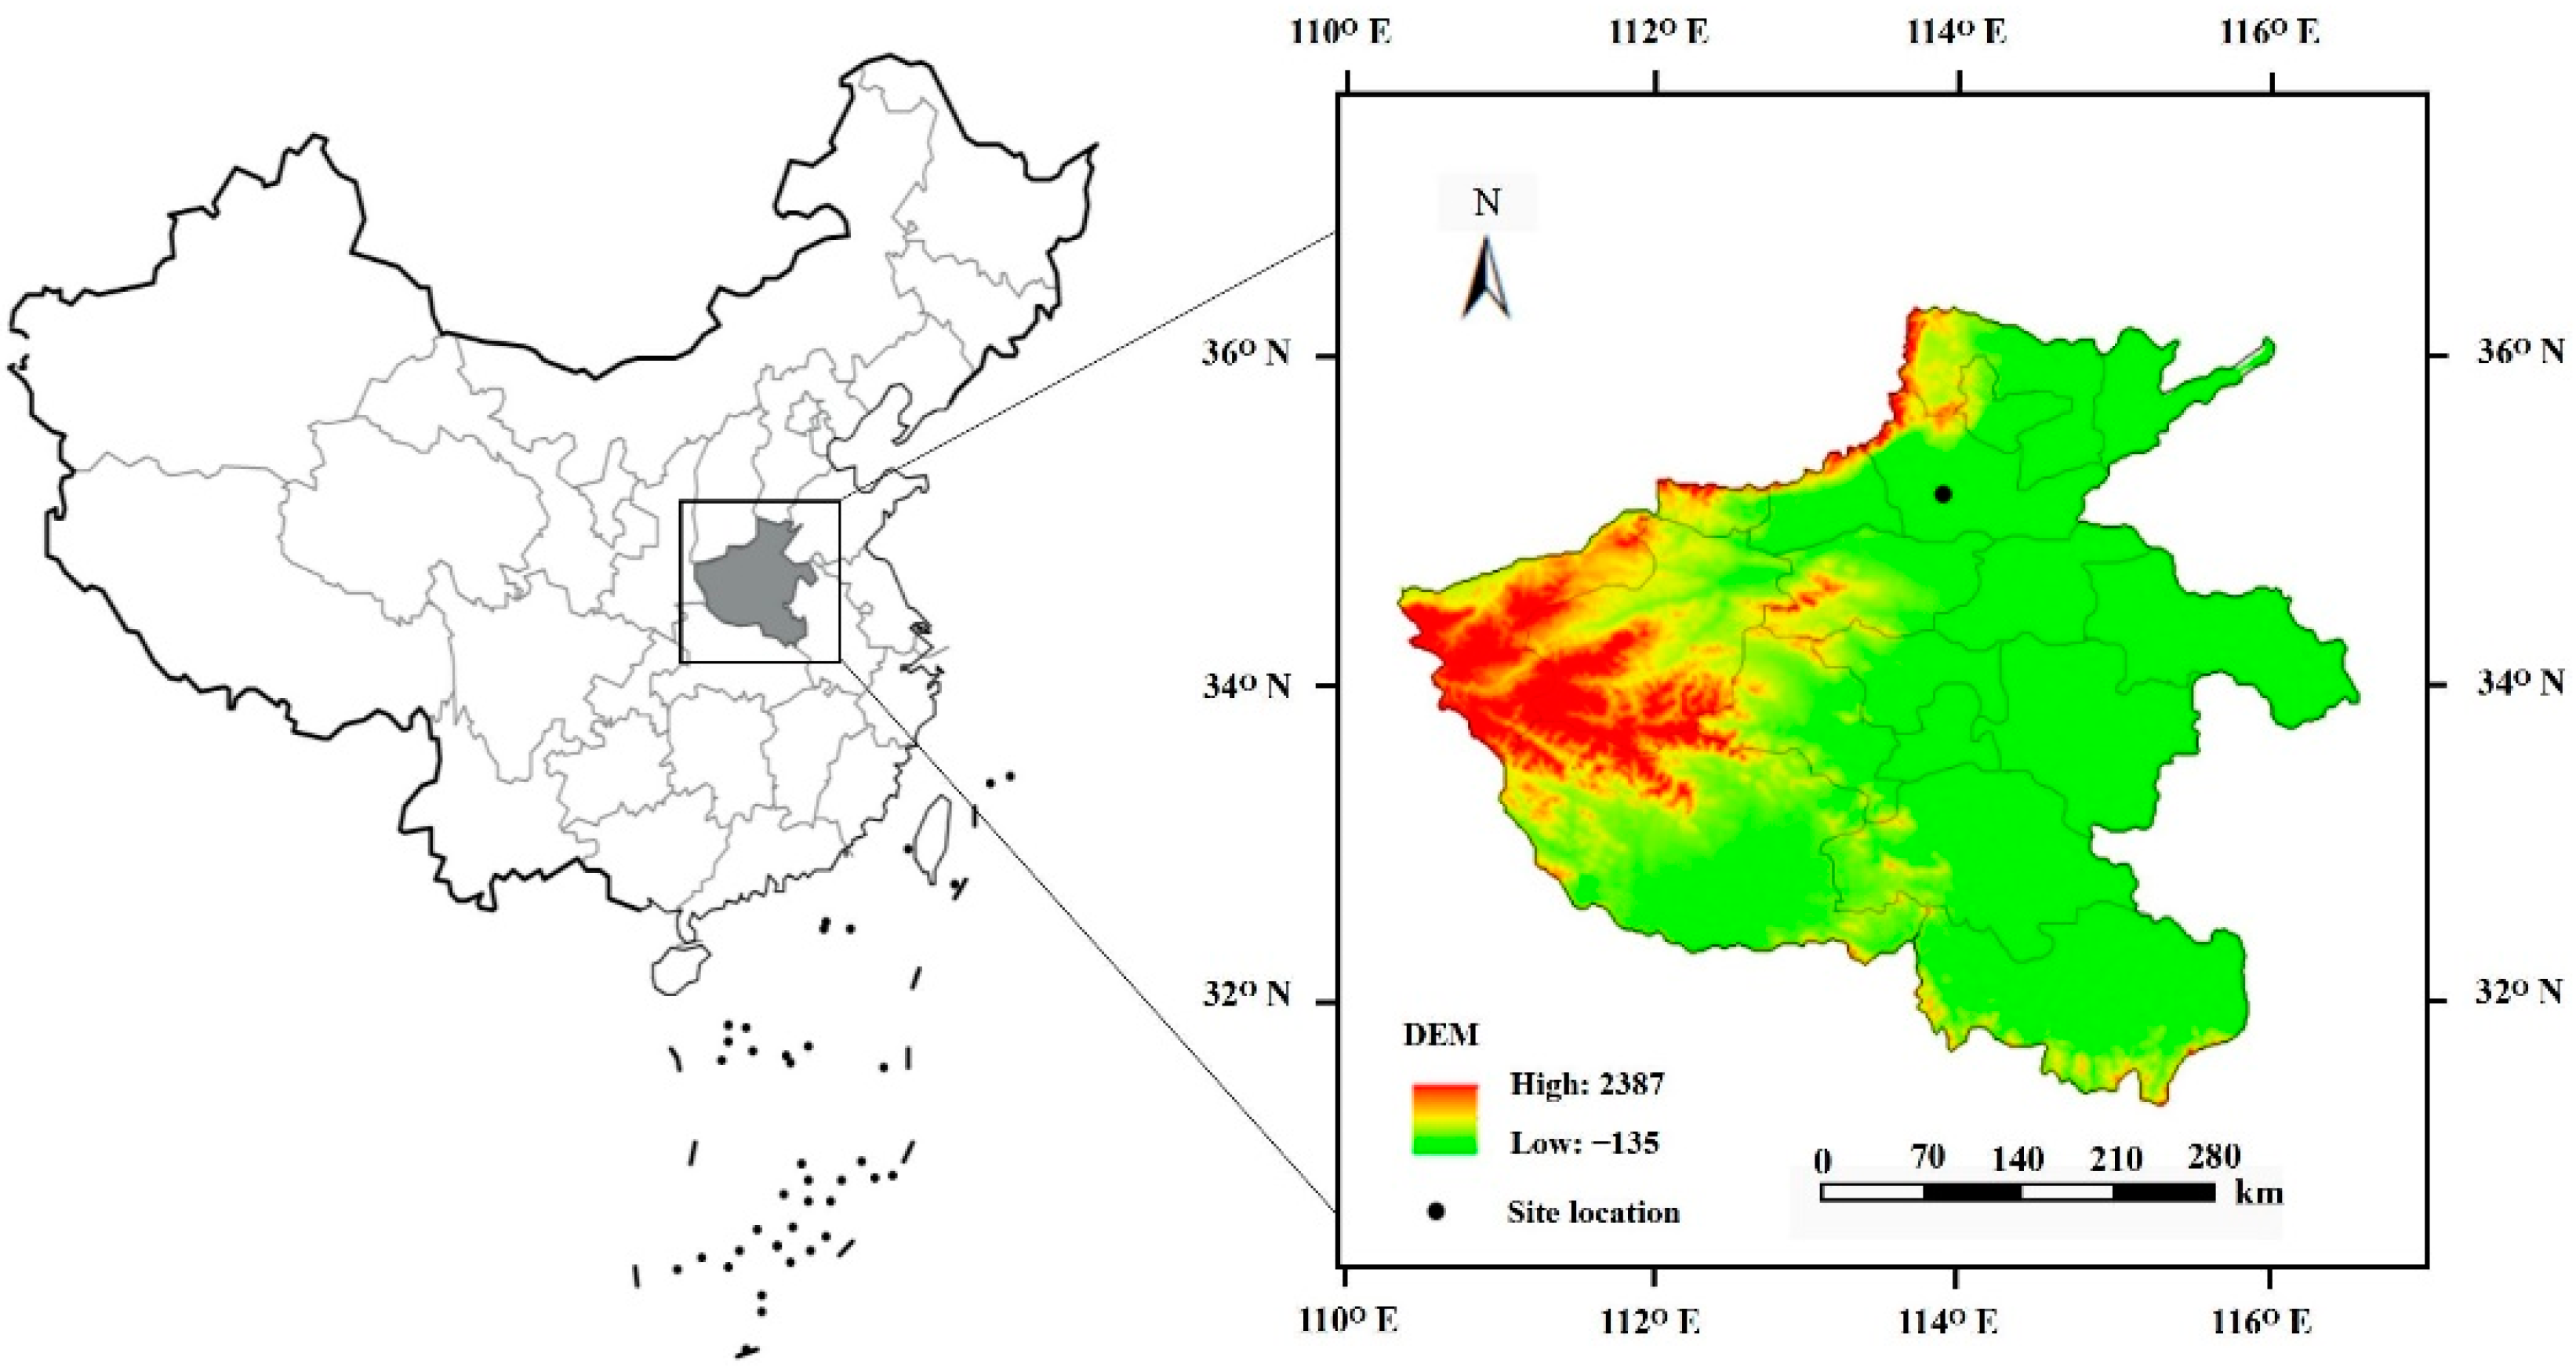
2.1. Experimental Site Description

Field research was conducted from mid-June to late September or early October in 2018, 2019, and 2020 during summer maize growing seasons at the Xinxiang experimental station of Chinese Academy of Agricultural Sciences in Xinxiang, Henan, NCP (35.317° N, 113.833° E, 73 m elevation) (Figure 1).
The site is located in the warm temperate and semi-humid zone with an average annual precipitation of 546 mm, air temperature of 14.2 °C, sunshine duration of 2286 h, and potential evaporation of 2000 mm based on 60 years of data from a local weather station. Environmental variables at different growth stages during the three experimental seasons are presented in Table 1, and daily precipitation is shown in Figure 2. The soil texture is sandy loam; the other soil physical parameters in the 0–100 cm profile are shown in Table 2. The water table is on average about 8 m below the soil surface.

2.2. Experimental Design

Experiment was arranged by applying a randomized complete block design of three replications with 7.6 m × 8.0 m plots. The treatments were 57,100, 66,700, 80,000, and 100,000 plants ha−1 in 2018 with 25 cm within row spacing and respective row spacings of 40, 50, 60, or 70 cm (Table 3). In 2019 and 2020, treatments were 27,800, 41,700, 66,700, and 111,100 plants ha−1 spaced within rows at 15, 25, 40, and 60 cm, respectively, with 60 cm row spacing (Table 3). Maize was sown on 20 June 2018, 20 June 2019, and 14 June 2020 at a seeding depth of 2–4 cm.
The maize variety was Denghai 605, which was widely cultivated in the NCP. Before sowing, all treatments were fertilized with 265 kg ha−1 urea (CH4N2O), 245 kg ha−1 calcium superphosphate (CaP2H4O8), and 165 kg ha−1 potassium sulphate (K2SO4) as base fertilizer. In addition, topsoil fertilizer of 265 kg urea (CH4N2O) was applied at the VT-R3 stage. Soil loosening by a tractor mounted scarifier to a depth of 20 cm was performed for all treatments before sowing. No irrigation was provided in 2018 and 2020 due to sufficient precipitation. In 2019, the irrigation amount (applied by drip irrigation) was 60 mm on 14 July, 40 mm on 25 July, and 40 mm on 29 August for all treatments.

2.3. Measurements and Analytical Methods

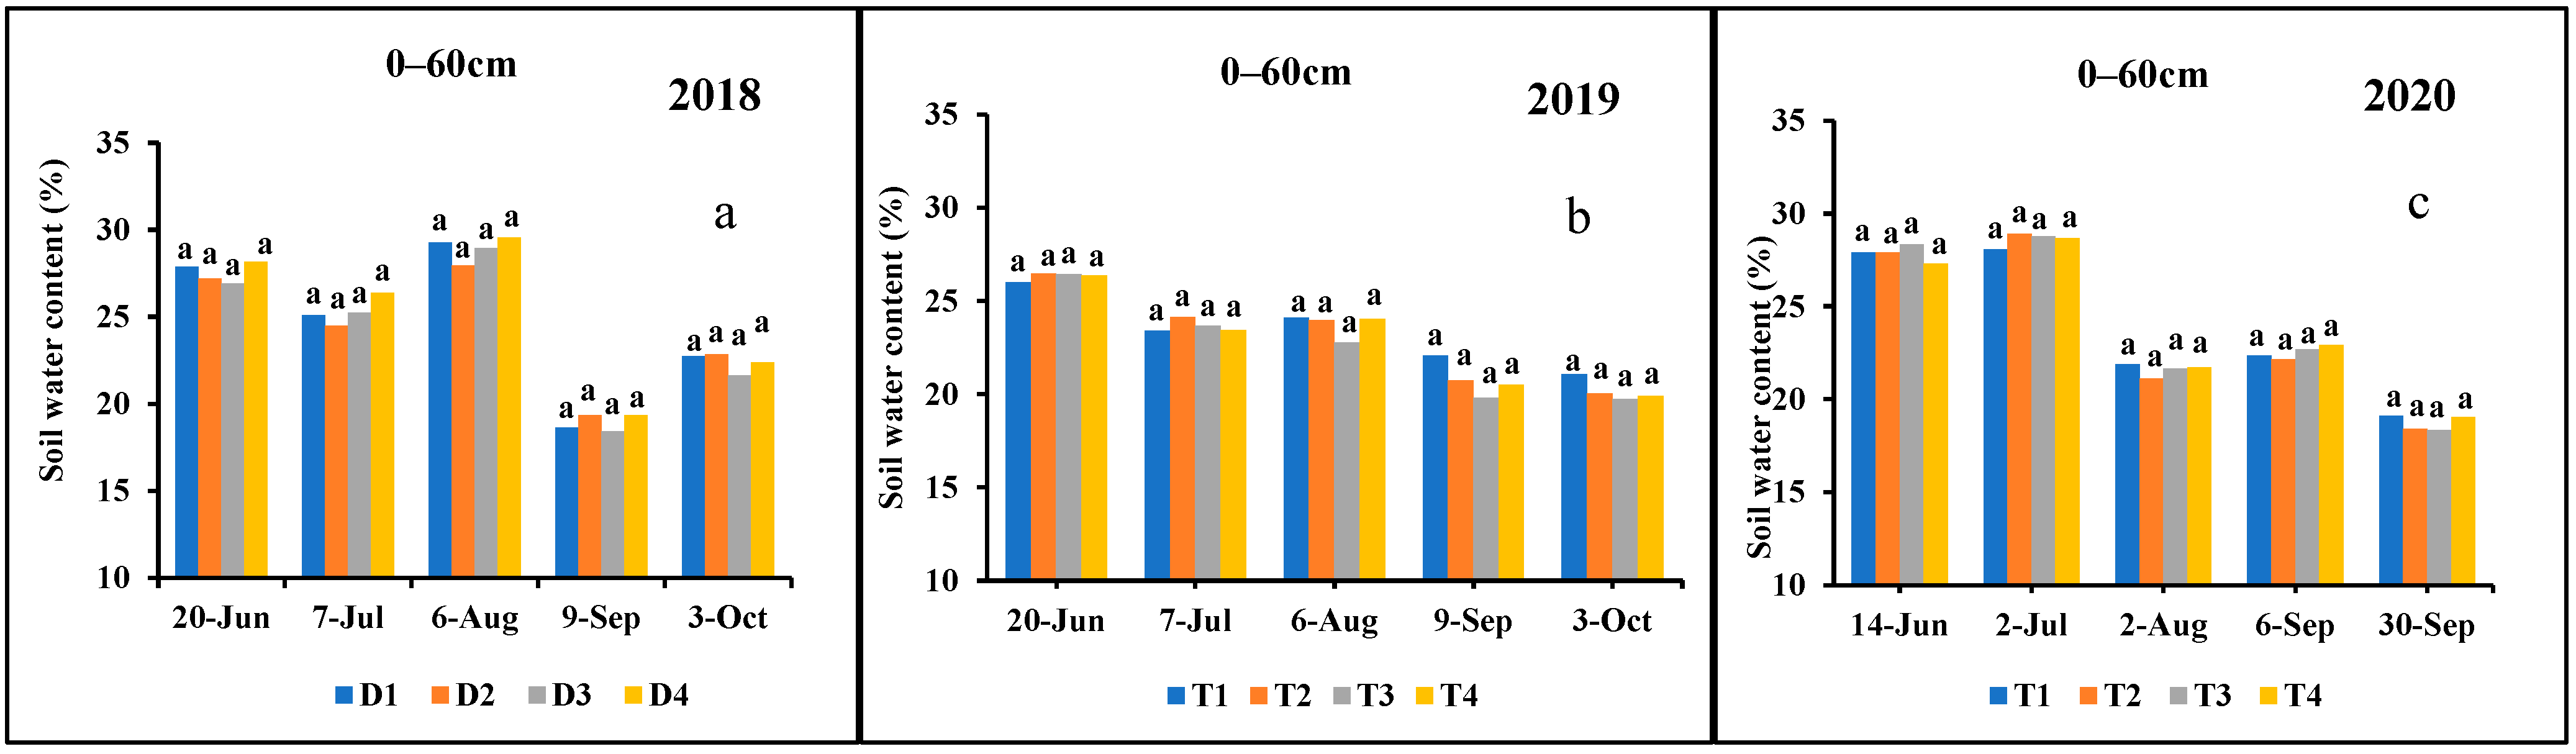
2.3.1. Soil Water Content

Soil water content (SWC) (cm3 cm−3) of each plot was determined by gravity method in 20 cm increments to 1 m depth. SWC (cm3 cm−3) was also monitored with one Insentek sensor (a piece of soil water monitoring equipment based on FDR technology) per plot with hourly readings in 10 cm depth increments to 1 m depth [29]. The average SWC of the 0–60 cm and 60–100 cm soil layers was calculated.

2.3.2. Evapotranspiration

The evapotranspiration (ET) of maize at each growth stage was calculated by the water balance formula:
ET = I + P D + Δ W
where I is the irrigation amount (mm); P is the accumulated precipitation (mm); D is the deep percolation amount (mm); and ΔW is the change of volumetric SWC (obtained through gravity method) in 0–100 cm soil profiles (mm).
According to the observations of SWC recorded by the Insentek sensors, SWC in the 90–100 cm layer did not change before and after precipitation or irrigation in 2018 and 2019; thus, deep percolation could be ignored in 2018 and 2019. However, in 2020, SWC in the 90–100 cm layer changed considerably before and after precipitation at the VE-R3 stage due to excessive precipitation. Because deep percolation could not be calculated precisely, ET could not be obtained when deep percolation occurred. Hence, in 2020, only the ET of the R3-R6 stage was calculated.

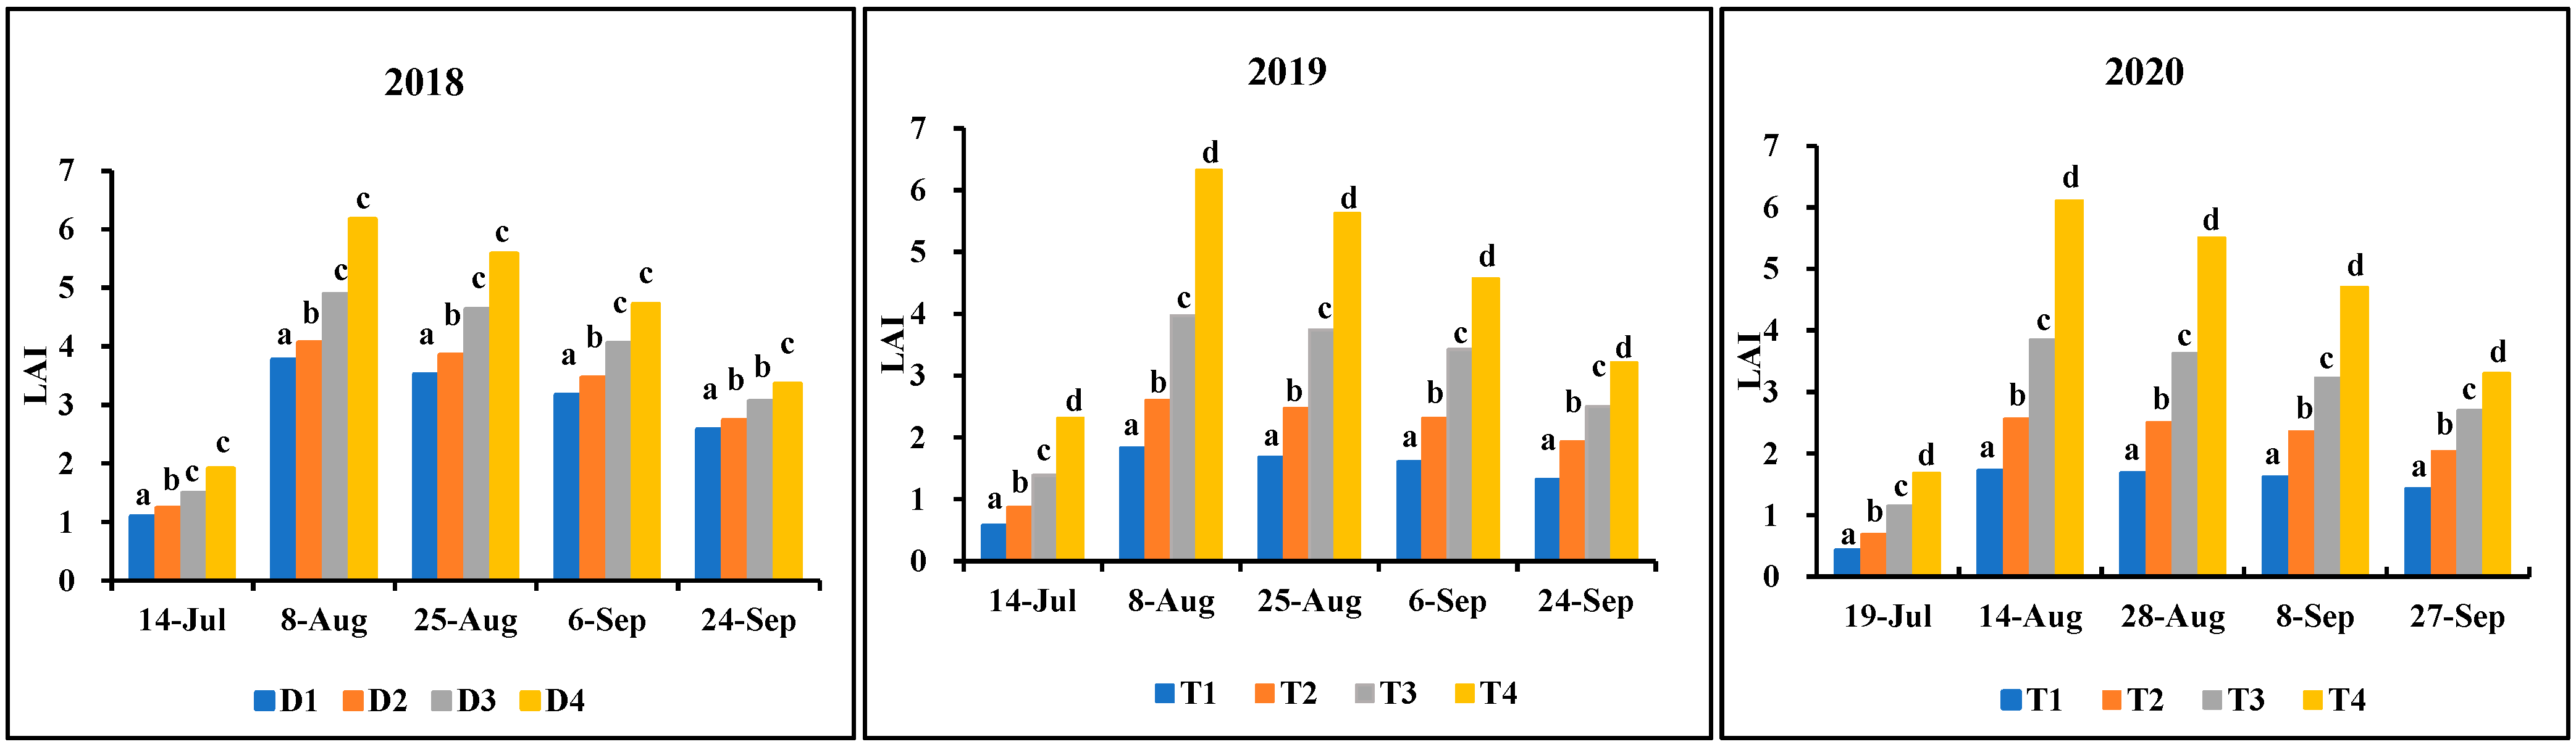
2.3.3. Leaf area Index

For each plot, five plants were sampled to measure leaf area index (LAI) during each growth stage. LAI was calculated by the method proposed by Li et al. (2008) [30].

2.3.4. Leaf Stomatal Conductance

Five plants of each plot were selected to measure the leaf stomatal conductance (LGs) (mol m−2 s−1) using a steady-state leaf porometer (SC-1, Decagon Devices Inc., Pullman, WA, USA) in 2019 and 2020. The measured position was at the middle edge of each leaf at three leaf positions (upper, middle, and lower). The LGs was measured at around 11:30 AM on clear days.

2.3.5. Grain Yield, Yield Components, and Water Use Efficiency

Maize grain yield was measured in each plot at the end of growing seasons by hand-harvesting four rows of maize spikes per plot. Plants in border rows were excluded from the harvest. The grains were weighed after natural air-drying and converted to grain yield per hectare. Water use efficiency (WUE) is the ratio of grain yield to the seasonal ET.

2.3.6. Statistical Analysis

Analysis of variance (ANOVA) was performed in the Statistical Product and Service Solutions software (SPSS version 24.0 for windows, SPSS Inc., Chicago, IL, USA). One way ANOVA was used to test the effects of planting density on SWC, LAI, and LGs. Two-way ANOVA was used to test the effects of planting density and year on ET, grain yield, and its components. Because the treatments in 2018 were different from those in 2019 and 2020, the two-way ANOVA only analyzed the data of 2019 and 2020. Comparisons of means among treatments were based on the least significant difference (LSD) test. Both the regression model which fits grain yield and graphical data presentations within this article were plotted in Excel 2010.

3. Results

3.1. Leaf Area Index and Leaf Stomatal Conductance

Leaf area index (LAI) and leaf stomatal conductance (LGs) are the two main factors affecting leaf transpiration rate. Figure 3 shows the LAI of each treatment. LAI reached the maximum at the VT-R3 stage, and then decreased gradually after the VT stage for each treatment. Higher planting density had greater LAI for the whole growth stage; however, due to leaf wilting, higher planting density had a larger decrease in LAI after the VT stage. In 2018, 2019, and 2020, when the LAI reached the maximum, LAI of the highest planting density was, respectively, 63.6%, 254.8%, and 245.4% greater than that of the lowest planting density.
Figure 4 shows the LGs of each treatment in 2019 and 2020. Higher planting density had smaller LGs after the VT stage. For each treatment, LGs reached the maximum at the VT-R3 stage, and then decreased gradually. When LGs reached the maximum, the LGs of the lowest planting density was 100.6% and 110.4% greater than that of the highest planting density in 2019 and 2020, respectively.

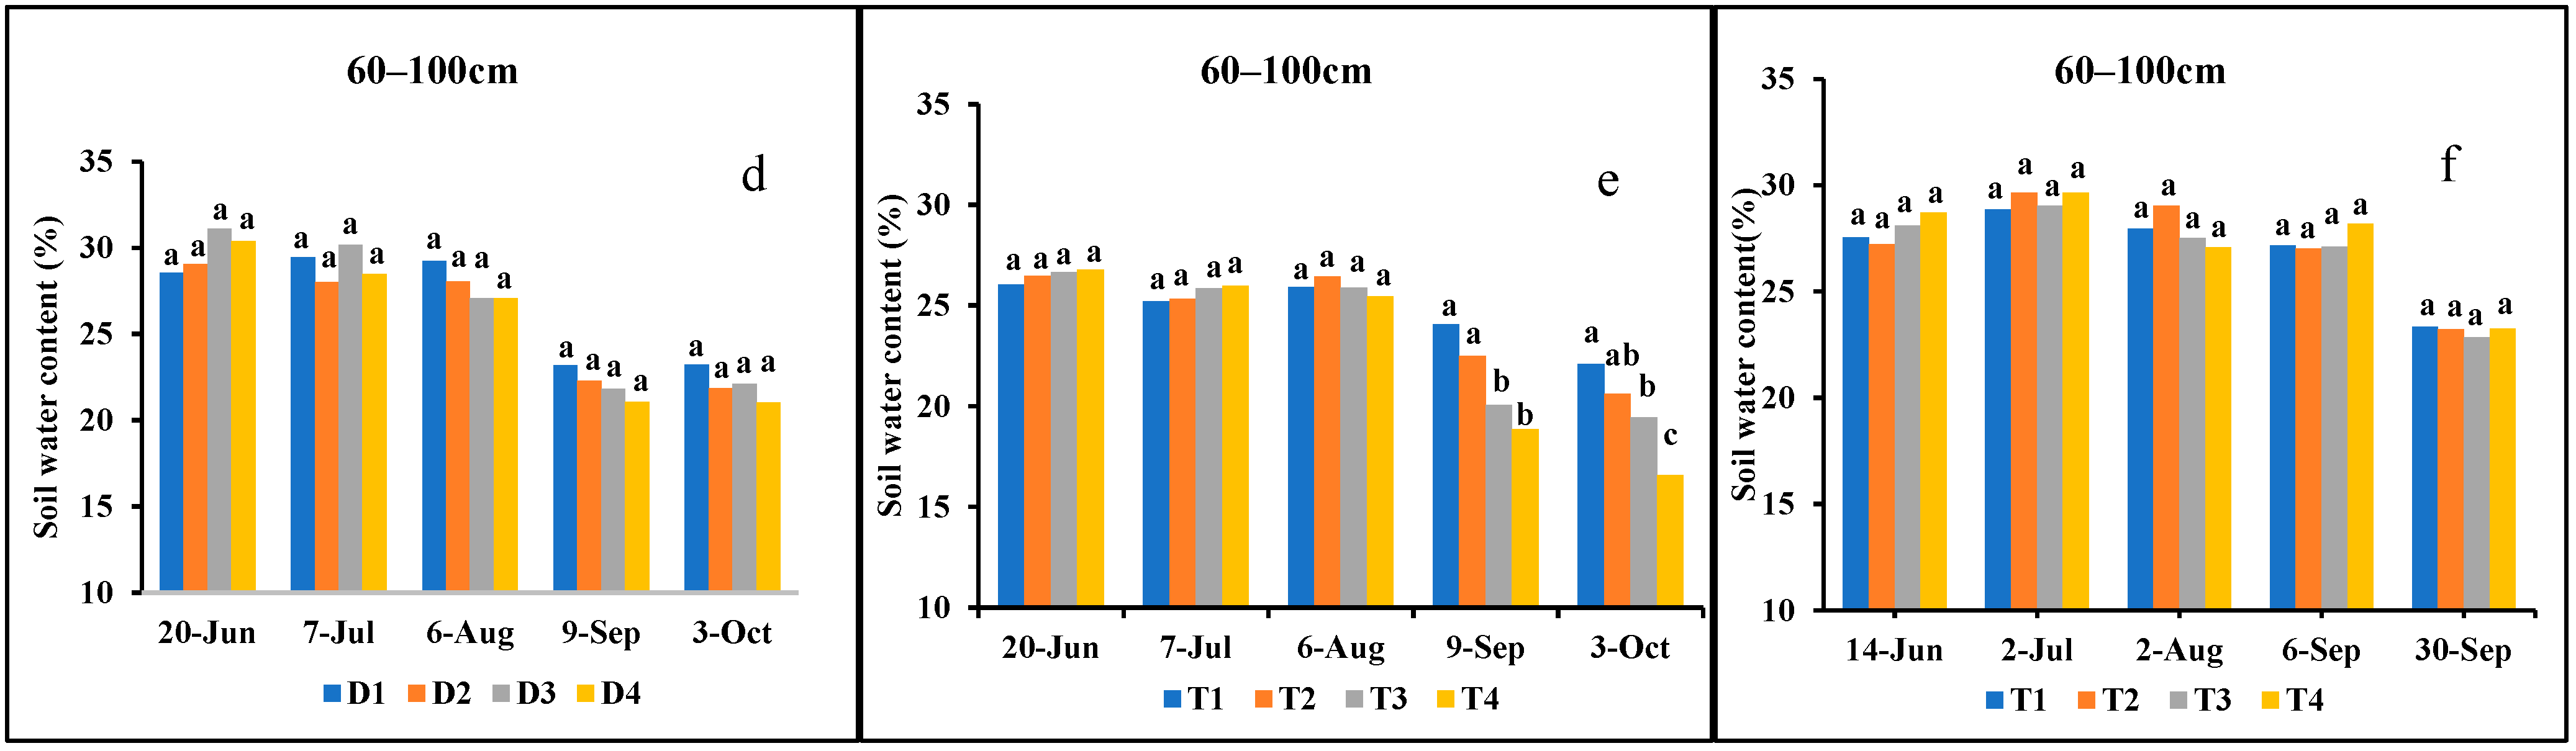
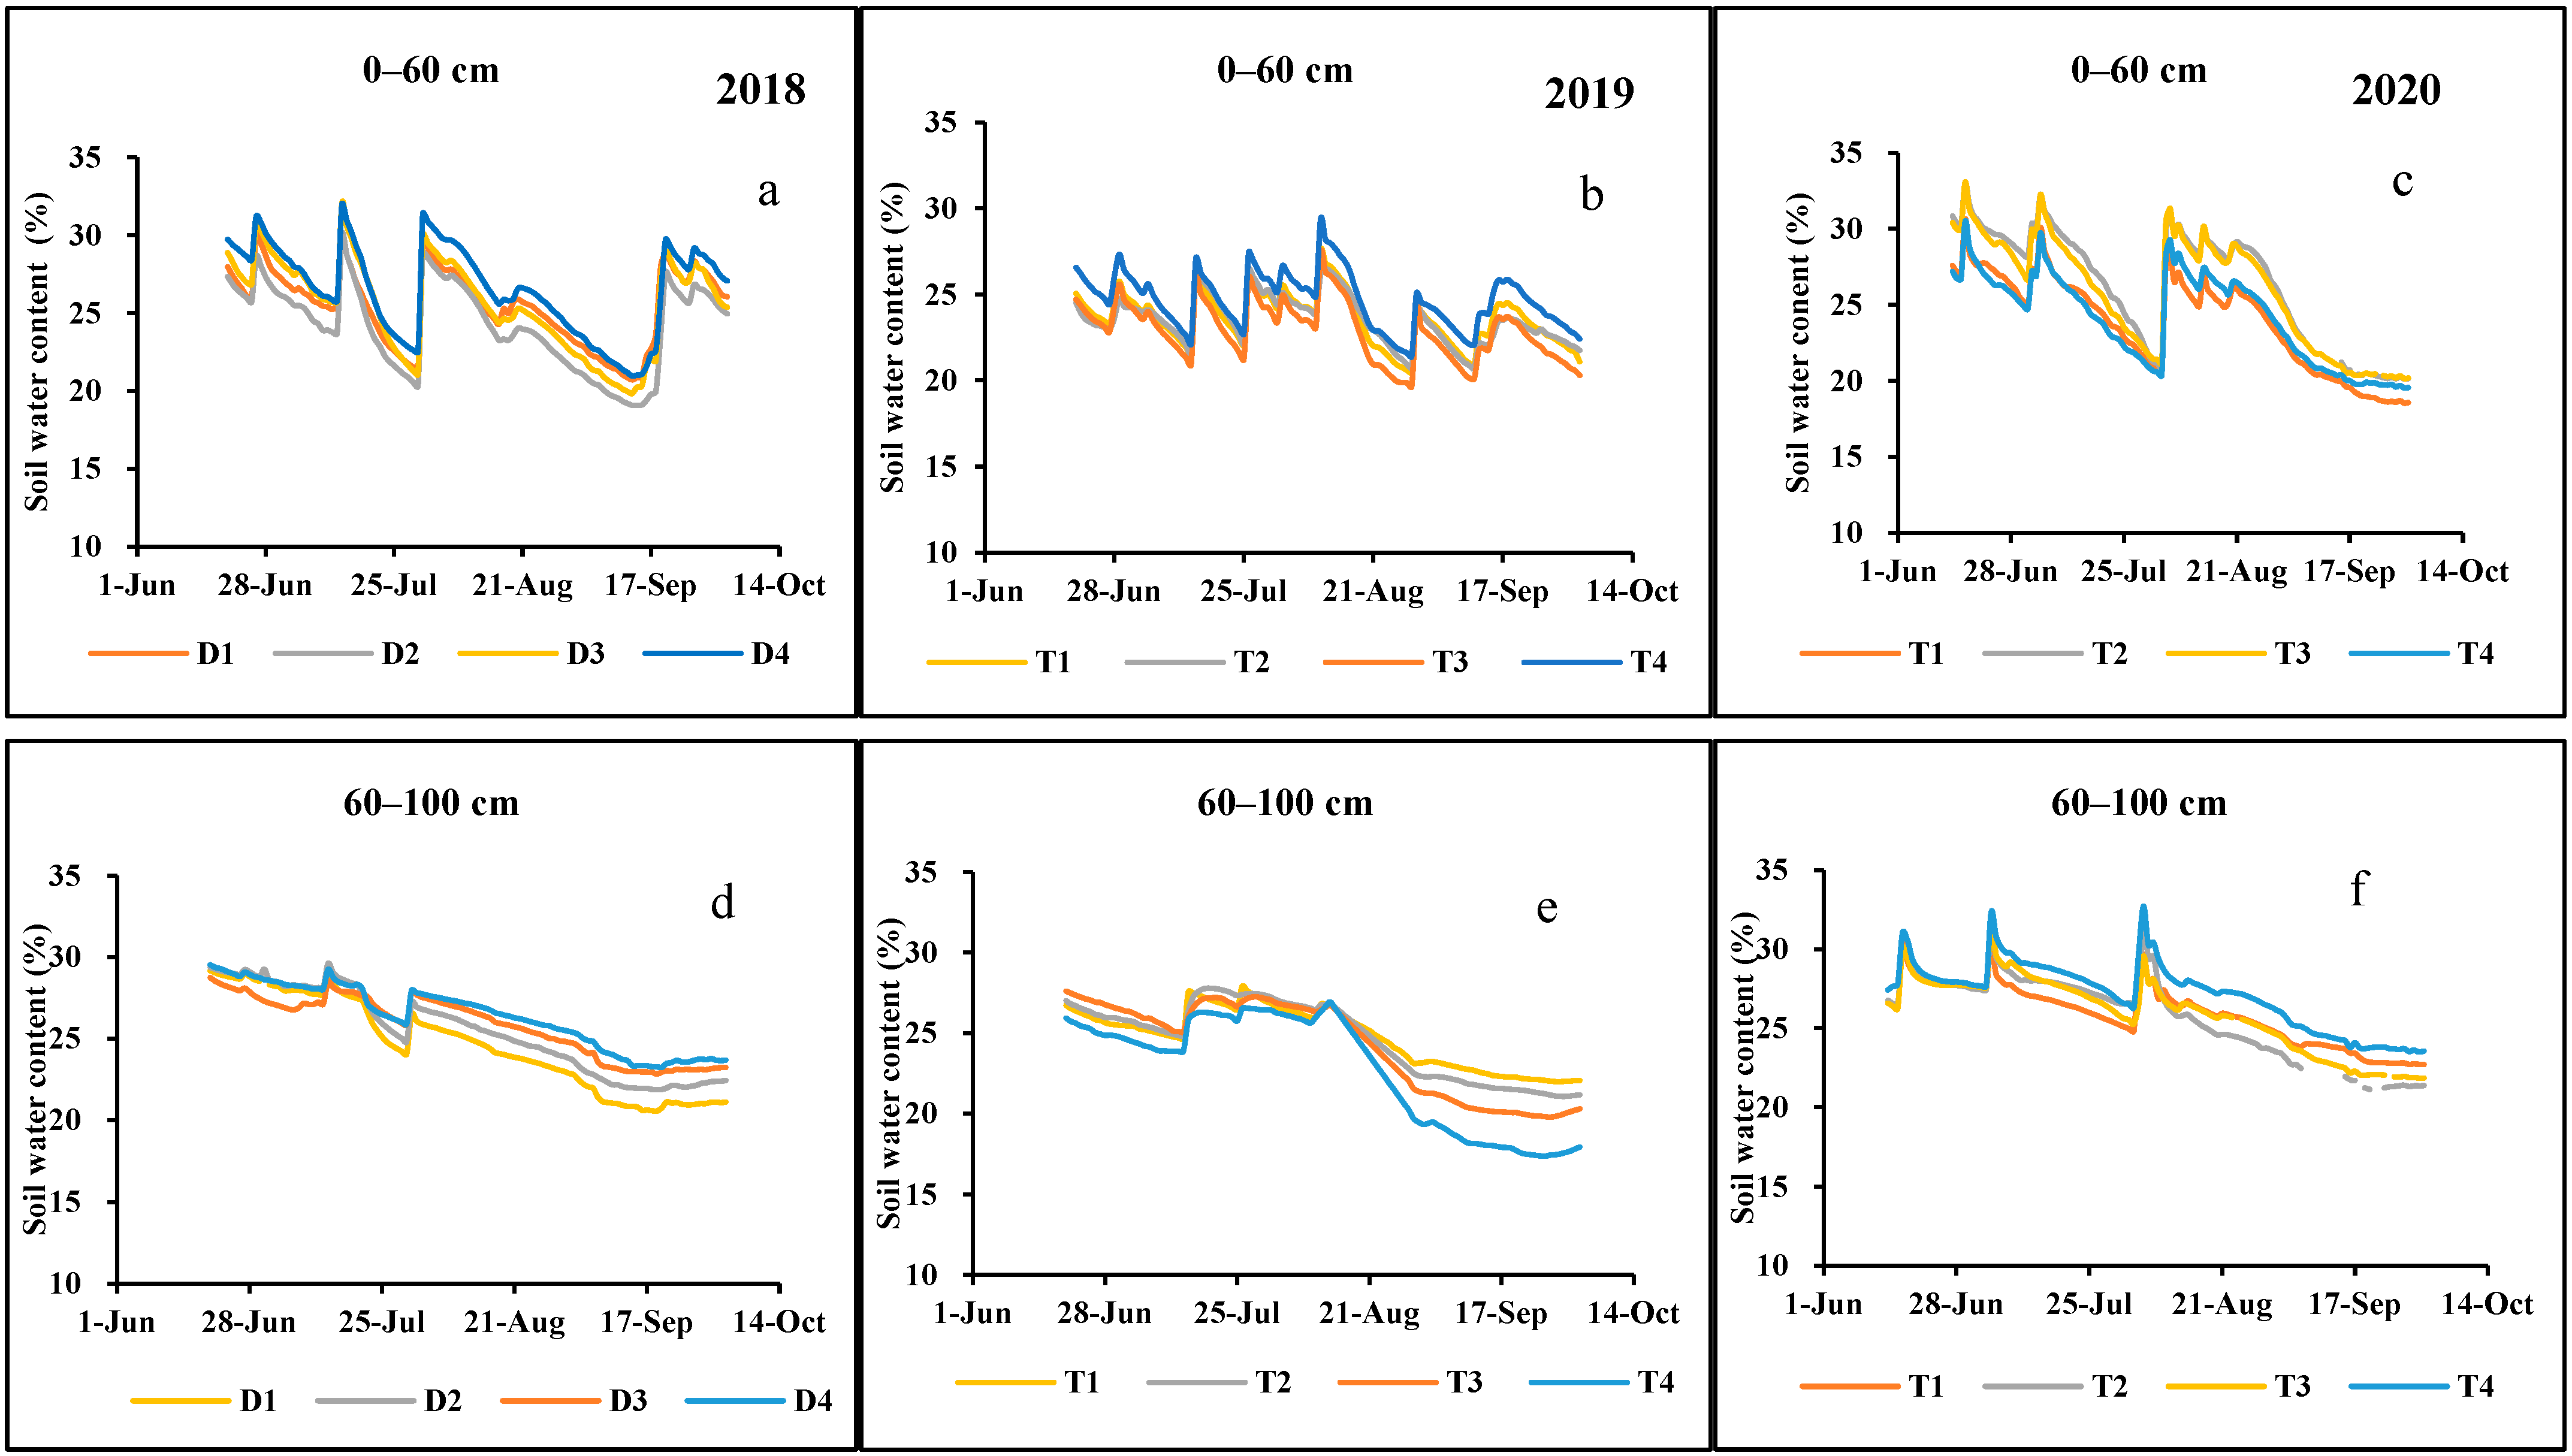
3.2. Soil Water Content

Figure 5 shows the average soil water content (SWC) in the 0–60 cm and 60–100 cm soil layers obtained by the gravity method, whereas Figure 6 shows the average SWC dynamics in the 0–60 cm and 60–100 cm soil layer obtained by the Insentek sensors.
For the 3-year experiment, except for 21 July to 30 July 2018 and 13 August to 29 August 2019, soil water use occurred mainly in the 0–60 cm soil layer (Figure 6).
In 2018, the planting density range was 57,100–100,000 plants ha−1, and no significant differences were observed in SWC in the 0–60 cm soil layer (Figure 5 and Figure 6). However, between 21 July and 30 July, the soil water use from the 60–100 cm soil layer increased in each treatment, and the treatments with higher planting density tended to have a larger water use, except that the water use of D3 and D4 treatments was relatively close (Figure 6a,d).
In 2019 and 2020, the planting density range was changed to 27,800–111,000 plants ha−1 due to limited differences in SWC in 2018. In 2019, from about 13 August to 29 August, in the 60–100 cm soil layer, higher planting densities showed a faster decline in SWC, but the trend gradually disappeared after 40 mm of water was irrigated on 29 August (Figure 6e). In the 0–60 cm soil layer, there was no significant difference in SWC for the whole growth stage (Figure 5 and Figure 6). In 2020, no significant difference in SWC was observed in both the 0–60 cm and 60–100 cm soil layers for the whole growth stage (Figure 5c,f and Figure 6c,f).

3.3. Maize Evapotranspiration

Table 4 shows the maize evapotranspiration (ET) at each growth stage. In 2020, deep percolation occurred at the VE-R3 stage due to excessive precipitation; therefore, only the ET of the R3-R6 stage was calculated, and no significant difference was observed. In 2018, the total ET ranged from 365.4 to 381.1 mm as planting density ranged from 57,100 to 100,000 plants ha−1; there was no significant difference during the whole growth stage. In 2019, the total ET ranged from 341.9 to 375.9 mm as planting density ranged from 27,800 to 111,100 plants ha−1; higher planting density led to greater ET at the VT-R3 stage, but no significant difference was observed at other stages. For the VT-R3 stage of 2019 and 2020, ET was significantly affected by year and the interaction of year (Y) and planting density (P). Compared with other growth stages, the daily average ET was highest at the V6-VT stage in both 2018 and 2019.

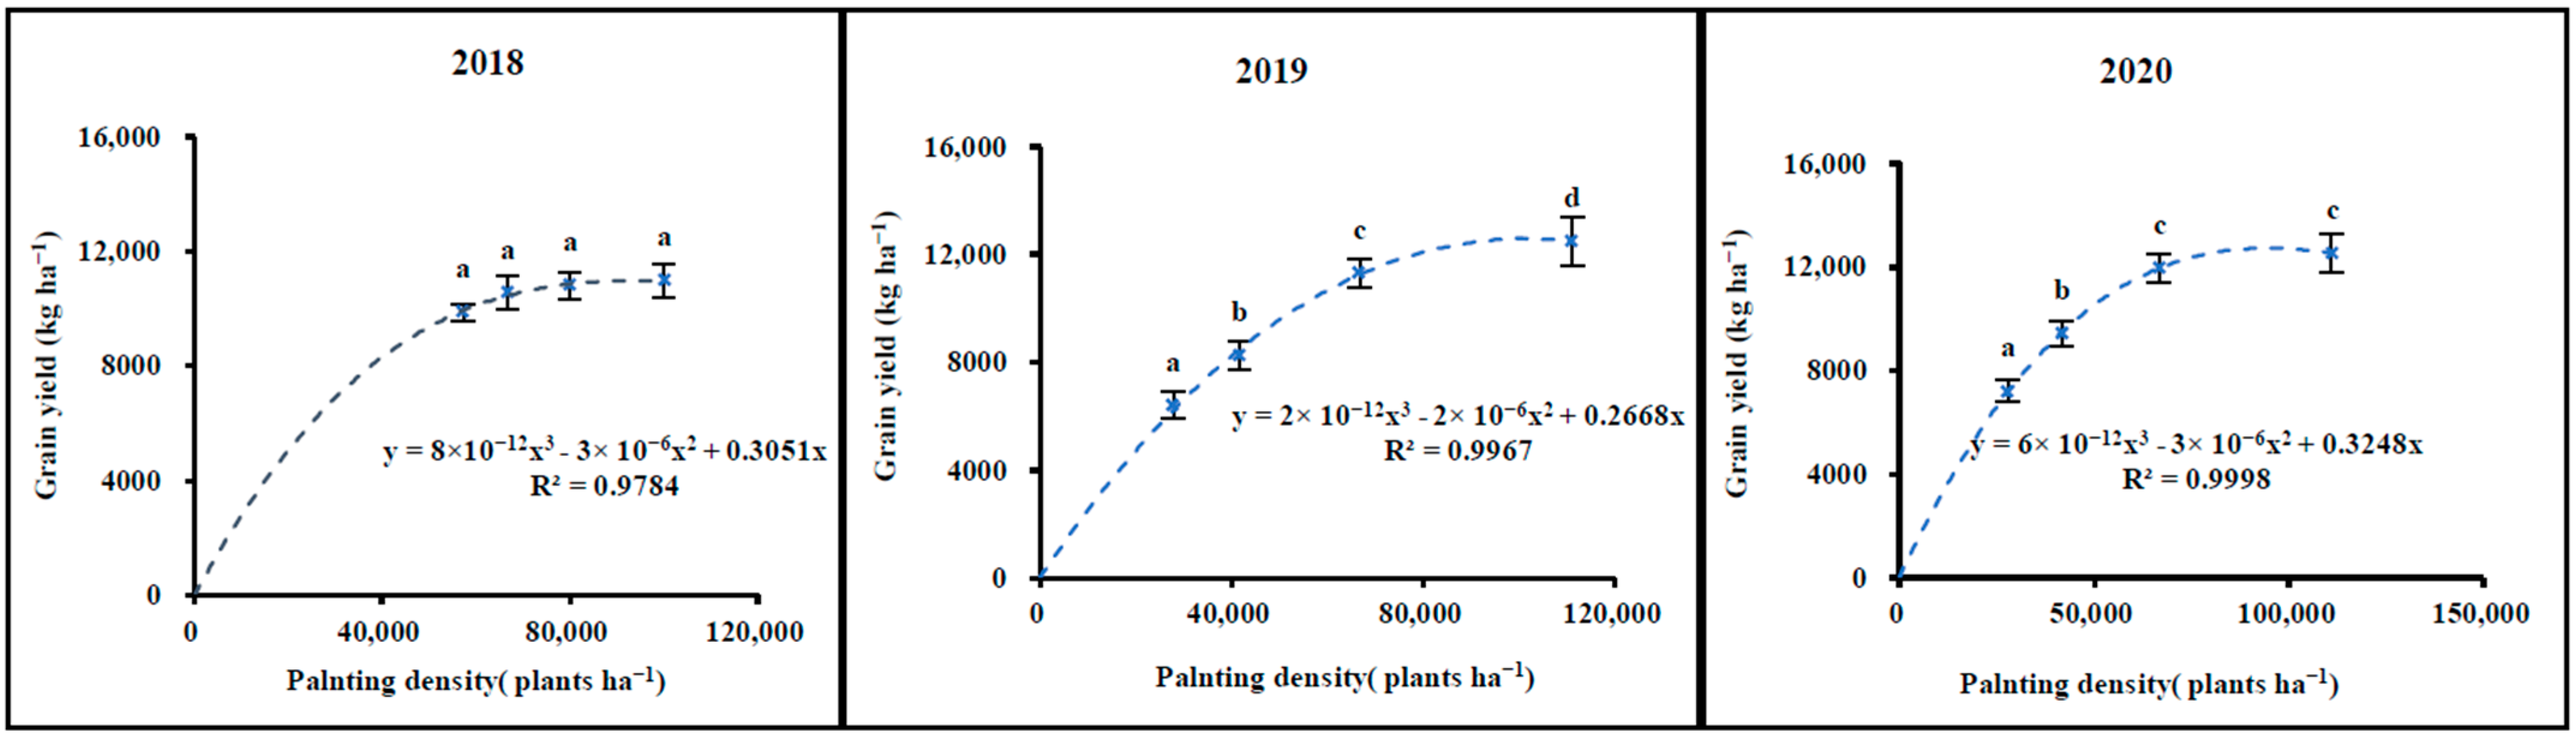
3.4. Grain Yield, Yield Components, and Water Use Efficiency

Grain yield, spikes weight per plant, and 1000-grain weight were significantly affected by years (Y) 2019 and 2020 and planting density (P) but not significantly affected by the interaction of Y × P. Spikes per plant were significantly affected by Y, P, and Y × P (Table 5). For 3 years, higher planting density led to greater grain yield. Grain yield in 2018 ranged from 9874 to 10,984 kg ha−1 as planting density ranged from 57,100 to 100,000 plants ha−1, but the difference was not significant for all treatments. Grain yield ranged from 6390 to 12,486 kg ha−1 in 2019, and from 7191 to 12,523 kg ha−1 in 2020, as planting density ranged from 27,800 to 111,100 plants ha−1. In general, the grain yield was higher in 2020 than 2019.
For 3 years, greater planting density had a negative effect on 1000-grain weight. In 2018, there was on average one effective spike per plant when planting density was between 57,100 and 100,000 plants ha−1. However, when planting density dropped to 41,700 and 27,800 plants ha−1, the average numbers of effective spikes per plant were, respectively, 1.25 and 1.48 in 2019 and 1.11 and 1.46 in 2020. In 2018, because planting density had little effect on total ET for all treatments, the difference in water use efficiency (WUE) was influenced mainly by grain yield, resulting in the order D2 > D4 > D3 > D1. In 2019, a trend of change in WUE in different planting density treatments was consistent with the changes in grain yield, with higher planting density having greater WUE. In 2020, WUE was not calculated due to the data on total ET being unavailable.

4. Discussion

4.1. Leaf Area Index and Stomatal Conductance

Leaf transpiration is the evaporation of water from leaf stomata; therefore, leaf area index (LAI) and stomata are the two main factors affecting transpiration. Increasing planting density could lead to the increase in LAI and, more specifically, transpiration area. It could also lead to the decrease in the leaf stomatal conductance (LGs). The previous studies have shown that increasing LGs could increase leaf transpiration rate (LTr) [31,32], and LTr increases linearly with LGs when boundary layer resistance is nearly zero [33]. Some studies showed that high planting density could lead to a decrease in leaf stomatal area or stomatal density [34,35,36], which might be the main reason for planting density affecting LGs and LTr. Therefore, although increasing planting density could greatly increase LAI, it could also greatly reduce LTr, which would reduce the difference in total water use between planting densities.

4.2. Soil Water Content and Evapotranspiration

Increasing planting density generally increases total water use by maize [18,19,20], but there are contrasting conclusions as well. Jia et al. (2018a) reported that planting density had no significant effect on total water use by maize, because an increase in planting density was associated with increased water use by maize before silking and decreased after silking [8]. Lamm et al. (2009) thought that maize planted at different planting densities could reach a LAI threshold quickly enough to make maize water use differences non-detectable [4]. Ogola et al. (2005) reported that neither planting density nor the interaction between planting density and water supply affected water use by maize [25].
In 2018, maize planting density ranged from 57,100 to 100,000 plants ha−1, but limited effects of planting density on soil water content (SWC) and ET were found. Hence, in 2019 and 2020, we expanded the range of planting densities from 27,800 to 111,100 plants ha−1. In 2019, planting density showed an effect on SWC in the 60–100 cm soil layer after about August 13. In 2020, no significant difference in SWC was observed during the whole growth stage.
Many studies reported that the main water-absorbing root system of maize was in the 0–60 cm soil layer [37,38,39,40]. Our study showed a similar result, except for 21 July to 30 July 2018 and 13 August to 29 August 2019 (Figure 6). From 21 July to 30 July 2018 (Figure 6a,d) and 13 August to 29 August 2019 (Figure 6b,e), the SWC in the 0–60 cm soil layer was low and continued to decline during this time period (Figure 6a,b); in contrast, the soil water use was lower than in the preceding period, potentially due to insufficient SWC in this layer. Simultaneously, the soil water use in the 60–100 cm soil layer increased compared to the preceding period (Figure 6d,e); higher planting density showed a larger water use except that the water use in the D3 and D4 treatments was similar in 2018. However, after the precipitation on 30 July 2018 and the irrigation on 29 August 2019, the soil water use in the 60–100 cm soil layer decreased suddenly, and the differences among the treatments largely disappeared.
We concluded that, at the V6-R3 stage, when SWC in the 0–60 cm soil layer was sufficient and could meet the ET demand, maize root water absorption occurred mainly in the 0–60 cm soil layer. Although decreased planting density would decrease total canopy transpiration, soil water in the 0–60 cm soil layer could be easily consumed by soil evaporation; hence, the effect of planting density on soil water use could not be observed due to soil evaporation. When SWC in the 0–60 cm soil layer was low and could not meet the ET demand, maize root water absorption was no longer confined mainly to the 0–60 cm soil layer, and soil water use in the 60–100 cm soil layer began to increase significantly. Being relatively deep, the 60–100 cm soil layer was little affected by soil evaporation. Soil water use in the 60–100 cm soil layer was mainly due to root water absorption and crop transpiration; therefore, increased planting density elevated soil water use in the 60–100 cm soil layer, which led to an increase in total water use and ET.
At the end of July 2020, SWC in the 0–60 cm soil layer was relatively low (Figure 6c) and not significantly different from that in the 60–100 cm layer (Figure 6f). Although SWC in the 0–60 cm soil layer continued to decline during this period, the soil water use remained stable (Figure 6c), indicating that soil water in this layer could meet the ET demand. In fact, the precipitation during the first three growth stages reached 563 mm in 2020, resulting in high SWC (Figure 5f and Figure 6f). Importantly, excessive precipitation could allow soils with different levels of SWC reach field capacity, thus offsetting the differences associated with different soil water use levels. In the 3-year experiment, SWC in the 0–60 cm was low at the R3-R6 growth stages (Figure 6), but the soil water use in the 60–100 cm soil layer did not differ significantly among the treatments. There were two main reasons: first, the daily ET was relatively low at the R3-R6 stage (Table 4), and second, higher planting density led to a faster rate of leaf area decline (Figure 3), making the transpiration difference among different treatments relatively small at the R3-R6 stage.

4.3. Yield and Yield Components

Most studies have proved that increasing planting density had a positive effect on grain yield and number of effective spikes per plant but a negative effect on 1000-grain weight in a certain range of planting densities [41,42,43]. These studies partially support our results, except that the number of effective spikes per plant in 2018 was 1.00 for all treatments; this may be partially due to the factor of planting spacing. In 2018, we controlled planting density by adjusting row spacing, whereas in 2019 and 2020 we controlled planting density by adjusting within row spacing, and many studies have shown that even at the same planting density, different planting spacing can affect the canopy structure and then affect the maize growth and yield components [44,45,46].
As shown in Figure 7, the yield increased with increasing planting density, but leveled off as the planting density increased to about 80,000 plants ha−1. This finding suggested that increasing the planting density above a threshold value would not further increase the grain yield.
Compared with D2 or T3 treatment (66,700 plants ha−1), the yield in the highest planting density treatment increased by 4.0%, 10.3%, and 4.6% in 2018, 2019, and 2020, respectively. However, the corresponding increases in planting density were 50%, 66.7%, and 66.7%, respectively. Hence, as the planting density reaches a certain level, further increases in planting density would not significantly increase grain yield and would lead to increased costs and weak plants susceptible to biotic and abiotic stresses [47,48,49], including drought stress [6]. Therefore, high planting density should be selected carefully.

5. Conclusions

Under the given irrigation conditions, increasing maize planting density would increase leaf area index and leaf aging rate but would decrease leaf stomatal conductance and leaf transpiration rate. Maize grain yield reached the maximum at about 80,000 plants ha−1. At the VE-V6 and R3-R6 stages, soil water use occurred mainly in the 0–60 cm soil layer, and planting density showed no effect on total soil water use by maize. At the V6-R3 stage, when the soil water content in the 0–60 cm soil layer was sufficient to meet the evapotranspiration demand, maize root water absorption occurred mainly in the 0–60 cm soil layer, and increased planting density would not increase total water use by maize. When the soil water content in the 0–60 cm soil layer was low and could not meet the evapotranspiration demand, soil water use in the 60–100 cm soil layer would increase greatly, and increased planting density would elevate soil water use in the 60–100 cm soil layer significantly, which would lead to an increase in total soil water use by maize. In general, the effect of maize planting density on water use characteristics varies with soil water content in the 0–60 cm soil layer.

Author Contributions

Conceptualization, J.Q., M.L.; methodology X.W.; Investigation, M.L.; data curation. X.F., M.J.; formal analysis, X.F., M.J.; writing—original draft preparation, J.Q.; writing—review and editing, M.L., X.W.; resources, M.L.; project administration, M.L. All authors have read and agreed to the published version of the manuscript.

Funding

This work was supported by the Basic Scientific Research Project of Chinese Academy of Agricultural Sciences (No. Y2018XM08).

Institutional Review Board Statement

Not applicable.

Informed Consent Statement

Not applicable.

Data Availability Statement

The data presented in this study are available on request from the corresponding author.

Conflicts of Interest

We declare that we do not have any commercial or associative interest that represents a conflict of interest in connection with the work submitted.

References

  1. Gandhi, V.P.; Zhou, Z. Food demand and the food security challenge with rapid economic growth in the emerging economies of India and China. Food Res. Int. 2014, 63, 108–124. [Google Scholar] [CrossRef]
  2. Du, X.; Wang, Z.; Lei, W.; Kong, L. Increased planting density combined with reduced nitrogen rate to achieve high yield in maize. Sci. Rep. 2021, 11, 358. [Google Scholar] [CrossRef] [PubMed]
  3. FAO. Faostat. 2019. Available online: http://www.fao.org/faostat/en/#data/QC (accessed on 7 September 2021).
  4. Lamm, F.; Aiken, R.; Abou Kheira, A. Corn yield and water use characteristics as affected by tillage, plant density, and irrigation. Trans. ASABE 2009, 52, 133–143. [Google Scholar] [CrossRef] [Green Version]
  5. Edwards, J.W. Genotype× environment interaction for plant density response in maize (Zea mays L.). Crop Sci. 2016, 56, 1493–1505. [Google Scholar] [CrossRef] [Green Version]
  6. Zhang, Y.; Wang, R.; Wang, S.; Ning, F.; Wang, H.; Wen, P.; Li, A.; Dong, Z.; Xu, Z.; Zhang, Y. Effect of planting density on deep soil water and maize yield on the Loess Plateau of China. Agric. Water Manag. 2019, 223, 105655. [Google Scholar] [CrossRef]
  7. Li, Z.; Liu, K.; Liu, C.; Zhang, X.; Liu, X.; Zhang, H.; Liu, S.; Wang, Q.; Li, Q. Aboveground dry matter and grain yield of summer maize under different varieties and densities in North China Plain. Maydica 2013, 58, 189–194. [Google Scholar]
  8. Jia, Q.; Sun, L.; Wang, J.; Li, J.; Ali, S.; Liu, T.; Zhang, P.; Lian, Y.; Ding, R.; Ren, X. Limited irrigation and planting densities for enhanced water productivity and economic returns under the ridge-furrow system in semi-arid regions of China. Field Crop Res. 2018, 221, 207–218. [Google Scholar] [CrossRef]
  9. Zhai, L.-C.; Xie, R.-Z.; Bo, M.; Li, S.-K. Evaluation and analysis of intraspecific competition in maize: A case study on plant density experiment. J. Integr. Agric. 2018, 17, 2235–2244. [Google Scholar] [CrossRef] [Green Version]
  10. Li, H.; Wang, X.; Brooker, R.W.; Rengel, Z.; Zhang, F.; Davies, W.J.; Shen, J. Root competition resulting from spatial variation in nutrient distribution elicits decreasing maize yield at high planting density. Plant Soil 2019, 439, 219–232. [Google Scholar] [CrossRef]
  11. Mohammad, S.; Jehan, B.; Sajjad, A.; Hamayoon, K.; Khan, M.; Mohammad, S. Effect of planting density on phenology, growth and yield of maize (Zea mays L.). Pak. J. Bot. 2012, 44, 691–696. [Google Scholar]
  12. Nyakudya, I.W.; Stroosnijder, L. Effect of rooting depth, plant density and planting date on maize (Zea mays L.) yield and water use efficiency in semi-arid Zimbabwe: Modelling with AquaCrop. Agric. Water Manag. 2014, 146, 280–296. [Google Scholar] [CrossRef]
  13. Trachsel, S.; San Vicente, F.; Suarez, E.; Rodriguez, C.; Atlin, G. Effects of planting density and nitrogen fertilization level on grain yield and harvest index in seven modern tropical maize hybrids (Zea mays L.). J. Agric. Sci. 2016, 154, 689–704. [Google Scholar] [CrossRef]
  14. Ming, B.; Xie, R.; Hou, P.; Li, L.; Wang, K.; Li, S. Changes of maize planting density in China. Sci. Agric. Sin. 2017, 50, 1960–1972. [Google Scholar]
  15. Luo, N.; Wang, X.; Hou, J.; Wang, Y.; Wang, P.; Meng, Q. Agronomic optimal plant density for yield improvement in the major maize regions of China. Crop Sci. 2020, 60, 1580–1590. [Google Scholar] [CrossRef]
  16. Walker, S.; Ogindo, H. The water budget of rainfed maize and bean intercrop. Phys. Chem. Earth 2003, 28, 919–926. [Google Scholar] [CrossRef]
  17. Pellegrino, A.; Lebon, E.; Voltz, M.; Wery, J. Relationships between plant and soil water status in vine (Vitis vinifera L.). Plant Soil 2005, 266, 129–142. [Google Scholar] [CrossRef]
  18. Jiang, X.; Kang, S.; Tong, L.; Li, F.; Li, D.; Ding, R.; Qiu, R. Crop coefficient and evapotranspiration of grain maize modified by planting density in an arid region of northwest China. Agric. Water Manag. 2014, 142, 135–143. [Google Scholar] [CrossRef]
  19. Chen, Z.; Sun, S.; Zhu, Z.; Jiang, H.; Zhang, X. Assessing the effects of plant density and plastic film mulch on maize evaporation and transpiration using dual crop coefficient approach. Agric. Water Manag. 2019, 225, 105765. [Google Scholar] [CrossRef]
  20. Sun, S.; Zhu, Z.; Chen, Z.; Yang, D.; Zhang, X. Effects of different colored plastic film mulching and planting density on soil temperature, evapotranspiration and yield of spring maize. Sci. Agric. Sin. 2019, 52, 3323–3336. [Google Scholar]
  21. Wang, Y.; Horton, R.; Xue, X.; Ren, T. Partitioning evapotranspiration by measuring soil water evaporation with heat-pulse sensors and plant transpiration with sap flow gauges. Agric. Water Manag. 2021, 252, 106883. [Google Scholar] [CrossRef]
  22. Kang, S.; Gu, B.; Du, T.; Zhang, J. Crop coefficient and ratio of transpiration to evapotranspiration of winter wheat and maize in a semi-humid region. Agric. Water Manag. 2003, 59, 239–254. [Google Scholar] [CrossRef]
  23. Zhou, S.; Liu, W.; Lin, W. The ratio of transpiration to evapotranspiration in a rainfed maize field on the Loess Plateau of China. Water Sci. Technol. Water Supply 2017, 17, 221–228. [Google Scholar] [CrossRef] [Green Version]
  24. Liu, C.; Zhang, X.; Zhang, Y. Determination of daily evaporation and evapotranspiration of winter wheat and maize by large-scale weighing lysimeter and micro-lysimeter. Agric. For. Meteorol. 2002, 111, 109–120. [Google Scholar] [CrossRef]
  25. Ogola, J.; Wheeler, T.R.; Harris, P. Water use of maize in response to planting density and irrigation. South Afr. J. Plant Soil 2005, 22, 116–121. [Google Scholar] [CrossRef] [Green Version]
  26. Zheng, J.; Fan, J.; Zou, Y.; Chau, H.W.; Zhang, F. Ridge-furrow plastic mulching with a suitable planting density enhances rainwater productivity, grain yield and economic benefit of rainfed maize. J. Arid. Land 2019, 12, 181–198. [Google Scholar] [CrossRef]
  27. Feng, W.; Shum, C.; Zhong, M.; Pan, Y. Groundwater Storage Changes in China from Satellite Gravity: An Overview. Remote Sens. 2018, 10, 674. [Google Scholar] [CrossRef] [Green Version]
  28. Currell, M.J.; Han, D.; Chen, Z.; Cartwright, I. Sustainability of groundwater usage in northern China: Dependence on palaeowaters and effects on water quality, quantity and ecosystem health. Hydrol. Processes 2012, 26, 4050–4066. [Google Scholar] [CrossRef]
  29. Qin, A.; Ning, D.; Liu, Z.; Sun, B.; Zhao, B.; Xiao, J.; Duan, A. Insentek sensor: An alternative to estimate daily crop evapotranspiration for maize plants. Water 2019, 11, 25. [Google Scholar] [CrossRef] [Green Version]
  30. Li, S.; Kang, S.; Li, F.; Zhang, L. Evapotranspiration and crop coefficient of spring maize with plastic mulch using eddy covariance in northwest China. Agric. Water Manag. 2008, 95, 1214–1222. [Google Scholar] [CrossRef]
  31. Nobel, P.S. Physicochemical & Environmental Plant Physiology; Academic Press: Cambridge, MA, USA, 1999. [Google Scholar]
  32. Jones, H. What is water use efficiency. In Water Use Efficiency in Plant Biology; CRC Press: Boca Raton, FL, USA, 2004; pp. 27–41. [Google Scholar]
  33. Yoo, C.Y.; Pence, H.E.; Hasegawa, P.M.; Mickelbart, M.V. Regulation of transpiration to improve crop water use. Crit. Rev. Plant Sci. 2009, 28, 410–431. [Google Scholar] [CrossRef]
  34. Niu, L.; Yan, Y.; Hou, P.; Bai, W.; Zhao, R.; Wang, Y.; Li, S.; Du, T.; Zhao, M.; Song, J. Influence of plastic film mulching and planting density on yield, leaf anatomy, and root characteristics of maize on the Loess Plateau. Crop J. 2020, 8, 548–564. [Google Scholar] [CrossRef]
  35. Khan, A.; Zheng, J.; Tan, D.K.Y.; Khan, A.; Akhtar, K.; Kong, X.; Munsif, F.; Iqbal, A.; Afridi, M.Z.; Ullah, A. Changes in leaf structural and functional characteristics when changing planting density at different growth stages alters cotton lint yield under a new planting model. Agronomy 2019, 9, 859. [Google Scholar] [CrossRef] [Green Version]
  36. Li, T.; Liu, L.-N.; Jiang, C.-D.; Liu, Y.-J.; Shi, L. Effects of mutual shading on the regulation of photosynthesis in field-grown sorghum. J. Photochem. Photobiol. B-Biol. 2014, 137, 31–38. [Google Scholar] [CrossRef] [PubMed] [Green Version]
  37. Zhang, F.-L.; Niu, X.-K.; Zhang, Y.-M.; Xie, R.-Z.; Xin, L.; Li, S.-K.; Gao, S.-J. Studies on the root characteristics of maize varieties of different eras. J. Integr. Agric. 2013, 12, 426–435. [Google Scholar] [CrossRef]
  38. Jia, Q.; Xu, Y.; Ali, S.; Sun, L.; Ding, R.; Ren, X.; Zhang, P.; Jia, Z. Strategies of supplemental irrigation and modified planting densities to improve the root growth and lodging resistance of maize (Zea mays L.) under the ridge-furrow rainfall harvesting system. Field Crop. Res. 2018, 224, 48–59. [Google Scholar] [CrossRef]
  39. Greaves, G.E.; Wang, Y.-M. Effect of regulated deficit irrigation scheduling on water use of corn in southern Taiwan tropical environment. Agric. Water Manag. 2017, 188, 115–125. [Google Scholar] [CrossRef]
  40. Zhou, S.; Hu, X.; Ran, H.; Wang, W.; Hansen, N.; Cui, N. Optimization of irrigation and nitrogen fertilizer management for spring maize in northwestern China using RZWQM2. Agric. Water Manag. 2020, 240, 106276. [Google Scholar] [CrossRef]
  41. Ijaz, M.; Raza, M.A.S.; Ali, S.; Ghazi, K.; Yasir, T.A.; Saqib, M.; Naeem, M. Differential planting density influences growth and yield of hybrid maize (Zea mays L.). J. Agri. Environ. Sci. 2015, 2, 3. [Google Scholar]
  42. Aziz, A.; Rehman, H.U.; Khan, N. Maize cultivar response to population density and planting date for grain and biomass yield. Sarhad J. Agric. 2007, 23, 25. [Google Scholar]
  43. Zhang, M.; Tao, C.; Latifmanesh, H.; Feng, X.-M.; Cao, T.-H.; Qian, C.-R.; Deng, A.-X.; Song, Z.-W.; Zhang, W.-J. How plant density affects maize spike differentiation, kernel set, and grain yield formation in Northeast China? J. Integr. Agric. 2018, 17, 1745–1757. [Google Scholar] [CrossRef]
  44. Gobeze, Y.L.; Ceronio, G.M.; Van Rensburg, L.D. Effect of row spacing and plant density on yield and yield component of maize (Zea mays L.) under irrigation. J. Agric. Sci. Technology. B 2012, 2, 263. [Google Scholar]
  45. Liu, J.; Li, M.; Zhou, X. Row spacing effects on radiation distribution, leaf water status and yield of summer maize. J. Anim. Plant Sci. 2016, 26, 697–705. [Google Scholar]
  46. Testa, G.; Reyneri, A.; Blandino, M. Maize grain yield enhancement through high plant density cultivation with different inter-row and intra-row spacings. Eur. J. Agron. 2016, 72, 28–37. [Google Scholar] [CrossRef]
  47. Blandino, M.; Reyneri, A.; Vanara, F. Effect of plant density on toxigenic fungal infection and mycotoxin contamination of maize kernels. Field Crop. Res. 2008, 106, 234–241. [Google Scholar] [CrossRef]
  48. Fininsa, C.; Yuen, J. Association of maize rust and leaf blight epidemics with cropping systems in Hararghe highlands, eastern Ethiopia. Crop Prot. 2001, 20, 669–678. [Google Scholar] [CrossRef]
  49. Liu, S.; Song, F.; Liu, F.; Zhu, X.; Xu, H. Effect of planting density on root lodging resistance and its relationship to nodal root growth characteristics in maize (Zea mays L.). J. Agric. Sci. 2012, 4, 182. [Google Scholar] [CrossRef]
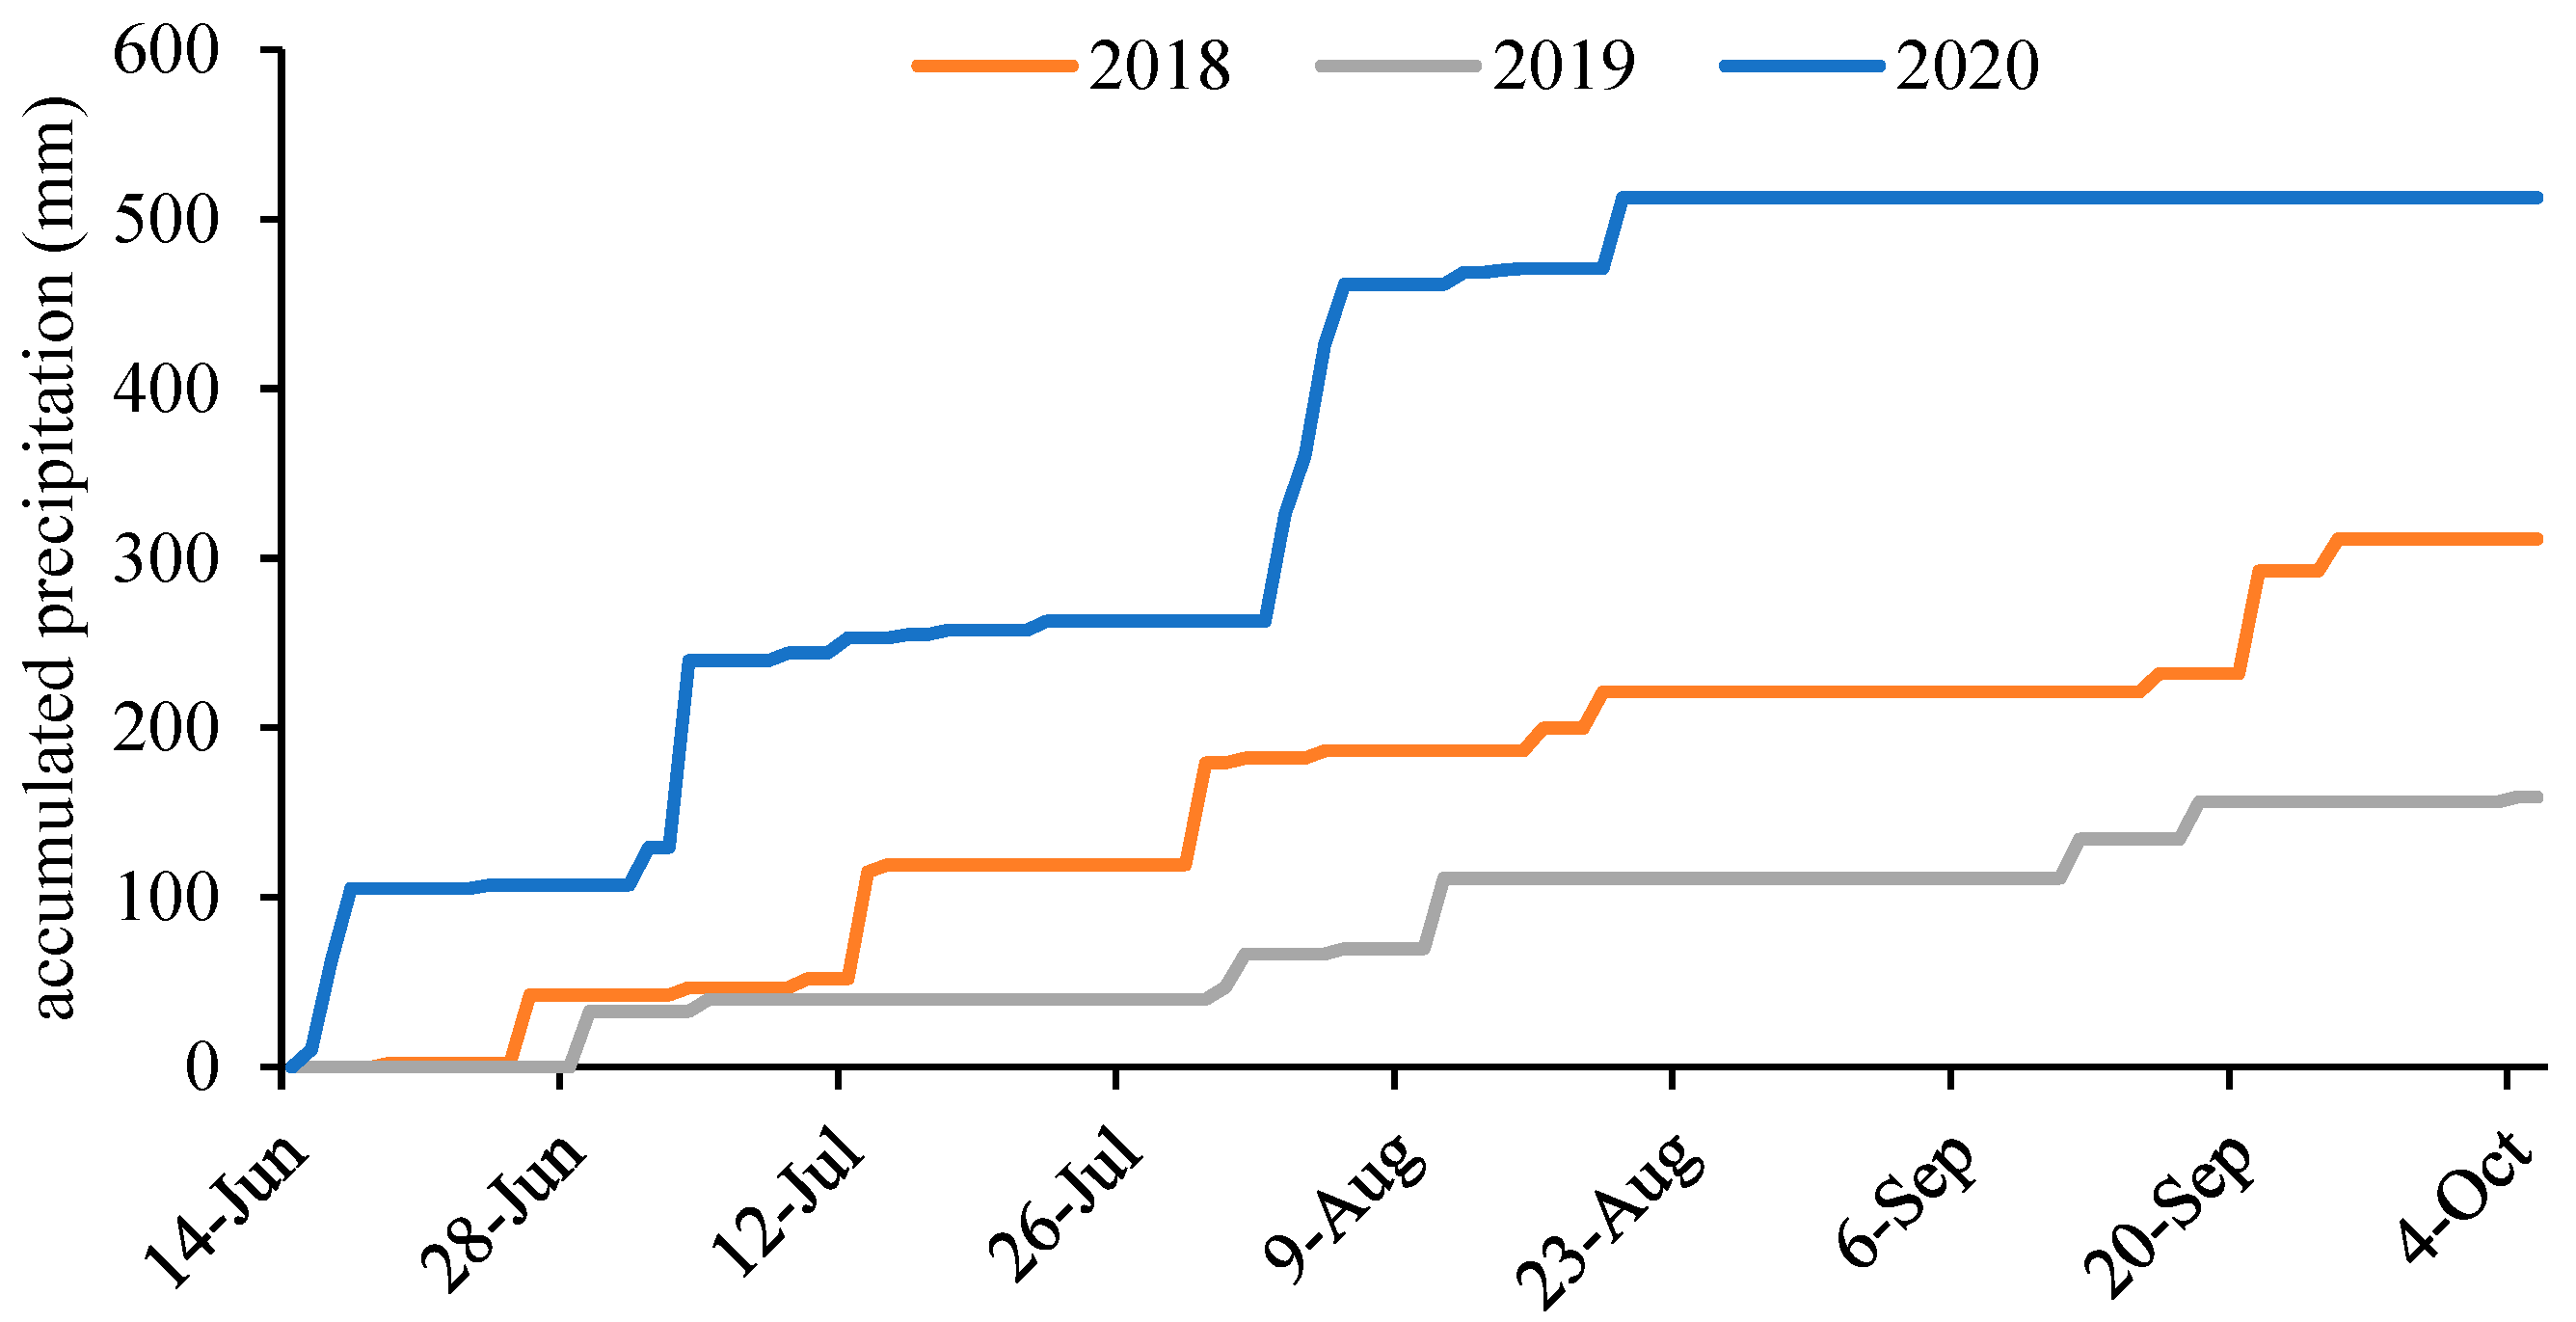
 [Green Version]
Figure 1. Map showing the location of the experiment area in the North China Plain.
Sustainability 14 05848 g001
Figure 2. Accumulated precipitation in maize growth seasons in 2018, 2019, and 2020.
Sustainability 14 05848 g002
Figure 3. Leaf area index (LAI) for maize with different planting densities in 2018, 2019, and 2020. Different lowercase letters indicate significant differences within the same date at p < 0.05.
Sustainability 14 05848 g003
Figure 4. Leaf stomatal conductance (LGs) for maize with different planting densities in 2019 and 2020. Different lowercase letters indicate significant differences within the same date at p < 0.05.
Sustainability 14 05848 g004
Figure 5. Volumetric soil water content obtained by gravity method in the 0–60 and 60–100 soil layers with different planting densities in 2018, 2019, and 2020. (ac) show the soil water content in the 0–60 cm soil layer in 2018, 2019 and 2020, respectively. (df) show the soil water content in the 60–100 cm soil layer in 2018, 2019 and 2020, respectively. Different lowercase letters indicate significant differences within the same date at p < 0.05.
Sustainability 14 05848 g005aSustainability 14 05848 g005b
Figure 6. Volumetric soil water content in the 0–60 and 60–100 soil layers obtained by Insentek sensors with different planting densities in 2018, 2019, and 2020. (ac) show the soil water content in the 0–60 cm soil layer in 2018, 2019 and 2020, respectively. (df) show the soil water content in the 60–100 cm soil layer in 2018, 2019 and 2020, respectively.
Sustainability 14 05848 g006
Figure 7. Maize grain yield response to planting density in 2018, 2019, and 2020. The vertical bars represent the mean ± standard deviation. Different lowercase letters indicate significant differences at p < 0.05.
Sustainability 14 05848 g007
Table 1. Environmental variables at different growth stages. Ws, Ta, Rs, and RH are daily average wind speed, air temperature, solar radiation, and relative humidity, respectively. P is accumulated precipitation.
YearGrowth StageWs (m s−1)Ta (°C)RH (%)Rs (Wm−2)P (mm)
2018VE-V6 (20 June–6 July)1.7228.5073.43199.3344.5
V6-VT (7 July–5 August)1.4729.4385.28191.23139.7
VT-R3 (6 August–8 September)1.5927.3079.58189.1834.7
R3-R6 (9 September–3 October)1.2420.3876.07141.2390.3
Whole (20 June–3 October)1.5126.4078.59180.24309.2
2019VE-V6 (20 June–6 July)1.9328.4164.34198.4140.0
V6-VT (7 July–5 August)1.4928.6479.77193.9426.7
VT-R3 (6 August–8 September)1.0625.8181.94187.7844.7
R3-R6 (9 September–3 October)1.2221.5881.58124.5445.0
Whole (20 June–3 October)1.4326.1176.91176.17156.4
2020VE-V6 (14 June–1 July)1.6225.7574.01174.15107.5
V6-VT (2 July–1 August)1.1426.4479.81186.93155.5
VT-R3 (2 August–5 September)0.6626.3783.38175.92249.9
R3-R6 (6 September–30 September)0.8822.3973.78159.580.0
Whole (14 June–30 September)1.0825.2477.74174.15512.9
Table 2. Physical properties of experimental soil.
Soil Depth (cm)Percentage of Particle Content (%)Bulk Density
(g cm−3)
Wilting Point
(cm3 cm−3)
Field Capacity (cm3 cm−3)Saturated Water Content (cm3 cm−3)
(0–0.002 mm)(0.002–0.02 mm)(0.02–2 mm)
0–206.8350.6342.541.5315.0%33.80%41.23%
20–406.4339.5354.041.6114.8%33.26%41.25%
40–606.3138.455.291.5614.2%31.87%41.12%
60–806.2836.9056.821.5013.8%30.67%43.52%
80–1005.6638.9855.361.4614.2%29.45%45.02%
Table 3. Experimental design of maize planting density.
YearTreatmentsRow Spacing (cm)Within Row Spacing (cm)Planting Density (Plants ha−1)
2018D1702557,100
D2602566,700
D3502580,000
D44025100,000
2019 & 2020T1606027,800
T2604041,700
T3602566,700
T46015111,100
Table 4. ET (mm) at different growth stages in 2018, 2019, and 2020.
YearTreatmentVE-V6 StageV6-VT StageVT-R3 StageR3-R6 StageWhole Stage
2018D157.6 a115.3 a122.7 a69.8 a365.4 a
D265.0 a118.9 a109.2 a70.8 a363.9 a
D358.3 a130.0 a118.9 a69.9 a377.0 a
D462.8 a126.2 a120.1 a72.1 a381.1 a
2019T158.9 a119.6 a104.5 a58.9 a341.9 a
T258.5 a123.3 a119.9 ab56.5 a358.2 ab
T359.8 a132.0 a125.6 b47.9 a365.3 b
T460.7 a125.3 a132.2 bc57.7 a375.9 bc
2020T1---34.6 a-
T2---37.6 a-
T3---43.0 a-
T4---40.1 a-
ANVOA
(p-value)
Y---<0.001 **-
P---NS-
Y × P---0.017 *-
Y, years across 2019 and 2020; P, planting density; Y × P, interactions of Y and P. Different letters in the same column and the same year mean significant differences between treatments at 0.05 level; * significant at 0.05 probability level; ** significant at 0.01 probability level; NS means non-significant at 0.05 probability level.
Table 5. Grain yield, yield components, and WUE of maize in 2018, 2019, and 2020.
YearTreatmentPlanting Density (Plants ha−1)Grain Yield
(kg ha−1)
Spikes Weight Per Plant (g)1000-Grain
Weight (g)
Spikes Per PlantWUE
(kg m−3)
2018D157,1009874 a192 a367 a1.00 a2.70 a
D266,70010,560 a176 b382 b1.00 a2.90 a
D380,00010,815 a150 c387 b1.00 a2.87 a
D4100,00010,984 a122 d393 c1.00 a2.88 a
2019T127,8006390 a259 a405 a1.48 a1.87 a
T241,7008270 b225 b397 b1.25 b2.31 b
T366,70011,320 c188 c378 c1.13 b3.10 b
T4111,10012,486 c125 d359 d1.00 c3.32 c
2020T127,8007191 a298 a395 a1.46 a-
T241,7009425 b255 b383 b1.11 b-
T366,70011,965 c200 c368 c1.00 c-
T4111,10012,523 c126 d345 d1.00 c-
ANVOA
(p-value)
Y-0.042 *0.016 *0.037 *NS-
P-<0.001 **<0.001 **<0.001 **<0.001 **-
Y × P-NSNSNS0.041 *-
Y, years across 2019 and 2020; P, planting density; Y × P, interactions of Y and P. Different letters in the same column and the same year mean significant differences between treatments at 0.05 level. * significant at 0.05 probability level; ** significant at 0.01 probability level; NS means non-significant at 0.05 probability level.
Publisher’s Note: MDPI stays neutral with regard to jurisdictional claims in published maps and institutional affiliations.

