Article

Foliar Application of Macro- and Micronutrients Improves the Productivity, Economic Returns, and Resource-Use Efficiency of Soybean in a Semiarid Climate

1
Division of Agronomy, ICAR-Indian Agricultural Research Institute, New Delhi 110012, India
2
ICAR-Directorate of Groundnut Research, Regional Station, Anantapur 515001, Andhra Pradesh, India
3
Division of Genetics, ICAR-Indian Agricultural Research Institute, New Delhi 110012, India
4
ICAR-Central Potato Research Institute, Shimla 171001, India
5
Seed Production Unit, ICAR-Indian Agricultural Research Institute, New Delhi 110012, India
6
WTC, ICAR-Indian Agricultural Research Institute, New Delhi 110012, India
*
Author to whom correspondence should be addressed.
Sustainability 2022, 14(10), 5825; https://doi.org/10.3390/su14105825
Submission received: 4 April 2022 / Revised: 28 April 2022 / Accepted: 6 May 2022 / Published: 11 May 2022

Abstract

:
Inadequate nutrient management is one of the major challenges for sustainable soybean production in semi-arid climatic conditions. Hence, a 3-year (2015–2017) field experiment was conducted to assess the effect of foliar application of macro- and micronutrients on the growth, productivity, and profitability of soybean. Eight foliar nutrient sprays at the pod initiation stage—water spray (WS), 2% urea solution, 2% di-ammonium phosphate solution (DAP2%), 0.5% muriate of potash solution (MOP0.5%), 2% solution of 19:19:19 nitrogen phosphorus and potassium (NPK2%), and a 0.5% solution each of molybdenum (Mo0.5%), boron (B0.5%), chelated-zinc (Zn 0.5%) and no-foliar nutrition (NFN)—were compared with a basal-applied recommended dose of fertilizers (RDF: 30 kg N, 75 kg P, and 40 kg K ha1) in a randomized block design (RBD), replicated three times. Foliar-applied chelated [email protected]% (Zn0.5%) at the pod initiation stage resulted in more pods per plants. In addition to Zn0.5%, urea2%, NPK2%, and B0.5% significantly improved the pods per plant over treatment by no-foliar nutrition (NFN). The RDF-supplied soybean subsequently sprayed with Zn0.5% produced the highest seed yield, which was 18.5–37.8% higher than that of NFN treatment Yield improvement due to the application of B0.5%, DAP2%, and urea2% varied between 19.2–23.7, 16.6–20.4 and 18.6–20%, respectively. Foliar nutrition showed the largest net returns from Zn0.5%. The water-use efficiency (WUE) and production efficiency increased by 18.4–37.6 and 34.9–37.5%, respectively, due to Zn0.5% over the efficiencies from NFN treatment. Monetary efficiency (ME) gains due to Zn0.5% were 24% higher, while ME efficiency gains due to urea2%, NPK2%, and B0.5% varied between 15–16%. Thus, this study suggested that the foliar application of 0.5% Zn and B, urea, NPK fertilizer, and DAP at 2%, along with RDF. is a profitable nutrient management option for quality soybean production in a semiarid region. However, nutrient partitioning, changes in soil chemical and biological indicators, and environmental aspects need critical examination in future studies.

1. Introduction

Soybean (Glycine max L. Merr.) is one of the key industrial grain legume crops throughout the world. It is known for its high productivity, profitability, and diverse industrial uses [1,2]. Globally, soybean has a prime position in vegetable oils and in protein supply for humans and livestock [1,2]. This protein-rich and soil-fertility restoring seed-legume crop can be cultivated under diverse climatic conditions, and it can potentially contribute in addressing the nutritional security issue [3]. Soybean improves soil fertility, adding 50–300 kg of nitrogen (N) ha−1 to the soil by fixing atmospheric N through root-nodule inhabiting bacteria [2,4] and by returning 1–1.5 t ha−1 nutrient-rich leaf litter [5]. In addition to being a rich source of protein, soybean seed contains a good amount of micronutrients, such as Zn, Fe, and Mn [6], and essential amino acids; hence, soybean is regarded as a complete food in Indian diets.
A balanced supply of macro-and micronutrients to the soybean crop is essential for achieving higher productivity, quality, and profitability. Basal application of macro- and micronutrients have resulted in enhanced seed and oil yields in soybean [2]. However, antagonistic and synergistic effects were also observed among these nutrients in soil and plants [7,8,9]. Intensive cropping, excessive use of high analysis fertilizers without the addition of organic amendments, and secondary and micronutrients cause nutrient stress, which has resulted in poor economic returns and soil fatigue [10,11,12]. Furthermore, soybean growers generally ignore the uses of micronutrients and rely excessively upon high analysis fertilizers, especially N, P, and K [13,14]. Applications of sulfur (S), boron (B), and molybdenum (Mo) are also equally essential for sustainability in soybean production [15].
In addition to improving yield, applying microelement fertilizers increases a plant’s resistance to environmental stresses [2,16]. The availability of suboptimal nutrients retards enzymatic activities and metabolic functions in plant systems, which results in physiological stress [17]. Thus, positive responses to the application of deficient trace elements were observed in the growth and yield of field crops [18]. However, applications of macronutrients such as P, K, and S resulted in serious yield penalties in soybean. Poor growth and yield of soybean were observed in the absence of micronutrients, and their adequate supplies enhanced soybean productivity and quality [6].
Zn, iron (Fe), and manganese (Mn) are cations that need to be transported from the soil solution into the roots; these accumulated micronutrients are then partitioned among different plant parts [19]. Foliar application of nutrients can be a viable strategy in alleviating nutrient deficiency in plant systems by smart delivery at the point of assimilation. Foliar application of N and other plant nutrients has potential advantages over soil application for the fertilization of crops, in that it increases the efficiency of fertilizer use and allows quick relief of physiological stress [20,21] due to the rapid translocation into and from leaf to seed [22]. Soybean undergoes an N-related “self-destruction” mechanism, and nutrient removal from leaves enhances leaf senescence and hastens the termination of seed fill [23]. Thus, if foliar fertilization maintains leaf nutrition and delays the “self-destruction” mechanism, then photosynthesis could be enhanced and/or prolonged. Therefore, foliar application of essential nutrients will serve the need for nutrients when applied at suitable growth stages of crops. The plant growth stage and the availability and mobility of micronutrients determine their concentrations in different plant organs. Transferring these nutrients from the root through the stem, leaf, and pod walls into developing seeds is highly dependent on congenital soil and environmental conditions, as well as on nutrient content in different plant parts in the chain [10,24].
Apart from soil and plant conditions [25], the distribution of micronutrients into different plant parts is genotype-dependent [26]. Pod formation or pod initiation is one of the most nutrient sensitive stages; hence, adequate nutrients supplied through foliar application can potentially abate the yield penalty application [2]. In situations where soil is not able to support the proper nutrient demand of the crop during the early crop growth period, a suitable time to reclaim depleted NPK from the leaves is possible only during the seed-filling period or the pod formation stage [27]. Earlier research results indicated that foliar application during the seed-filling period is most effective in attaining the highest soybean yields, because nodules stop fixing N, root growth stops, and the uptake of some nutrients slows and stops [20]. The foliar spray of essential nutrients during the critical demand period maintained the nutrient balance in leaves, improved the photosynthesis rate, and ultimately increased biomass production [2,21]. Additionally, foliar-applied micronutrients have been shown to improve soybean yields in soils that are deficient in essential nutrients [28,29,30]. Although the amounts and proportions of various nutritional elements required for soybean are likely to differ, foliar fertilization during the pod development stage should be efficient. However, research on the comparative effects of urea (N), DAP (N and P), NPK (19:19:19), MOP (K) fertilizers, Mo, B, and Zn on soybean is limited. Additionally, in hidden hunger cases, soybean plants do not show any visible foliage symptoms, but yield reduction occurs. Hence, it was hypothesized that the foliar application of macro- and micronutrients can improve the growth, productivity, and resource-use efficiency of soybean in semiarid ecoregions. Thus, the present investigation was conducted to assess the effect of foliar-applied nutrients on the growth and productivity of soybean, and to evaluate the foliar application of macro- and micronutrients on profitability and resource-use efficiency of soybean in a semiarid region.

2. Material and Methods

2.1. Study Site and Weather Condition

A 3-year field investigation (rainy season of 2015, 2016, and 2017) was carried out at the Research Farm, ICAR-Indian Agricultural Research Institute, New Delhi, at 28°40′ N 77°12′ E. The experimental field enjoyed subtropical and semiarid-type climates with hot summers and cold winters. The soils were sandy loam in texture and low to medium in fertility (Table 1), classified as alluvial. Rainfall of 402.7, 136.3, and 66.8 mm was received during 2015, 2016, and 2017, respectively. Maximum temperatures of 36.1, 34.9, and 35.5 °C were recorded in September during 2015, 2016, and 2017, respectively. The entire crop season’s average maximum temperature, minimum temperature, sunshine hours, and pan evaporation were 33.1 °C, 21.2 °C, 5.5 and 4.8 mm day−1, respectively, in 2015; the corresponding values for these weather parameters for 2016 were 26.6 °C, 18.9 °C, 3.3, and 4.4, and for 2017 they were 32.3 °C, 20.6 °C, 5.3, and 3.9. The weekly weather conditions for the crop period of all three study years are depicted in Figure 1.

2.2. Experimental Design and Crop Management

The investigation was conducted with nine treatments comprising macro- and micronutrient foliar sprays at the pod initiation stage—water spray (WS), 2% solution of urea2%, 2% di-ammonium phosphate solution (DAP2%), 0.5% muriate of potash solution (MOP0.5%), 2% solution of 19:19:19 NPK (NPK2%), and a 0.5% solution each of Mo (Mo0.5%), B (B0.5%), chelated-Zn (Zn 0.5%), and no-foliar nutrition (NFN)—in addition to a uniformly soil-applied recommended dose of fertilizers (RDF: 30 kg N, 75 kg P and 40 kg K ha1) in all plots. Ammonium molybdate and borax were used as sources of MO and B in all three years. All the treatments were imposed on thrice-replicated randomized block designs in the same field in all years. The plot size was 3.6 m × 6 m. Medium-duration soybean (PS 1347) was planted from the last week of July to the first week of August after the onset of monsoon rains, with a seed rate of 70 kg ha−1 at plant-to-plant and line-to-line spacing of 45 cm and 10 cm, respectively. Before sowing, the seeds were first treated with Imidacloprid (0.01% solution) and then with thiram+ bavistin (2.5 g + 1 g kg−1 seed). The RDF was applied basally. To reduce the weed problem, pendimethalin (pre-emergence herbicide) at a rate 0.75 kg ha−1 was applied, followed by one hand weeding at 40 days after sowing (DAS). However, during 2017, a post-emergence application of imazethapyr at 75 g ha−1 was performed at 25 DAS. The crop was irrigated five, two, and three times during 2015, 2016, and 2017, respectively. Imidacloprid at 1 mL l−1 water was applied to check whitefly infestation. Similarly, monochrotophos (1 mL l−1 water) were applied to control other insect infestations. During all three years, the crop was harvested during first fortnight of November.

2.3. Data Collection

2.3.1. Growth Contributing Parameters

Five plants from sampling rows, second from the border on both sides of the plot, were randomly chosen and cut with a sharp-edged knife from ground level to determine plant growth indicators. The heights of all plants were measured from the base of the stem to the tip of the longest branch of the plant, using a meter scale, and averaged out. All leaves from sampled plants were removed, and their leaf area was measured using a leaf area meter (Model LI-COR-3100). The total leaf area of the five plants was divided by the total ground area occupied to obtain the leaf area index (LAI). All leaves and shoots were dried in an oven at 70 °C until their weight became constant, to determine dry matter accumulation (DMA). All primary and secondary branches from five randomly selected plants were counted and averaged to determine the number of branches plant−1 at crop maturity.

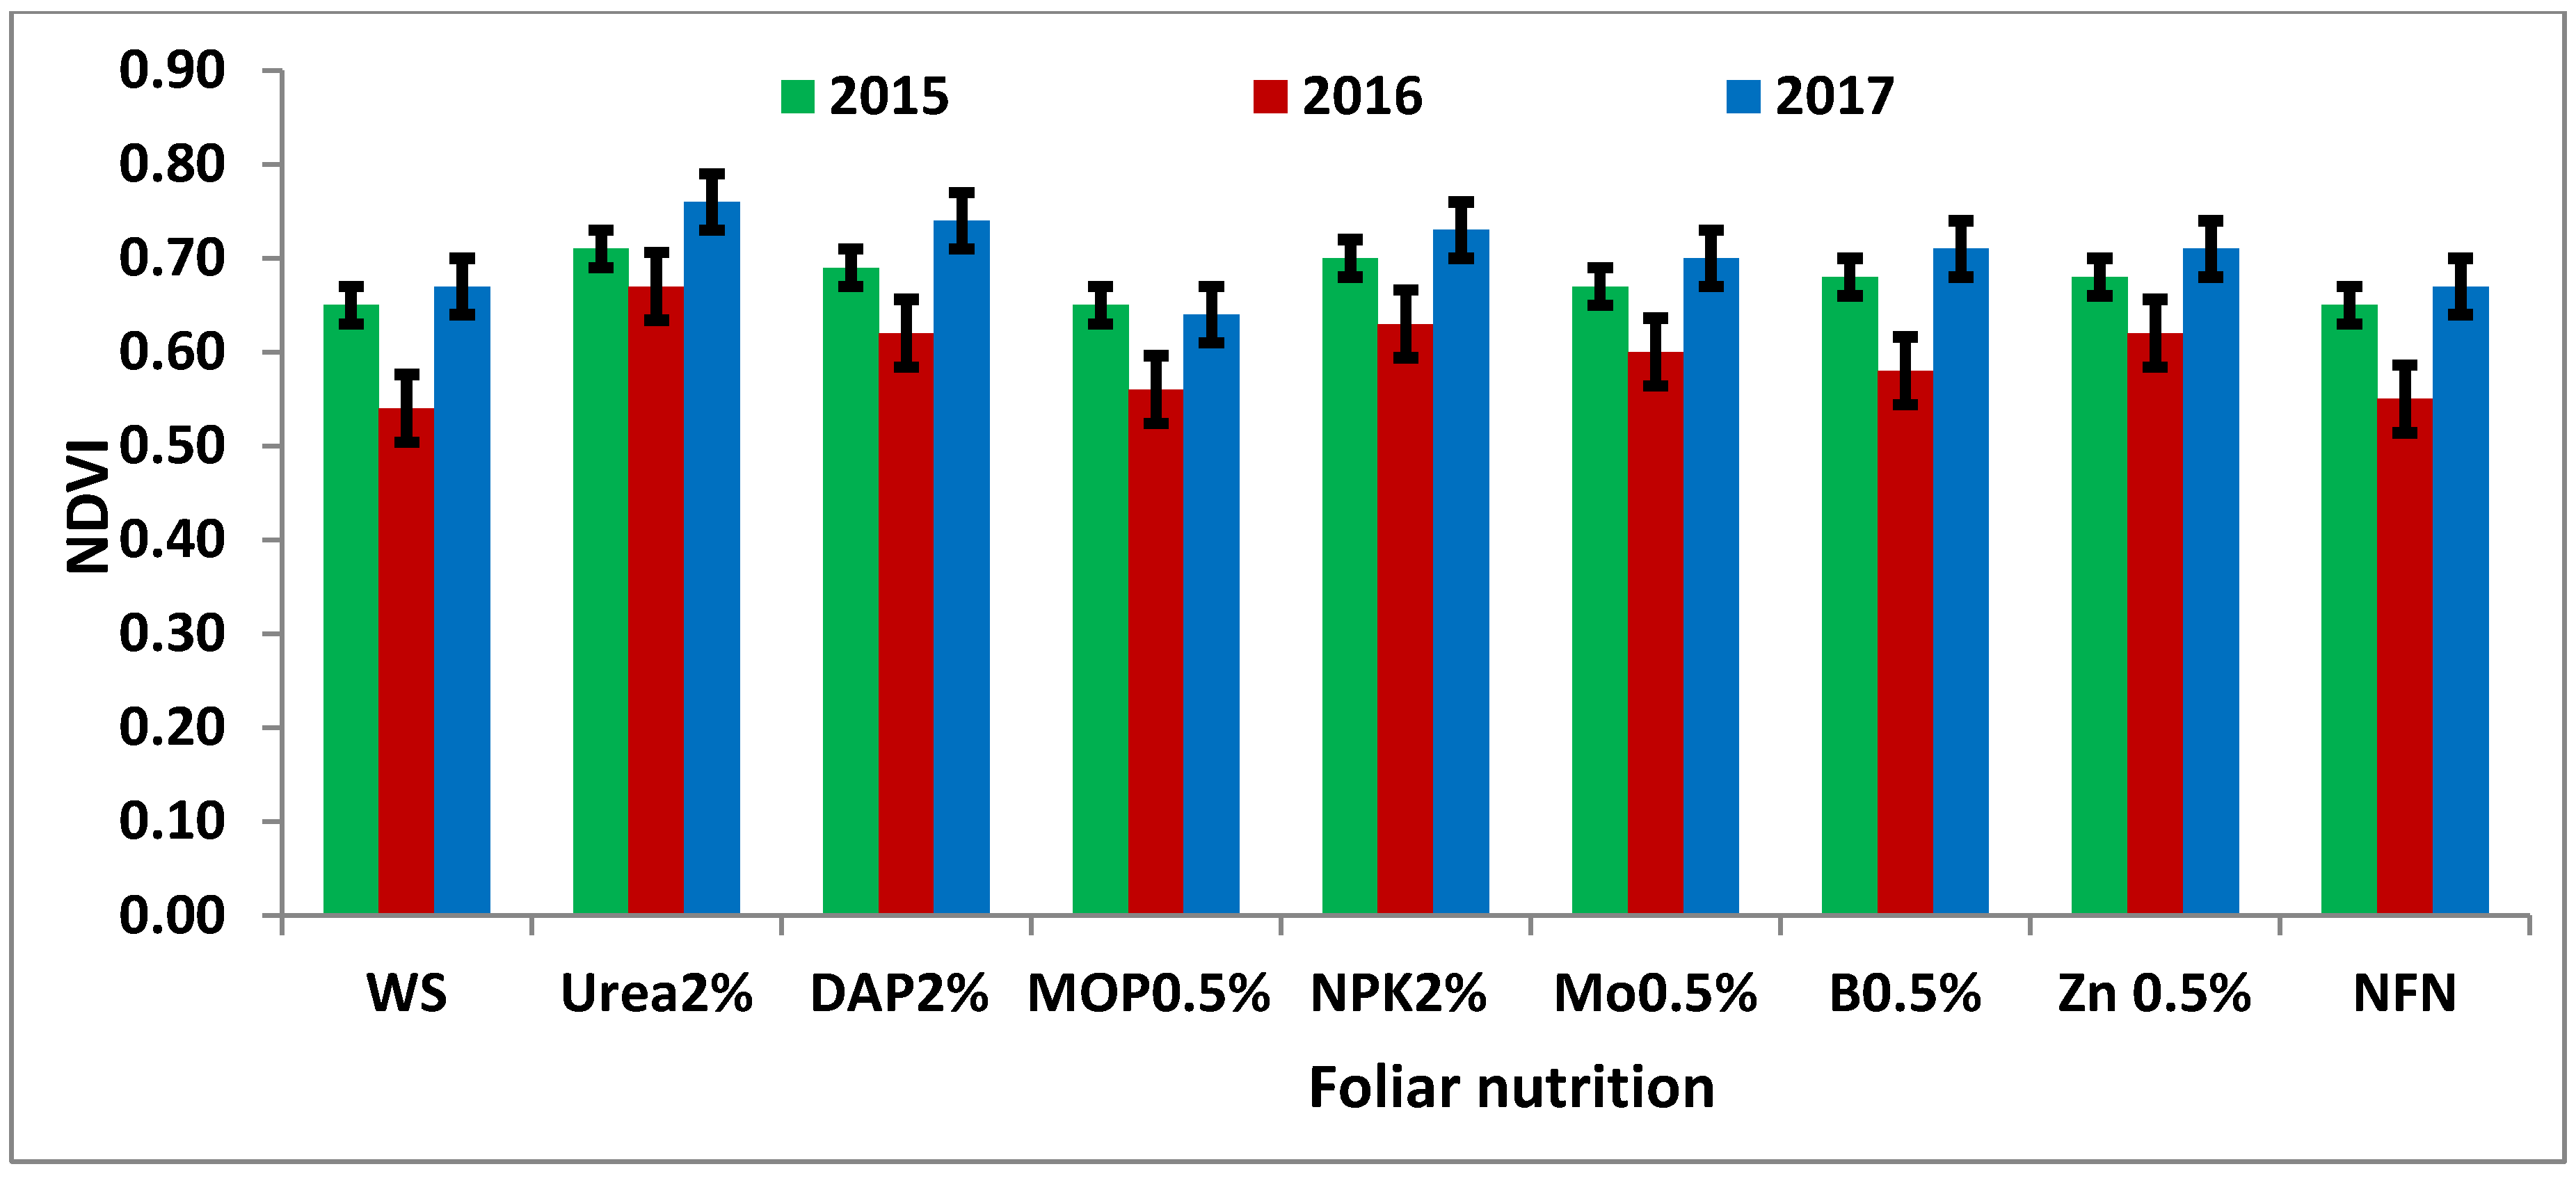
2.3.2. Photosynthetically Active Radiation (PAR), Normalized Difference Vegetation Index (NDVI), and Chlorophyll Content

A Ceptometer (LP–80 Accu PAR) was used to measure the incident PAR at the top of the plant canopy and the PAR penetrating through the canopy to the bottom (5 cm above the ground) of plants; net intercepted PAR was computed as incident PAR or penetrated PAR. For each experimental plot, five readings were taken and averaged [3,31]. NDVI was measured using a hand-held Green SeekerTM (Optical Sensor), positioned and run with a triggering button pressed 60–65 cm above the crop canopy, and the average values were recorded. Leaf chlorophyll content was determined in terms of soil-plant analysis development (SPAD) values using a chlorophyll meter or a SPAD meter [3,27].

2.3.3. Crop Growth Rate and Relative Growth Rate

The crop growth rate (CGR) and the relative growth rate (RGR) were determined for the periods 45–60 DAS and 60–75 DAS, by taking into account the dry matter production, m−2, at 45, 60, and 75 DAS. The following equations were used to estimate these two parameters:
CGR   ( g   m 2   days 1 = 1 P × ( W 2 W 1 ) ( T 2 T 1 )
where P is the ground area, W1 and W2 are the oven-dry weights of plants m−2 recorded at time T1 and time T2, respectively, and T1 and T2 are the time intervals.
RGR   ( g   g 1   day 1 ) = ( L o g L n   W 2 L o g L n   W 1 ) ( T 2 T 1 )
where Log Ln is the natural log, W1 and W2 are the oven-dry weights of plants m−2 recorded at time T1 and time T2, respectively, and T1 and T2 are the time intervals.

2.3.4. Yield Contribution Parameters

For the determination of yield contribution parameters, five plants were randomly selected from the sampling rows in each plot. All the pods from the selected plants were manually plucked and counted, averaged, and expressed as pods per plant. Regarding the number of seeds per pod, at harvest, ten pods were randomly selected and unbolted, and the obtained seeds were counted, averaged, and expressed as seeds per pod. Similarly, for the estimation of the seed index, 100 seeds from each plot were counted and sun- and oven-dried (70 °C) for 48 and 2 h, respectively; thereafter, the weight was recorded by electronic balance and expressed in g.

2.3.5. Seed and Stover Yields and Harvest Index

For the determination of grain and stover yield, all plants were harvested at the ground with the help of a manually operated iron sickle after leaving the border rows in each plot. The harvested crop was sun-dried for 7 days to make the plant biomass brittle and to reach the condition so that the pods and grains were easily threshed. Plot-wise total biomass produce was weighed and threshed by a mechanical thresher. Recovered grains were cleaned manually, dried in the sun for 4 days, and weighed. The grain yield was then subtracted from the total biomass produce (biological yield) to obtain the stover yield. All yields were presented at 14% moisture content. Thereafter, harvest index was estimated with the following expression.
Harvest   index   ( % ) =   Seed   yield   ( kg   ha 1 ) Biological   yield   ( kg   ha 1 )

2.3.6. Resource-Use Efficiencies

Water-use efficiency (WUE) was determined by taking into account seed yield water use (irrigation + effective rainfall), using the following equation.
WUE   ( kg   hamm 1 ) =   Total   seed   yield   ( kg   ha 1 ) Wateruse   ( mm )
Production efficiency (PE) is the per day production capacity of a particular treatment. PE was expressed in kg ha−1 day−1 and computed using the following equation:
PE   =   Total   seed   yield   ( kg   ha 1 ) Crop   duration   ( Days )
Similarly, monetary efficiency (ME) is the per-day economic return capacity of each treatment. It is expressed as USD ha−1 day−1 and computed by using the following equation:
ME   =   Total   net   returns   ( USD   ha 1 ) Cropping   period   ( Days )

2.4. Statistical Analyses

Year-wise data on all observations were subjected to the “Analysis of Variance” technique for a randomized block design (RBD) using the standard procedure. The significance of differences among different treatments was tested using the F-test. The least significant difference (LSD) values were computed for the parameters that exhibited significant differences. The treatment means were compared at a 5% level of significance.

3. Results

3.1. Plant Height, Branches per Plant, Leaf Area Index, and Dry Matter Accumulation

Foliar application of macro- and micronutrients significantly influenced all of the studied parameters of soybean growth, such as plant height, dry matter accumulation (DMA), and leaf area index (LAI). However, the production of branches did not depict any significant effect (Table 2). In all three study years, the plants were significantly taller under foliar nutrition of urea2%, DAP2%, and NPK2% than under the foliar nutrition of NFN and MOP0.5%. The foliar application of other nutrients did not increase plant height significantly. The use of urea2%, DAP2%, NPK2%, and Zn0.5% improved branching in soybean when compared with NFN and WS, but the differences stood well below a significant magnitude. The DMA followed the general trend with respect to plant height. The LAI of the crop treated with foliar-applied urea2%, DAP2%, NPK2%, and Zn0.5% was significantly greater than that of the NFN- and MOP0.5%-treated plots. Foliar application of B and Mo at 0.5% concentration also improved the DMA and the LAI, compared to applications with NFN and MOP0.5% (Table 2).

3.2. Photosynthetically Active Radiation (PAR), Normalized Difference Vegetation Index (NDVI), and Chlorophyll Content

Foliar spray of MOP0.5% caused a small reduction in leaf chlorophyll content measured in terms of SPAD values. However, the N-containing fertilizers urea2%, DAP2%, and NPK2% significantly increased the leaf chlorophyll contents, compared to NFN and water spray (WS). The increases in SPAD values due to the application of B, Mo, and Zn were non-significant. The general range for leaf SPAD values was 35.6 at MOP0.5% to 42.6 in the urea2% treated crop. The values of NDVI, which are indicators of N content in the crop canopy and the overall vigor of the crop, were significantly greater for plots treated with the N-containing fertilizers urea2%, DAP2%, and NPK2%, compared with plots treated with WS, NFN, and MOP0.5%; the NDVI and SPAD values were the lowest in the MOP0.5% treated crop (Figure 2). Like NDVI, N-containing fertilizers significantly increased net PAR interception over MOP0.5% and WS. On average, urea2%, DAP2%, NPK2%, B0.5%, Mo0.5%, and Zn0.5% enhanced net PAR interception by 17, 13, 14, 7, 8, and 10% over NFN (Figure 3). The amount of PAR reaching the bottom of the plant canopy followed the trend that was opposite to the net PAR intercepted. The crop canopies under foliar application of N-containing fertilizers permitted a lower penetration of PAR through the canopy as more of it was intercepted. However, the canopy of the crop either did not receive foliar nutrition (NFN, WS) or received a foliar application of B0.5%, Mo0.5%, and Zn0.05%, allowing higher amounts of PAR to reach the bottom of crop plants (Figure 4).

3.3. Crop Growth Rate and Relative Growth Rate

The crop growth rate (CGR) and relative growth rate (RGR) determine the exponential growth of any crop. Foliar application of macro- and micronutrients exerted a significant influence on both the CGR and the RGR, although only for the period 60–75 DAS. In all three study years, urea2% and Zn0.05% resulted in a significant enhancement in CGR and RGR when compared with NFN during the period 60–75 DAS. Moreover, DAP2%, NPK2%, and B0.5% also caused significant improvement in the CGR in at least one study year. In all three years, MOP0.5% recorded the lowest CGR (Table 3).

3.4. Yield Attribute-Pods/Plant, Seeds/Pod, and Seed Index

Foliar nutrition treatments Zn0.5%, B0.5%, and urea2%, applied at the pod initiation stage, were more consistent in a significantly increased number of pods/plant when compared with NFN treatments; the increase due to NPK2%, compared with NFN, was significant only in 2017. Although Mo0.5%, DAP2%, and MOP0.5% also enhanced pod formation, their effect was non-significant. The average increase in pods per plant followed the order Zn0.5% > urea2% > B0.5% = NPK2% > DAP2% > MOP0.5% > Mo0.5%. Pod bearing was 1.3 times greater during 2015 and 2017 than in 2016. A similar trend was observed for the seed index; Zn0.5%, B0.5%, NPK2%, urea2%, and DAP2% resulted in higher seed indices than those of MOP0.5% and NFN.

3.5. Yield

Soybean treated with Zn0.5%, B0.5%, NPK2%, and urea2% produced significantly higher grain yields than soybean treated with the control (NFN), with increases of 18–37, 16–23, and 14–23%, respectively. Increments in grain yield due to the application of DAP2% (7–17%), MOP0.5% (4–10%), and Mo0.5% (1–7%), compared to increments due to the application of NFN, were not significant in any of the three years (Table 4). Thus, the largest increase in yield was obtained with Zn0.5%, and the increase was significant overall for other foliar nutrition treatments, bearing B0.5% in 2015. In the other two study years (2016 and 2017), the increase in yield due to Zn0.5% was significant when compared to the increases due to DAP2%, MOP0.5%, Mo0.5%, and WS. Unlike grain yield, straw yield did not differ due to foliar nutrition in any of the study years. Grain yield was more than 50% higher and straw yields were approximately 15% higher in 2015 and 2017 than in 2016. The harvest indices (HI) were the same among all treatments in 2016 and 2017. However, in 2015, Zn0.5% (0.36) and B0.5% (0.35) resulted in significantly higher HI, compared with NFN, WS, urea2%, and MOP0.5%.

3.6. Economic Budgeting

The use of Mo0.5% resulted in the highest cost of cultivation (USD 672.2 ha−1), followed by B0.5%, (USD 544.3/ha), but yield enhancements due to these treatments were small. Thus, the net returns and benefit-cost (B:C) ratio were lower in these two treatments than in the other foliar nutrition treatments (Table 5). Net returns from crops sprayed with chelated Zn0.5%, NPK2%, urea2% and DAP2% were greater by 21–58%, 15–17%, 8–30%, and 25–63%, respectively, over NFN. Mo0.5% recorded 223–396% lower net returns than Zn0.5% applied plots. Even NFN-applied crops yielded 46 and 104% greater net returns than Mo0.5% in 2015 and 2017, respectively. The net returns from the Mo0.5% applied plots were only USD 0.9 ha−1 in the low-yield year (2016). The highest B:C ratio was recorded with the use of urea 2% during 2016 and 2017, followed by chelated Zn0.5%. However, in 2015, Zn0.5% recorded the highest B:C ratio, which was significantly higher than NFN, WS, MOP0.5%, Mo0.5%, and B0.5%. Foliar nutrition of urea2%, NPK2%, B0.5% and Zn0.5% resulted in the ME of 9.76, 9.71, 9.72, and USD 9.93 ha−1day−1 were significantly higher than NFN and WS in 2017. Moreover, the use of Zn0.5% was more advantageous than the use of MOP0.5% and Mo0.5%. In 2016, Zn0.5%, urea2%, and NPK2% improved ME significantly over NFN, and in 2015, Zn0.5% and B0.5% were significantly better than NFN and WS. The three-year average increase in ME with urea2%, NPK2%, B0.5% and Zn0.5% was 16, 15, 16, and 24% over NFN and 14, 13, 14, and 22% over WS.

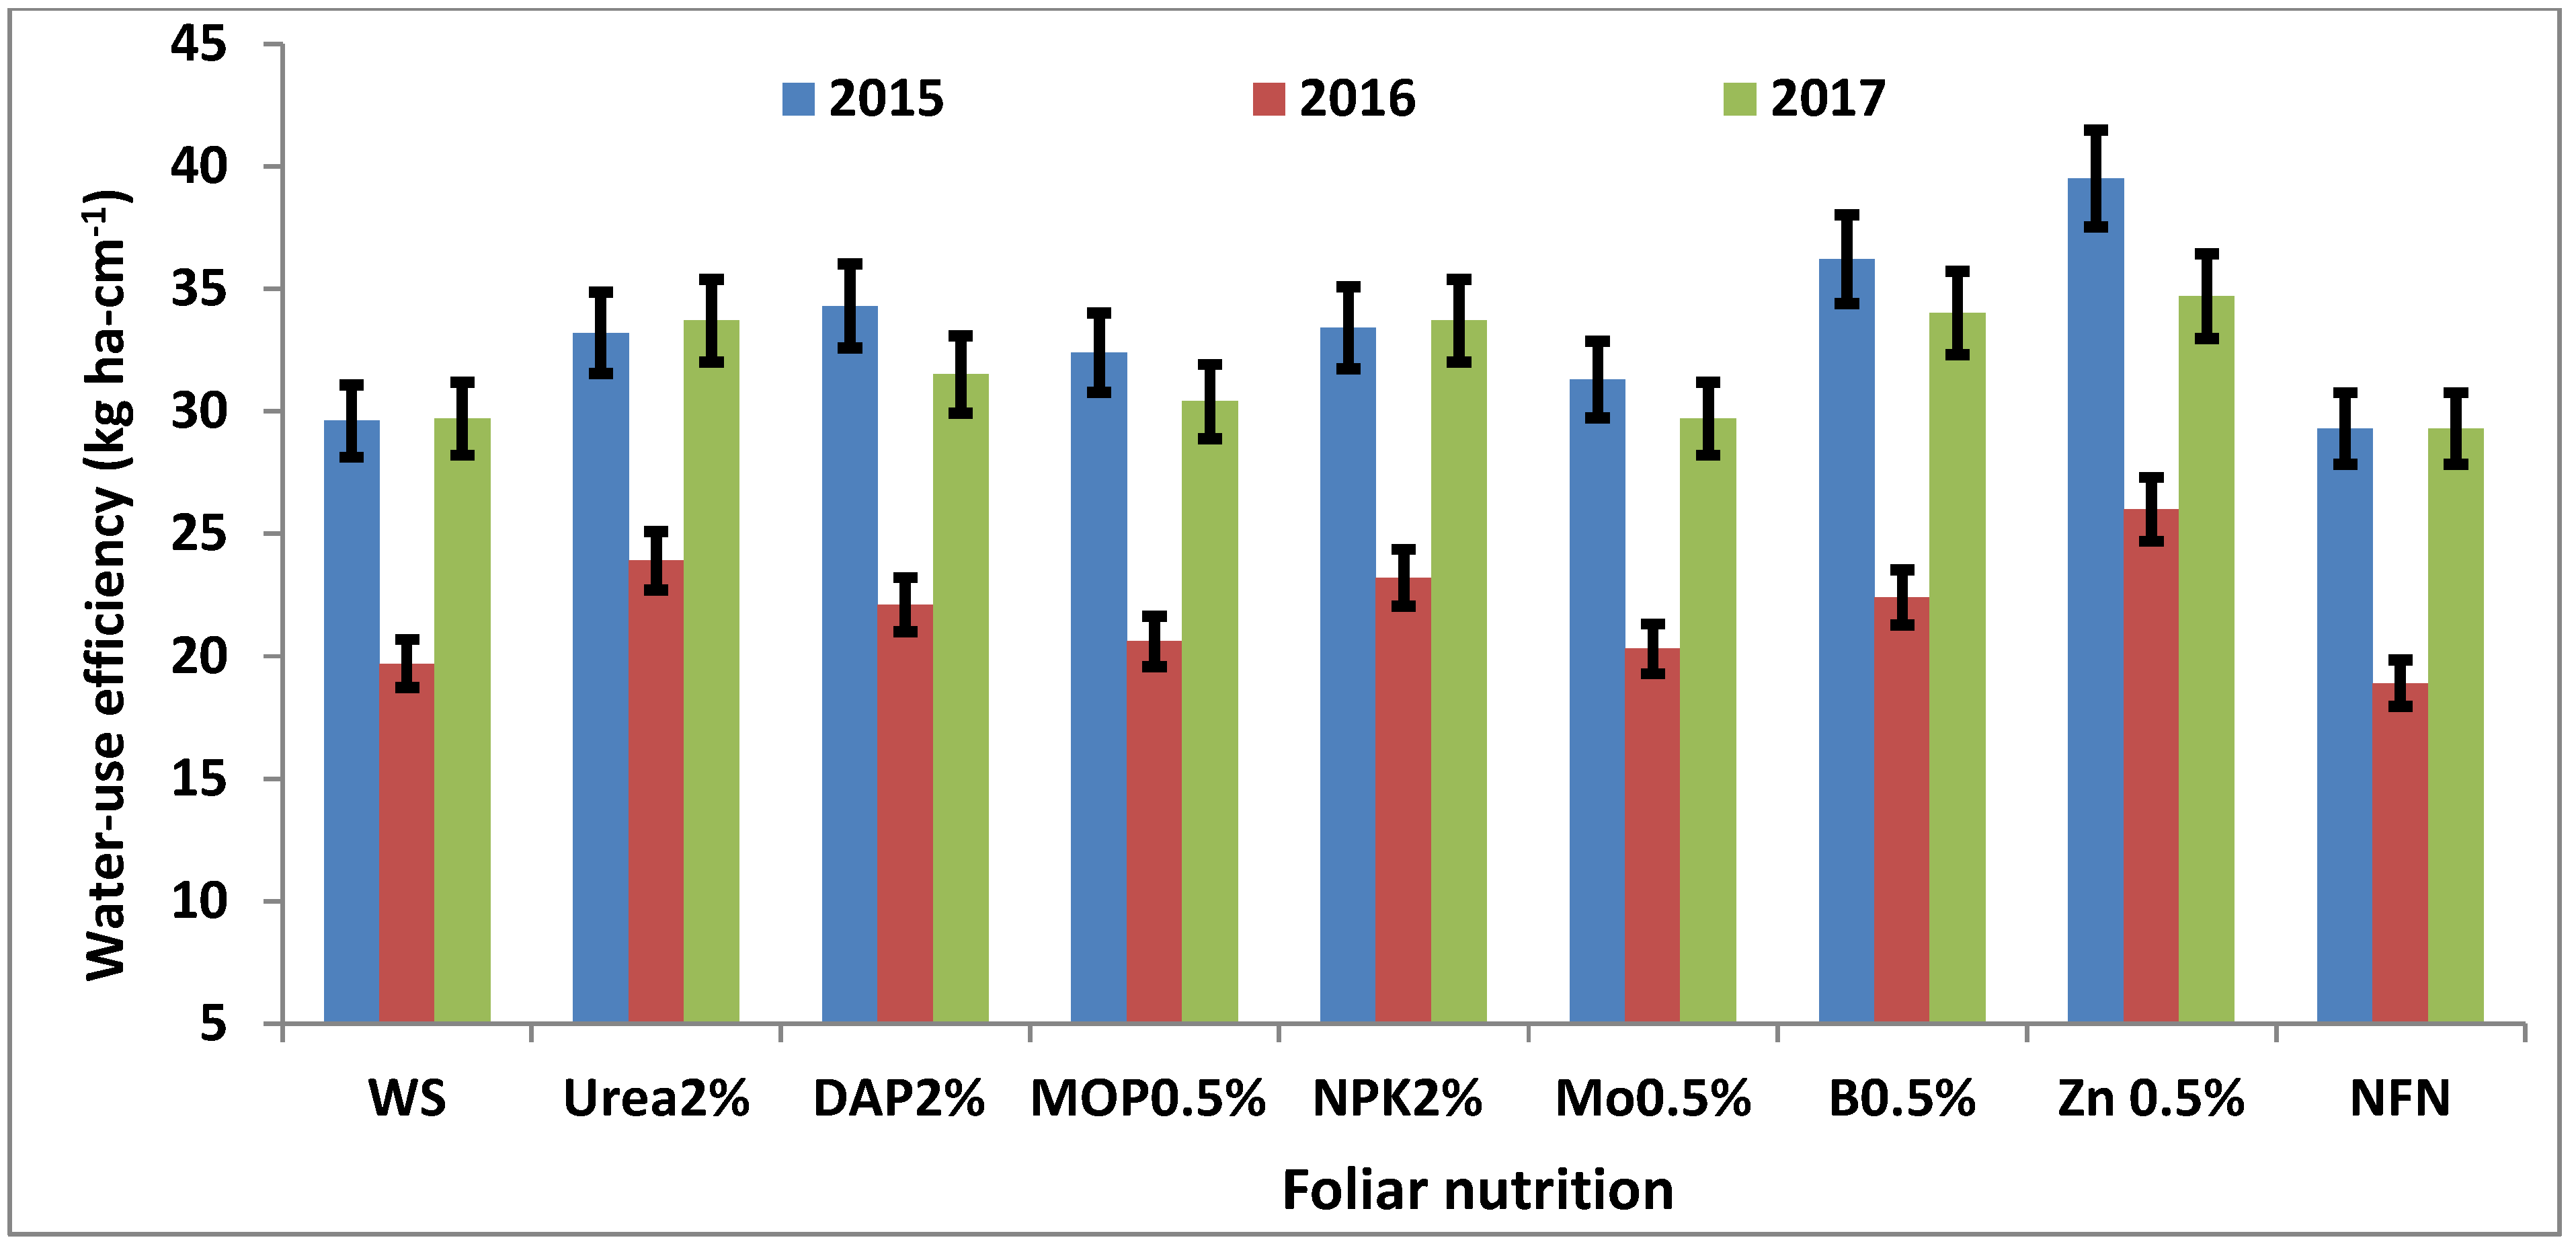
3.7. Water-Use Efficiency and Production Efficiency

Applying Zn0.5% resulted in larger WUE (39.5, 26.0, and 34.7 kg hacm−1) than that resulting from other foliar-applied nutrients; however, the results of this treatment were similar to those of B0.5%, DAP2%, and urea2% in 2015, 2016, and 2017, respectively (Figure 5). The increase in WUE was due to Zn0.5%, and the application was 18–38% over the increase due to NFN treatment. The three-year average increase in WUE due to Zn0.5% was 29.5% over the increase due to NFN treatment. Likewise, a 16.8–28.1% increase in WUE resulted from the use of Mo0.5%, compared with NFN. PE significantly improved with foliar nutrition of various macro- and micronutrients during 2015 and 2016. On average, the crop treated with Zn0.5%, B0.5%, NPK2%, DAP2%, and urea2% recorded an average of 30, 20, 17, 14, and 18% higher PE over crop treated with NFN (Figure 6).

4. Discussion

Soybean is a relatively long duration crop compared to most rainy season crops; its duration is especially long (110–140 days) under north Indian plain conditions. The crop has fairly high nutrient requirements—for each t of grain produced, soybean crop removes 146 kg N, 25 kg P2O5, 53 kg K2O, 5 kg S, 476 g Fe, 104 g Zn, 123 g Mn, 41 g Cu, 55 g B, and 13 g Mo ha−1 from the soil [32]. Most often, nutrients are supplied to soybean through soil applications only, which undergo several chemical reactions in the soil before the plants can absorb them, reducing their recovery efficiency and use efficiency due to fixation in the soil colloids and leaching, erosion, or volatilization losses [31,33]. Ultimately, their availability to plants declines as the crop progresses toward its reproductive stage. Moreover, there is a sharp decrease in the root activity of soybean during seed development, and nutrients translocate from leaves and pods to grain; thus, nutrients are inadequate in leaves for various metabolic activities. The nutrient-starved leaves turn yellow, with ultimately poor photosynthesis and grain yield [34] However, as seeds fill, these seeds become the dominant sink for carbohydrates being produced in the leaves [35]. When crop growth proceeds, the soluble carbohydrate content of the stems and roots decreases [36], nodules stop fixing N, root growth stops, and the uptake of some nutrients slows and stops. Nutrient deficiencies in soybean occur at the flowering or pod development stages, when the plant’s requirement is highest [36,37]. Thus, as expected, applying a small amount of macronutrient fertilizers, such as urea2%, DAP2%, and NPK2%, and micronutrients, Zn0.5%, B0.5%, and Mo0.5%, through foliar sprays directly on foliage during the pod initiation stage, in addition to a low dose of soil-applied fertilizers during sowing, significantly improved most of the growth parameters, yield attributes, yield, and resource-use efficiency of the soybean crop when compared with NFN treatment (no foliar nutrition).
The time of sowing is a nonmonetary input and an important yield and quality determinant in crop production. In the current study, the grain yield of soybean was reduced by approximately 50% during 2016, compared to the yields of the 2015 and 2017 study-years. This occurred because of late planting (2 August) of soybean, when weather conditions became favorable after continuous rains following the onset of monsoon, resulting in a drastic reduction in grain yield (Table 4). During 2015 and 2017, soybean was planted with the early onset of monsoon during the middle of July, which was beneficial in attaining higher growth and yield of soybean in comparison to 2016. The number of daily sunshine hours averaged over the entire crop period was more than 5 in 2015 and 2017, but in 2016, it was just above 3, which also partly explains the reason for the low crop harvest in 2016. Additionally, air temperatures, especially the weekly mean minimum temperatures, were much lower during the grain-filling period (7.3–13.9 °C) in 2016 than during the same crop stage in 2015 (13.9–18.5 °C) and 2017 (12.7–13.9 °C), which might have negatively impacted photosynthesis as well as the translocation of photosynthates from source to sink, and finally hampered grain filling and yield formation in 2016 [3,31,38].
All of the studied growth parameters—plant height, branching, LAI, and dry matter production—were significantly improved by urea2%, DAP2%, NPK2%, and Zn0.5%, although the effect of Zn0.5% on plant height was not significant in all three years. Foliar application of B and Mo at 0.5% concentration also improved dry matter production and LAI, compared to applications of NFN and MOP0.5%, but the differences were not significant in any of the study years. The improvement in growth parameters due to foliar application of N-containing fertilizers, urea2%, DAP2%, and NPK2%, could be ascribed to the fact that foliar-applied fertilizers during calm conditions (morning hours) can directly enter plant leaves, and the nutrients present in them (N, NP, and NPK, respectively) could have enhanced the process of photosynthesis and regulated other metabolic processes in the plant, resulting in higher plant growth [38,39]. Zn is a constituent of several enzymes and proteins and is involved in a wide range of processes, including a role in photosynthesis, growth hormone production, and stem elongation; thus, its foliar application at a time when the plant requirement is high (flowering or pod initiation) is expected to improve the growth of the soybean crop [39,40]. Boron plays an important role in cell division, especially in the shoot apex and young leaves, and Mo is a constituent of important enzymes such as nitrate reductase and xanthine dehydrogenase [41] and is also involved in growth hormone synthesis—for example, abscisic acid [39,42]. Hence, an increase in DMA and LAI due to foliar feeding in the current study was reflected in higher yields. Unlike the above fertilizers or nutrients, MOP0.5% exhibited a negative influence on all studies of the growth characteristics of soybean, as its application induced scorching of leaves, destruction of chlorophyll, and, finally, lowering of photosynthesis [38].
As N is an important constituent of chlorophyll, all N-containing fertilizers, urea2%, DAP2%, and NPK2% significantly increased the leaf chlorophyll contents, compared to the increases with NFN and WS treatments. The SPAD values were lowest for the MOP0.5%- treated crop, as it caused scorching of leaves, likely due to the presence of chloride in MOP. Reduction in the chlorophyll content in soybean due to foliar application of MOP was also reported in some studies [43]. Higher leaf chlorophyll contents for crops sprayed with N-containing fertilizers resulted in higher photosynthetic rates and plant growth, which intercepted higher amounts of PAR. The higher interception of PAR led to greater photosynthesis, further improving plant growth parameters. On average, urea2%, DAP2%, NPK2%, B0.5%, Mo0.5%, and Zn0.5% enhanced net PAR interception by 17, 13, 14, 7, 8, and 10% over that from NFN treatment, although the effect was larger and significant for urea2%, DAP2%, and NPK2% only. However, the role of B0.5%, Mo0.5%, and Zn0.5%, apart from N-containing fertilizers, in promoting the growth and vigor of soybean plants was also sizable. NDVI measured with optical sensors is the most widely used parameter in assessing crop health, vigor, and greenness. The NDVI values were higher in urea2%-, DAP2%-, and NPK2%-treated crops than in the NFN- and WS-treated plots. Micronutrient applications did not show a significant increase in NDVI values, unlike the increase due to major nutrients such as N.
The crop growth rate (CGR) and the relative growth rate (RGR) reveal the extent of exponential growth of any crop, and both were altered by foliar application of macro- and micronutrients, although only for the period 60–75 DAS. Urea2%, Zn0.5%, DAP2%, NPK2%, and B0.5%, by virtue of their role in DMA through continued photosynthesis, led to significant improvement in CGR and RGR. In all three study years, MOP0.5% recorded the lowest CGR, as it hampered plant growth negatively by burning sprayed plant leaves, and thus reduced the photosynthetically active area. Among the study years, 2016 recorded the lowest CGR and RGR for both the 45–60 and 60–75 DAS periods, due to unfavorable climatic conditions (a higher temperature during flowering and low temperatures during grain filling) causing late sowing of the crop.
Since the RDF was applied basally to all plots, and subsequently foliar nutrition treatments were imposed at the pod initiation stage, the foliar-applied nutrients could have resulted in more absorption of nutrients by the leaves, and their effect was reflected more in the final yield of the crop than in growth characteristics. The increments in yield consequent to foliar applications of Zn0.5% and B0.5% during the pod formation stage resulted primarily from an increase in the number of pods/plants, seeds/pods, and seed indices. Earlier studies have also shown that micronutrients, particularly Zn, Fe, and Mn, applied by foliar spraying increased soybean yield [44,45]. This showed that foliar application of Zn to plants at the pod initiation stage minimized the Zn deficiency effect in soybean to a greater extent and led to the highest seed yields. In soybeans, foliar application of B in the early reproductive stage has been shown to increase stem branching, the number of pods, and the seed yield of soybean [1,2,46]. Concurrently, this increased seed yield of soybean with Zn and B application might be due to increased Zn and Bo contents in grain and stover, and their uptake by the soybean crop. The potential yield of soybean is influenced by filled seeds obtainable from a foliar fertilizer application, but that is normally not filled before foliar application [2]. Zn is a growth-promoting substance that controls the development of the shoot and plays an important role in electron transport, photophosphorylation, photosynthetic enzymes, and biomass production [9]. Furthermore, zinc may be required for chlorophyll production, pollen function, and fertilization [47,48].
Interestingly, spray applications that contained only N, or N, P, and K, such as urea, DAP, and 19:19:19 NPK, also resulted in small increases in yield that stood much below the yield enhancement occurring due to Zn application. These results suggest that beyond an optimal requirement, NPK foliar application does not improve reproductive yield as micronutrients do. Ross et al. [40] reported that additional N on leaves could not be utilized, due to hormonal changes or functional loss of anabolic enzymes. In contrast, foliar fertilization of plants with urea can lead to decreased yield due to leaf burn (leaf tip necrosis), which is often observed after foliar fertilization with urea [49]. This leaf burn increases with leaf urease activity, and is due to the ammonia produced from urea by this activity. However, such negative impacts of N-containing fertilizers were not noticed in the current study; it is likely that the experimental field soil was generally light in texture and low in fertility; instead, there was a gain in grain yield. Additional application of 20 kg N per ha at 60 days after sowing increased the seed yield by 11%, compared with RDF applied at the time of planting [50].
Mo and B are costly chemicals, and their foliar nutrition (Mo0.5% and B0.5%) escalated soybean cultivation costs by 54.6 and 26.7%, respectively, over NFN. However, the corresponding improvement in yield was disproportionately low. Thus, net returns and the B:C ratio were lower in these two treatments than they were in the other foliar nutrition treatments. Net returns from crops sprayed with chelated Zn0.5%, NPK2%, urea2%, and DAP2% were higher by margins of 21–58%, 15–17%, 8–30%, and 25–63%, respectively, over NFN treatment. Mo0.5% recorded 223–396% lower net returns than Zn0.5%-applied plots. Even NFN-applied crops, despite producing lower grain yields, resulted in 46 and 104% greater net returns over Mo0.5% in 2015 and 2017, respectively, due to the lower cost of cultivation in NFN, suggesting that the use of Mo and B was not economical in this study. Spraying water incurred an additional cost of approximately USD 12 ha−1 and marginally increased seed yield; thus, net returns from this treatment were the same as those in NFN treatment. Spraying water only did not carry any advantage. The higher ME in the Zn0.5%, B0.5%, urea2%, and NPK2% plots is attributed to higher grain yield and gross returns from these treatments [51,52].
Foliar nutrition to soybean significantly influenced the WUE and PE of soybean during 2015–2017. The variations in WUE among foliar nutrition treatments were mainly governed by variations in seed yields, as water applied through irrigation or rainfall was equal for all treatments. Zn application also increases the water use efficiency of chickpea [52]. Like WUE, PE, which depicts grain production per ha per day, largely followed the trend of grain yield. The use of Zn0.5%, B0.5%, NPK2%, DAP2%, and urea2% increased PE by 29.7, 19.9, 17, 14, and 17.6%, respectively, over NFN treatment. Across the foliar nutrition treatments, net returns, monetary efficiency, PE, and WUE were lowest during 2016 compared to the other two study years, due to drastically lower grain and straw yields that resulted from late planting and thus reduced crop duration in 2016.

5. Conclusions

The results proved the hypothesis that foliar application of macro- and micronutrients, along with a recommended dose of fertilizers, improves the growth, seed yield, and resource-use efficiency of soybean by averting nutrient stress during peak nutrient demands (flowering and pod initiation stages) in a semi-arid region. These findings support the following conclusions
  • Soybean treated with Zn0.5%, B0.5%, NPK2%, and urea2% recorded 18–37, 16–23, and 14–23% higher grain yields over control treatment (NFN).
  • Net returns from crops sprayed with chelated Zn0.5%, NPK2%, urea2%, and DAP2% were greater by 21–58%, 15–17%, 8–30%, and 25–63%, respectively over those from NFN treatment.
  • Foliar application of Zn0.5% increases WUE by 29.5% over NFN treatment. Similarly, a spray of Mo0.5% enhanced WUE by 16.8–28.1% over NFN treatment.
  • Foliar nutrition of Zn at 0.5% spray, followed by 2% urea, 2% NPK (19:19:19 fertilizer), and 2% DAP resulted in significantly higher yield (1563–2372 kgha−1), net returns (USD 596.8–720.4 ha−1), ME (USD 9.05–9.93 ha−1day−1), and PE (14.3–20.1 kg grain ha−1day−1).
Thus, to realize potential yields and profits, soybean crops require foliar feeding of micronutrients, such as Zn and B, both at 0.5% solution, and macronutrient fertilizers urea, NPK, and DAP, all at 2%, over and above basally applied RDF. This could be particularly essential for low- to medium-fertility soils.

Author Contributions

Conceptualization, A.D.; data curation, G.A.R., S.B., S.K.L., S.D., R.R. and K.S.; formal analysis, G.A.R., S.B., A.K.C. and S.S.R.; investigation, A.D.; methodology, A.D. and G.A.R.; project administration, R.S.; resources, A.K.C., K.S., C.S. and B.K.; software, A.K.C., T.S. and B.K.; supervision, A.D. and R.S.; validation, A.D.; visualization, S.K.L.; writing—original draft, S.B. and S.D.; writing—review & editing, S.B., S.K.L., A.K.C., S.S.R., R.K., T.S., R.R., K.S., C.S. and B.K. All authors have read and agreed to the published version of the manuscript.

Funding

This research received no external funding.

Institutional Review Board Statement

Not applicable.

Informed Consent Statement

Not applicable.

Data Availability Statement

All the data supporting the results presented in this manuscript were statistically analyzed.

Acknowledgments

The authors express their gratitude to AICRP on Soybean and the Director, ICAR- Indian Agricultural Research Institute, New Delhi, India for providing the necessary facilities for conducting this research.

Conflicts of Interest

The authors declare no conflict of interest.

References

  1. Choudhary, A.; Rana, D.; Bana, R.; Pooniya, V.; Dass, A.; Kaur, R.; Rana, K. Agronomy of Oilseed and Pulse Crops; PG School, IARI: New Delhi, India; ICAR, DARE: New Delhi, India, 2015. [Google Scholar]
  2. Das, A.; Babu, S.; Yadav, G.S.; Ansari, M.A.; Singh, R.; Baishya, L.K.; Rajkhowa, D.J.; Ngachan, S.V. Status and strategies for pulses production for food and nutritional security in North-Eastern Region of India. Indian J. Agron. 2016, 61, 43–47. [Google Scholar]
  3. Dass, A.; Bhattacharyya, R. Wheat residue mulch and anti-transpirants improve productivity and quality of rainfed soybean in semi-arid north-indian plains. Field Crop. Res. 2017, 210, 9–19. [Google Scholar] [CrossRef]
  4. Keyser, H.H.; Li, F. Potential for increasing biological nitrogen fixation in soybean. Plant Soil 1992, 141, 119–135. [Google Scholar] [CrossRef]
  5. Dass, A. Response of Gram Varieties to Sowing Dates and Phosphorus under on-Farm Conditions; CSKHPKV: Palampur, India, 1996. [Google Scholar]
  6. Kobraee, S.; Noor Mohamadi, G.; HeidariSharifAbad, H.; DarvishKajori, F.; Delkhosh, B. Micronutrients distribution in soybean plant with Zn, Fe, and Mn application. Annu. Res. Rev. Biol. 2013, 2, 83–91. [Google Scholar]
  7. Alam, S.; Kamei, S.; Kawai, S. Amelioration of manganese toxicity in barley with iron. J. Plant Nutr. 2001, 24, 1421–1433. [Google Scholar] [CrossRef]
  8. Alloway, B.J. Zinc in Soils and Crop Nutrition; International Fertilizer Industry Association and International Zinc Association: Brussels, Belgium; Paris, France, 2004; p. 135. [Google Scholar]
  9. Ghasemian, V.; Ghalavand, A.; Zadeh, A.S.; Pirzad, A. The effect of iron, zinc and manganese on quality and quantity of soybean seed. J. Phytol. 2010, 2, 73–79. [Google Scholar]
  10. Hasanuzzaman, M.; Bhuyan, M.H.M.B.; Nahar, K.; Hossain, M.S.; Mahmud, J.A.; Hossen, M.S.; Masud, A.A.C.; Moumita; Fujita, M. Potassium: A vital regulator of plant responses and tolerance to abiotic stresses. Agronomy 2018, 8, 31. [Google Scholar] [CrossRef] [Green Version]
  11. Yadav, G.S.; Das, A.; Kandpal, B.K.; Babu, S.; Lal, R.; Datta, M.; Das, B.; Singh, R.; Singh, V.K.; Mohapatra, K.P.; et al. The food-energy-water-carbon nexus in a maize-maize-mustard cropping sequence of the Indian Himalayas: An impact of tillage-cum-live mulching. Renew. Sustain. Energy Rev. 2021, 151, 111602. [Google Scholar] [CrossRef]
  12. Yadav, G.S.; Babu, S.; Das, A.; Mohapatra, K.P.; Singh, R.; Avasthe, R.K.; Roy, S. No till and mulching enhance energy use efficiency and reduce carbon footprint of a direct-seeded upland rice production system. J. Clean. Prod. 2020, 271, 122700. [Google Scholar] [CrossRef]
  13. Babu, S.; Singh, R.; Yadav, D.; Rathore, S.S.; Raj, R.; Avasthe, R.; Yadav, S.K.; Das, A.; Yadav, V.; Yadav, B.; et al. Nanofertilizers for agricultural and environmental sustainability. Chemosphere 2022, 292, 133451. [Google Scholar] [CrossRef]
  14. Fageria, N. Soil fertility and plant nutrition research under field conditions: Basic principles and methodology. J. Plant Nutr. 2007, 30, 203–223. [Google Scholar] [CrossRef]
  15. Cakmak, I. Enrichment of cereal grains with zinc: Agronomic or genetic biofortification? Plant Soil 2008, 302, 1–17. [Google Scholar] [CrossRef]
  16. Baybordi, A. Zinc in Soils and Crop Nutrition; Parivar Press: Tehran, Iran, 2006; p. 179. [Google Scholar]
  17. Fageria, N. Calcium. In The Use of Nutrıents in Crop Plants; CRC Press: Boca Raton, FL, USA, 2009. [Google Scholar]
  18. Fox, T.C.; Guerinot, M.L. Molecular biology of cation transport in plants. Annu. Rev. Plant Physiol. Plant Mol. Biol. 1998, 49, 669–696. [Google Scholar] [CrossRef] [Green Version]
  19. Bennett, E.J.; Roberts, J.A.; Wagstaff, C. The role of the pod in seed development: Strategies for manipulating yield. New Phytol. 2011, 190, 838–853. [Google Scholar] [CrossRef] [PubMed] [Green Version]
  20. Zolfaghari Gheshlaghi, M.; Pasari, B.; Shams, K.; Rokhzadi, A.; Mohammadi, K. The effect of micronutrient foliar application on yield, seed quality and some biochemical traits of soybean cultivars under drought stress. J. Plant Nutr. 2019, 42, 2715–2730. [Google Scholar] [CrossRef]
  21. Nelson, K.A.; Motavalli, P.P.; Stevens, W.E.; Kendig, J.A.; Dunn, D.; Nathan, M. Foliar potassium fertilizer additives affect soybean response and weed control with glyphosate. Int. J. Agron. 2012, 2012, 461894. [Google Scholar] [CrossRef] [Green Version]
  22. Egli, D.B. Seed-fill duration and yield of grain crops. Adv. Agron. 2004, 83, 243–279. [Google Scholar]
  23. Waters, B.M.; Sankaran, R.P. Moving micronutrients from the soil to the seeds: Genes and physiological processes from a biofortification perspective. Plant Sci. 2011, 180, 562–574. [Google Scholar] [CrossRef] [Green Version]
  24. Hacisalihoglu, G.; Ozturk, L.; Cakmak, I.; Welch, R.M.; Kochian, L. Genotypic variation in common bean in response to zinc deficiency in calcareous soil. Plant Soil 2004, 259, 71–83. [Google Scholar] [CrossRef]
  25. Paschke, M.W.; Valdecantos, A.; Redente, E.F. Manganese toxicity thresholds for restoration grass species. Environ. Pollut. 2005, 135, 313–322. [Google Scholar] [CrossRef]
  26. Pathak, G.C.; Gupta, B.; Pandey, N. Improving reproductive efficiency of chickpea by foliar application of zinc. Braz. J. Plant Physiol. 2012, 24, 173–180. [Google Scholar] [CrossRef] [Green Version]
  27. Moraghan, J.; Padilla, J.; Etchevers, J.; Grafton, K.; Acosta-Gallegos, J. Iron accumulation in seed of common bean. Plant Soil 2002, 246, 175–183. [Google Scholar] [CrossRef]
  28. Yadav, S.K.; Babu, S.; Singh, Y.; Yadav, G.S.; Singh, K.; Singh, R.; Singh, H. Effect of organic nitrogen sources and biofertilizers on production potential and energy budgeting of rice (Oryza sativa)-based cropping systems. Indian J. Agron. 2013, 58, 459–464. [Google Scholar]
  29. Zocchi, G.; De Nisi, P.; Dell’Orto, M.; Espen, L.; Gallina, P.M. Iron deficiency differently affects metabolic responses in soybean roots. J. Exp. Bot. 2007, 58, 993–1000. [Google Scholar] [CrossRef] [PubMed] [Green Version]
  30. Kobraee, S.; Shamsi, K. Impact of micronutrients foliar application on soybean yield and its components under water deficit condition. J. Biodivers. Environ. Sci. 2013, 3, 39–45. [Google Scholar]
  31. Kavita, K.; Anchal, D.; Sudhishri, S.; Ramanjit, K.; Rajender, K. Effect of irrigation regimes and nitrogen rates on photosynthetically active radiation interception, photosynthetic rate and dry matter partitioning in maize (Zea mays). Indian J. Agric. Sci. 2017, 87, 1575–1578. [Google Scholar]
  32. GR, H.; Giri, S.; Yelvikar, N. Effect of foliar application of micronutrients on nutrient uptake by soybean crop. Int. J. Pure App. Biosci. 2018, 6, 261–265. [Google Scholar]
  33. Association, I.F.I. Fertilizers and Their Use: A Pocket Guide for Extension Officers; Food & Agriculture Org: Rome, Italy, 2000. [Google Scholar]
  34. Panwar, A.S.; Shamim, M.; Babu, S.; Ravishankar, N.; Prusty, A.K.; Alam, N.M.; Singh, D.K.; Bindhu, J.S.; Kaur, J.; Dashora, L.N.; et al. Enhancement in productivity, nutrients use efficiency and economics of rice-wheat cropping systems in India through farmer’s participatory approach. Sustainability 2019, 11, 122. [Google Scholar] [CrossRef] [Green Version]
  35. Rathore, S.S.; Babu, S.; Shekhawat, K.; Singh, R.; Yadav, S.K.; Singh, V.K.; Singh, C. Designing energy cum carbon-efficient environmentally clean production system for achieving green economy in agriculture. Sustain. Energy Technol. Assess. 2022, 52, 102190. [Google Scholar] [CrossRef]
  36. Brown, P.H.; Cakmak, I.; Zhang, Q. Form and Function of Zinc Plants. In Zinc in Soils and Plants; Springer: Berlin/Heidelberg, Germany, 1993; pp. 93–106. [Google Scholar]
  37. Jan, B.; Bhat, T.A.; Sheikh, T.A.; Wani, O.A.; Bhat, M.A.; Nazir, A.; Fayaz, S.; Mushtaq, T.; Farooq, A.; Wani, S. Agronomic bio-fortification of rice and maize with iron and zinc: A review. Int. Res. J. Pure Appl. Chem. 2020, 21, 28–37. [Google Scholar] [CrossRef]
  38. Kumagai, E.; Takahashi, T. Soybean (Glycine max (L.) Merr.) Yield reduction due to late sowing as a function of radiation interception and use in a cool region of Northern Japan. Agronomy 2020, 10, 66. [Google Scholar] [CrossRef] [Green Version]
  39. Mansoor, S.; Kour, N.; Manhas, S.; Zahid, S.; Wani, O.A.; Sharma, V.; Wijaya, L.; Alyemeni, M.N.; Alsahli, A.A.; El-Serehy, H.A. Biochar as a tool for effective management of drought and heavy metal toxicity. Chemosphere 2021, 271, 129458. [Google Scholar] [CrossRef] [PubMed]
  40. Ross, C.; Salisbury, F.B. Plant Physiology, 1947–1972; Missouri Botanical Garden Press: St. Louis, MO, USA, 1974; Volume 61, pp. 112–113. [Google Scholar]
  41. Dass, A.; Dey, D.; Lal, S.; Rajanna, G. Tank-mix insecticide and herbicide application effects on weeds, insect-pest menace and soybean productivity in semi-arid northern plains of india. Legume Res. 2019, 42, 385–391. [Google Scholar] [CrossRef] [Green Version]
  42. Mahdi, S.S.; Dhekale, B.S.; Hussain, A.; Jehangir, I.A.; Jan, R.; Bhat, M.A.; Sofi, N.R.; Ahmed, L.; Qureshi, A.M.I.; Aezum, A.M.; et al. Analysis and farmers perception of climate change trends in kashmir region of union territory-Jammu & Kashmir, India: North western himalayas. Res. Sq. 2021. [Google Scholar] [CrossRef]
  43. Pérez-Vicente, R.; Pineda, M.; Cárdenas, J. Isolation and characterization of xanthine dehydrogenase from Chlamydomonas reinhardtii. Physiol. Plant. 1988, 72, 101–107. [Google Scholar] [CrossRef]
  44. Walkley, C. An examination of degtjareff method of determining soil organic matter and proposed modification of the method of the chromic acid titration method. Soil Sci. 1934, 37, 29–38. [Google Scholar] [CrossRef]
  45. Adhikari, B.; Dhungana, S.K.; Kim, I.D.; Shin, D.H. Effect of foliar application of potassium fertilizers on soybean plants under salinity stress. J. Saudi Soc. Agric. Sci. 2020, 19, 261–269. [Google Scholar] [CrossRef]
  46. Boote, K.; Gallaher, R.; Robertson, W.; Hinson, K.; Hammond, L. Effect of foliar fertilization on photosynthesis, leaf nutrition, and yield of soybeans. Agron. J. 1978, 70, 787–791. [Google Scholar] [CrossRef]
  47. Kulhare, P.; Chaudhary, M.; Uike, Y.; Sharma, G.; Thakur, R. Direct and residual effect of Zn alone and incubated with cow dung on growth characters, zn content, uptake and quality of soybean [Glycine max (L.) merrill]–wheat (Triticum aestivum L.) in a vertisol. Soybean Res. 2014, 12, 63–74. [Google Scholar]
  48. Guertal, E.; Abaye, A.; Lippert, B.; Miner, G.; Gascho, G. 1996. Sources of boron for foliar fertilization of cotton and soybean. Commun Soil Sci. Plant Anal. 1996, 27, 15–17. [Google Scholar] [CrossRef]
  49. Kaya, C.; Higgs, D. Response of tomato (Lycopersicon esculentum L.) cultivars to foliar application of zinc when grown in sand culture at low zinc. Sci. Hortic. 2002, 93, 53–64. [Google Scholar] [CrossRef]
  50. Pandey, N.; Pathak, G.C.; Sharma, C.P. Zinc is critically required for pollen function and fertilisation in lentil. J. Trace. Elem. Med. Biol. 2006, 20, 89–96. [Google Scholar] [CrossRef] [PubMed]
  51. Yadav, G.S.; Shivay, Y.S.; Kumar, D.; Babu, S. Enhancing iron density and uptake in grain and straw of aerobic rice through mulching and rhizo-foliar fertilization of iron. Afr. J. Agric. Res. 2013, 8, 5447–5454. [Google Scholar]
  52. Daraz Khan, G.; Latif, M.; Hassan, S. The role of controlled drainage under drought conditions in an irrigated area in NWFP, Pakistan. Irrig. Drain. 2003, 52, 147–162. [Google Scholar] [CrossRef]
Figure 1. Mean meteorological parameters during 2015, 2016, and 2017.
Sustainability 14 05825 g001
Figure 2. NDVI of soybean crop canopy under different foliar-applied nutrients (2015–2017). WS: water spray, Urea2%: 2% urea solution, DAP2%: 2% di-ammonium phosphate solution, MOP0.5%: 0.5% muriate of potash solution, NPK2%: 2% solution of 19:19:19 NPK, Mo0.5%: 0.5% molybdenum solution, B0.5%: 0.5% boron solution, Zn 0.5%: 0.5% chelated-Zn solution, and NFN: no-foliar nutrition.
Sustainability 14 05825 g002
Figure 3. PAR intercepted by crop canopy in soybean under different foliar-applied nutrients (2015–2017). WS: water spray, Urea2%: 2% urea solution, DAP2%: 2% di-ammonium phosphate solution, MOP0.5%: 0.5% muriate of potash solution, NPK2%: 2% solution of 19:19:19 NPK, Mo0.5%: 0.5% molybdenum solution, B0.5%: 0.5% boron solution, Zn 0.5%: 0.5% chelated-Zn solution, and NFN: no-foliar nutrition.
Sustainability 14 05825 g003
Figure 4. PAR transmitted down the crop canopy in soybean under different foliar-applied nutrients (2015–2017). WS: water spray, Urea2%: 2% urea solution, DAP2%: 2% di-ammonium phosphate solution, MOP0.5%: 0.5% muriate of potash solution, NPK2%: 2% solution of 19:19:19 NPK, Mo0.5%: 0.5% molybdenum solution, B0.5%: 0.5% boron solution, Zn 0.5%: 0.5% chelated-Zn solution, and NFN: no-foliar nutrition.
Sustainability 14 05825 g004
Figure 5. Water-use efficiency in soybean under different foliar-applied nutrients (2015–2017). WS: water spray, Urea2%: 2% urea solution, DAP2%: 2% di-ammonium phosphate solution, MOP0.5%: 0.5% muriate of potash solution, NPK2%: 2% solution of 19:19:19 NPK, Mo0.5%: 0.5% molybdenum solution, B0.5%: 0.5% boron solution, Zn 0.5%: 0.5% chelated-Zn solution, and NFN: no-foliar nutrition.
Sustainability 14 05825 g005
Figure 6. Production efficiency in soybean under different foliar-applied nutrients (2015–2017). WS: water spray, Urea2%: 2% urea solution, DAP2%: 2% di-ammonium phosphate solution, MOP0.5%: 0.5% muriate of potash solution, NPK2%: 2% solution of 19:19:19 NPK, Mo0.5%: 0.5% molybdenum solution, B0.5%: 0.5% boron solution, Zn 0.5%: 0.5% chelated-Zn solution, and NFN: no-foliar nutrition.
Sustainability 14 05825 g006
Table 1. Chemical properties of experimental field soil (0–15 cm layer).
PropertiesAverage Value
201520162017
Oxidizable organic C (g kg−1)4.74.94.8
Available nitrogen195190194
Available P2O5 kg ha−127.626.225.7
Available K2O kg ha−1309280288
Soil pH7.47.37.3
Available Zn (mg kg−1)0.660.650.65
Table 2. Effect of foliar nutrition on plant height, number of branches and dry matter accumulation/plant, leaf area index, and leaf- chlorophyll content (SPAD values) in soybean (2015–2017).
TreatmentPlant Height
(cm)
Branches/PlantDry Matter Accumulation (g/Plant)Leaf Area IndexSPAD Values
201520162017201520162017201520162017201520162017201520162017
WS54.051.566.65.55.25.715.913.416.23.22.73.237.937.638.1
Urea2%60.757.174.35.75.46.217.415.318.23.53.43.642.241.742.6
DAP2%59.556.472.85.65.16.017.114.817.43.43.33.541.640.141.4
MOP0.5%53.147.965.45.85.55.915.713.216.53.02.73.136.935.637.2
NPK2%60.156.873.66.05.76.117.414.017.93.43.13.541.039.741.4
Mo0.5%56.254.370.55.65.35.916.514.417.03.33.13.438.538.939.2
B0.5%57.653.969.25.65.55.917.114.117.43.33.13.438.837.839.6
Zn 0.5%58.455.172.15.85.56.117.914.618.03.43.23.539.939.040.0
NFN54.251.166.45.45.35.815.813.416.23.12.83.237.637.538.0
SEm ±1.761.722.060.440.340.370.500.430.610.100.110.091.121.111.13
CD (p < 0.05)5.265.166.18NSNSNS1.501.281.830.290.330.273.393.333.40
WS: water spray, Urea2%: 2% urea solution, DAP2%: 2% di-ammonium phosphate solution, MOP0.5%: 0.5% muriate of potash solution, NPK2%: 2% solution of 19:19:19 NPK, Mo0.5%: 0.5% molybdenum solution, B0.5%: 0.5% boron solution, Zn 0.5%: 0.5% chelated-Zn solution, and NFN: no-foliar nutrition.
Table 3. Effect of foliar nutrition on the crop growth rate (CGR) and the relative growth rate (RGR) at different growth stages of soybean (2015–2017).
TreatmentCGRRGR
45–60 DAS60–75 DAS45–60 DAS60–75 DAS
201520162017201520162017201520162017201520162017
WS12.410.513.18.46.68.10.0410.0400.0420.0180.0170.017
Urea2%12.411.214.411.59.410.30.0410.0410.0440.0240.0220.020
DAP2%13.610. 613.69.29.69.50.0430.0400.0420.0190.0230.019
MOP0.5%13.310.213.56.36.18.00.0420.0390.0420.0130.0160.016
NPK2%13.911.114.99.77.39.80.0440.0420.0460.0200.0180.019
Mo0.5%13.111.814.18.97.88.80.0430.0440.0450.0190.0180.018
B0.5%13.410.614.69.77.39.40.0430.0390.0460.0200.0180.019
Zn 0.5%13.710.514.111.08.710.20.0430.0380.0430.0220.0210.020
NFN12.510.812.87.76.78.20.0410.0420.0410.0170.0170.017
SEm ±1.241.210.970.610.590.620.0020.0040.0030.0020.0010.001
CD (p = 0.05)NSNSNS1.831.771.86NSNSNS0.0050.0040.003
WS: water spray, Urea2%: 2% urea solution, DAP2%: 2% di-ammonium phosphate solution, MOP0.5%: 0.5% muriate of potash solution, NPK2%: 2% solution of 19:19:19 NPK, Mo0.5%: 0.5% molybdenum solution, B0.5%: 0.5% boron solution, Zn 0.5%: 0.5% chelated-Zn solution, and NFN: no-foliar nutrition.
Table 4. Effect of foliar nutrition on yield attributes, yields, and harvest indices of soybean (2015–2017).
TreatmentPods Per PlantSeed IndexSeed Yield (kg ha−1)Straw Yield (kg ha−1)Harvest Index
201520162017201520162017201520162017201520162017201520162017
WS38.231.140.69.69.210.41781118718834030358145240.310.250.29
Urea2%42.435.346.510.510.510.81994143921364376390148900.310.280.30
DAP2%43.531.242.710.610.110.72064132619984232366046690.330.270.30
MOP0.5%42.128.142.010.79.710.61947123819293942337544000.330.270.31
NPK2%43.432.146.310.810.310.92008139721364385372646930.310.270.31
Mo0.5%40.327.740.510.29.710.61881121818834007368646730.320.250.29
B0.5%45.531.845.211.010.211.22176134721594121338843970.350.290.33
Zn 0.5%48.738.747.811.211.111.52372156322044258345945460.360.310.33
NFN38.027.340.09.79.010.41759113418603963357445840.310.240.29
SEm ±2.071.851.410.310.400.35116.581.083.62723192260.010.020.02
CD (p = 0.05)6.195.564.220.921.21NS349.2242.8250.8NSNSNS0.04NSNS
WS: water spray, Urea2%: 2% urea solution, DAP2%: 2% di-ammonium phosphate solution, MOP0.5%: 0.5% muriate of potash solution, NPK2%: 2% solution of 19:19:19 NPK, Mo0.5%: 0.5% molybdenum solution, B0.5%: 0.5% boron solution, Zn 0.5%: 0.5% chelated-Zn solution, and NFN: no-foliar nutrition: DAS: days after sowing.
Table 5. Effect of foliar nutrition on cost of production, net returns, B:C ratio, and monetary efficiency of soybean (2015–2017).
TreatmentCost of Cultivation
(USD ha−1)
Net Returns
(USD ha−1)
B:C
Ratio
Monetary Efficiency
(USD ha−1day−1)
201520162017201520162017201520162017201520162017
WS439.0407.1438.9378.7217.3592.70.860.531.356.995.798.67
Urea2%441.4409.5441.3470.3332.9720.61.070.811.637.796.889.76
DAP2%447.0415.0446.9488.8271.2643.21.090.651.448.006.369.16
MOP0.5%440.5408.6440.4440.8230.5608.51.000.561.387.535.928.81
NPK2%474.5442.5474.3442.9275.9681.00.930.621.447.846.659.71
Mo0.5%672.3640.4672.2184.60.9364.30.270.100.547.325.938.71
B0.5%544.5512.5544.3432.8173.7611.80.790.341.128.356.369.72
Zn 0.5%462.3430.4462.2596.8349.8720.41.290.811.569.057.239.93
NFN429.9397.9429.3377.2203.8593.50.880.511.386.895.578.60
SEm ±---51.036.042.30.110.090.0840.440.330.36
LSD (p = 0.05)---152.9107.8126.90.340.260.251.311.001.07
WS: water spray, Urea2%: 2% solution of urea, DAP2%:2% solution of di-ammonium phosphate, MOP0.5%: 0.5% solution of muriate of potash, NPK2%: 2% solution of 19:19:19 NPK, Mo0.5%: 0.5% solution of molybdenum, B0.5%: 0.5% solution of boron, Zn 0.5%: 0.5% solution of chelated-Zn, and NFN: no-foliar nutrition, USD = 75 INR.
Publisher’s Note: MDPI stays neutral with regard to jurisdictional claims in published maps and institutional affiliations.

