Article

A Fuzzy Analytic Hierarchy Process Model to Evaluate Logistics Service Expectations and Delivery Methods in Last-Mile Delivery in Brazil

by
Fernanda Alves de Araújo
1,*,
João Gilberto Mendes dos Reis
1,2,3,*,
Marcia Terra da Silva
1 and
Emel Aktas
4
1
Postgraduate Program in Production Engineering, Universidade Paulista—UNIP, Sao Paulo 04026-002, SP, Brazil
2
Postgraduate Program in Business Administration, Universidade Paulista—UNIP, Sao Paulo 04026-002, SP, Brazil
3
Social and Applied Sciences Center, Mackenzie Presbyterian University—MPU, Sao Paulo 01302-907, SP, Brazil
4
Cranfield School of Management, Cranfield University, College Road, Cranfield MK43 0AL, UK
*
Authors to whom correspondence should be addressed.
Sustainability 2022, 14(10), 5753; https://doi.org/10.3390/su14105753
Submission received: 31 March 2022 / Revised: 4 May 2022 / Accepted: 7 May 2022 / Published: 10 May 2022
(This article belongs to the Special Issue Sustainable Economy and Green Logistics)

Abstract

:
Nowadays, postal services and third-party logistics services (3PL) have been pressured by the increasing demand for delivery services. Therefore, they need to improve their last-mile delivery strategies to meet customers’ expectations. This paper aims to investigate how logistics service expectations affect the delivery process in urban areas using a multiple-criteria decision support system based on the Fuzzy Analytic Hierarchy Process (FAHP). We developed a decision-making model employing six criteria and five delivery methods indicated in the literature and collected information from 27 experts working in academia and local and multinational third-party logistics providers in Brazil to validate this model. The results indicate that cost (21.4%) and tracking and tracing (19.3%) are the most important two criteria in the decision model, and the best delivery methods are smart lockers (21.8%) followed by small trucks (21.3%). Our results suggest that service expectations regarding last-mile delivery are aligned with extensive use of road transport and the increase in e-commerce sales can raise greenhouse gas emissions and compromise the environment in urban areas.

1. Introduction

Business-to-Customer (B2C) e-commerce is responsible for one of the most challenging logistics processes due to high operational costs, insecurity, service level requirements, time window pressures, and CO2 emissions [1,2,3,4,5]. Compared with traditional offline retailing, B2C has brought new challenges for companies [6]. In this sense, the complexities of the physical distribution of products should not be underestimated and logistics is a way to obtain a competitive advantage.
The most critical and expensive logistics process in fulfilling B2C orders is the last-mile delivery [6,7,8,9]. Many B2C companies are striving to be more responsive in their last-mile delivery services to increase sales and to obtain market share incurring a negative impact on their operational costs (sometimes failing to cover their costs) [1]. Online companies usually consider service level targets that they must meet to remain competitive [8]. However, decisions about service level targets affect not only distribution costs but have serious impacts on the number of cargo movements and gas emissions in urban areas.
Last-mile delivery in B2C has been calling the attention of several researchers that are trying to understand it to propose solutions to reduce its negative impacts on society and to improve the logistics distribution process. Until 2016, the last-mile delivery literature was focused on three perspectives [8]: (1) environmental sustainability; (2) effectiveness customer service levels; and (3) efficiency costs. However, from 2016 to date, the concerns were directed toward innovative perspectives and new technologies/solutions, such as parcel lockers (smart lockers) [10,11,12]; delivery point and pick-up design [2,13,14,15]; city logistics and urban distribution alternatives [1,16,17,18,19,20]; and drone deliveries [21,22,23,24,25].
Several relevant studies can be found in the literature. Allen et al. [1] investigated the use of light goods vehicles for parcel deliveries in central London and identified poor vehicle utilization in the last-mile delivery operation that increases the number of deliveries and the volume of CO2 and other greenhouse gas emissions (GHG). They concluded that the main pressures on last-mile operators are: “managing seasonal peaks in demand; reduced lead times between customers; placing orders and deliveries being made; meeting delivery time windows; first-time delivery; and failure rates and the need to manage high levels of product returns.” Therefore, these trade-offs may increase negative impact on the environment, society, and economic performance of companies in the sector. However, we found in the literature evidence that different practices can be adopted to tackle the last-mile delivery problems. In Norway, Bjerkan et al. [2] surveyed 500 individuals and found a correlation between travel behavior and last-mile delivery practices, where home delivery is typically adopted in segments characterized by heavier goods, while pick-up points were implemented to smaller goods that reduce the number of travels in the last mile. In the same direction, Vakulenko et al. [26] noted the influence of customer behavior in last-mile delivery services; they conducted focus group interviews and a usability test that incorporated an innovative technology in the delivery service and provided insights into how service innovation affects what they call “e-customer behavior”. Nevertheless, they reaffirm that the remarkable growth of e-commerce is driven by consumers creating challenging problems in the final leg of the supply chain.
There is no doubt that these previous studies contribute to the understanding of service level expectations in last-mile delivery in the B2C sector. However, they are connected to the consumer experience perspective rather than the challenges of logistics providers to attend the rising service level in the e-commerce sector, showing a gap to be explored. De Araújo et al. [27] identified differences between e-consumers’ desires (low-cost freight; faster delivery) versus last-mile delivery service providers’ desires (cost reduction; delivery optimization), showing the lack of an efficient framework to deal with the challenges and expectations from stakeholders. Eliyan et al. [28] suggested that last-mile delivery strategies in the e-commerce sector need to be redesigned for companies considering the efficiency of the operation and the transport costs while maintaining a desirable service level to meet consumer expectations.
With these ideas in mind, we established three research questions to investigate the last-mile delivery services:
RQ1—How do service level expectations affect logistics providers in deciding on delivery methods to be used in the last-mile delivery of the B2C sector?
RQ2—How have new technologies been affecting the perception of logistics providers of the delivery methods in last-mile delivery in the B2C sector?
RQ3—How does the decision making regarding delivery methods in last-mile delivery in the B2C sector influence sustainability in urban areas?
Based on these research questions, this paper aims to investigate how logistics service expectations affect the decision making of logistics service providers when they offer alternatives to provide the last-mile delivery services in urban areas. To do so, we developed a multiple-criteria decision support system based on the Fuzzy Analytical Hierarchy Process (Fuzzy AHP). The criteria and alternatives were obtained from the literature.
To test the decision-making model developed based on the literature, we surveyed 27 professionals working in Brazil’s B2C last-mile delivery sector. These 27 professionals are experts in academia, local, and multinational third-party logistics service providers (3PL). The country offers an interesting scenario due to its continental size, with differences in development among regions where some areas are developed as the main metropoles around the world, while others are far and underdeveloped. Therefore, the survey respondents have a broader perspective of last-mile delivery service that contribute to compare the results of the research with several different international perspectives.
The novelty of this paper is to propose a decision-making model for the last-mile delivery alternatives based on the views of experts from 3PL and academia that can be used to evaluate last-mile delivery strategies and their impacts. Note that once the logistics service provider is accused of performing inferiorly by consumers, they need to investigate such irregularities [5]; hence, this study can contribute to shedding light on the challenges faced by companies regarding alternatives they offer in their last-mile delivery operations.
This paper is structured as follows: This introduction, a literature review with a brief overview of the last-mile delivery literature, followed by the current situation in Brazil. Then, the Fuzzy AHP methodology is explained and applied, followed by the findings, discussion, and robustness checks, closing with conclusions and possibilities for future research.

2. Last-Mile Delivery

2.1. Definitions

Early definitions of the last mile were narrowly stated as the “extension of supply chains connected to the end consumer”—a home delivery service for consumers. Last-mile delivery has been termed as a delivery issue and has been a particular issue from a logistics infrastructure standpoint, most notably because of the trade-offs between routing efficiency and customer convenience [29].
Gevaers et al. [30] define the last mile as the final leg in a B2C service, whereby the consignment is delivered to the recipient either at the recipient’s home or at a collection point. Additionally, Gevaers [31] expands the idea and explains that a standard logistics chain may be organized as follows: raw materials are supplied to the processing/manufacturing industry from where finished products are shipped to the storage facilities.
From this point onwards, there are mainly three distribution (selling) options: either through traditional outlets such as stores or supermarkets, through direct sales (D2C) to consumers, or a combination of these two. Therefore, the term “last-mile” in a B2C environment refers specifically to the final leg in a system involving B2C deliveries. Lim and Srai [7] agree that the last mile refers to the final leg of a network and establishes its origin in the telecommunications industry.
Lim and Srai [7] also point out that although several contributions have been made in the last-mile logistics domain, the literature models remain relatively fragmented, hindering a comprehensive and holistic understanding of the topic to direct research efforts. Eventually, Lim and Srai [7] believe that existing last-mile logistics definitions converge on a common understanding that refers to the last part of a delivery process. However, existing definitions appear incomplete in capturing the complexities driven by e-commerce, so they offer the definition: “Last-mile logistics is the last stretch of a business-to-consumer (B2C) parcel delivery service. It takes place from the order penetration point to the final consignee’s preferred destination point”.
It is common ground in the literature to link last-mile delivery to city logistics research. Dating back to the 2000s, when e-commerce was emerging, Taniguchi et al. [32] advise that the development of e-commerce makes city logistics more important. The authors identify two points to discuss the impact of last-mile operations on city logistics by the development of e-commerce: (I) changes in the logistics activities by giving a high priority to the demands of customers or consumers; (II) logistics activities themselves incorporate e-commerce by matching the demand and supply of goods movement.
Nowadays, e-commerce and logistics are bonded and it is difficult to imagine our world without either of them. Gevaers et al. [30] build a last-mile delivery typology and explore the delivery methods, as shown in Figure 1.
According to Gevaers et al. [30], the nature of the last mile is determined mainly by six fundamental aspects: (1) the level of consumer service; (2) security and delivery type; (3) the geographical area; (4) the degree of market penetration and density; (5) the vehicle fleet and technology employed; and (6) the environmental impact. We discuss some of those aspects as part of the decision criteria selection.

2.2. Context of Last Mile in Brazil

Brazil is the largest country in Latin America and its population in 2018 was estimated at over 209 million people; more than 87% live in urban areas [33]. It is a complex country in terms of logistics, considering its continental dimension and poor infrastructure.
Supplying the urban population is a global concern. Ranieri et al. [34] emphasize that about 54% of the population now lives in cities and around 66% is expected in 2050. Urban areas require a massive quantity of goods, services, and resources, causing many troubles for citizens.
Ranieri et al. [34] reinforce that in last-mile delivery the most widespread transport mode adopted is road freight transport, which is responsible for externalities related to delivery. In Brazil, road transport is the dominant mode adopted for deliveries. Brazil has 109 thousand kilometers of trafficable roadways, but they are still not adequate in terms of infrastructure; only 12.4% of them are paved and around 59% are considered regular/poor (Table 1) [35].
When assessing the impact of road transport, we need to consider infrastructure and greenhouse gas (GHG) emissions. According to Marcilio et al. [36], 75% of GHG emissions in the transport sector are attributable to road transport.
Despite the infrastructure issues, the logistics providers’ competition in Brazil is fierce. There are at least 220 thousand transport companies officially registered and more than 724 thousand independent carriers [35]. Following those numbers, the vehicle fleet has also increased [35]. In 2019, Brazil counted 103 million registered vehicles. The biggest growth in the past decade is observed in motorcycles, with a 64% increase between 2009 and 2019; trucks have grown 30.9% in the same period [35].
All those Brazilian characteristics have their unfolding for the main stakeholders: infrastructure, quality, and competitiveness. According to the Brazilian Ministry of Infrastructure [37], in 2020 the Federal Government invested BRL 133 billion in infrastructure, corresponding to 1.8% of gross domestic product (GDP); however, some specialists say that it is not enough and it should be double this amount [38].
The e-commerce growth brought opportunities to innovate in the last-mile delivery sector in Brazil. Reuters [39] forecast USD 3.6 billion investment in transportation management systems (TMS) by 2024, representing an increase of 14.8%. In this context, the rise of logistics startups and logistics technologies (LogiTech) seems to be a way to overcome high costs and infrastructure issues, using technology as the main differentiator. Today, there is an average of 280 logistics startups in Brazil; 50% of them were founded between 2015 and 2020 and attracted more than USD 186 million in investment only in 2020 [40]. The top five (5) LogiTech companies in Brazil are iFood, Loggi, Mandaê, Clique Retire, and FreteBras. Additionally, big retailer companies are acquiring small LogiTechs and thinking of merging their business and staying more competitive [41]. Of all the Latin American countries, venture capital investments in 2019 (USD 4.6 billion), 26% were in logistics and distribution companies [40].
Sousa et al. [42] explore some solutions for Brazil’s last-mile delivery in urban centers without focusing on the e-commerce industry. The authors’ objective was to understand from retail companies what types of innovative last-mile delivery practices they are willing to use. This research adds a counterpoint by comparing last-mile delivery providers’ results on this research with retail companies’ results on theirs.
Table 2 adapted from Souza et al. [42] presents that the most innovative practices are pick-up point/locker solutions and the least innovative are tied between drones and car drops. In their research, they judge all innovative practices except car drops to be viable in Brazil, but only consider the companies’ answers not external factors or other barriers.
Souza et al. [42] conclude that developed countries tend to have more sophisticated solutions for the last-mile delivery, such as using innovative vehicles to reduce labor costs and environmental impacts and improve efficiency. On the flip side, the developing countries are betting on solutions with a lower level of technology, easier to adopt, and with a lower investment as they still have to face other recurring challenges.

3. Methodology

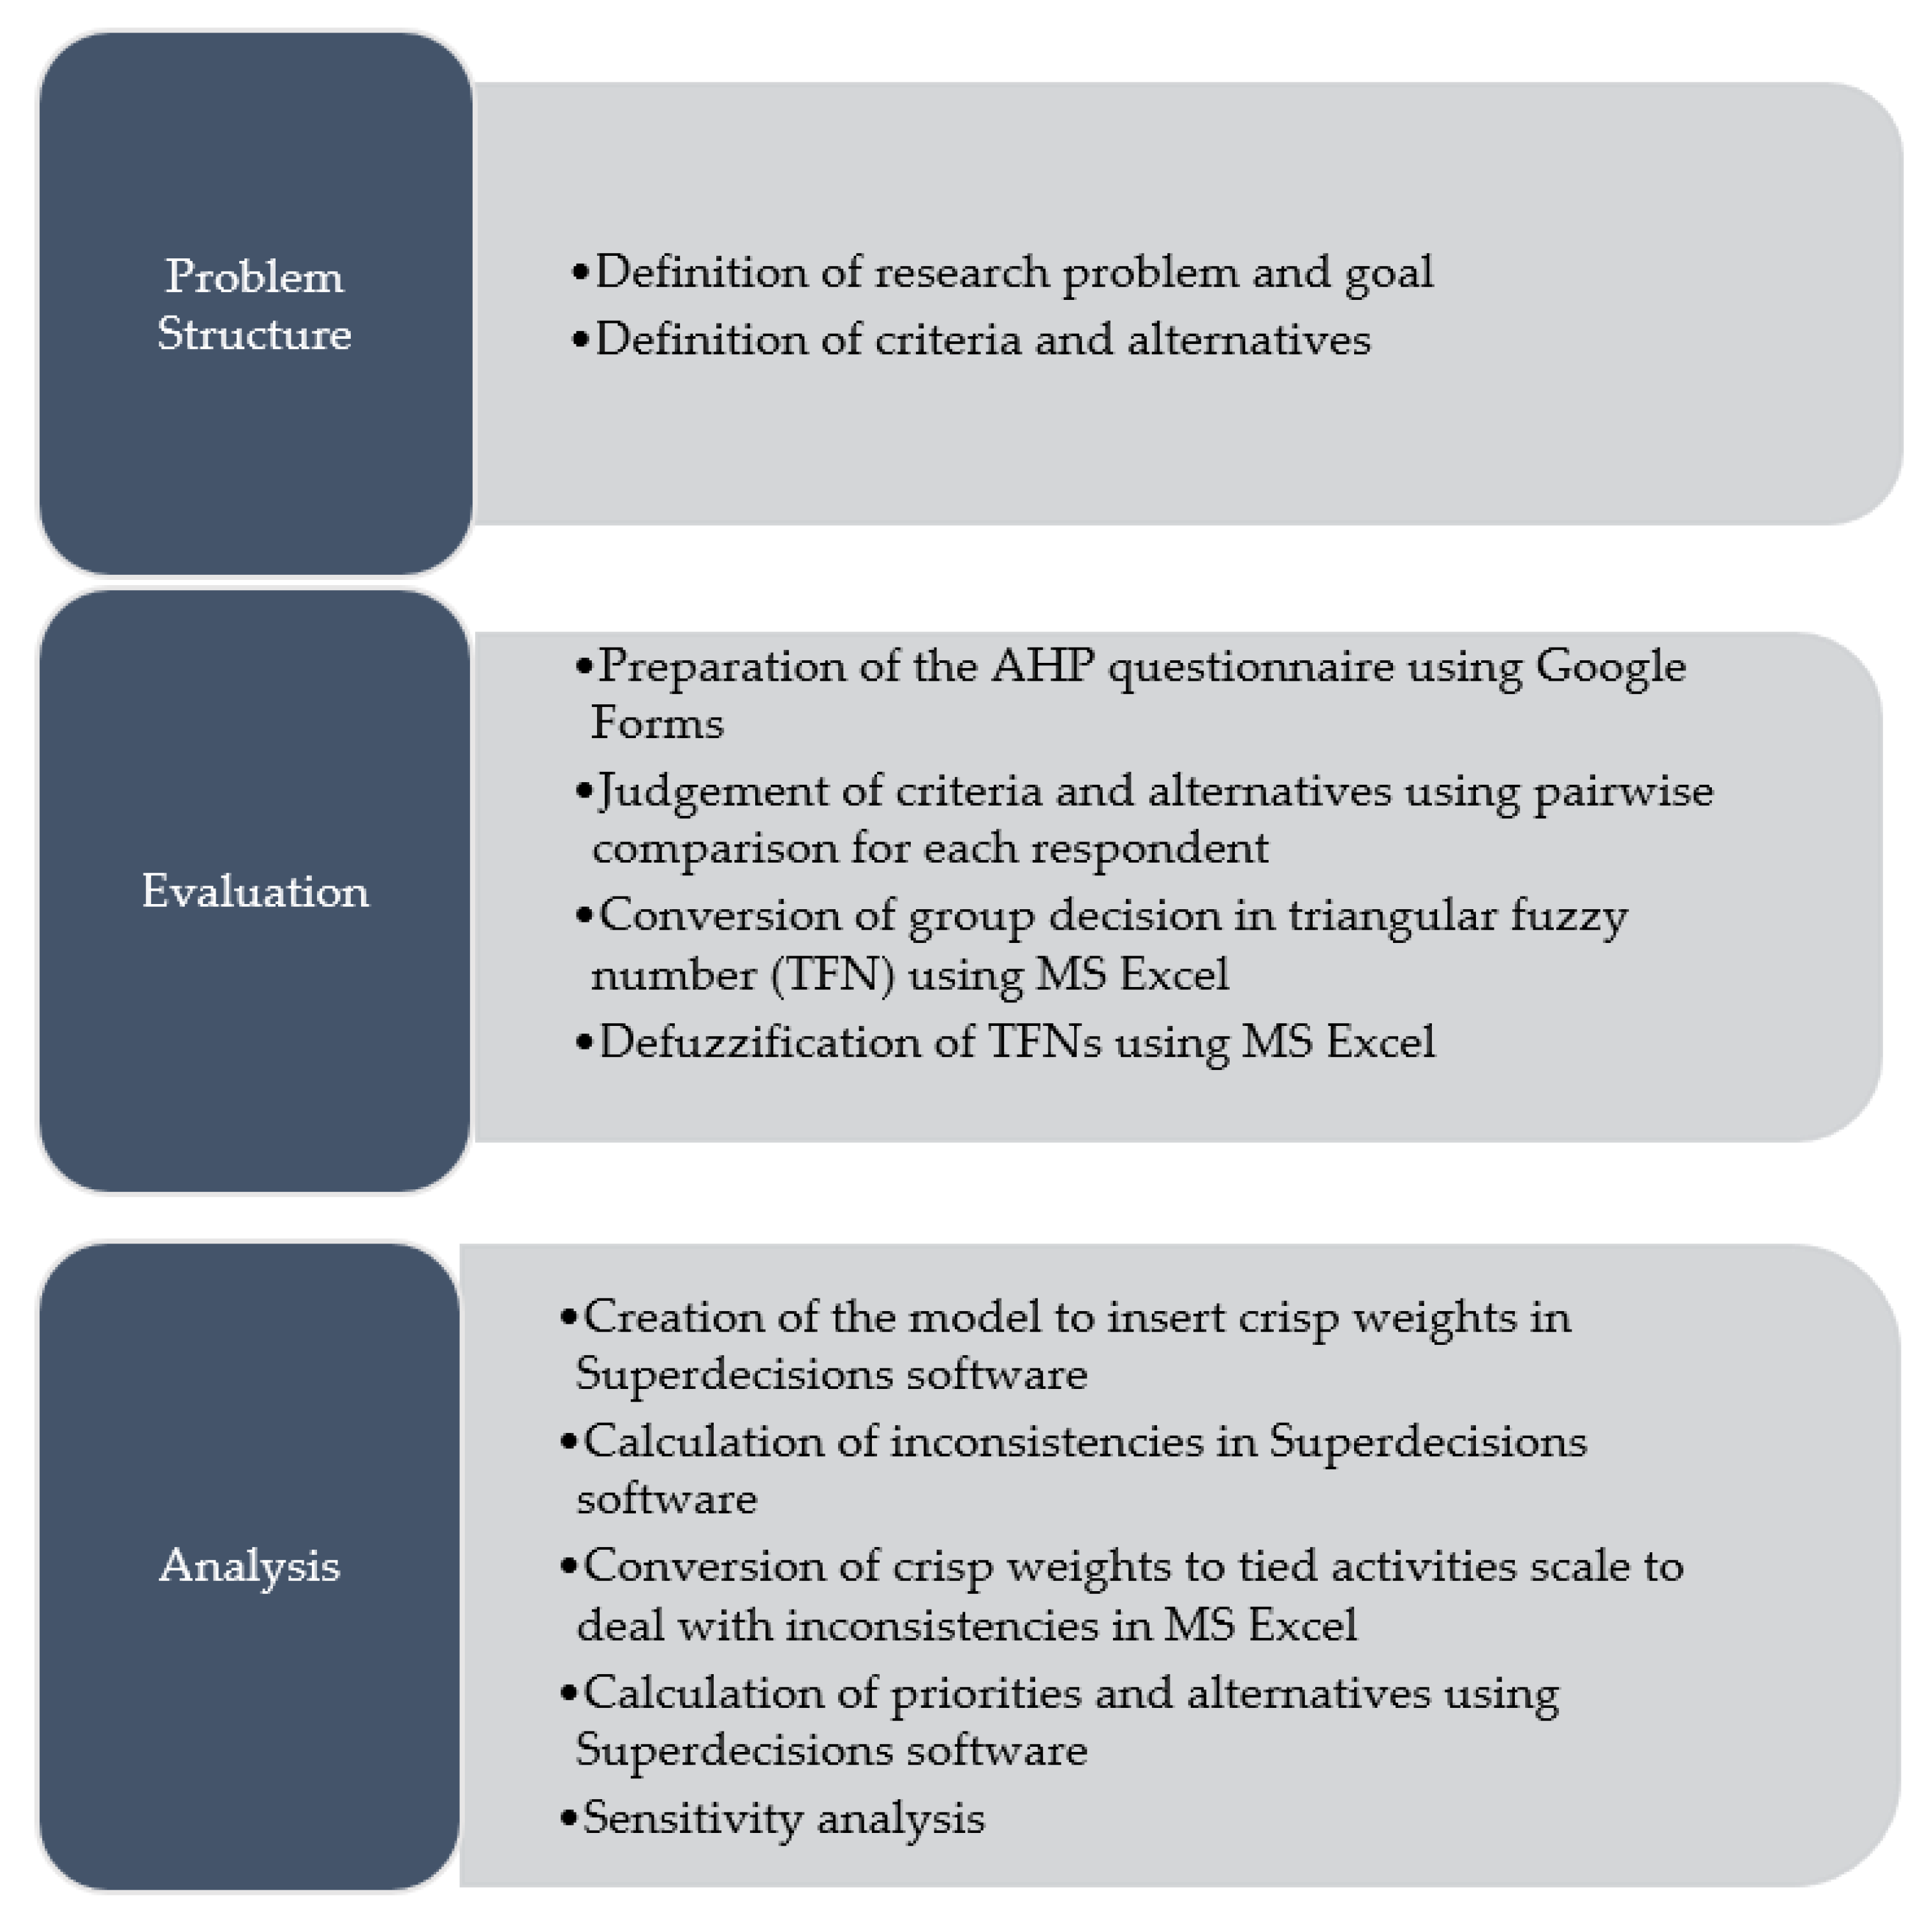
To investigate the impact of service expectations and alternatives for Brazilian e-commerce last-mile delivery, we adopt a multiple-criteria method, namely, the Fuzzy Analytic Hierarchy Process (Fuzzy AHP) [43,44,45]. The flow of the research is presented in Figure 2.
AHP is commonly adopted for decision making and was developed by Tomas L. Saaty to find the best alternative when considering multiple criteria [43,46]. The approach consists of establishing pairwise comparisons among different criteria and alternatives under these criteria in a decision hierarchy to establish the best decision. The mathematical representation of the pairwise comparison matrix can be seen in Equation (1) [43].
  A = a i j = [ 1 a 12 a 1 n a 21 1 a 2 n a n 1 a n 2 1 ]
The matrix is filled based on the preferences of the decision maker for alternative i over alternative j , using the pairwise comparisons in Table 3. The preferences for only the upper triangle of the matrix are collected, using a pairwise comparison questionnaire. The lower triangle of the matrix is filled by the reciprocal of the decision maker’s preference as per Equation (2) [43].
a i j = 1 a j i ( f o r   i , j = 1 , 2 , , n )
where a i j is established based on the scale of importance numbered 1–9, and decision makers judge considering: (1) equal importance and (9) extreme importance [47], Table 3.
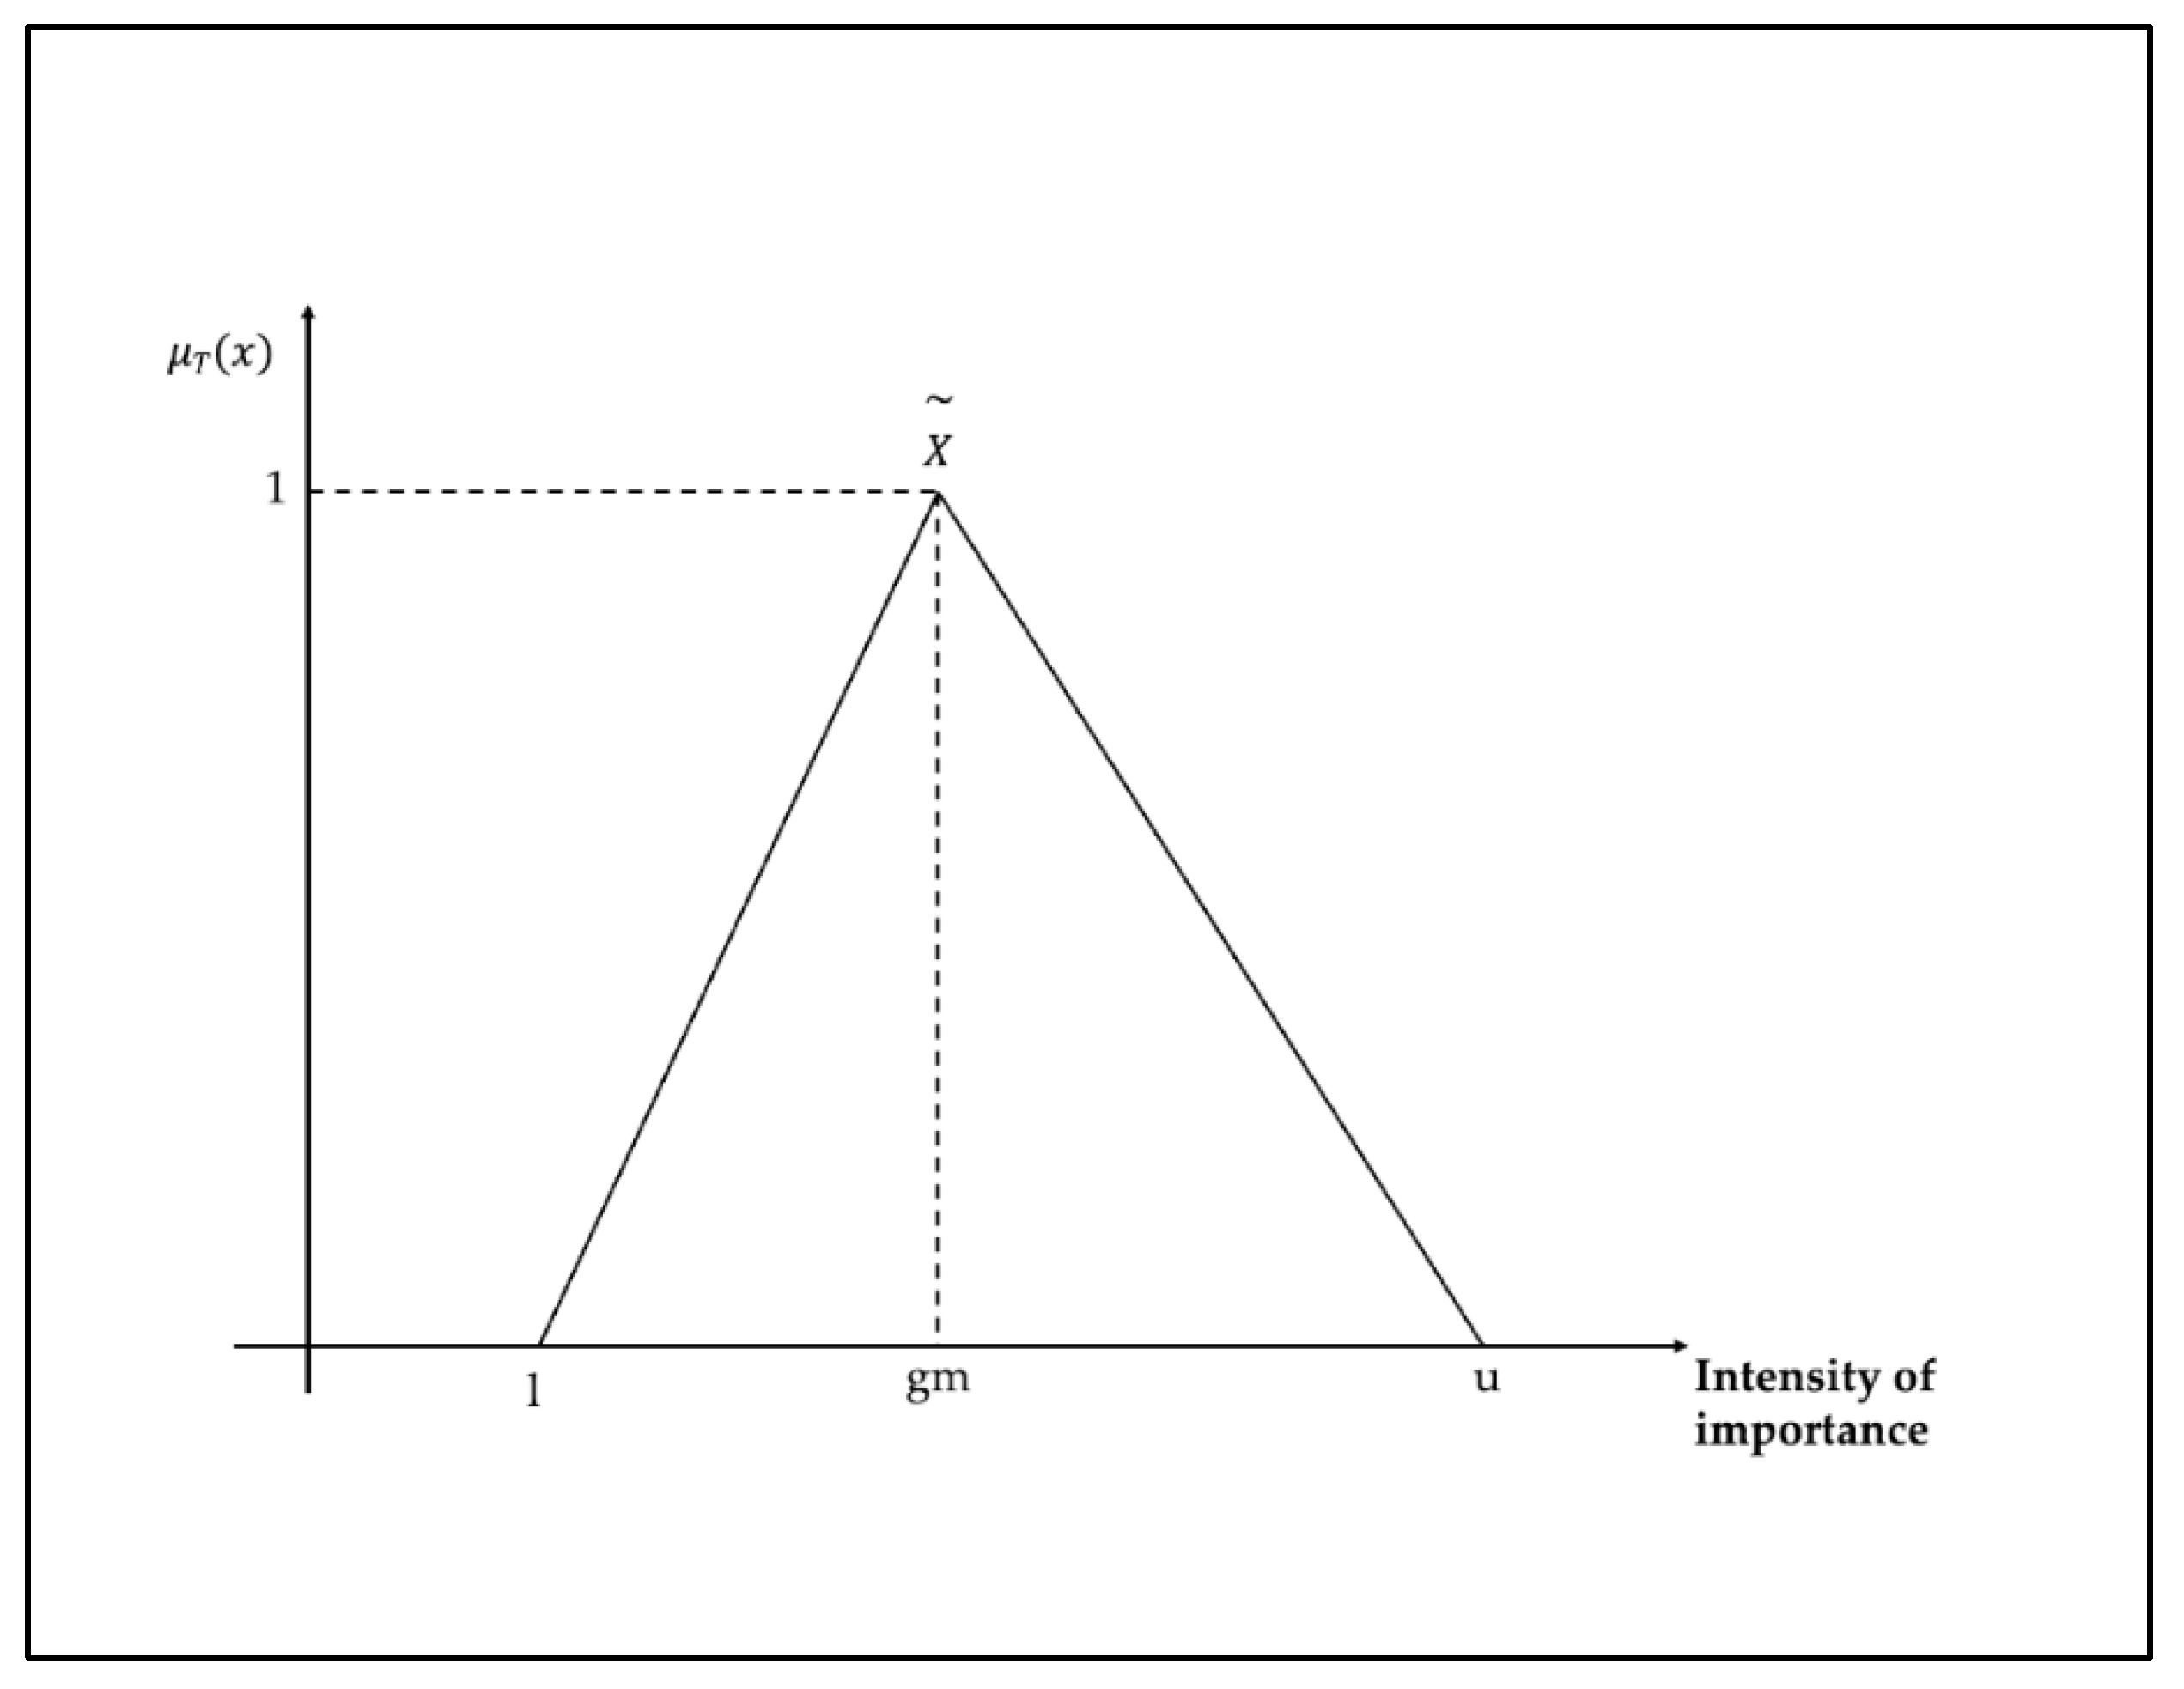
In the AHP, the decision maker or group decision provides perception-based judgment intervals rather than a deterministic preference, creating a kind of uncertainty that can be modeled using fuzzy set theory [48]. Van Laarhoven and Pedrycg [44] are the first to suggest fuzzy comparisons using a triangular fuzzy number (TFN) with three values: lower, medium, and upper. Other studies followed van Laarhoven and Pedrycg’s proposition. For example, Chang [45] proposes an extended Fuzzy AHP method to calculate the weights and translate the TFN into crisp values. In our study, we adapt the model proposed by Alaqeel & Suryanarayanan [49] that expresses TFN by considering the lower value (l), the upper value (u), and the geometric mean (gm) of the upper and lower limits, as shown in Figure 3. Note that we convert Saaty’s scale used by respondents to a TFN rather than offering a direct Fuzzy scale to reduce a possible misunderstanding of participants responding to the questionnaires. This is one of the approaches of Fuzzy AHP [50].
Where μ T ( x ) is a triangular fuzzy number (crisp weight) [44,45,49,50] as a result of Equation (3).
w = ( l + g m + u ) 3
This fuzzy model combines the TFN approach with the geometric mean, Equation (4), that is indicated by Saaty [43] for group decisions when it is not possible to establish a consensus.
( i = 1 n a i ) 1 n = a 1 a j a n n
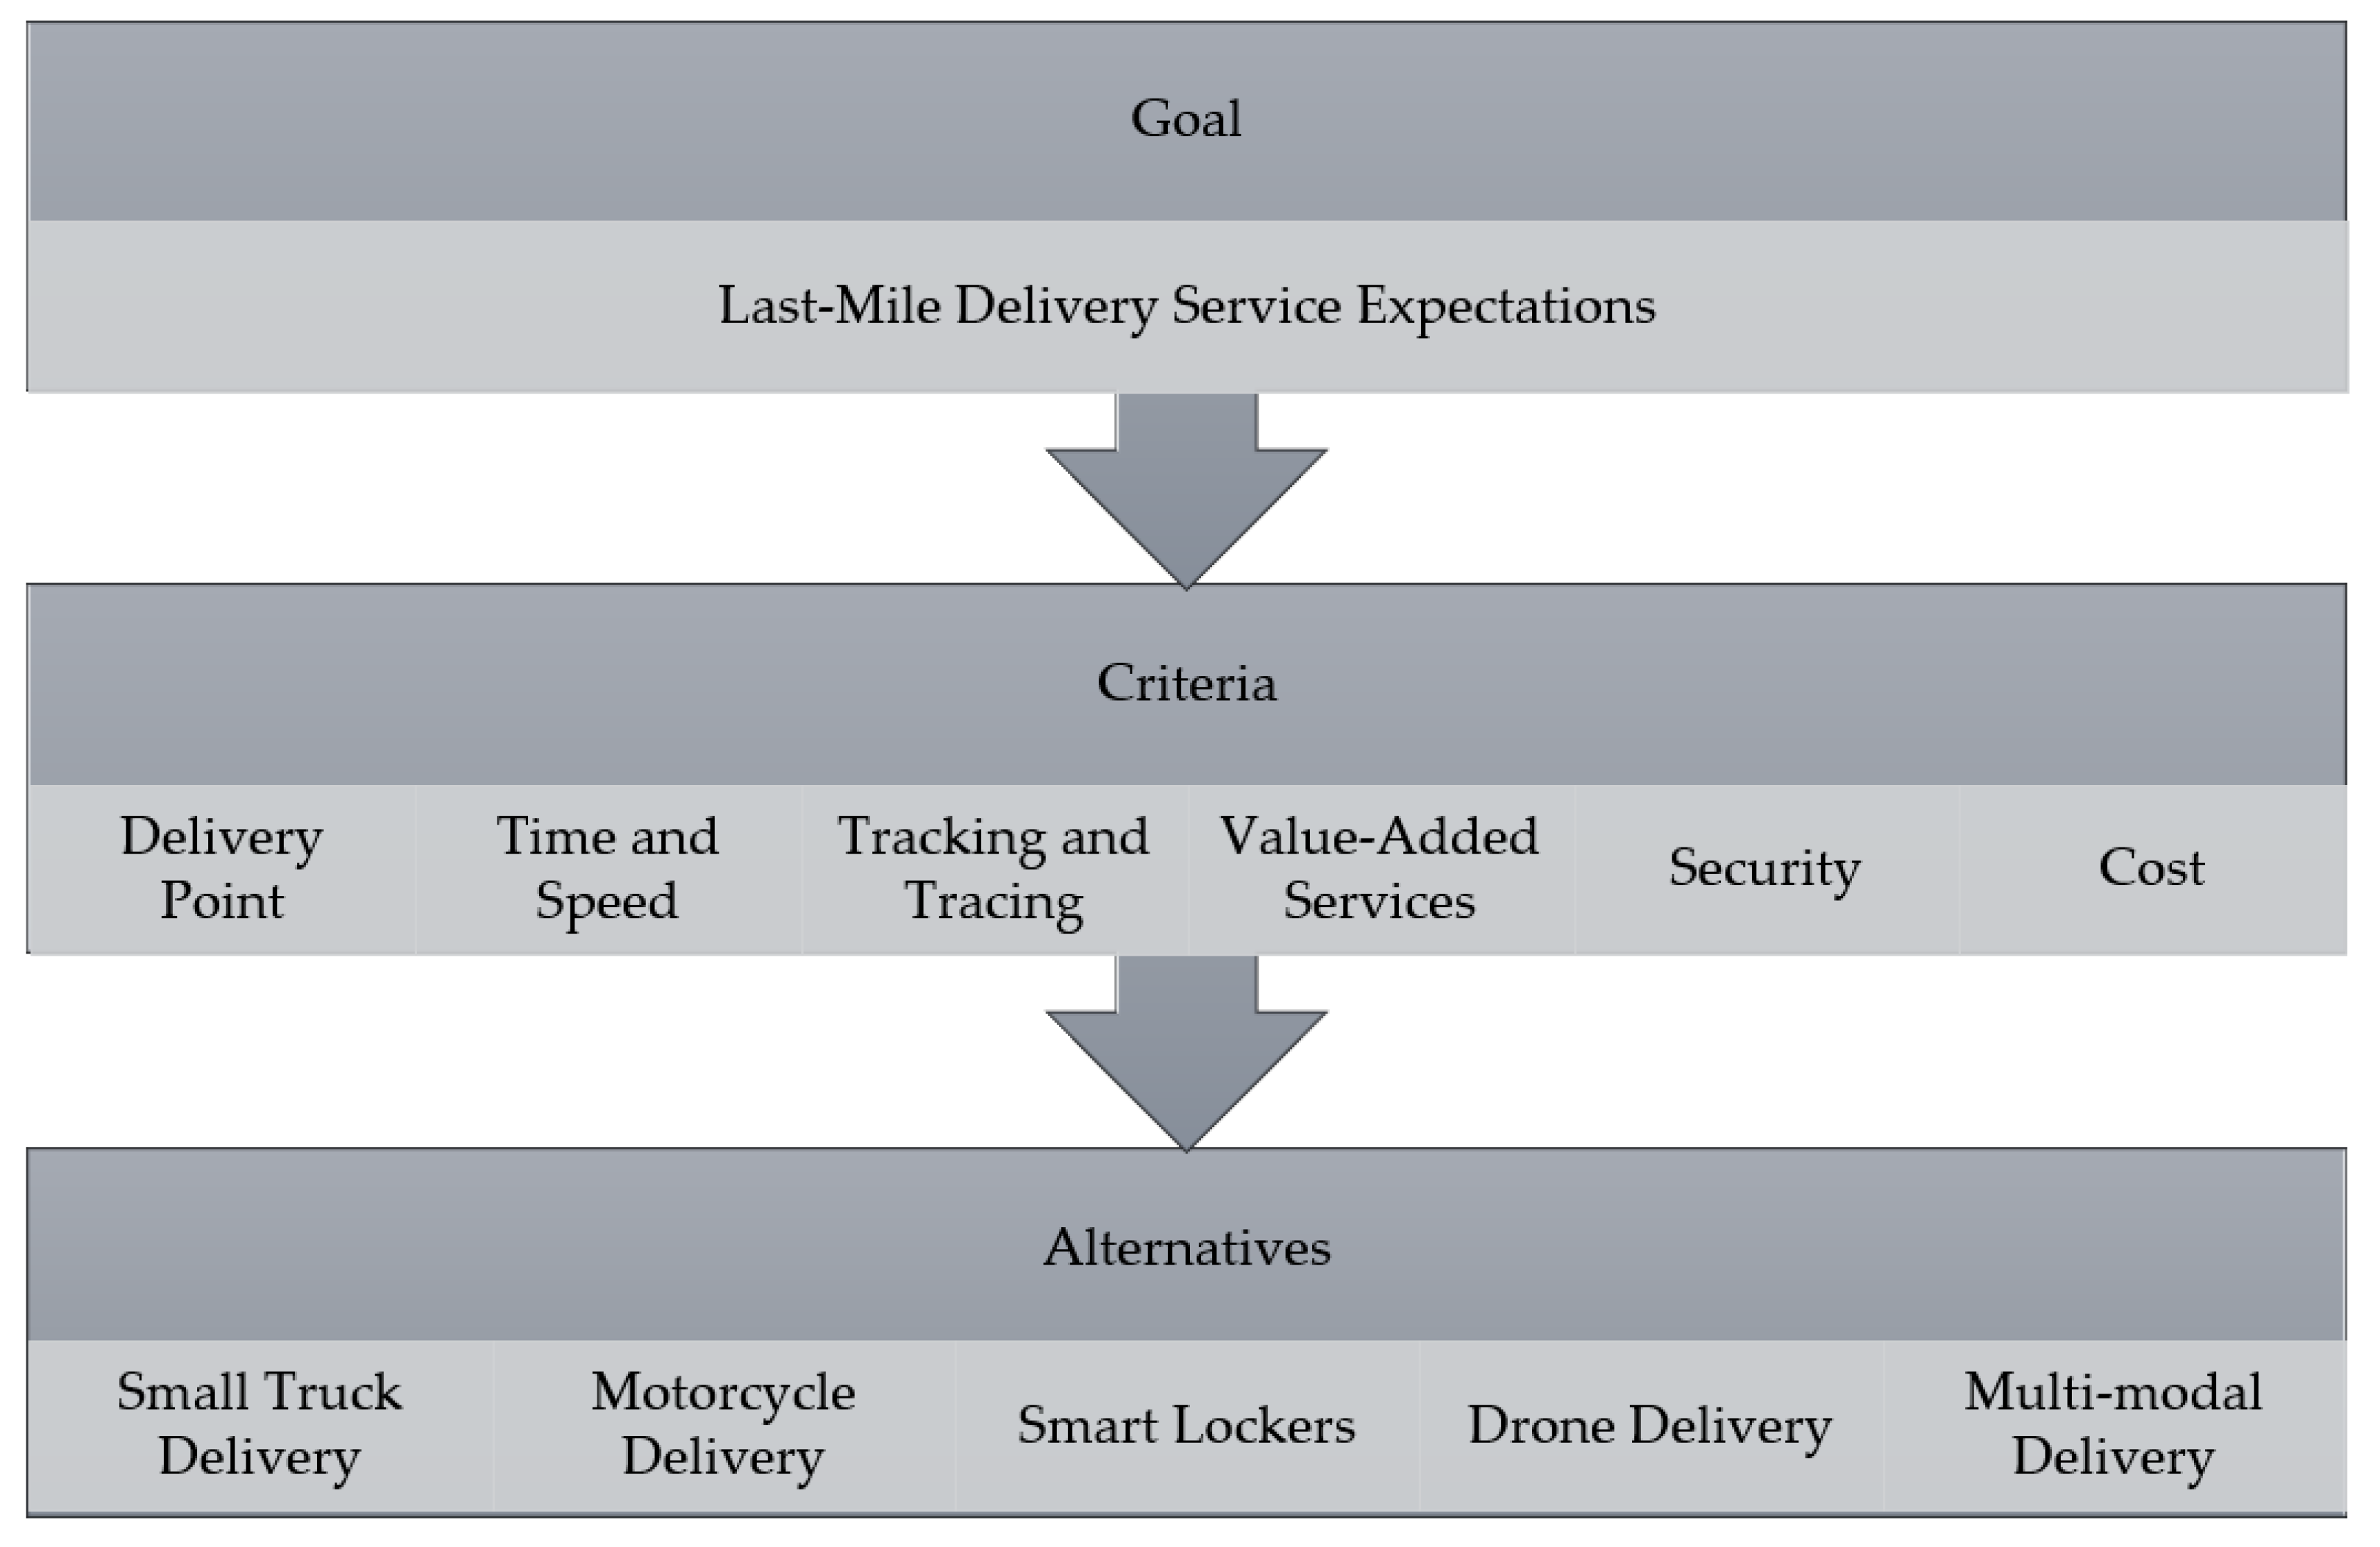
Our goal, criteria, and alternatives are based on the literature implications for the last-mile delivery service expectations. We find ground in several papers that explore the practical implications covering the consumers’ and the logistics service providers’ expectations. To cite some related to each expectation: delivery point [2,51,52]; time and speed [1,3,53,54]; tracking and trace [16,55,56]; value-added [9,57]; security [57] and cost [11,37,58,59]. Regarding alternatives, we can find: smart locker [10,11,12]; multi-modal [1,16,17,18,19,20]; small truck [1,16,17,18,19,20]; motorcycle [1,16,17,18,19,20]; and drone selivery [21,22,23,24,25]. Figure 4 presents the decision hierarchy of the problem.
To obtain the weights, we prepared a questionnaire using Google Forms®. First, we applied a pilot test with (3) three academics to check whether the questions were correct and to ensure that there were no issues in the interpretation of the questions. After, we sent it to 57 experts in last-mile logistics working in academia, local third-party logistics providers, and multinational third-party logistics providers. We obtained 27 answers (academia 5; local 3PL 7; multinational 3PL 15), corresponding to a response rate of 47%. The sample was not collected statistically; we contacted players operating in the Brazilian market and sent it to professionals who accepted receiving and answering the questionnaire. However, this fact is not a limitation to the adoption of AHP that considers the group decision and the expertise of the participants [43]. Moreover, the respondents have expertise both in international and local practices.
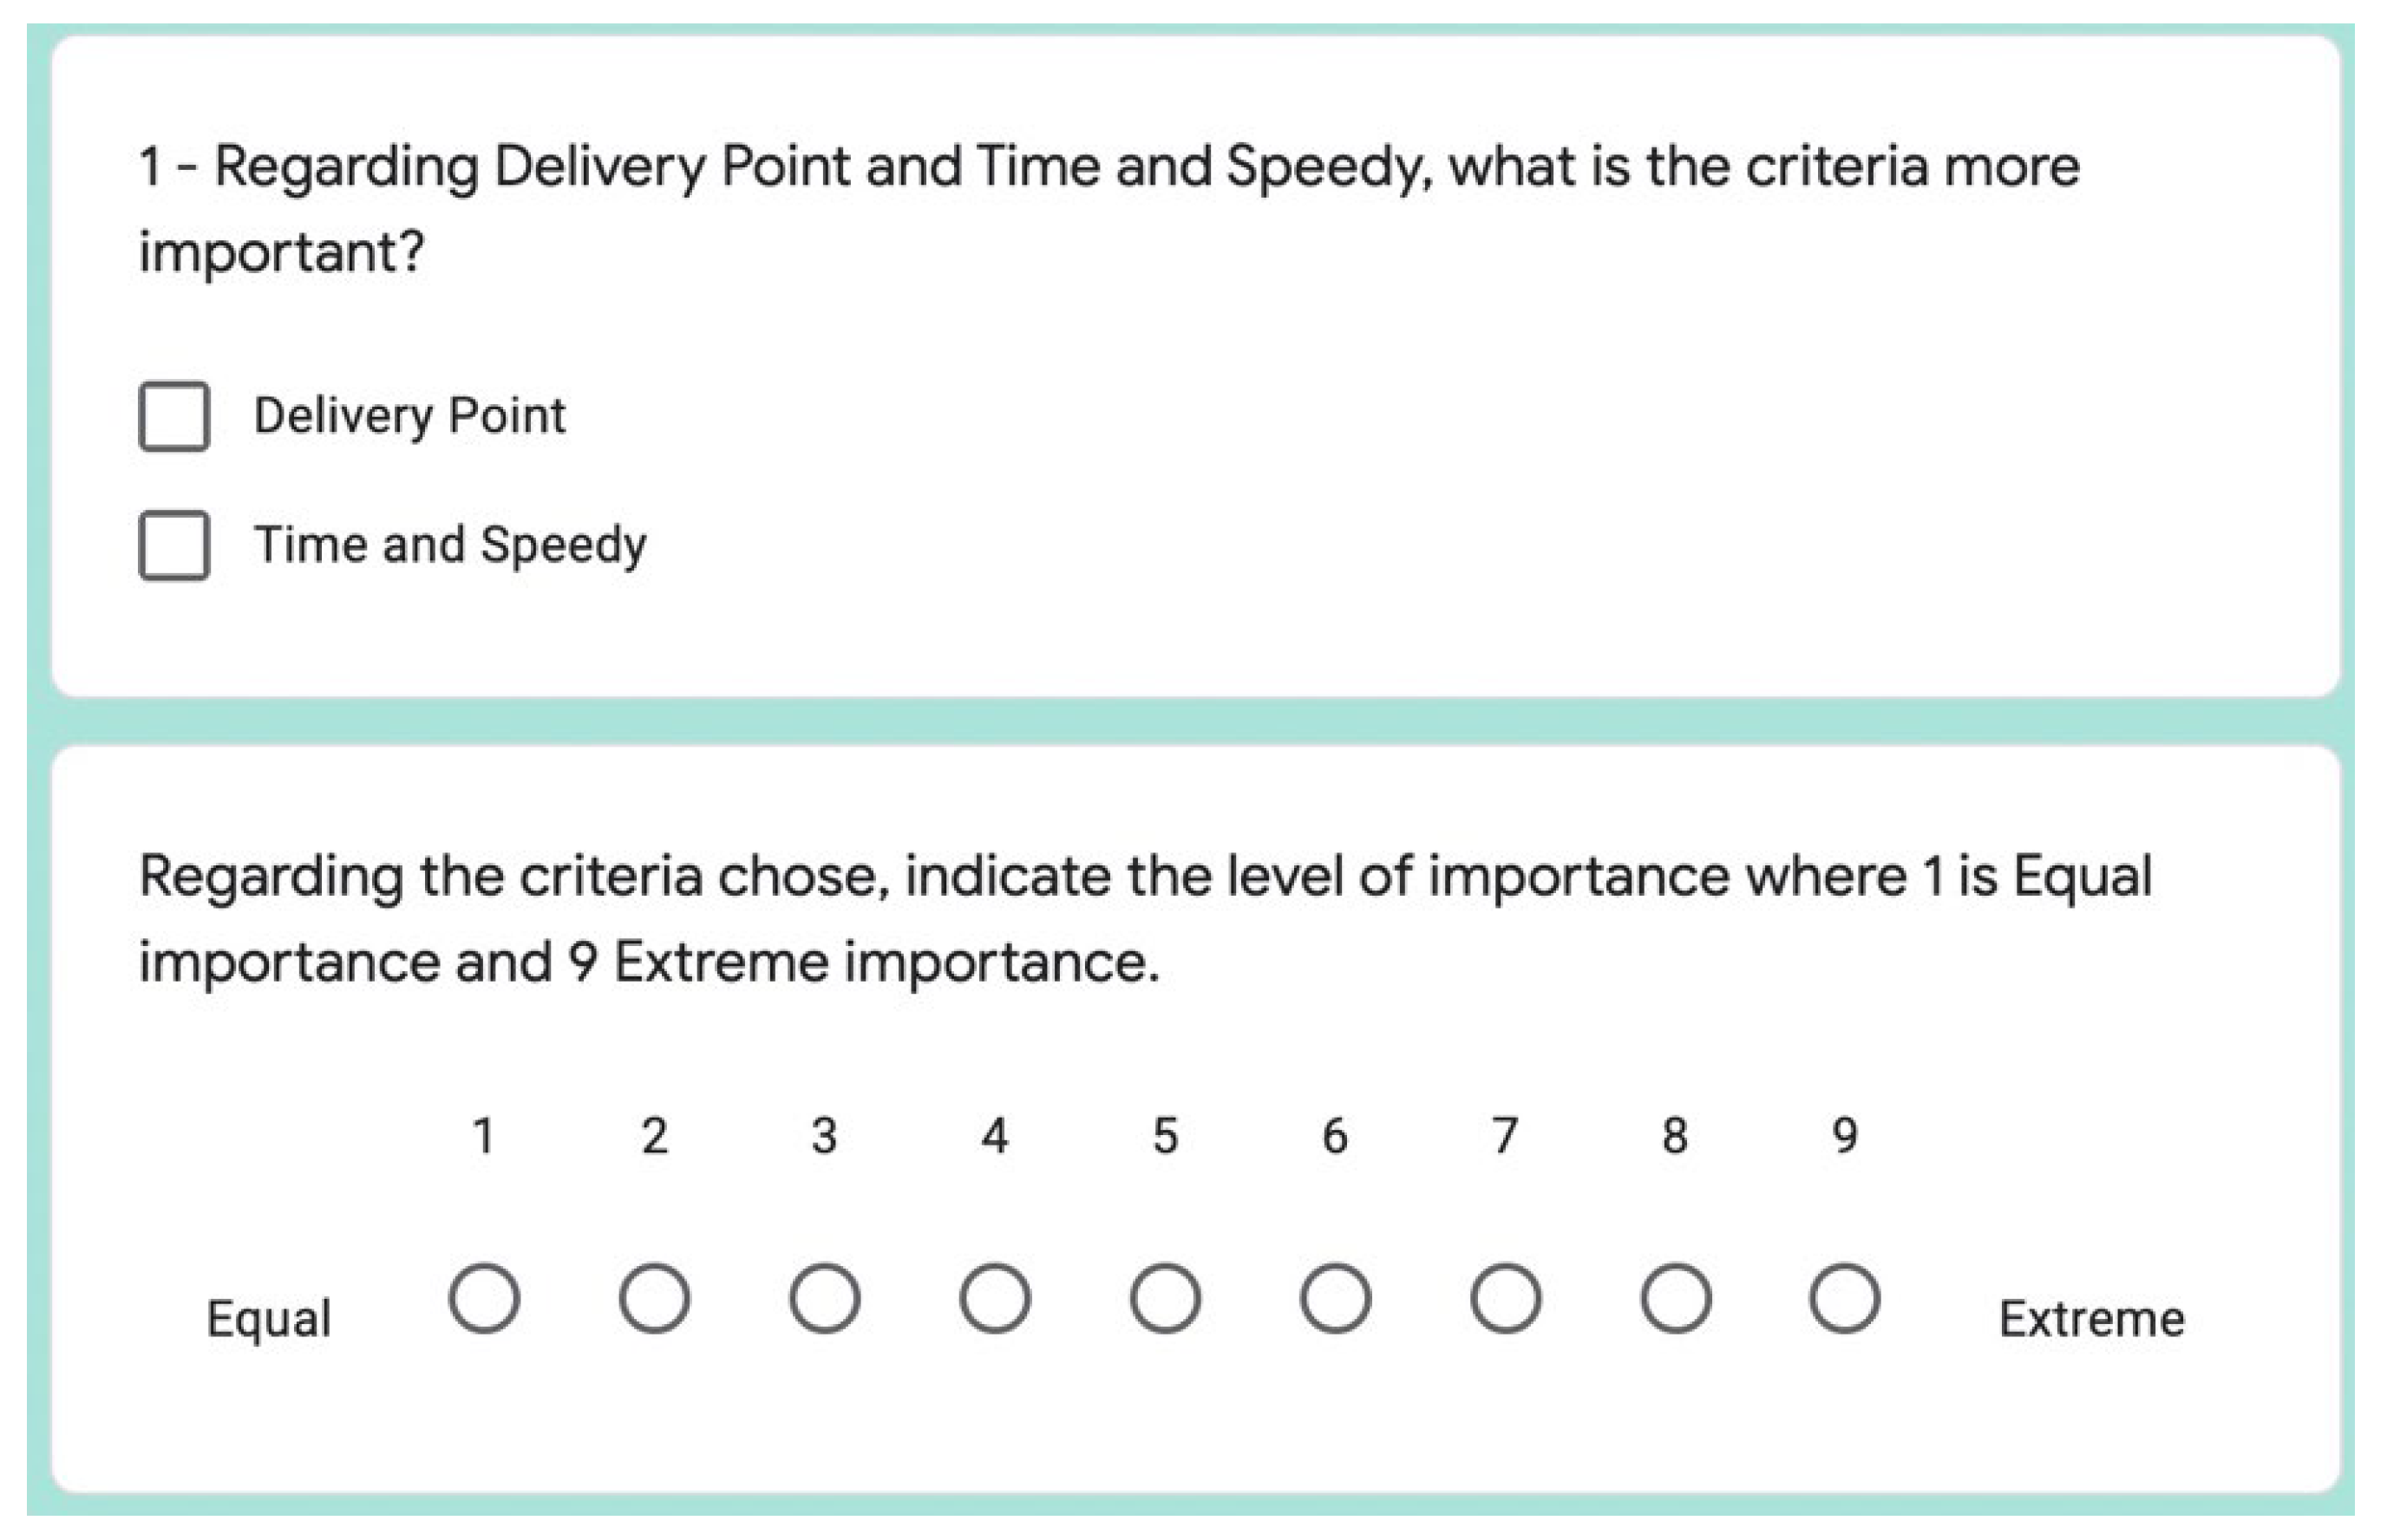
The survey was composed of seven sections and 65 questions to establish the pairwise comparison of each criterion and alternative presented, with six criteria and five alternatives. An example of how questions were applied can be seen in Figure 5. Note that in each question the respondent should indicate the preference and the value of the preference considering the Saaty scale [47]. Expert judgments are fundamental to the decision hierarchy construction in the Fuzzy AHP [60]. Finally, the respondents provided their pairwise comparisons assuming that goods could be delivered using the proposed methods.
The data collected were organized using MS Excel® by criteria and alternatives based on criteria answers. The TFNs were obtained considering the lower and upper pairwise comparisons and the geometric mean [49,61]. The crisp value obtained using Equation (3) was input into the model.
The AHP tool converts comparisons into fractions where the weight of each element in the decision model is established [43]. The comparisons help elicit relative weights of the criteria. It only remains to calculate the contribution of each alternative to the goal under each criterion. Thus, the weight of an alternative in reaching the previously established objectives is determined [62]. We created the model in Superdecisions v. 3.2 software and inserted the crisp weight in the judgments.
AHP requires to check the consistency of the model using the consistency index (CI), random consistency index (RI), and consistency ratio (CR). Xu et al. [62] explain that if the CR < 0.1, then the decision can be considered acceptable; if not, then the pairwise comparison matrix should be adjusted to remove the inconsistency. CR is used to check the inconsistency of judgments.
First, it is necessary to find the relative weights and λ m a x for each pairwise comparison matrix of order n . The λ m a x is the biggest eigenvalue of the pairwise comparison [63]. After, we calculate the consistency index (CI) for each matrix of order n by Equation (5) [43,63]:
CI = ( λ m a x   1 ) ( n 1 )
Then, the consistency ratio is calculated using Equation (5) and the random index (RI) presented in Table 4 up to a matrix with n = 9 [43,63]:
CR = CI RI
Our model using the crisp weights provided by TFN presented inconsistencies for all judgments. The consistency concept necessitates the following: if the relative importance of C1 is greater than that of C2 and the relative importance of C2 is greater than C3, then the relative importance of C1 must be greater than C3 for the evaluations to be consistent [43]. However, people are constantly making trade-offs that violate this rule and it is necessary to establish a limit to the inconsistency [43]. Therefore, for a comparison matrix that fails the consistency test, the decision maker needs to redo the pairwise comparisons [48]. This procedure is efficient in the case of one decision maker or a group decision. In the case of a survey where it is not possible to obtain new judgments from respondents, an option is to reduce weight values by seeking a consistent index [43,47]; however, there is a chance of modifying group decisions.
All those things considered, we decided to control inconsistency by converting the crisp weight values obtained from TFN for Saaty’s scale for tied activities that range from 1.1. to 1.9, where moderate is 1.3 and extreme is 1.9 [43,47,64]. We noted that respondents used pairwise comparisons of attribute values close to the edge of the scale, making the decision nearly indistinguishable because there is no variation in the importance scale. In those cases, when the elements are close or nearly indistinguishable, Saaty [43,47,64] suggests the use of scale to tied activities; to do so, we assume the Equation (7) based on Saaty’s observations [43,47,64] converting crisp weight w in a tied activity weight into w .
w = 1 + ( w 10 )
The crisp weight w was inserted into the model in the Superdecisions software and the decision choices were sustained; however, the consistency of the model was improved and the decision weights were adjusted to the correct parameters. Table 5 presents CR obtained from the initial matrix and after the adjustment.

4. Results and Discussion

Our results are presented in Table 6.
Smart lockers are considered the best alternative that shows an alignment from the last-mile delivery providers operating in Brazil with the world’s trends. Click and collect using lockers is a growing trend in the United States, insofar as consumers found convenience and cost savings in purchasing online and picking up their order on the way home from work or while running errands [65]. In the UK, which has the greatest proportion of online sales in Europe, click and collect was implemented in a multi-channel retailing approach with lockers in train and petrol stations and post offices, where 46.5% of customers of the fashion sector use this type of service [66]. In Brazil, smart lockers are not a complete reality in the country, but it is a trend to avoid delivery in dangerous zones and open a new option for customers to collect their goods when there is no one to receive them at home.
Small trucks are the second option, very close to the smart lockers. This delivery system is currently the most common alternative in Brazil due to its distribution of freight transport modes and urban areas restrictions. However, the maintenance costs, oil and gas, and related labor costs impact last-mile delivery providers. In 2021, the regulatory oil and gas company, Petrobras, boosted the price of wholesale fuel by more than 46%. Due to the Russia/Ukraine war, petrol barrel prices increased diesel by more than 25% and gasoline by more than 19% in March 2022, corresponding to an average price of diesel at 1.28 USD/l [67] and gasoline at 1.39 USD/l. Given this context, small trucks may lose attractivity to the delivery services providers due to the high congestion index in the main cities of Brazil, which raises fuel consumption and diminishes the number of deliveries per day.
Another aspect to consider is GHG emissions by small trucks. Marcilio et al. [36] simulate the impact of road transport operations encompassing greenhouse gas emissions and transport time of operation routes in Brazil and conclude that we need to consider the type of delivery fleet, the age of the fleet, and the driving style that affect each scenario. However, low emission has greater transport time. They also applied a survey of 136 people in Campos dos Goytacazes, a medium-sized municipality with approximately 500,000 inhabitants located in the countryside of Rio de Janeiro State, and reported that 85.29% of those interviewed are aware that vehicles are the main culprit for GHG emissions yet there is a tendency to increase the emissions as a consequence of receiving the product in a shorter time. Moreover, Maxner et al. [68], studying urban freight emissions in the US, indicated that the challenges faced by cities are related to a lack of leadership, resources, and industry knowledge, in addition to the hurdles caused by federal and state laws. Moreover, it is difficult to create effective policies without an understanding of how many trucks operate within city limits and their operational needs.
Motorcycles in our study are in the third place. This method is common in the country due to the low price of bikes, low fuel consumption, and the high number of informal workers (people working without formal social welfare and without a minimum wage established). The system is the lowest cost alternative for fast delivery, especially in urban centers. This alternative is not mentioned in any of the papers consulted in this research, being a local alternative to compete with small trucks. However, a study by Suatmadi [69] over a motorcycle taxi system called “online ojek” in Jakarta Metropolitan Area, Indonesia, concluded that the GHG emissions reduction of motorcycle adoption is negligible compared with other transportation systems. They also suggest that both an electrification of the motorcycle fleet and the pricing of car travel could help to establish a more sustainable transport system. In Brazil, there is a slow movement toward the adoption of electric small trucks and motorcycles in urban centers boosted by Chinese manufacturers such as BYD and retailers such as B2W.
Multimodal can be seen as an alternative, but it is scarcely used in the country’s urban centers. Indeed, multimodal systems are connected to commodities’ transport for export purposes and some initiatives to allow the flow of goods between previous supply chain stages. From fulfillment distribution centers to stores or consumers’ houses, small trucks and motorcycle deliveries are predominant. Allen et al. [1] emphasize that the parcel distribution sector is highly competitive. Many independent players operate with poor vehicle utilization for low-profit margins in a “customer-focused” delivery culture. The situation presented by the authors based on the London case is the same that occurred in many cities in Brazil, suggesting that the lack of efficiency in last-mile delivery is not connected to the development of the geographical area of distribution.
Drones for commercial delivery in Brazil are a distant reality and there is no regulation of the technology yet. Even in other countries, this alternative is still embryonic. Tang and Veelenturf [70] point out that this alternative is part of Logistics 4.0, but only developed countries such as the United States, China, Australia, and Germany have successful examples so far; these countries pave the way for such emerging technologies to apply to the last-mile delivery. Another point to consider is that logistics providers realized that consumers’ responses to the introduction of the service innovation vary from excitement to concern, impacting their results and requiring a better approach to the implementation [12].
Regarding the criteria, cost remains an important element for enterprises; however, we can observe the increasing importance of other criteria such as tracking and tracing, time speed, and security. Certainly, costs are still a huge concern, especially for last-mile delivery companies. Manners-Bell [71] highlights that the express parcels industry has undergone a critical transformation over the years. At the outset, it was far from certain that many of the major express players, such as UPS, FedEx, or DHL, would embrace home delivery due to the high costs involved in the number of undelivered parcels caused by “not-at-home” end recipients. Nowadays, B2C is an important part of the major players’ thinking and revenues. The criteria results presented in this research merge those major international players with local players, giving a more realistic perspective from Brazil.
The second most important criterion is tracking and tracing, which reflects experts’ perceptions that consumers are concerned to follow their goods from the moment of purchase until the delivery point. Delfmann et al. [72] say that ICT solutions permit common access to data by business partners, e.g., logistics service providers, shippers, and subcontractors, via the cloud in real time. This data can include sender-related and recipient-related order statuses as well as available resources. The challenge in Brazil is due to its dimension. There are more than 724 thousand independent carriers and 103 million registered cargo vehicles [35]. The question of how to connect all subcontractors under a real-time cloud at a low cost remains unanswered.
Security concern is a rising element in last-mile delivery, especially in Brazil. Security has brought a more holistic role for the last-mile delivery, encompassing not only cargo risk related but also health risk. Schwab et al. [73] alert that manifestation through persistent and emerging risks to human health, rising unemployment, widening digital divides, and youth disillusionment can have severe consequences in an era of compounded economic, environmental, geopolitical, and technological risks.
The criteria of time and speed are divergent regarding their perception in Brazil due to the characteristics of the market, where some consumers are interested in paying less for cargo freight even with an increase in delivery time, while others are pressuring logistics providers to establish a fast delivery process. When compared with the US, Manners-Bell [71] points out that delivery times are getting ever faster, with the number of same-day and one- or two-hour delivery services rising, which is having a knock-on effect on customer expectations. Shao et al. [3] indicate that different products are normally transported by different suppliers; however, customers wish to receive all products together within a small window of time that impacts directly the logistics providers’ transport decision to ensure high levels of customer satisfaction.
Regarding delivery point perspective, the experts indicated a low priority among the criteria. Kedia et al. [74] asserted that the number of customers missing home deliveries has increased and they mentioned the example of New Zealand, where over 10% of home deliveries fail on the first attempt. On the other hand, Bjerkan [2] expresses a trend of Norwegian consumers to use pick-up points such as smart lockers mainly for small packages such as electronics products. The influence of culture can be one factor for consumers to express different behaviors. As presented in the Brazilian case, smart lockers are related more to security reasons to avoid delivering high-value goods in dangerous/unsafe zones.
According to experts, value-added service is the lowest-rated criterion; this could reflect the shift in the retail market, where businesses are adapting to the new scenarios and trying to figure out the contemporary concept of value-added services at this point. Lipsman [65] suggests that the destruction of old retail will allow modern concepts to emerge; new flagships, store-of-the-future concepts, small-footprint D2C locations, click-and-collect hubs, and dark stores will begin to dot the brick-and-mortar landscape, giving us a glimpse of what the next-generation retail has in store. Wang et al. [9], studying the Singaporean case, suggest that a way to add value to clients and reduce the costs of home delivery no attendance is to create a bunch of pop stations distributed around the city and a large pool of workers who are ready to accept the delivery tasks from pop stations to the consumers’ addresses similar to the transport applications of goods. In Brazil, we identify that these initiatives are connected to small packages among clients and not regarding the B2C sector due to the risks of the operation.
Finally, it is necessary to infer that those results presented in Table 6 show close percentage values—mainly regarding the alternatives—which can be attributed to the fact that the options are complementary, not exclusive. In unsafe zones, the use of smart lockers on safe easy access points can be a good choice, while the traffic jams can be mitigated by the use of motorcycles. Moreover, it is important to consider that some of the options are not yet available in many areas, or are in trial phase, but even so there is a perspective to include them in the last-mile delivery process due to the necessity of the sector to have different forms to attend to consumers’ expectations.

5. Sensitivity Analysis

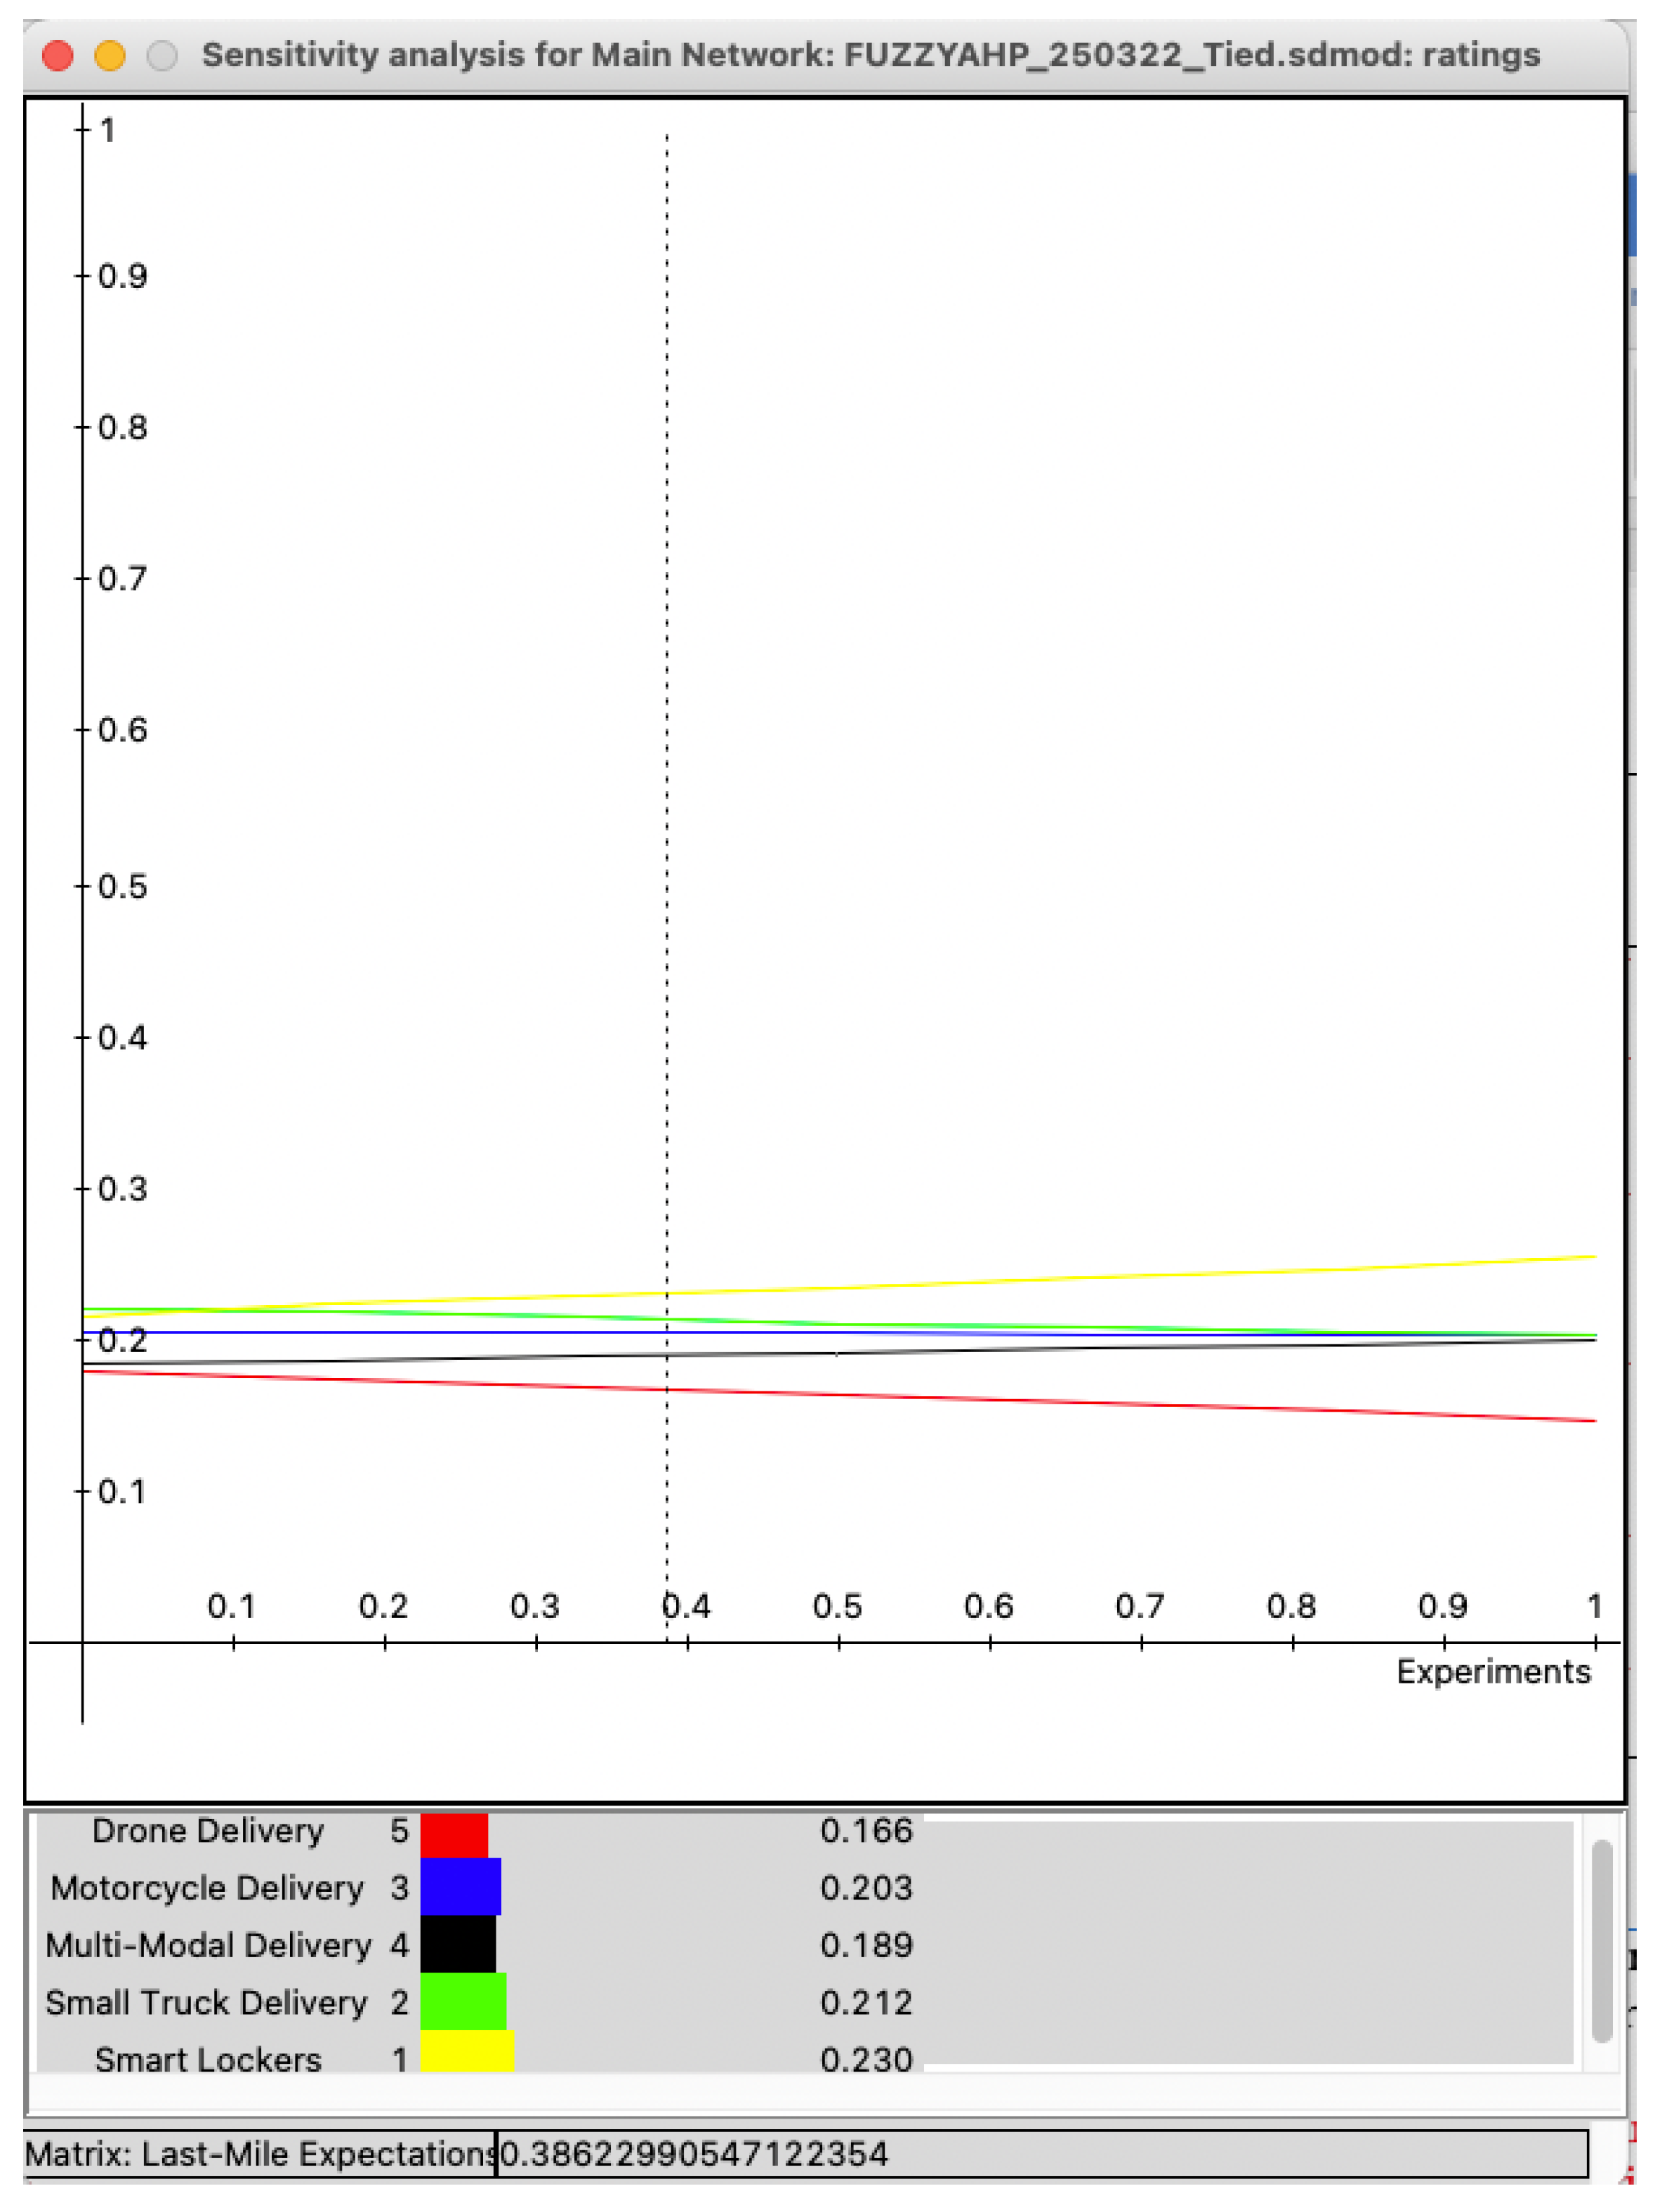
To validate and test the robustness of our Fuzzy AHP model, we conducted a sensitivity analysis. We adopted the goal as an independent variable, last-mile delivery service expectations, and chose the cost criterion as the highest rated. The sensitivity result can be seen in Figure 6 extracted from the Superdecisions software. Note that the vertical axis means the weight of the alternative obtained, while the horizontal axis means the weight of the criteria.
Based on the sensitivity analysis, when the weight of the cost criterion increases (vertical line to the right), there are no changes in priority order; multimodal delivery tends to be equalized with motorcycle delivery, the small truck tends to lose its importance, and the drone is not a solution in that scenario. Otherwise, if the weight of the cost criterion tends to reduce (vertical line to the left), small trucks assume the priority position. The cost criterion will continue to be the most important criterion for the logistics service providers in Brazil. Therefore, smart lockers are recommended for the last-mile delivery solution. At the same time, it is possible to conclude that drone delivery remains a desire rather than a practical action of companies for the next years, at least in Brazil.

6. Conclusions

This paper adopted a multiple-criteria decision support system using a Fuzzy Analytical Hierarchy Process (FAHP) to identify the impact of logistics service expectations over delivery methods in the context of last-mile delivery. To achieve this objective, we built a FAHP decision-making hierarchy considering the recent literature on the topic and tested the model proposed in a survey with last-mile professionals in Brazil linked to the academia, local, and multinational third-party logistics providers to obtain the weights of the logistics service criteria as a group decision. As mentioned earlier, the country provides an interesting case due to its continental size and differences in development among regions. Thus, the survey respondents need to see the last-mile delivery in a holistic view, which may bring contributions that permit to compare the results of the research with international perspectives.
Our research opened a new perspective related to the last-mile delivery e-commerce expectations, focusing on logistics providers’ angles rather than the final consumer experience. The objective was to look inside logistics companies (local and multinational) to understand how those companies consider providing a better experience for e-consumers.
The fuzzy analytic hierarchy process enabled us to have a more holistic perspective and comprehend the most applicable criteria for the last-mile delivery service providers. Our results provide evidence for not only a cost-driven statement but for opening new possibilities in terms of e-commerce last-mile delivery innovation and investments.
The indication that experts’ predilection for smart lockers as the number one priority alternative, overpassing small trucks, and considering Brazil’s transportation freight distribution—majority road transport—made this choice not so obvious. These results could suggest a desire of logistics providers to consider innovative e-commerce solutions and may lead the industry to draw a new chapter in Brazilian last-mile delivery.
Considering that, the cost is the main criterion and the pressure of customers over logistics providers to receive products faster has a direct impact on increasing GHG emissions. Insofar as the e-commerce demand increases, the use of small trucks and motorcycles suffers the same effect occurring in the rise of GHG emissions. However, the expectation of logistics providers in adopting more collective methods such as small lockers located in places of high concentration of people movements such as subway stations and the use of more electric small trucks can be a hope on the horizon of Brazilian last-mile delivery.
As the limitation of the work, our results should be seen as exploratory, because we tested only using the Brazilian case. However, given that many respondents are researching the topic or working in multinational companies, the results found may have been influenced by worldwide practices. Another aspect to be considered is that last-mile delivery is influenced by local culture. Therefore, it would be interesting to test the Fuzzy AHP adopted in this research in a different scenario in the future to compare with our results obtained with the application of the decision model among Brazilian logistics operators. Eventually, we should consider that results cannot be generalized to Brazil as a whole. The country is of continental size with huge differences among regions, and more tests should be conducted in the future to compare results by observing the behavior of last-mile delivery for the different areas.
Finally, we believe that the findings of this paper can contribute to the theory of last-mile delivery in this sense to comprehend the challenges of logistics providers related to the consumers’ evolving behavior toward the e-commerce segment. Moreover, the practical implications of this study are to show that there is a gap between the actual mode of last-mile delivery and the new technologies to be inserted into the sector. At the same time, the environmental impacts of last-mile delivery need to be further explored regarding the alternatives of transportation. Another point that this paper advances in the theoretical and practical implications of the last-mile delivery is that the decision-making model proposed in this paper is not yet fully adopted in the sector, but it informs experimental new developments in the sector. At the same time, professionals across the world can be faced with comparable developments and can use the approach described here to think over the future of the final leg of logistics for B2C delivery services.
For future research, we suggest the enhancement of the model with new delivery technologies as alternatives and additional criteria. Additionally, applying the decision model on an international scale will be a promising research avenue.

Author Contributions

Conceptualization, F.A.d.A. and J.G.M.d.R.; methodology, F.A.d.A. and J.G.M.d.R.; software, F.A.d.A. and J.G.M.d.R.; validation, F.A.d.A., J.G.M.d.R., M.T.d.S. and E.A.; formal analysis, J.G.M.d.R., M.T.d.S. and E.A.; investigation, F.A.d.A.; resources, F.A.d.A. and J.G.M.d.R.; data curation, F.A.d.A., J.G.M.d.R., M.T.d.S. and E.A.; writing—original draft preparation, F.A.d.A. and J.G.M.d.R.; writing—review and editing, J.G.M.d.R., M.T.d.S. and E.A.; visualization, F.A.d.A., J.G.M.d.R., M.T.d.S. and E.A.; supervision, J.G.M.d.R., M.T.d.S. and E.A.; project administration, F.A.d.A. and J.G.M.d.R.; funding acquisition, F.A.d.A. All authors have read and agreed to the published version of the manuscript.

Funding

This research was funded by CAPES, grant number 001.

Institutional Review Board Statement

The study was conducted in accordance with the Declaration of Helsinki, and approved by the Ethics Committee of UNIVERSIDADE PAULISTA (protocol code 4.805.843 and 25 June 2021).

Informed Consent Statement

The consent was obtained from all subjects involved in the study.

Data Availability Statement

The data presented in this study are available on request from the corresponding author. The data are not publicly available due to confidentiality of professionals and companies involved.

Acknowledgments

Our sympathy to all victims of COVID-19.

Conflicts of Interest

The authors declare no conflict of interest.

References

  1. Allen, J.; Piecyk, M.; Piotrowska, M.; McLeod, F.; Cherrett, T.; Ghali, K.; Nguyen, T.; Bektas, T.; Bates, O.; Friday, A.; et al. Understanding the impact of e-commerce on last-mile light goods vehicle activity in urban areas: The case of London. Transp. Res. Part D Transp. Environ. 2018, 61, 325–338. [Google Scholar] [CrossRef] [Green Version]
  2. Bjerkan, K.Y.; Bjørgen, A.; Hjelkrem, O.A. E-Commerce and prevalence of last mile practices. Transp. Res. Procedia 2020, 46, 293–300. [Google Scholar] [CrossRef]
  3. Shao, S.; Xu, G.; Li, M.; Huang, G.Q. Synchronizing e-commerce city logistics with sliding time windows. Transp. Res. Part E Logist. Transp. Rev. 2019, 123, 17–28. [Google Scholar] [CrossRef]
  4. Trott, M.; Baur, N.-F.; der Landwehr, M.A.; Rieck, J.; von Viebahn, C. Evaluating the role of commercial parking bays for urban stakeholders on last-mile deliveries—A consideration of various sustainability aspects. J. Clean. Prod. 2021, 312, 1–15. [Google Scholar] [CrossRef]
  5. Zhang, X.; Zhou, G.; Cao, J.; Wu, A. Evolving strategies of e-commerce and express delivery enterprises with public supervision. Res. Transp. Econ. 2020, 80, 100810. [Google Scholar] [CrossRef]
  6. Seghezzi, A.; Mangiaracina, R.; Tumino, A.; Perego, A. ‘Pony Express’ crowdsourcing logistics for last-mile delivery in b2c e-commerce: An economic analysis. J. Logist. Res. Appl. 2020, 24, 456–472. [Google Scholar] [CrossRef]
  7. Lim, S.F.W.T.; Srai, J.S. Examining the anatomy of last-mile distribution in e-commerce omnichannel retailing: A supply network configuration approach. Int. J. Oper. Prod. Manag. 2018, 38, 1735–1764. [Google Scholar] [CrossRef] [Green Version]
  8. Mangiaracina, R.; Perego, A.; Seghezzi, A.; Tumino, A. Innovative solutions to increase last-mile delivery efficiency in B2C e-commerce: A literature review. Int. J. Phys. Distrib. Logist. Manag. 2019, 49, 901–920. [Google Scholar] [CrossRef]
  9. Wang, Y.; Zhang, D.; Liu, Q.; Shen, F.; Lee, L.H. Towards enhancing the last-mile delivery: An effective crowd-tasking model with scalable solutions. Transp. Res. Part E Logist. Transp. Rev. 2016, 93, 279–293. [Google Scholar] [CrossRef]
  10. Iwan, S.; Kijewska, K.; Lemke, J. Analysis of parcel lockers’ efficiency as the last mile delivery solution: The results of the research in Poland. Transp. Res. Procedia 2016, 12, 644–655. [Google Scholar] [CrossRef] [Green Version]
  11. Lin, Y.H.; Wang, Y.; He, D.; Lee, L.H. Last-mile delivery: Optimal locker location under multinomial logit choice model. Transp. Res. Part E Logist. Transp. Rev. 2020, 142, 102059. [Google Scholar] [CrossRef]
  12. Vakulenko, Y.; Hellström, D.; Hjort, K. What’s in the parcel locker? Exploring customer value in e-commerce last mile delivery. J. Bus. Res. 2018, 88, 421–427. [Google Scholar] [CrossRef]
  13. Aljohani, K.; Thompson, R.G. An examination of last mile delivery practices of freight carriers servicing business receivers in inner-city areas. Sustainability 2020, 12, 2837. [Google Scholar] [CrossRef] [Green Version]
  14. Gonzalez-R, P.L.; Canca, D.; Andrade-Pineda, J.L.; Calle, M.; Leon-Blanco, J.M. Truck-drone team logistics: A heuristic approach to multi-drop route planning. Transp. Res. Part C Emerg. Technol. 2020, 114, 657–680. [Google Scholar] [CrossRef]
  15. Lu, E.H.-C.; Yang, Y.-W. A hybrid route planning approach for logistics with pickup and delivery. Expert Syst. Appl. 2019, 118, 482–492. [Google Scholar] [CrossRef]
  16. Altenried, M. On the last mile: Logistical urbanism and the transformation of labour. Work. Organ. Labour Glob. 2019, 13, 114–129. [Google Scholar] [CrossRef]
  17. Balm, S.; van Amstel, W.P.; Habers, J.; Aditjandra, P.; Zunder, T.H. The purchasing behavior of public organizations and its impact on city logistics. Transp. Res. Procedia 2016, 12, 252–262. [Google Scholar] [CrossRef] [Green Version]
  18. Caragliu, A.; Del Bo, C.F. Smart Innovative Cities: The impact of smart city policies on urban innovation. Technol. Forecast. Soc. Chang. 2019, 142, 373–383. [Google Scholar] [CrossRef]
  19. Crainic, T.G.; Montreuil, B. Physical internet enabled hyperconnected city logistics. Transp. Res. Procedia 2016, 12, 383–398. [Google Scholar] [CrossRef] [Green Version]
  20. Savelsbergh, M.; Van Woensel, T. 50th anniversary invited article—City logistics: Challenges and opportunities. Transp. Sci. 2016, 50, 579–590. [Google Scholar] [CrossRef]
  21. Boysen, N.; Briskorn, D.; Fedtke, S.; Schwerdfeger, S. Drone delivery from trucks: Drone scheduling for given truck routes. Networks 2018, 72, 506–527. [Google Scholar] [CrossRef]
  22. El-Adle, A.M.; Ghoniem, A.; Haouari, M. Parcel delivery by vehicle and drone. J. Oper. Res. Soc. 2021, 72, 398–416. [Google Scholar] [CrossRef]
  23. Giones, F.; Brem, A. From toys to tools: The co-evolution of technological and entrepreneurial developments in the drone industry. Bus. Horiz. 2017, 60, 875–884. [Google Scholar] [CrossRef]
  24. Kellermann, R.; Biehle, T.; Fischer, L. Drones for parcel and passenger transportation: A literature review. Transp. Res. Interdiscip. Perspect. 2020, 4, 100088. [Google Scholar] [CrossRef]
  25. Watkins, S.; Burry, J.; Mohamed, A.; Marino, M.; Prudden, S.; Fisher, A.; Kloet, N.; Jakobi, T.; Clothier, R. Ten questions concerning the use of drones in urban environments. Build. Environ. 2020, 167, 106458. [Google Scholar] [CrossRef]
  26. Vakulenko, Y.; Shams, P.; Hellström, D.; Hjort, K. Service Innovation in E-Commerce Last Mile Delivery: Mapping the e-Customer Journey. J. Bus. Res. 2019, 101, 461–468. [Google Scholar] [CrossRef]
  27. De Araújo, F.A.; dos Reis, J.G.M.; da Cruz Correia, P.F. The role of last-mile delivery in the future of e-commerce. In Advances in Production Management Systems. The Path to Digital Transformation and Innovation of Production Management Systems; Lalic, B., Majstorovic, V., Marjanovic, U., von Cieminski, G., Romero, D., Eds.; IFIP Advances in Information and Communication Technology; Springer International Publishing: Cham, Switzerland, 2020; Volume 591, pp. 307–314. ISBN 978-3-030-57992-0. [Google Scholar]
  28. Eliyan, A.; Elomri, A.; Kerbache, L. The Last-Mile Delivery Challenge: Evaluating the Efficiency of Smart Parcel Stations. Supply Chain Forum Int. J. 2021, 22, 360–369. [Google Scholar] [CrossRef]
  29. Kull, T.J.; Boyer, K.; Calantone, R. Last-mile supply chain efficiency: An analysis of learning curves in online ordering. Int. J. Oper. Prod. Manag. 2007, 27, 409–434. [Google Scholar] [CrossRef] [Green Version]
  30. Gevaers, R.; Van de Voorde, E.; Vanelslander, T. Characteristics and typology of last-mile logistics from an innovation perspective in an urban context. In City Distribution and Urban Freight Transport; Edward Elgar Publishing: Cheltenham, UK, 2011; p. 14398. ISBN 978-0-85793-275-4. [Google Scholar]
  31. Gevaers, R. Evaluation of Innovations in B2C Last Mile, B2C Reverse & Waste Logistics Proefschrift, Universiteit Antwerpen; Faculteit Toegepaste Economische Wetenschappen: Antwerpen, Belgium, 2013. [Google Scholar]
  32. Taniguchi, E.; Thompson, R.G.; Yamada, T.; van Duin, R. City Logistics: Network Modelling and Intelligent Transport Systems; Emerald Group Publishing Limited: Bingley, UK, 2001; ISBN 978-0-08-043903-7. [Google Scholar]
  33. Schwab, K. The Global Competitiveness Report 2019; World Economic Forum: Geneva, Switzerland, 2019; Available online: http://www3.weforum.org/docs/WEF_TheGlobalCompetitivenessReport2019.pdf (accessed on 3 April 2021).
  34. Ranieri, L.; Digiesi, S.; Silvestri, B.; Roccotelli, M. A review of last mile logistics innovations in externalities cost reduction vision. Sustainability 2018, 10, 782. [Google Scholar] [CrossRef] [Green Version]
  35. Brazilian National Confederation of Transport. Anuário CNT do Transporte 2021. Available online: https://anuariodotransporte.cnt.org.br/2020/Rodoviario/1-1-/Inicial (accessed on 28 February 2021).
  36. Marcilio, G.P.; de Assis Rangel, J.J.; de Souza, C.L.M.; Shimoda, E.; da Silva, F.F.; Peixoto, T.A. Analysis of Greenhouse Gas Emissions in the Road Freight Transportation Using Simulation. J. Clean. Prod. 2018, 170, 298–309. [Google Scholar] [CrossRef]
  37. Ministry of Infrastructure of Brazil. Infraestrutura Brasil; Ministério da Infraestrutura: Brasília, Brazil, 2020. Available online: https://www.gov.br/infraestrutura/pt-br/capa-ministerio-da-infraestrutura (accessed on 28 February 2021).
  38. PWC. Logtechs—As inovações e startups na Logística; 2019. Available online: https://insights.liga.ventures/estudos-completos/logtechs/ (accessed on 28 February 2021).
  39. Reuters. Freight Costs Slashed 6.5% in Brazil as New Pricing Table Gets Underway. Supply Chain & Logistics Business Intelligence. 2020. Available online: https://www.reutersevents.com/supplychain/freight/freight-costs-slashed-65-brazil-new-pricing-table-gets-underway (accessed on 22 April 2021).
  40. Peña, I. Tecnolatinas 2021: The LAC Startup Ecosystem Comes of Age; Inter-American Development Bank: Washington, DC, USA, 2021. [Google Scholar] [CrossRef]
  41. Revista Mundo Logística. Brasil Tem 283 Startups de Logística; 2020. Available online: https://revistamundologistica.com.br/noticias/brasil-tem-283-startups-de-logistica-conheca-as-10-maiores (accessed on 28 February 2021).
  42. Souza, C.D.O.; D’Agosto, M.D.A.; Bandeira, R.A.D.M.; Almeida, I.R.P.L.D. Soluções para o transporte urbano de cargas na etapa de última milha. Urbe. Rev. Bras. Gestão Urbana 2020, 12, e20190138. [Google Scholar] [CrossRef] [Green Version]
  43. Saaty, T.L. The Analytic Hierarchy Process: Planning, Priority Setting, Resource Allocation; McGraw-Hill International Book Company: New York, NY, USA, 1980. [Google Scholar]
  44. van Laarhoven, P.J.M.; Pedrycz, W. A Fuzzy Extension of Saaty’s Priority Theory. Fuzzy Sets Syst. 1983, 11, 229–241. [Google Scholar] [CrossRef]
  45. Chang, D.-Y. Applications of the Extent Analysis Method on Fuzzy AHP. Eur. J. Oper. Res. 1996, 95, 649–655. [Google Scholar] [CrossRef]
  46. Maletič, D.; Maletič, M.; Lovrenčić, V.; Al-Najjar, B.; Gomišček, B. An application of analytic hierarchy process (AHP) and sensitivity analysis for maintenance policy selection. Organizacija 2014, 47, 177–188. [Google Scholar] [CrossRef] [Green Version]
  47. Saaty, T.L. Decision Making with the Analytic Hierarchy Process. Int. J. Serv. Sci. 2008, 1, 83–98. [Google Scholar] [CrossRef] [Green Version]
  48. Leung, L.C.; Cao, D. On Consistency and Ranking of Alternatives in Fuzzy AHP. Eur. J. Oper. Res. 2000, 124, 102–113. [Google Scholar] [CrossRef]
  49. Alaqeel, T.A.; Suryanarayanan, S. A Fuzzy Analytic Hierarchy Process Algorithm to Prioritize Smart Grid Technologies for the Saudi Electricity Infrastructure. Sustain. Energy Grids Netw. 2018, 13, 122–133. [Google Scholar] [CrossRef]
  50. Liu, Y.; Eckert, C.M.; Earl, C. A Review of Fuzzy AHP Methods for Decision-Making with Subjective Judgements. Expert Syst. Appl. 2020, 161, 113738. [Google Scholar] [CrossRef]
  51. Hübner, A.H.; Kuhn, H.; Wollenburg, J. Last mile fulfilment and distribution in omni-channel grocery retailing: A strategic planning framework. Int. J. Retail. Distrib. Manag. 2016, 44. [Google Scholar] [CrossRef]
  52. Irakleous, A. Modeling framework for last-mile logistics services. In Proceedings of the International Conference on Traffic and Transport Engineering, Belgrade, Serbia, 27–28 September 2018. [Google Scholar]
  53. Devari, A.; Nikolaev, A.G.; He, Q. Crowdsourcing the Last Mile Delivery of Online Orders by Exploiting the Social Networks of Retail Store Customers. Transp. Res. Part E Logist. Transp. Rev. 2017, 105, 105–122. [Google Scholar] [CrossRef]
  54. Murray, C.C.; Chu, A.G. The Flying Sidekick Traveling Salesman Problem: Optimization of Drone-Assisted Parcel Delivery. Transp. Res. Part C Emerg. Technol. 2015, 54, 86–109. [Google Scholar] [CrossRef]
  55. Groß, P.-O.; Ehmke, J.F.; Haas, I.; Mattfeld, D.C. Evaluation of Alternative Paths for Reliable Routing in City Logistics. Transp. Res. Procedia 2017, 27, 1195–1202. [Google Scholar] [CrossRef]
  56. Papoutsis, K.; Nathanail, E. Facilitating the Selection of City Logistics Measures through a Concrete Measures Package: A Generic Approach. Transp. Res. Procedia 2016, 12, 679–691. [Google Scholar] [CrossRef] [Green Version]
  57. Roque-Cilia, S.; Tamariz-Flores, E.I.; Torrealba-Meléndez, R.; Covarrubias-Rosales, D.H. Transport Tracking through Communication in WDSN for Smart Cities. Measurement 2019, 139, 205–212. [Google Scholar] [CrossRef]
  58. Xu, M.; Ferrand, B.; Roberts, M. The last mile of e-commerce—unattended delivery from the consumers and eTailers’ perspectives. Int. J. Electron. Mark. Retail. 2008, 2, 20–38. [Google Scholar] [CrossRef]
  59. Gevaers, R.; Van de Voorde, E.; Vanelslander, T. Cost Modelling and Simulation of Last-Mile Characteristics in an Innovative B2C Supply Chain Environment with Implications on Urban Areas and Cities. Procedia Soc. Behav. Sci. 2014, 125, 398–411. [Google Scholar] [CrossRef] [Green Version]
  60. Wollmann, D. Analytic hierachy process suportando a avaliação por pares. Rev. Diálogo Educ. 2017, 17, 503–523. [Google Scholar] [CrossRef] [Green Version]
  61. Mu, E.; Pereyra-Rojas, M. Practical Decision Making Using Super Decisions V3; Springer Briefs in Operations Research; Springer International Publishing: Cham, Switzerland, 2018; ISBN 978-3-319-68368-3. [Google Scholar]
  62. Xu, L.; Kumar, D.T.; Shankar, K.M.; Kannan, D.; Chen, G. Analyzing criteria and sub-criteria for the corporate social responsibility-based supplier selection process using AHP. Int. J. Adv. Manuf. Technol. 2013, 68, 907–916. [Google Scholar] [CrossRef]
  63. Dwi Putra, M.S.; Andryana, S.; Fauziah; Gunaryati, A. Fuzzy Analytical Hierarchy Process Method to Determine the Quality of Gemstones. Adv. Fuzzy Syst. 2018, 1–6. [Google Scholar] [CrossRef]
  64. Saaty, T.L. Decision Making for the New Millenium: ANP Software for Dependence and Feedback; Katz Graduate School of Business, University of Pittsburgh: Pittsburgh, PA, USA, 1999; ISBN 978-1-888603-00-2. [Google Scholar]
  65. Lipsman, A. Frictionless Commerce 2020: How Coronavirus is Accelerating Seamless Omnichannel Retail; Insider Intelligence, 2020. Available online: https://www.emarketer.com/content/frictionless-commerce-2020 (accessed on 20 April 2021).
  66. Jones, C.; Livingstone, N. The ‘Online High Street’ or the High Street Online? The Implications for the Urban Retail Hierarchy. Int. Rev. Retail. Distrib. Consum. Res. 2018, 28, 47–63. [Google Scholar] [CrossRef]
  67. CNN Brasil. Petrobras Reajustou Gasolina e Diesel 13 Vezes no último ano; Alta Recente é a Maior. Available online: https://www.cnnbrasil.com.br/business/gasolina-e-diesel-da-petrobras-tem-maior-alta-desde-janeiro-de-2021/ (accessed on 17 March 2022).
  68. Maxner, T.; Dalla Chiara, G.; Goodchild, A. Identifying the Challenges to Sustainable Urban Last-Mile Deliveries: Perspectives from Public and Private Stakeholders. Sustainability 2022, 14, 4701. [Google Scholar] [CrossRef]
  69. Suatmadi, A.Y.; Creutzig, F.; Otto, I.M. On-Demand Motorcycle Taxis Improve Mobility, Not Sustainability. Case Stud. Transp. Policy 2019, 7, 218–229. [Google Scholar] [CrossRef]
  70. Tang, C.S.; Veelenturf, L.P. The strategic role of logistics in the industry 4.0 era. Transp. Res. Part E Logist. Transp. Rev. 2019, 129, 1–11. [Google Scholar] [CrossRef]
  71. Manners-Bell, J. Future of Logistics; Inter-American Development Bank: New York, NY, USA, 2019. [Google Scholar] [CrossRef]
  72. Delfmann, W.; ten Hompel, M.; Kersten, W. Logistics as a Science—Central Research Questions in the Era of the Fourth Industrial Revolution. Logist. Res. 2018, 11, 1–13. [Google Scholar]
  73. Schwab, K.; Zahidi, S.; McLennan, M. The Global Risks Report 2021, 16th ed.; World Economic Forum: Geneva, Switzerland, 2021; Available online: http://wef.ch/risks2021 (accessed on 3 April 2021).
  74. Kedia, A.; Kusumastuti, D.; Nicholson, A. Establishing Collection and Delivery Points to Encourage the Use of Active Transport: A Case Study in New Zealand Using a Consumer-Centric Approach. Sustainability 2019, 11, 6255. [Google Scholar] [CrossRef] [Green Version]
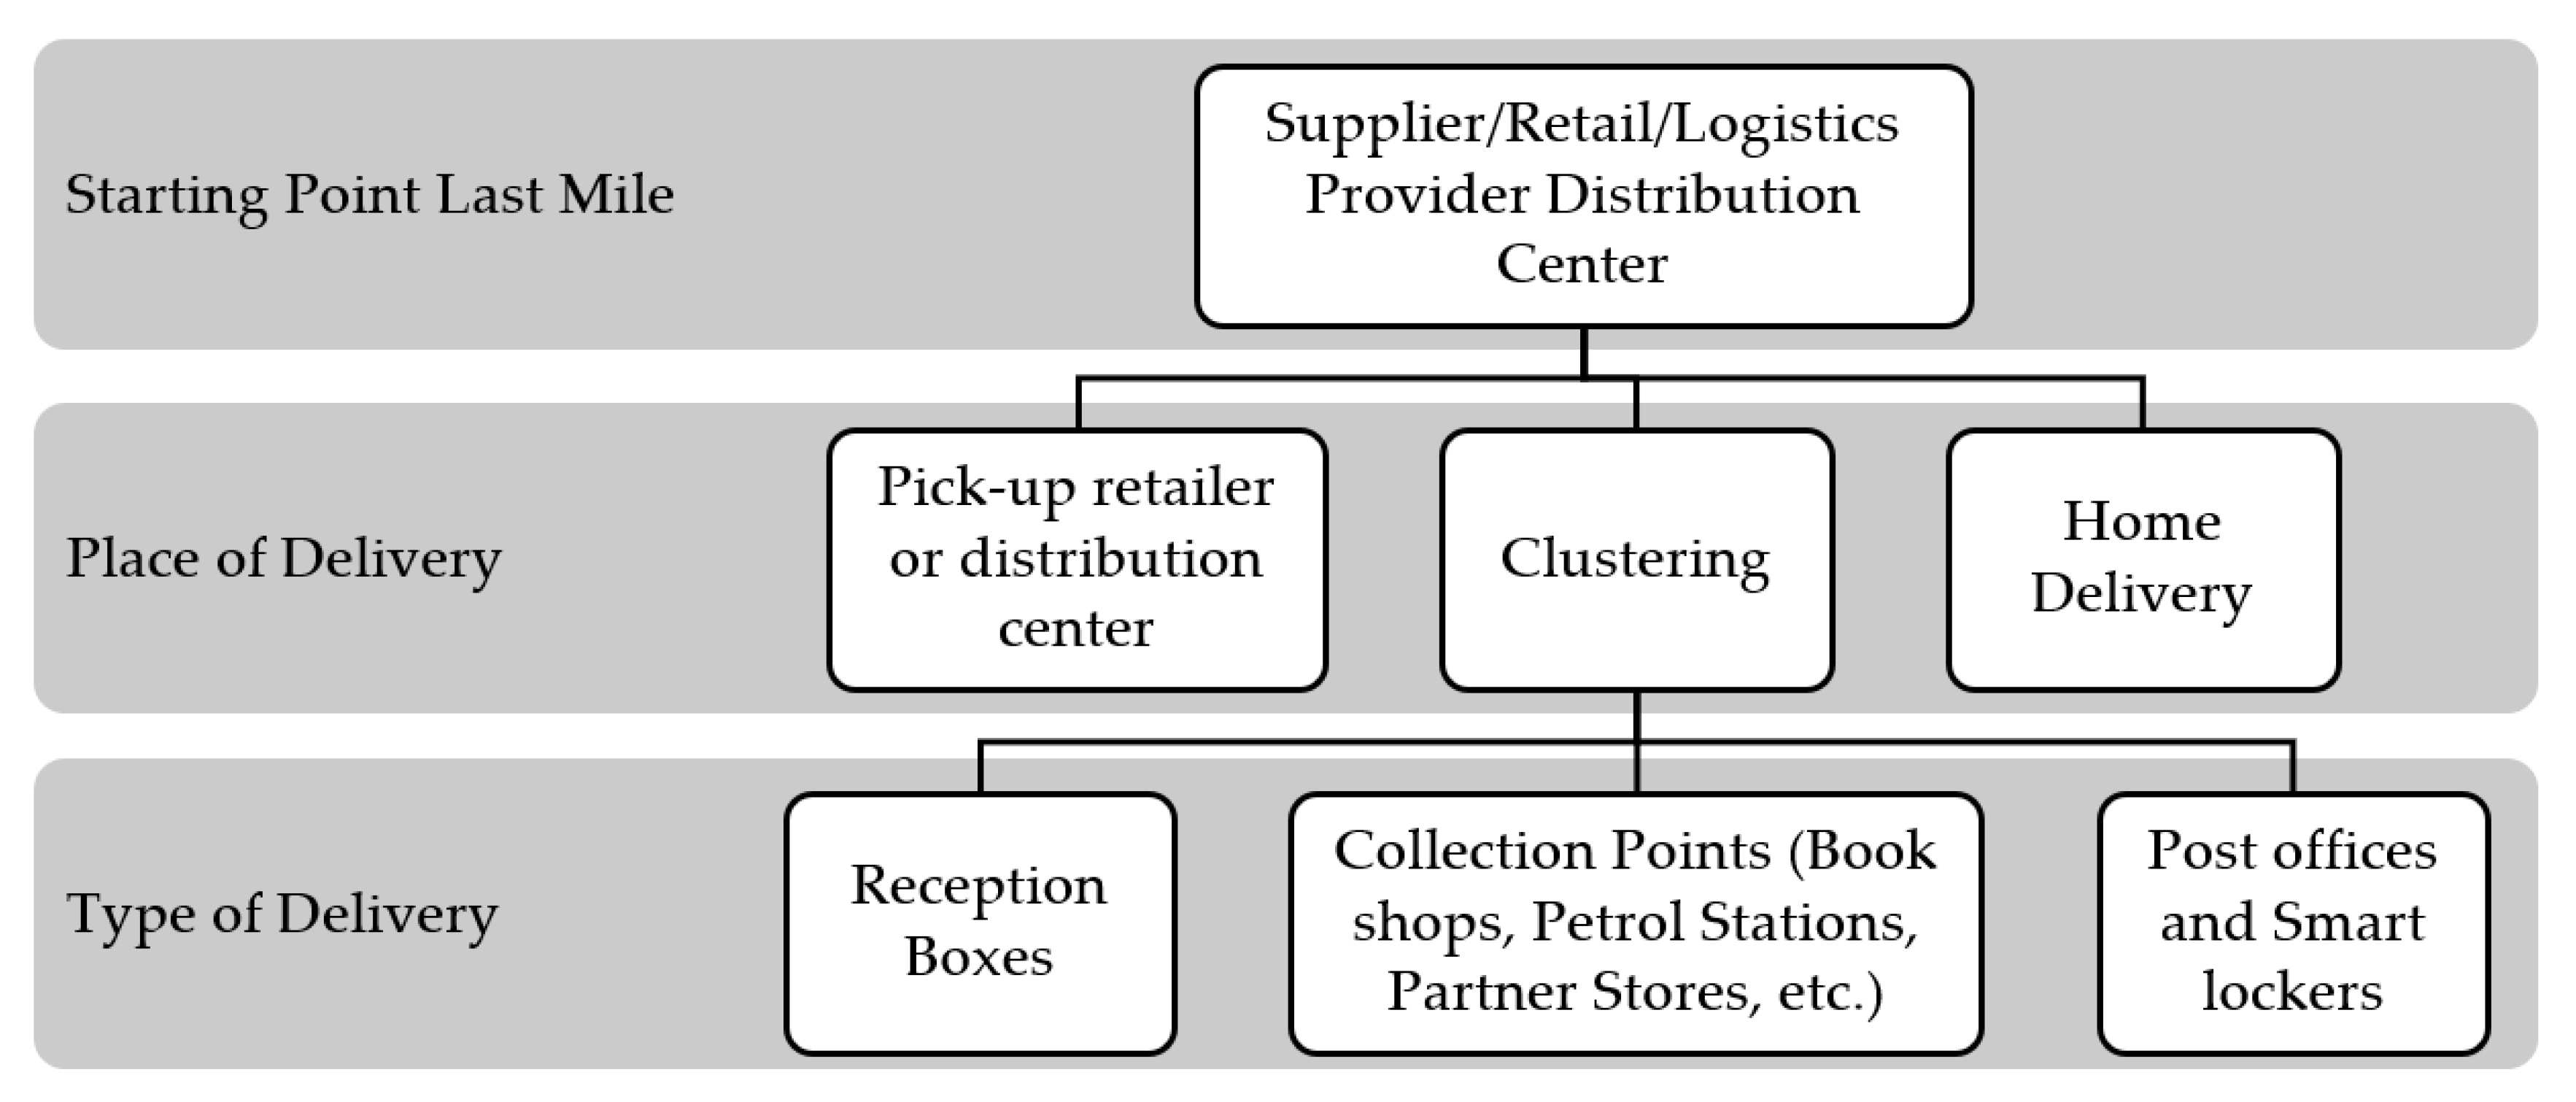
Figure 1. Last-mile delivery methods, adapted from Gevaers et al. [30].
Sustainability 14 05753 g001
Figure 2. Research flow.
Sustainability 14 05753 g002
Figure 3. TFN.
Figure 3. TFN.
Sustainability 14 05753 g003
Figure 4. Research Decision Hierarchy.
Sustainability 14 05753 g004
Figure 5. Model of questions applied using Google Forms.
Sustainability 14 05753 g005
Figure 6. Sensitivity analysis.
Sustainability 14 05753 g006
Table 1. Classification of Brazilian highways by type of variable and measured in kilometers. Source: Adapted from Brazilian National Confederation of Transport—CNT [35].
VariableExcellent (%)Good (%)Regular (%)Poor (%)Very Poor (%)
General conditions11.9029.1334.5617.496.92
Paving quality38.598.9734.9613.753.72
Signaling quality13.9637.8926.1411.6410.36
Geometry quality5.7417.9926.6420.6928.94
Table 2. Solutions for last-mile delivery adapted from Souza et al. [42].
Innovative PracticeYes (%)No (%) Maybe (%)The Product Does Not Allow (%)
Bicycle/Electric scooter44221717
Pick-up point/Locker5002822
Crowdsourcing22223422
Semi-autonomous/
Autonomous vehicles
33172822
Drones34331122
Car drops17333911
Table 3. Parity comparison scales.
ScaleMeaning
1Equally important
3Moderate importance
5Strong importance
7Very strong importance
9Extremely importance
2, 4, 6, 8Intermediate values
Table 4. Random Index.
n123456789
RI0.00.00.580.901.121.241.321.411.45
Table 5. Consistency of the model.
MatrixInitial CRFinal CR
Model0.1610.009
Delivery Point0.1530.044
Security0.2990.015
Time and Speedy0.8330.040
Tracking and Trace0.2370.012
Value-Added0.4570.021
Cost0.4200.020
Table 6. Criteria Ranking.
CriteriaWeightOverall RankAlternativesWeightOverall Rank
Cost0.2141Drone 0.1875
Delivery Point0.1375Motorcycle0.1973
Security0.1743Multimodal0.1854
Time and Speed0.1584Small Truck0.2132
Tracking and Trace0.1932Smart Locker0.2181
Value-Added0.1256
Publisher’s Note: MDPI stays neutral with regard to jurisdictional claims in published maps and institutional affiliations.