Article

Willingness to Pay for Irrigation Services in the Cold Winter Deserts of Uzbekistan

1
Social, Economics, and Policy Research Team, International Center for Agricultural Research in the Dry Areas (ICARDA), Rabat B.P. 6299-10112, Morocco
2
Restoration Initiative on Dryland Ecosystems, International Center for Agricultural Research in the Dry Areas (ICARDA), Tashkent 100084, Uzbekistan
3
Resilient Agrosilvopastoral Systems Team, International Center for Agricultural Research in the Dry Areas (ICARDA), Tashkent 100084, Uzbekistan
*
Author to whom correspondence should be addressed.
Sustainability 2022, 14(1), 94; https://doi.org/10.3390/su14010094
Submission received: 26 November 2021 / Revised: 17 December 2021 / Accepted: 17 December 2021 / Published: 22 December 2021
(This article belongs to the Topic Water Management in the Era of Climatic Change)

Abstract

:
Irrigation facilities in the cold winter deserts (CWDs) of Uzbekistan are very traditional and poorly managed, resulting in low water use efficiency and low productivity. Improving the irrigation facilities in these deserts is a key priority for the country. This study intended to contribute towards the development of the irrigation systems through identification and quantification of the relative implicit values smallholder farmers confer to the key characteristics of irrigation facilities. We elicited preferences with discrete choice experiments, estimated willingness to pay for these attributes using random parameters logit models, and analyzed heuristics in the choice process using a series of latent class models. Our results show that farmers have clear preferences for higher watering frequency and no interest in sharing irrigation water with downstream users. We also observed that there are distinct groups of farmers with comparable but different levels of preference. The development of irrigation facilities in the water-scarce parts of Uzbekistan would benefit from careful consideration of the preferences of the target communities and targeting of the schemes based on the broad heterogeneities within the communities. This will aid in the maintenance of irrigation systems and, as a result, increase agricultural production and productivity.

1. Introduction

Ecosystem services are critical for the sustainability of the natural environment, food security, and livelihoods of the resource-poor inhabitants of the cold winter deserts (CWDs) in Uzbekistan. CWDs are not well endowed with natural resources, and food production heavily depends on the availability of water. Even though some efforts are being made by government agencies to sustain the ecosystem services in the CWDs, there is no evidence to suggest that these efforts will continue or grow to make a difference in these deserts. On the other hand, the farming community in the CWDs generally tends to rely on government investments for improvement and management of the ecosystem services.
Fast growing urbanization and the investment required are making it increasingly difficult for the government of Uzbekistan to give as much emphasis to these important, but very fragile CWDs. Therefore, contributions by the local community will be essential to improve and sustain ecosystem services in the CWDs of Uzbekistan. It is necessary that the communities in these deserts engage more actively in the planning and implementation of sustainable land and water management activities. An important tool in managing common pool resources is payment for ecosystem services [1]. The government agency managing the deserts may enforce such a payment in the future. However, without the users’ willingness to participate in the process, the governmental decision on the payment system for ecosystem services may not be sustainable [2,3]. CWDs provide a number of ecosystem services, including biomass production, sand fixation, firewood, and below- and above-ground carbon storage and buffer functions in the inter-annual carbon cycle [4]. Access to and use of irrigation water is one of the most important ecosystem services in CWDs of Uzbekistan. It can be argued that irrigation schemes developed based on the needs and preferences of the target users are more likely to be owned and efficiently managed by the users. Hence, the costs and benefits of the irrigation schemes need to be estimated and compared from the perspective of the target users as well.
The key components of the cost are mainly direct and can be measured relatively easily. However, the direct and indirect benefits of the irrigation services can hardly be measured with as much simplicity. This is why non-market-based economic valuations are gaining traction in estimating the value of access to irrigation services or the different attributes of irrigation services. The value of the access to irrigation is commonly estimated using different adaptations of contingent valuation [5,6,7,8,9,10]. Direct elicitation methods would not, however, enable us to look into the relative importance of different components of the irrigation services. The services are the sum total of the different attributes characterizing them. Discrete choice experiments (DCEs) are one of the stated preference-elicitation methods that can help us assess the relative importance of the components. Compared to the other elicitation methods, DCEs would enable us to rank the different attributes and the attribute levels.
A few studies have employed DCEs to estimate implicit prices of the attributes of irrigation services [11]. This study analyzed the way irrigation water should be managed in South Africa and recommended a shift towards on-farm volumetric water pricing in the irrigation schemes. Another study that used DCE reported positive and significant willingness to pay (WTP) for cropping intensity, frequency of watering, and crop under production aspects of the irrigation system among smallholder farmers in Ethiopia who have never paid for irrigation water use [12]. A DCE study in Punjab, Pakistan reported that sample farmers had a WTP much higher than the current average rates for improved surface water reliability [13]. A study in four regions of India and Pakistan investigated preferences of farmers for different forms of irrigation fees and models of local governance [14]. The study emphasized the heterogeneity across the study areas and the need for localized approaches in determining irrigation fees and governance.
Despite the popularity of DCEs in other field of applied economics research, we could not find other peer reviewed studies that used DCEs to elicit preferences for characteristics of irrigation services. In fact, there is not any study on the valuation of irrigation services from the perspective of the target users in Uzbekistan or in Central Asia in general.
Uzbekistan’s agriculture is cotton and wheat-centric and almost entirely dependent on irrigation. About 90% of the water resources in Uzbekistan are used in the agriculture sector, and it is used with low efficiency [15]. Only 11–12% of the water consumed in the country comes from within the country [16]. Most of the food and feed production happens in irrigated agriculture, which covers merely 10% of total cultivable land (4.3 million ha), demonstrating the importance of water to people’s livelihoods not only in the CWDs but also in the entire country. CWDs and semi-deserts constitute about 85 percent of Uzbekistan’s land mass [17]. It is almost impossible to overemphasize the importance of these deserts and the implications of the availability of water in Uzbekistan and in our study area. Agrarian livelihoods in the CWDS are becoming more and more fragile and vulnerable because of scarcity and high variability of the water supply.
A report in 2009 indicated that the welfare of the republic depended on the possibility of ensuring the water supply for almost 29 million people, for the irrigation of 4.3 million hectares, and for industry and for the environment [16]. At present, the total annual water use in the republic is 55.1 km3, of which irrigated agriculture uses 49.7 km3 and the domestic and drinking water supply for urban and rural populations uses 3.4 km3 [16]. The immediate solutions revolve around increasing water use efficiency (WUE) and developing sustainable water-management systems.
Shortages of water and deterioration of water and land resources are observed throughout Uzbekistan [15,17,18]. Most of the irrigated area is subjected to salinization [19], waterlogging, water erosion, agro-biodiversity losses, and other very hazardous processes [20,21]. This hampers the development of the economic system—including the agriculture sector—and aggravates the challenges faced by the poor rural communities. Almost one fourth of Uzbekistan’s population (more than 6 million) suffers from the negative effects of polluted water [22,23]. Research has also shown that, in Uzbekistan, the low income of the rural population is linked to the irregular supplies of irrigation water and the deterioration of land due to, among others, salinization and waterlogging [17].
Water shortage has become a key factor limiting the sustainable development of Central Asia, especially for the downstream agricultural countries like Uzbekistan [15,24]. It is not only the availability of water that is an issue but also the level of efficiency of its use. A recent study [25] argues that low water-use efficiency is a main factor contributing to water shortages in Central Asia. Irrigation facilities in the region are relatively backward, and the cropland relies on furrow irrigation, leading to low crop yields and a low utilization efficiency of water resources [25]. Improvement of these facilities is among the most-important political-economic priorities of Uzbekistan. Improvement will, however, happen only if it is based on careful and well-informed planning.
Irrigation is a technology with different characteristics or components. Farmers’ interest in each of the components of the irrigation scheme determines their level of engagement and efficiency in use. This is the basis of our study, where we estimated the willingness to pay for the different attributes of irrigation schemes in this vulnerable ecosystem. By investigating farmers’ choice strategies, we also looked into the relative importance of the different components of the irrigation schemes.
Planning sustainable development without proper valuation of ecosystem services can hardly be meaningful, as the focus will be predominantly on direct, local, and immediate benefits [25]. There is no better evidence than the Aral Sea crisis to show the failure associated with focusing on direct benefits from ecosystem services [26,27]. Currently, the most-degraded pastures are located in the Central Kyzylkum deserts, covering the Bukhara, Navoi, Khorezm, and Karakalpakstan, regions, where the misuse emanates from inadequate access to land, inappropriate land-management systems, and a lack of knowledge on sustainable use and management of these resources [18,21]. Weak institutional structures and procedures, as well as a lack of law enforcement, also contribute enormously to the challenges of sustainable development [24,28].
We identified five key attributes of irrigation schemes in the Bukhara region’s Karakul District, one of the most-fragile ecosystems in Uzbekistan, and elicited preferences and estimated implicit prices. The attributes considered were water availability in the dry season (May to October), crop water frequency, irrigation water quality, water sharing with downstream users, and the fee for irrigation. We elicited preferences with discrete choice experiments and estimated willingness to pay for these attributes using a random-parameters logit. We also estimated a series of latent class models to investigate the relative focus given by farmers to the different attributes while choosing among the hypothetical irrigation schemes.
The results of this study will serve at least two purposes. First, the evidence will inform policymakers on what the focus of the irrigation development effort should be. Not all components of the irrigation schemes are equally important to farmers and the community. Second, we strongly believe that scientific evidence-based designing and implementation of irrigation schemes helps farmers cope with the unforgiving environment better, as they will have a scheme that addresses their priorities and the implied challenges thereof.

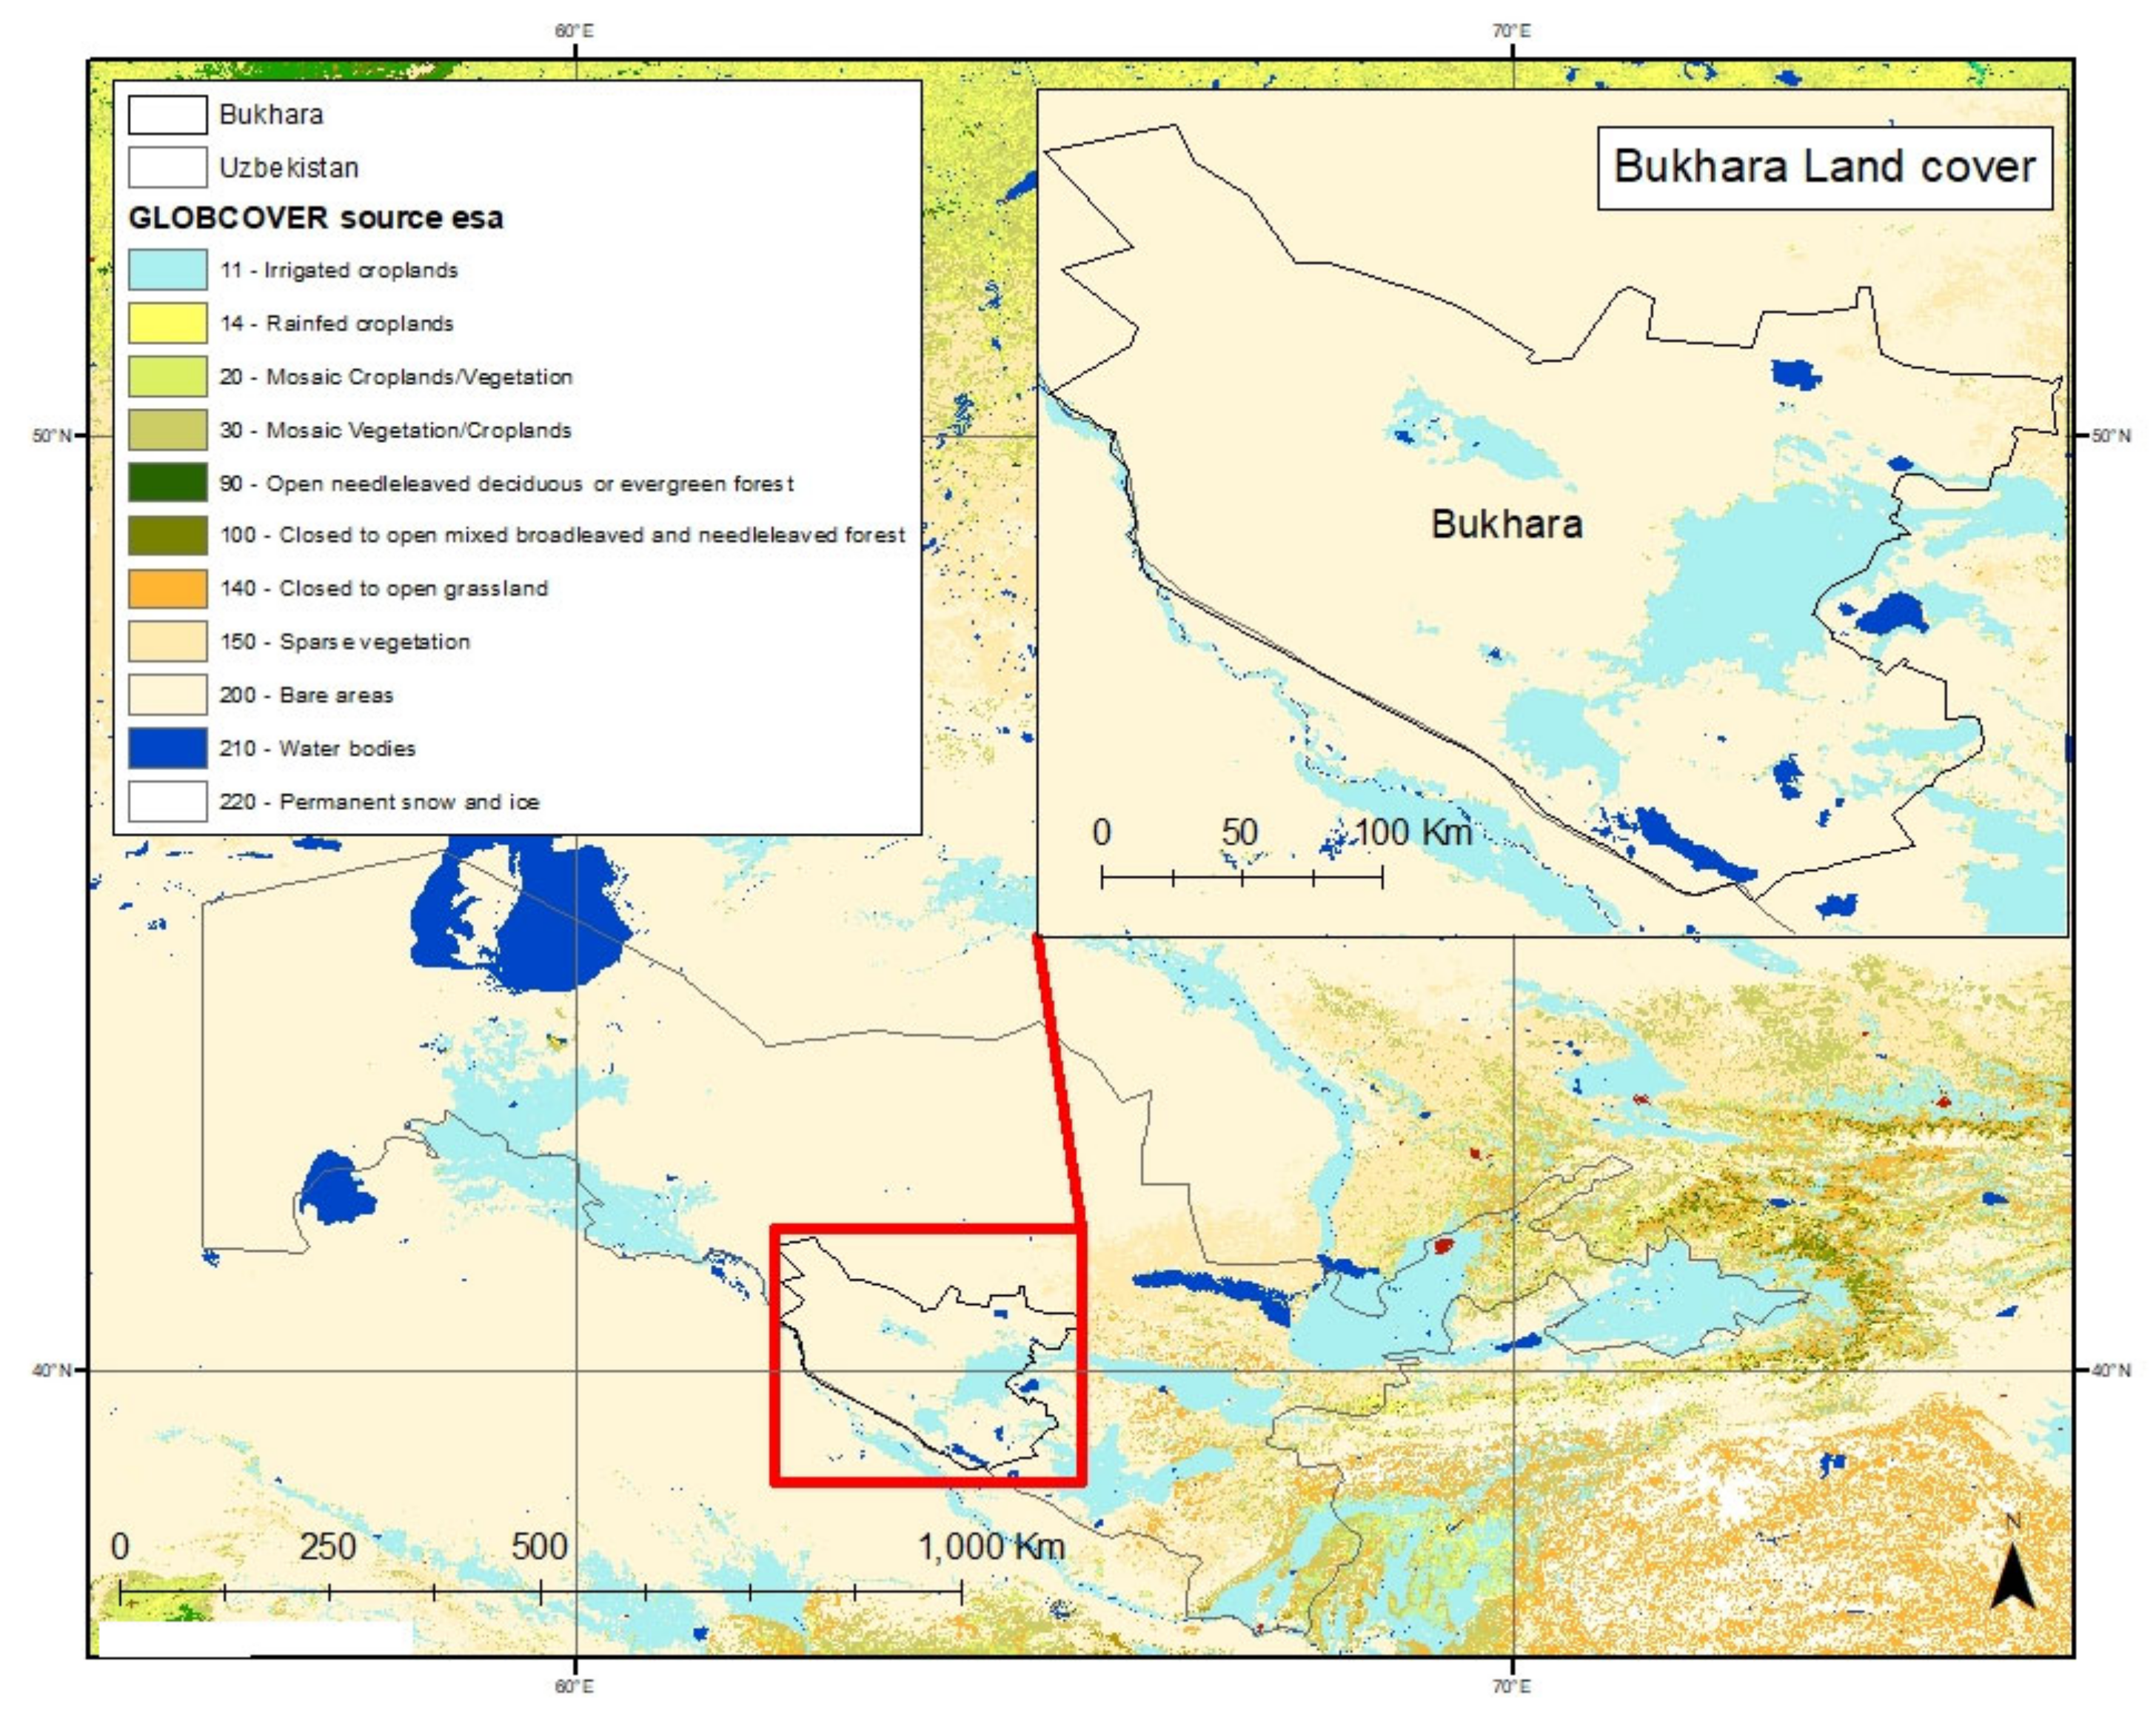
2. Description of the Study Area

The study was conducted in Durmon village in Karakul District, which is a central south region of Uzbekistan (Figure 1). The Karakul District Forestry Department, established in 1925, includes forest, pastures, and non-used land resources. The entire land resources in the district cover 73,542 ha. These land resources are geographically located at 39.582991° N latitude, 63.905707° E longitude, and an altitude of 242 m above sea level. The territory of the forest department encompasses part of the Kimmerikum desert, the West Kyzyl Kum plains, and the ancient valley of the Zerafshan River. Durmon village has an area of 517 ha.
Water availability is the most-important determinant of the land-management practices of farmers. In terms of land use and management, the study area has two distinct populations—the smallholder farm households who are always trying to eke out a living in this harsh environment and the employees of the Forestry department whose focus is controlling the natural resources both for political and conservation reasons.
Durmon village was selected as a representative site for cold winter deserts that cover different provinces in Uzbekistan and across other countries around the Aral Sea region in Central Asia. Livelihoods of the farming communities in Durmon depend entirely on the ecosystem services provided by the cold winter desert, and the CWDs are a major policy agenda in Uzbekistan. It is within the national strategy to improve management of the CWDs to enhance their contribution to rural food security on a sustainable basis.
The study site is characterized by quick climatic fluctuations, constant wind activity, the prevalence of sand, extremely low precipitation and humidity, aridity, and extensive degradation of the natural resources. The long-term average precipitation in the pilot area is only 108 mm—which is very low for rain-fed crop production. An important part of this precipitation during the growth period of the vegetation (mostly in spring) is around 30 mm only. During summer periods, the precipitation is totally absent, and the relative humidity sharply decreases with a long-term average of 36%. Although rare, timing of the first snow in the project pilot area varies from year to year, and usually starts in December and continues falling until January, sometimes lingering until mid-March.
The annual average air temperature is 14.8 °C, ranging from −22 °C (in January) to 47.1 °C (in July). The last days of cold weather happen in mid-spring (18.04 °C), while the first frost comes in mid-autumn (13.10 °C). The hot dry weather lasts 40–50 days during June–August and causes extreme heat and drying of vegetation. There is constant wind activity in this region, with dry and hot winds (locally called garmsel). Garmsel wind can happen for 45 to 50 days a year, blowing in June through August. This wind speed is a reason for slight-to-moderate soil erosion and movement of sand in the direction of wind. The common soil types in the study area are desert sands, takyr-like soils, grey-brown desert soils, meadow solonchak soils, and meadow irrigated solonchak soils. Soil salinity is common in this area and happens due to shallow mineralized groundwater.
The operations and management of the study area represent what is happening in the rest of the CWDs where irrigated agriculture is practiced. Depending on water availability, which is pumped from the source and delivered through canals, large parcels of land can be irrigated; however, due to water scarcity, only 13% of the total arable land is cropped, demonstrating the importance of water overall for the study site. Major crops grown in the area are vegetables, legumes, and wheat, typically requiring 5–10 thousand m3 per hectare.

3. Materials and Methods

3.1. The Choice Experiment

Valuation of ecosystem services—including irrigation water—is best done with stated choice methods, as almost no services are directly marketable. Discrete choice experiments (DCEs) are a widely used data-generation method in stated choice analysis. Lancaster’s characteristic theory of value (ToV) [29] and McFadden’s random utility theory (RUT) [30] form the basis for estimating the relative importance of the attributes characterizing the service at hand, in this case, irrigation. The implicit prices of the characteristics show their relative importance and the structure of the latent satisfaction from the consumption of the service [29].
RUT assumes that the choice behavior of individual decision makers is probabilistic conditional on the characteristics of the services available to them and other factors that affect their choice decision. It is, therefore, expected that the choice behaviors of the individual decision makers vary because of variability in the underlying factors. The underlying factors include unobserved attributes, unobserved individual characteristics (or taste variations), and/or measurement errors [31]. The RUT also enables us to model unobserved heterogeneity in choice behavior among the sample households.
Irrigation water is a quality-differentiated service that can be described by its attributes. Transaction of such attributes does not happen in actual revealed markets, hence the need for stated choice methods such as discrete choice experiments [32]. Sample households are currently accessing irrigation water based on arrangements made by the government or water-user associations with support and guidance from the government. Sustainable use of the irrigation water resources, however, depends on farmers’ actual demand for irrigation services. The demand for irrigation water services is a consolidation of the demand for the different components of the service. We derived the demand for the attributes of irrigation water services by eliciting sample households’ preferences for the experimental designed irrigation schemes presented in the form of pair comparison with the option of opting out included.
The identification, definition, and prioritization of the characteristics of the hypothetical irrigation schemes in the choice experiment involved iterative focus-group discussions and a reconnaissance survey. A structured questionnaire survey was undertaken involving a sample of 200 farmers in 2020 to generate socioeconomic data and the attributes of irrigation services. The discussions with farmers resulted in the following attribute and levels for the choice experiment (Table 1).
Therefore, our design had five attributes of irrigation schemes. We used Ngene [33] to generate experimental designs that combine the attributes and create hypothetical irrigation schemes. Using main effects only, there could be 2 × 34 or 162 combinations of irrigation schemes with different levels of the five attributes. We, however, used fractional factorial design to limit the number of alternatives to a reasonable level. Our final D-optimal design had a D error of 1.32 and generated 36 alternatives paired in two to create nine choice sets. Each choice set therefore included two hypothetical irrigation schemes and an opt-out option—added to avoid forced choices.
To simplify farmers’ choice decision-making process, we used pictorial representations for each level of the attributes in preparing the choice cards with which we elicited the choices. The DCEs were conducted at the residential homes of the respondents, and they were presented with nine choice sets to choose one among three alternatives in each of the sets. Before the interview, each respondent was briefed about the research and the mechanics of the irrigation scheme choice experiment. To ensure that that farmers have understood the experiment, one or two randomly selected choice sets were presented to them without recording the responses. Then, the nine sets were presented in random order for each of the sample respondents.

3.2. Analytical Framework

Decision makers’ choices among alternatives in a choice situation can be analyzed using discrete choice models [34]. The decision makers in our case were sample households, and the alternatives represent hypothetical irrigation schemes characterized by different attributes and attribute levels. Assuming a utility-maximizing individual ( n ), the probability that a hypothetical irrigation scheme ( i ) in a choice situation ( C t ) is chosen is equivalent to the probability that the expected utility from this alternative is higher than the utility from other alternatives in the choice set. Due to RUT, we can formulate this mathematically as:
P C n t = i = P U n i t > U n j t ,   i j  
The utility function U n i   has both deterministic and unobserved components. It can be written as:
U n i t = V n i t + ϵ n i t
where V n i t is an observable, and hence deterministic, component of the expected utility from alternative i ,   and ϵ n i t is the idiosyncratic random error term.
We assumed the utility function to be linear in the covariates and utility to be separable in price and non-price attributes to re-specify the utility function as:
U n i t = α n p n j t + β n x n j t + ϵ n j t
where α n and β n are individual specific parameter estimates, and ϵ n j t is the distributed extreme value type I with variance given by η n 2 Π 2 6 , where η n is a scale parameter. Dividing Equation (3) by η n does not affect behavior and results in a new error term, which is an IID extreme value distributed with variance equal to Π 2 / 6 [35,36]. Because of the division   U n i t = ( α n / η n ) p n j t + β n / η n x n j t + ϵ n j t / η n .
Therefore, the utility model in preference space can be written as:
U n j t = λ n P n j t + c n x n j t + ε n j t  
where the utility coefficients are defined as λ n = α n / η n , c n = β n / η n , and ε n j t = ϵ n j t / η n .
Equation (4) can be estimated using either conditional logit (CL) or random-parameters logit (RPL) models. CL, however, assumes the preferences for the attributes to be similar across individuals and requires the strong assumption of irrelevance of independent alternatives (IIA) to hold. RPL, on the other hand, is a flexible model that allows for random taste variation, unrestricted substitution patterns, and correlation in unobserved factors over time [34]. In this study, we report results of different specifications of the RPL model.
Our main interest is quantifying the relative implicit prices or the willingness-to-pay (WTP) values for the attributes of the irrigation services. The WTPs are ratios of two randomly distributed coefficients. Depending on the choice of distributions for the random coefficients of the RPL model, this can lead to WTP distributions that are heavily skewed and that may not even have defined moments [35,36]. Hence, the need to estimate RPL in WTP space arises [35].
The WTP for an attribute is the ratio of the attribute’s estimated coefficient to the estimated coefficient of the annual payment, i.e., w n = c n λ n = β n η n α n η n = β n / α n . Therefore, we can rewrite the utility function given in Equation (4) as:
U n j t = λ n P n j t + λ n w n x n j t + ζ n j t .
We estimated Equation (5) with the assumption of correlated WTP coefficients as suggested by [35] and [36]. We are therefore reporting RPL models with and without correlated random coefficients estimated in WTP space.
We also analyzed sample individuals’ choice-simplification strategies and the effect of the scale parameter on unobserved heterogeneity using latent class models (LCM). LCM is type of mixed logit (or RPL) model where the mixing density function of the coefficients to be estimated is of discrete nature, and hence the estimated coefficients take a finite set of distinct values [34]. We assumed that β takes Z possible values labeled b 1 ,   ,   b Z , with probability s z that P β = b z = S Z . In this case, the RPL becomes the latent class model, and the choice probability is given as:
P n i t = Σ z = 1 Z s z e b z x n i t Σ j e b z x n j t
We estimated constrained latent class models [37] to look into attribute non-attendance (ANA) patterns employed by the respondents—to simplify their decision making and scale-adjusted latent class models [38] to assess preference heterogeneity while considering response error.
ANA refers to the simplification strategy respondents employ by disregarding one or more attributes characterizing the alternatives in the choice sets. ANA can be stated or inferred. Stated ANA occurs when sample respondents state the attribute/attributes they disregarded or ignored in choosing between alternatives in a choice set, and inferred ANA is implied from the relative weights of the estimated random coefficients of the utility model. We are presenting inferred ANA patterns, as we did not generate data on stated ANA. The latent class models were gradually estimated with constraints on the coefficients of the attributes assumed to be ignored at every step, following earlier studies [39,40,41].

4. Results and Discussion

4.1. The Sample Population

This section is based on the socioeconomic survey on 200 farm households that preceded the DCE survey. As summarized below in Table 2, the sample is entirely of smallholder farmers (with cultivable farmland of 0.1 hectare per household). Most (68%) of our sample respondents were men. The sample had an average age of 43 years and 19 years of farming experience. Only 37.5% of the sample households depend on farming for their livelihoods, while the rest of the households complement it with one or more income generating activities. Yet, two-thirds of the annual income a typical household generates is from agriculture. Most of the households (~96%) were either in secondary or in professional/vocational school. Most of the respondents (88%) indicated that agricultural water shortage happens sometimes, while 11% of them indicated that it happens all the time. The average number of months with a serious agricultural water shortage was three.
A given sample household was, on average, 2 km far from the nearest agricultural water source. Expectedly, almost all (96%) of the respondents consider the quality of the agricultural water to be good, as the primary source water is a perennial river. Households use different types of pump for irrigation. Most of the respondents (94%) use their own irrigation pumps, whereas 82.50% of the respondents use pumps rented from neighbors. Only 2% of the respondents were found to be using the Sayyod pump station that provides water for several villages. It is important to note that farmers use more than one pump whenever they afford to do it.
Direct elicitation of the amount farmers are willing to pay for irrigation water showed that most of the farmers (~87%) are willing to pay up to UZS 10,000 per year. Almost 13% are willing to pay even more than that.

4.2. Willingness to Pay

The WTP estimation was based on the DCE conducted on 300 farm households after the socioeconomic survey discussed above. We report the results of the RPL models estimated in WTP space over 1000 Halton random draws (Table 3). Our discussion will be based on the RPL model with correlated coefficient estimates (Model 2). We also presented the model estimated with the assumption of uncorrelated random coefficients (Model 1) to show the consistency of the relative weights farmers attach to the different aspects of irrigation water.
The first attribute of irrigation service is the availability of canal water in the dry season (mainly May to October). There is a very high WTP for this component in the study area. The mean of the marginal WTP for one more month of water in between May and October was UZS 150,000. This implies that farmers have a high effective demand for irrigation facilities meant for making water available in the dry seasons—especially during production of key crops. The key crops were a mix of vegetables, legumes, and wheat for farmers’ own consumption; and wheat; and cotton produced for commercial purposes. The Sayyod pumping station provides water through an irrigation network, and, although canal water is usually available, its distribution to consumers in different parts of the irrigation scheme is the key and is managed by water authorities.
The second attribute of irrigation facilities is crop-watering frequency per month. The watering frequency each farmer enjoys is determined by the water demand of the crops and, more importantly, water availability and the actual distribution determined by the water-user association (if functional) or water authorities that manage the distribution of water. Farmers have little control over the frequency, and yet this is an attribute that determines the level of production and the productivity of crops grown by farmers. One more watering per month has an implicit price of UZS 177,000. This is slightly higher than the implicit price for canal water in the dry season component of irrigation schemes.
Another important attribute of irrigation is water quality. This is usually the case when there is water scarcity, consumers revert to groundwater resources, and its quality is affected by high salinity, making it subsequently detrimental to crop production. Our model was specified in such a way that we could compare WTP for medium compared to bad quality and for high-quality compared to bad-quality irrigation water.
Farmers have a clear preference for high water quality over bad irrigation water quality. Farmers are willing to pay UZS 121,000 for high-quality irrigation water over low-quality irrigation water, everything else held constant. The model also shows that farmers are not interested in slight improvement of the quality; rather, they are keen on considerable improvement in the quality.
The results also show that farmers were not interested in water sharing with downstream users. This is not unexpected behavior of human beings whenever they are dealing with scarce resources, and irrigation water is very scarce in this desert.
The results also show that, for farmers, the most-important feature of an irrigation scheme is watering frequency (Table 3). The higher the number of times they obtain water, the better. Similar results were reported for Ethiopian smallholder farmers [12]. Farmers are willing to pay more for irrigation water in the dry seasons than for improvements in irrigation water quality. The priority is therefore more water in the irrigation schemes.
The lower half of Table 3 shows that there is unobserved heterogeneity around the mean WTP values for the different irrigation scheme components. The heterogeneity is very strong and significant in all attributes, except medium water quality (cf. bad water quality). Particularly, there is significant variability around the marginal WTP values for water sharing with downstream and high water quality (cf. bad water quality). We further disentangle the unobserved heterogeneity to see if there are any latent classes of preference among the respondents. We also look into heuristics that respondents might have applied to simplify the choice decisions.

4.3. Irrigation Scheme Attribute Preference Heterogeneity

The unobserved heterogeneities (Table 3 above) imply the presence of differences in preferences among our respondents. Assuming that the scale heterogeneity is discrete, we estimated scaled-LCM to see whether there are meaningful homogeneous segments within the sample based on their preferences for the attributes. The level of response error variance (or scale) determines the quality of the segmentation and hence the part-worth values estimated for each of these classes [31]. We estimated three sets of six latent class models each to see whether the scale parameter influences the segmentation of the respondents. We first estimated non-SLCM Model1-Model6 class models that are homogeneous with respect to response error. Then, we estimated six LCMs (Model7 to Model12 with two scale classes assumed. Lastly, we estimated six LCMs (Model13 to Model18) with three scale classes assumed (Table 4).
Model 10, Model 4, and Model 15 are the three best-fitting LCM models estimated to see whether there are any discrete segments of preference heterogeneity. Model 10 (two scale segments*three preference segments) is the best-fitting model based on BIC. Yet, the correct classification rate of Model 10 (87.11%) is the least of the three models. Model 4 (four preference segments and no scale heterogeneity) correctly classified the respondents in 89.74% of the cases. Model 15 has a correct classification rate of 87.52%. As the magnitude (Model 10, scale for class 2 = 0.174; Model 15, scale for class 2 = 0.174, and scale for class 3 = 0) and influence on the segmentation of the response error variance is negligible, we focus on Model 4 to describe the different preference segments of the sample.
The four classes of Model 4 contain farm households with overlapping interests. In fact, the level of interest in the attributes of the hypothetical irrigation schemes was different. Respondents in Class 1 (64.3% of the sample) were highly interested in higher irrigation water frequency (Table 5). They were also interested in water availability in the dry season, slight improvement in the water quality, and sharing water with downstream users. They were, however, disinterested in low water quality and the fee they have to pay for irrigation services. In fact, respondents in all segments were expectedly not interested in paying for the service. Except for water-quality-related attributes, respondents in Class 2 (19.25% of the sample) had a comparable preference map for irrigation scheme attributes with Class 1, albeit with lower intensity. These farmers were not interested in both low and medium irrigation water quality. They were, however, willing to pay for high-quality (cf. low-quality) irrigation water. They also had a strong interest in sharing the irrigation water with downstream users. This is very different from what we saw in Class 3 and Class 4.
Farmers in Class 3 (14.3% of the sample) had a very concentrated preference map. They were highly interested in higher water frequency and high water quality (cf. low quality). They also showed a strong disinterest in low irrigation water quality and sharing water with downstream users. This class of farmers was the only one not willing to share water with farmers in the downstream (Table 5). Their unwillingness was very strong, and it might have resulted in the sample level indifference despite their small proportion. Farmers in Class 4 (only 2.3% of the sample) showed a slight interest in increased watering frequency and high-quality (cf. low-quality) irrigation water and a slight disinterest in payment for irrigation. Farmers in Class 3 and Class 4 appeared to be indifferent in some of the attributes or levels in the choice experiment. We discuss this below in detail.
This analysis revealed that our respondents do have distinct differences in terms of their preference for the irrigation scheme attributes considered. It is therefore important to make note of these differences when designing irrigation schemes to ensure that the interventions are in harmony with the expectations of the farm households and, hence, the sustainability of the irrigation facilities to be developed.

4.4. Irrigation Scheme Attribute Nonattendance

In this section, we present the results of the latent class analyses for identifying unobserved groups based on attribute nonattendance patterns. We estimated three latent class models gradually to capture the extent to which respondents used heuristics to simplify the choice task. The first LC model (LC Model 1 in Table 6) included full attribute attendance or full compensatory choice, complete non-attendance or pure random choice, and one-attribute non-attendance. Therefore, LC Model 1 is a model with seven classes. The second model (LC Model 2 in Table 6) included full-attendance, full non-attendance, one-attribute non-attendance classes with class membership probability greater than 5% from LC Model 1, and two-attribute non-attendance classes. This model has 13 classes. The third model (LC Model 3 in Table 6) has four classes. The classes are full-attendance, full non-attendance, and two other two-attribute non-attendance classes with a membership size of greater than 5% in LC Model 2.
The final ANA model showed that 22% of the respondents attended to all attributes (Class 1), and 47.1% of them ignored all attributes (Class 2). Similarly, 23.2% of the respondents ignored the quality of irrigation water and access to water by downstream users (Class 15). Of the farmers, 7.6% also ignored access to water by downstream residents and the annual fee for irrigation water.
The results show that there was a high level of random choice among the respondents. There was also low interest in water sharing with downstream, irrigation water quality and the annual irrigation water user charge. This implies that irrigation development and efficiency interventions must take into account the relative importance of these attributes as perceived by farmers.
This reinforces the observation we made above that there is considerable heterogeneity in preferences among sample farmers. This implies that there is a need for understanding the interests and heterogeneities among target users in identifying and targeting irrigation schemes. It will be difficult to develop a scheme and get it accepted by all farm households in each community or agro-ecology. Our study area was relatively small, albeit with a very heterogeneous landscape and farming system. Yet, the level of heterogeneity in the sample population is a reminder of the limit of the extrapolations we can make and the extent to which our recommendations will be relevant to our target community.

5. Conclusions

Irrigation agriculture drives rural livelihoods in the cold winter deserts of Uzbekistan. An agrarian community inhabits Karakul district, and its welfare depends entirely on the access and use of irrigation services. The government of Uzbekistan is very keen about the irrigation system, and the system is geared towards the production of export and strategic commodities as part of national agenda of crop diversification and sustainable management of underutilized cold winter deserts. Both crop diversification and sustainable land management depend on the quantity and the quality of irrigation water.
The long-term sustainability and ecological soundness of the irrigation system in the cool deserts of Uzbekistan depends on farmers’ interest in and hence the effective demand for the irrigation service. There is, however, no empirical evidence on the preferences for and implicit prices farmers, particularly small holders, are willing to pay for irrigation services.
Taking a small village of 750 hectares, we conducted a choice experiment survey on 300 sample farmers and estimated their willingness to pay for the different attributes of irrigation and the relative importance of the attributes in choosing the irrigation schemes.
The analyses revealed that farmers are most interested in a higher irrigation watering frequency. We also observed that farmers are willing to pay more for irrigation water in the dry seasons than for improvement in irrigation water quality. It is, therefore, clear that farmers are rather keen on having more water in the irrigation system. This needs to be an important consideration in designing or redesigning irrigation schemes in areas where irrigation is crucial for livelihoods.
We also observed that there was a high level of random choice of the irrigation schemes. There was low interest in irrigation water quality and even lower in water sharing with downstream users. There was, in fact, a considerable level of heterogeneity among the sample respondents. Farmers’ preference for a higher frequency of irrigation without considering quality may affect the soil properties in terms of sustainability [43]. This aspect, not addressed in our study, needs to be investigated in future studies to ensure that land in the cold deserts is cultivated in a sustainable manner. The issue of water quality could be associated with the fact that most farmers consider the current quality of irrigation water to be good. Lack of interest in sharing irrigation water with downstream users can only emanate from the water shortage.
Given the history of inefficient management of water resources in the region, it is not illogical to expect further deterioration of water resources. This deterioration will profoundly affect agricultural productivity and, hence, livelihoods in the cold winter deserts. This will create tension between upstream and downstream users of water resources. Possible solutions entail the designing and implementation of demand-driven and carefully targeted irrigation schemes. We hope our findings and similar further studies will assist decision makers to develop such irrigation programs that will address human needs and sustainability in terms of both environmental and social justice.

Author Contributions

Conceptualization, G.T.K.; data curation, H.B.; formal analysis, G.T.K.; funding acquisition, R.S. and A.A.; investigation, H.B.; methodology, G.T.K.; project administration, R.S. and A.A.; resources, R.S. and A.A.; supervision, H.B.; writing—original draft, G.T.K., H.B., R.S. and A.A.; writing—review and editing, G.T.K., R.S. and A.A. All authors have read and agreed to the published version of the manuscript.

Funding

This research was funded by the Government of Germany under Central Asian Desert Initiative (CADI) through United Nations Food and Agricultural Organization (FAO) Uzbekistan.

Institutional Review Board Statement

Not applicable.

Informed Consent Statement

Informed consent was obtained from all subjects involved in the study. Hence, data were generated from households who were willing to participate in the paper based survey.

Data Availability Statement

The dataset and the Stata do-file used in this study are available from the corresponding author upon request.

Acknowledgments

This study was conducted by ICARDA under funding support of the “Central Asian Desert Initiative” project being implemented by FAO as part of the International Climate Initiative (IKI). The Federal Ministry for the Environment, Nature Conservation, and Nuclear Safety (BMU) supports this initiative based on a decision adopted by the German Bundestag. We are very grateful for the funding we received from FAO-Uzbekistan and the Central Asian Desert Initiative (CADI). We do also appreciate very much the administrative and logistical support from local communities in Durmon and Chuya, the Forestry Department in Durmon and Chuya, the District and Local Administrative Offices in Karakul and Nurata, and the Scientific Research Institute of Southern Crop Husbandry, Karshi, Uzbekistan.

Conflicts of Interest

We the authors of the study declare that we have no conflict of interest in the writing or submission of this article.

References

  1. Fisher, B.; Kulindwa, K.; Mwanyoka, I.; Turner, R.K.; Burgess, N.D. Common pool resource management and PES: Lessons and constraints for water PES in Tanzania. Ecol. Econ. 2010, 69, 1253–1261. [Google Scholar] [CrossRef]
  2. Feng, L.; Xu, J. Farmers’ Willingness to Participate in the Next-Stage Grain-for-Green Project in the Three Gorges Reservoir Area, China. Environ. Manag. 2015, 56, 505–518. [Google Scholar] [CrossRef]
  3. Alam Memon, J.; Thapa, G.B. Explaining the de facto open access of public property commons: Insights from the Indus Delta mangroves. Environ. Sci. Policy 2016, 66, 151–159. [Google Scholar] [CrossRef]
  4. Food and Agriculture Organization. FAO, Uzbekistan to Cooperate on Sustainable Use of Cold Winter Deserts. 2017. Available online: http://www.fao.org/europe/news/detail-news/en/c/1043579/ (accessed on 28 May 2021).
  5. Chandrasekaran, K.; Devarajulu, S.; Kuppannan, P. Farmers’ Willingness to Pay for Irrigation Water: A Case of Tank Irrigation Systems in South India. Water 2009, 1, 5–18. [Google Scholar] [CrossRef] [Green Version]
  6. Kidane, T.T.; Wei, S.; Sibhatu, K.T. Smallholder farmers’ willingness to pay for irrigation water: Insights from Eritrea. Agric. Water Manag. 2019, 222, 30–37. [Google Scholar] [CrossRef]
  7. Biswas, D.; Venkatachalam, L. “Farmers’ Willingness to Pay for Improved Irrigation Water—A Case Study of Mal-aprabha Irrigation Project in Karnataka, India. Water Econ. Policy 2015, 1, 1450004. [Google Scholar] [CrossRef] [Green Version]
  8. Expósito, A. Valuing Households’ Willingness to Pay for Water Transfers from the Irrigation Sector: A Case Study of the City of Seville (Southern Spain). Sustainability 2019, 11, 6982. [Google Scholar] [CrossRef] [Green Version]
  9. Meunier, S.; Manning, D.T.; Quéval, L.; Cherni, J.A.; Dessante, P.; Zimmerle, D. Determinants of the marginal willing-ness to pay for improved domestic water and irrigation in partially electrified Rwandan villages. Int. J. Sustain. Dev. World Ecol. 2019, 26, 547–559. [Google Scholar] [CrossRef] [Green Version]
  10. Aman, M.; Shumeta, Z.; Kebede, T. Economic Valuation of Improved Irrigation Water Use: The Case of Meskan District, Southern Ethiopia. Cogent Environ. Sci. 2020, 6, 1843311. [Google Scholar] [CrossRef]
  11. Chipfupa, U.; Wale, E. Smallholder willingness to pay and preferences in the way irrigation water should be managed: A choice experiment application in KwaZulu-Natal, South Africa. Water SA 2019, 45, 383–392. [Google Scholar] [CrossRef] [Green Version]
  12. Mekonnen, A.; Gebreegziabher, Z.; Beyene, A.D.; Hagos, F. Valuation of Access to Irrigation Water in Rural Ethiopia: Application of Choice Experiment and Contingent Valuation Methods. Water Econ. Policy 2019, 6, 1950007. [Google Scholar] [CrossRef] [Green Version]
  13. Bell, A.R.; Shah, M.A.A.; Ward, P.S. Reimagining cost recovery in Pakistan’s irrigation system through willingness-to-pay estimates for irrigation water from a discrete choice experiment. Water Resour. Res. 2014, 50, 6679–6695. [Google Scholar] [CrossRef] [PubMed] [Green Version]
  14. Burton, M.; Cooper, B.; Crase, L. Analysing Irrigation Farmers’ Preferences for Local Governance Using a Discrete Choice Experiment in India and Pakistan. Water 2020, 12, 1821. [Google Scholar] [CrossRef]
  15. Chen, Y.; Fang, G.; Hao, H.; Wang, X. Water use efficiency data from 2000 to 2019 in measuring progress towards SDGs in Central Asia. Big Earth Data 2020, 2020, 1851891. [Google Scholar] [CrossRef]
  16. World Water Forum Secretariat. Bridging Divides for Water, Istanbul 2009, Proceedings of the 5th World Water Forum Reports from Central Asia, Istanbul, Turkey, 16–22 March 2009; Final Report; World Water Council: Marseille, France, 2009. [Google Scholar]
  17. Bucknall, J.; Klytchnikova, I.; Lampietti, J.; Lundell, M.; Scatasta, M.; Thurman, M. Irrigation in Central Asia. Social, economic and environmental considerations. Eur. Cent. Asia Reg. 2003, 104. Available online: https://web.worldbank.org/archive/website00993/WEB/PDF/IRRIGA-3.PDF (accessed on 5 December 2021).
  18. Yan, Z.; Tan, M. Changes in agricultural virtual water in Central Asia, 1992–2016. J. Geogr. Sci. 2020, 30, 1909–1920. [Google Scholar] [CrossRef]
  19. Akramkhanov, A.; Vlek, P.L.G. The assessment of spatial distribution of soil salinity risk using neural network. Environ. Monit. Assess. 2011, 184, 2475–2485. [Google Scholar] [CrossRef]
  20. Shirokova, Y.I.; Morozov, A.N. Salinity of irrigated lands of Uzbekistan: Causes and present state. In Sabkha Ecosystems; Springer: Dordrecht, The Netherlands, 2008; Volume II, pp. 249–259. [Google Scholar]
  21. Smith, D.R. Salinization in uzbekistan. Post Sov. Geogr. 1992, 33, 21–33. [Google Scholar] [CrossRef]
  22. Wæhler, T.A.; Dietrichs, E.S. The vanishing Aral Sea: Health consequences of an environmental disaster. Tidsskr. Nor. Legeforening 2017, 137, 18. [Google Scholar] [CrossRef] [PubMed] [Green Version]
  23. Bekturganov, Z.; Tussupova, K.; Berndtsson, R.; Sharapatova, N.; Aryngazin, K.; Zhanasova, M. Water Related Health Problems in Central Asia—A Review. Water 2016, 8, 219. [Google Scholar] [CrossRef]
  24. Kulmatov, R.; Mirzaev, J.; Abuduwaili, J.; Karimov, B. Challenges for the sustainable use of water and land resources under a changing climate and increasing salinization in the Jizzakh irrigation zone of Uzbekistan. J. Arid. Land 2020, 12, 90–103. [Google Scholar] [CrossRef] [Green Version]
  25. Gantioler, S.; Gundimeda, H.; Sukhdev, P.; Tucker, G.; Martin, J.; White, S. The Economics of Ecosystems and Biodiversity TEEB for National and International Policy Makers, Part I: The Need for Action, 2009; Economics of Ecosystems and Biodiversity (TEEB): Geneva, Switzerland, 2011; p. 39. Available online: http://doc.teebweb.org/wp-content/uploads/2014/04/TEEB-in-national-and-international-Policy-Making2011.pdf (accessed on 5 December 2021).
  26. Yang, X.; Wang, N.; Chen, A.; He, J.; Hua, T.; Qie, Y. Changes in area and water volume of the Aral Sea in the arid Central Asia over the period of 1960–2018 and their causes. Catena 2020, 191, 104566. [Google Scholar] [CrossRef]
  27. Micklin, P. The Aral Sea Crisis; Springer: Dordrecht, The Netherlands, 2004; pp. 99–123. [Google Scholar]
  28. Kim, E. Sustainability of Irrigation in Uzbekistan: Implications for Women Farmers. In Water and Sustainability; IntechOpen: London, UK, 2019. [Google Scholar]
  29. Lancaster, K.J. A New Approach to Consumer Theory. J. Pol. Econ. 1966, 74, 132–157. [Google Scholar] [CrossRef]
  30. McFadden, D. Condition logit analysis of qualitative choice behavior. In Frontiers in Econometrics; Academic Press: New York, NY, USA, 1974; Volume 1, pp. 105–142. [Google Scholar]
  31. Manski, C.F. The structure of random utility models. Theory Decis. 1977, 8, 229–254. [Google Scholar] [CrossRef]
  32. Adamowicz, W.; Louviere, J.; Williams, M. Combining Revealed and Stated Preference Methods for Valuing Environmental Amenities. J. Environ. Econ. Manag. 1994, 26, 271–292. [Google Scholar] [CrossRef]
  33. ChoiceMetrics. Ngene 1.2 User Manual and Reference Guide: The Cutting Edge in Experimental Design. 2018. Available online: http://www.choice-metrics.com/NgeneManual120.pdf (accessed on 5 December 2021).
  34. Train, K. Discrete Choice Models with Simulation; Cambridge University Press: Cambridge, UK, 2003. [Google Scholar]
  35. Scarpa, R.; Thiene, M.; Train, K. Utility in Willingness to Pay Space: A Tool to Address Confounding Random Scale Effects in Destination Choice to the Alps. Am. J. Agric. Econ. 2008, 90, 994–1010. [Google Scholar] [CrossRef]
  36. Train, K.; Weeks, M. Discrete Choice Models in Preference Space and Willingness-to-Pay Space. In Applications of Simulation Methods in Environmental and Resource Economics; Springer: Berlin/Heidelberg, Germany, 2005; pp. 1–16. [Google Scholar]
  37. Goodman, L.A. Exploratory Latent Structure Analysis Using Both Identifiable and Unidentifiable Models. Biometrika 1974, 61, 215–231. [Google Scholar] [CrossRef]
  38. Magidson, J.; Vermunt, J.K. Removing the scale factor confound in multinomial logit choice models to obtain better estimates of preference. In Proceedings of the Sawtooth Software Conference, Santa Rosa, CA, USA, 17–19 October 2007; pp. 139–154. [Google Scholar]
  39. Scarpa, R.; Gilbride, T.J.; Campbell, D.; Hensher, D.A. Modelling attribute non-attendance in choice experiments for rural landscape valuation. Eur. Rev. Agric. Econ. 2009, 36, 151–174. [Google Scholar] [CrossRef]
  40. Campbell, D.; Hensher, D.A.; Scarpa, R. Non-attendance to attributes in environmental choice analysis: A latent class specification. J. Environ. Plan. Manag. 2011, 54, 1061–1076. [Google Scholar] [CrossRef]
  41. Lagarde, M. Investigating attribute non-attendance and its consequences in choice experiments with latent class models. Health Econ. 2013, 22, 554–567. [Google Scholar] [CrossRef]
  42. Vermunt, J.K.; Magidson, J. Applications of Latent Class Analysis: An Introduction to the Technique and the Latent GOLD Software. 2005. Available online: https://www.gla.ac.uk/external/RSS/RSScomp/vermunt.pdf (accessed on 5 December 2021).
  43. Fallahzade, J.; Hajabbasi, M. The effects of irrigation and cultivation on the quality of desert soil in central Iran. Land Degrad. Dev. 2012, 23, 53–61. [Google Scholar] [CrossRef]
Figure 1. Map of Bukhara and its land cover. Note: Map prepared by ICARDA’s geo-informatics unit.
Sustainability 14 00094 g001
Table 1. Attributes of irrigation schemes in the choice experiment.
Attribute/CharacteristicDescriptionLevels Considered
1.
Canal water available in dry season (mainly May–October)
The number of months that irrigation water is available in the canals for irrigation purposes. It shows the level of water shortage during the cropping season.4 Months
5 Months
6 Months
2.
Crop water frequency
This is the number of watering for a crop farm from the irrigation canals during the cropping season.2 watering/month
4 watering/month
6 watering/month
3.
Irrigation water quality
The purity of the irrigation water based on farmers’ subjective assessments.Bad
Medium
Good
4.
Water sharing with downstream users
Some farmers directly use the canal water for themselves, while others share with neighboring farmers. Our measure is sharing once or twice per month with downstream farmers.Once/month
Twice/month
5.
Semi-volumetric irrigation water user charge/annum
The amount of money the water-user households pay for irrigation in the cropping season.UZS 250K
UZS 350K
UZS 450K
UZS stands for Uzbekistan Soms. In May 2020, 1 US Dollar was equivalent to 10,138.19 UZS.
Table 2. Characteristics of the sample households.
MeanSt. Dev.FrequencyPercentage
Age43.2311.87
Household size (0.1 ha)15.347.98
Gender (1 = female) 6432
Education
Primary42
Secondary15778.5
Professional school3517.5
Bachelor’s degree42
Mainstay of livelihood
Farming only7537.5
Farming and others12562.5
Farming experience18.729.58
Distance to the water source2.060.88
Water shortage months3.071.31
Pump user
“Sayyod” pump42
Private pump18894
Neighbor pump (rent)16582.5
Water shortage experience
None21
Sometimes17688
Always2211
Water quality (1 = good) 19296
WTP for irrigation water
<5K UZS 8140.5
5K to 10K UZS 9447
>10K UZS 2512.5
Single irrigation expenses (,000 UZS)40.1717.23
Annual irrigation expenses (,000 UZS)351196.59
Annual income from the household (Mil. UZS)20.98
Other monthly income (Mil. UZS)1.160.68
Observations200
Frequencies calculated for each pump separately (n = 200).
Table 3. Willingness to pay for irrigation schemes.
Model 1Model 2
Mean
Alternative specific constant9.468 ***2.4135.102 **2.076
Canal water available in dry seasons1.142 ***0.2801.500 ***0.346
Crop water frequency1.707 ***0.3151.769 ***0.320
Medium irrigation water quality0.0190.1870.2480.216
High irrigation water quality1.187 ***0.3231.205 ***0.355
Water sharing with downstream−0.1160.3400.0940.445
Annual irrigation fee−1.523 ***0.172−1.417 ***0.170
SD
Canal water available in dry seasons−0.846 ***0.2920.997 ***0.227
Crop water frequency1.131 ***0.2321.250 ***0.253
Medium irrigation water quality−0.1420.3070.955 *0.491
High irrigation water quality1.715 ***0.4141.797 ***0.424
Water sharing with downstream3.822 ***0.7304.351 ***0.795
Annual irrigation fee−0.0530.0850.543 ***0.066
Observations8100 8100
LL−1832.139 −1769.525
AIC3690.277 3595.050
BIC3781.272 3791.040
Note: * p < 0.10, ** p < 0.05, *** p < 0.01. Model 1 is RPL with independent random coefficients, and Model 2 is RPL with correlated random coefficients. LL stands for log likelihood; AIC stands for Akaike Information Criterion; and BIC stands for Bayesian Information Criterion.
Table 4. Latent class models with and without scale heterogeneity.
Group of ModelsNo.LCM ModelLLBIC(LL)Npar
Non-scaled 1-6 LCMModel11-class choice−1913.623867.167
Model22-class choice−1782.513650.5715
Model33-class choice−1720.203571.5823
Model44-class choice−1684.703546.2231
Model55-class choice−1666.993556.4239
Model66-class choice−1637.403542.8747
Scaled 1-6 LCM with 2 scale classesModel72-sclass 1-class choice−1896.543844.429
Model82-sclass 2-class choice−1733.593564.1517
Model92-sclass 3-class choice−1700.953544.4925
Model102-sclass 4-class choice−1676.493541.2033
Model112-sclass 5-class choice−1656.463546.7741
Model122-sclass 6-class choice−1639.753558.9849
Scaled 1-6 LCM with 3 scale classesModel133-sclass 1-class choice−1896.503855.7411
Model143-sclass 2-class choice−1724.663557.7019
Model153-sclass 3-class choice−1694.693543.3927
Model163-sclass 4-class choice−1677.283548.5034
Model173-sclass 5-class choice−1655.083549.7342
Model183-sclass 6-class choice−1642.983565.4549
Table 5. Estimated part-worth values for the preference classes.
AttributesClass1z-ValueClass2z-ValueClass3z-ValueClass4z-Value
Class size0.64300.19250.14320.0213
Canal water availability (dry season)0.098 **2.1785.405 **2.130−0.394−0.9450.0270.064
Crop water frequency0.126 ***5.7644.309 **2.2712.436 ***6.4970.398 *1.831
Low irrigation water quality−0.150 ***−3.696−0.529 *−1.942−2.916 ***−6.142−4.124−1.509
Medium irrigation water quality0.102 **2.216−2.204 *−1.8670.2370.4940.8580.612
High irrigation water quality0.0480.9932.733 **2.0412.679 ***4.0193.267 **2.314
Water sharing with downstream0.140 **2.3857.862 *1.965−7.337 ***−6.106−0.864−1.215
Annual irrigation fee−0.147 ***−3.766−0.865 *−1.703−1.464 ***−4.013−0.475 *−1.177
Alternative specific constant4.211 ***8.020−40.982 **−2.21113.639 ***3.553−0.537−0.169
Note: * p < 0.10, ** p < 0.05, *** p < 0.01.
Table 6. Irrigation scheme attribute nonattendance pattern.
ClassLC Model 1LC Model 2LC Model 3
Class SizeClass SizeClass Size
Full attendance126.4%21.2%22.0%
Full non-attendance259.1%53.8%47.1%
Availability NA32.1%
Frequency NA42.0%
Quality NA50.1%
Downstream NA610.0%0.1%
Fee NA70.3%
Availability and frequency NA8 1.7%
Availability and quality NA9 0.0%
Availability and downstream NA10 0.1%
Availability and fee NA11 0.3%
Frequency and quality NA12 0.4%
Frequency and downstream NA13 1.6%
Frequency and fee NA14 0.2%
Quality and downstream NA15 15.3%23.2%
Quality and fee NA16 0.1%
Downstream and fee NA17 5.3%7.6%
LL −1845.92−1809.40−1844.14
BIC(LL) 3760.283721.463739.62
AIC(LL) 3715.843654.793706.29
Class. err. 0.120.180.21
Note: the three models are all latent class models with different patterns of restriction on the coefficient of the attributes. The models were estimated using LatentGold 5.1 [42]. NA denotes nonattendance. LL is log likelihood. BIC is Bayesian Information Criterion. AIC is Akaike Information Criterion. Class. err. is classification error indicating the level of misclassification.
Publisher’s Note: MDPI stays neutral with regard to jurisdictional claims in published maps and institutional affiliations.

