Article

Evaluation of Discharging Surplus Soils for Relative Stirred Deep Mixing Methods by MPS-CAE Analysis

1
Graduate School of Engineering and Science, Shibaura Institute of Technology Toyosu Campus, Tokyo 135-8548, Japan
2
Department of Civil Engineering, Shibaura Institute of Technology Toyosu Campus, Tokyo 135-8548, Japan
3
Aoyama Kiko Co., Ltd., 2-18-4 Kita-ueno, Taito-ku, Tokyo 110-0014, Japan
4
Ibuki Industry Co., Ltd., 1-17-5 Higashi-Nakashima, Yodogawa-ku, Osaka 533-0033, Japan
5
Nihon Kaiko Co., Ltd., 119 Ito-cho, Chuo-ku, Kobe 650-0032, Japan
*
Author to whom correspondence should be addressed.
Sustainability 2022, 14(1), 58; https://doi.org/10.3390/su14010058
Submission received: 17 October 2021 / Revised: 8 December 2021 / Accepted: 12 December 2021 / Published: 22 December 2021

Abstract

:
Most of the ground in Japan is soft, leading to great damage in the event of liquefaction. Various ground-improvement measures are being taken to suppress such damage. However, it is difficult to carry out ground-improvement work while checking the internal conditions of the ground during the construction. Therefore, a visible and measurable evaluation of the performance of the ground-improvement work was conducted in this study. The authors performed a simulation analysis of the relative stirred deep mixing method (RS-DMM), a kind of ground-improvement method, using a computer-aided engineering (CAE) analysis based on particle-based methods (PBMs). In the RS-DMM, the “displacement reduction type (DRT)” suppresses displacement during construction. Both the DRT and the normal type (NT) were simulated, and a visible and measurable evaluation was performed on the internal conditions during each construction, the quality of the improved body, and the displacement reduction performance. As an example of these results, it was possible to visually evaluate the discharge of surplus soil by the spiral rod attached to the stirring wing of the DRT. In addition, the authors succeeded in quantitatively showing that more surplus soil was discharged when the stirring wing of the DRT was used than when the stirring wing of the NT was used.

1. Introduction

Japan is a disaster-prone country that is exposed to the threat of various disasters, such as earthquakes, tsunamis, and floods caused by heavy rains. In addition, there are many soft grounds mainly composed of fine particles, such as clay, silt, and sand, especially in urban waterfront areas, which are the cause of great damage due to liquefaction. The phenomenon of liquefaction was first noticed in the 1964 Niigata Earthquake, and more recently in the Great East Japan Earthquake that occurred on 11 March 2011 and caused substantial damage, especially in Urayasu City, Chiba Prefecture [1,2,3]. There is great concern about damage caused by liquefaction in the event of an earthquake directly beneath the Tokyo metropolitan area or a huge Nankai Trough earthquake that is expected to occur in the future. In modern times, the world must protect its land from various disasters, such as earthquakes, tsunamis, and floods caused by heavy rains. For that purpose, it is necessary to improve the land, that is, the ground, so that it is sustainable against disasters. This concept will directly contribute to the achievement of Goal 11 (Sustainable Cities and Communities) in the Sustainable Development Goals (SDGs).
Various ground-improvement measures are being taken to suppress damage associated with various disaster [4,5]. Ground-improvement measures are indispensable measures for forming sustainable ground in the future. By performing ground-improvement work, it is possible to prevent the liquefaction phenomenon and suppress its damage. However, it is difficult to perform ground-improvement work while checking the internal conditions of the ground during the construction, and the design and evaluation are based on empirical rules [6,7,8]. Therefore, the purpose of the present study was to conduct a visible and measurable evaluation of the quality and performance of ground-improvement work by computer simulation.
A simulation analysis of the relative stirred deep mixing method (RS-DMM) [9], a kind of ground-improvement method, was performed in this study using a computer-aided engineering (CAE) analysis based on the moving particle semi-implicit (MPS) method, which is one of the particle-based methods (PBMs) [10,11]. The RS-DMM is a method of penetrating and stirring while rotating the inner and outer wings of the stirring wing in opposite directions and discharging the solidifying material from the tip of the stirring wing [9,12]. In addition, the “displacement reduction type (DRT)” of RS-DMM suppresses displacement during the construction. A series of operations, such as penetration, stirring, and extraction, performed by the DRT and the normal-type (NT) RS-DMM, was reproduced with a 3D model. Then, a visible and measurable evaluation was conducted on the conditions of the inside of the ground during each construction, the quality of the improved body, and the displacement reduction performance.

2. Deep Mixing and Relative Stirred Deep Mixing Methods

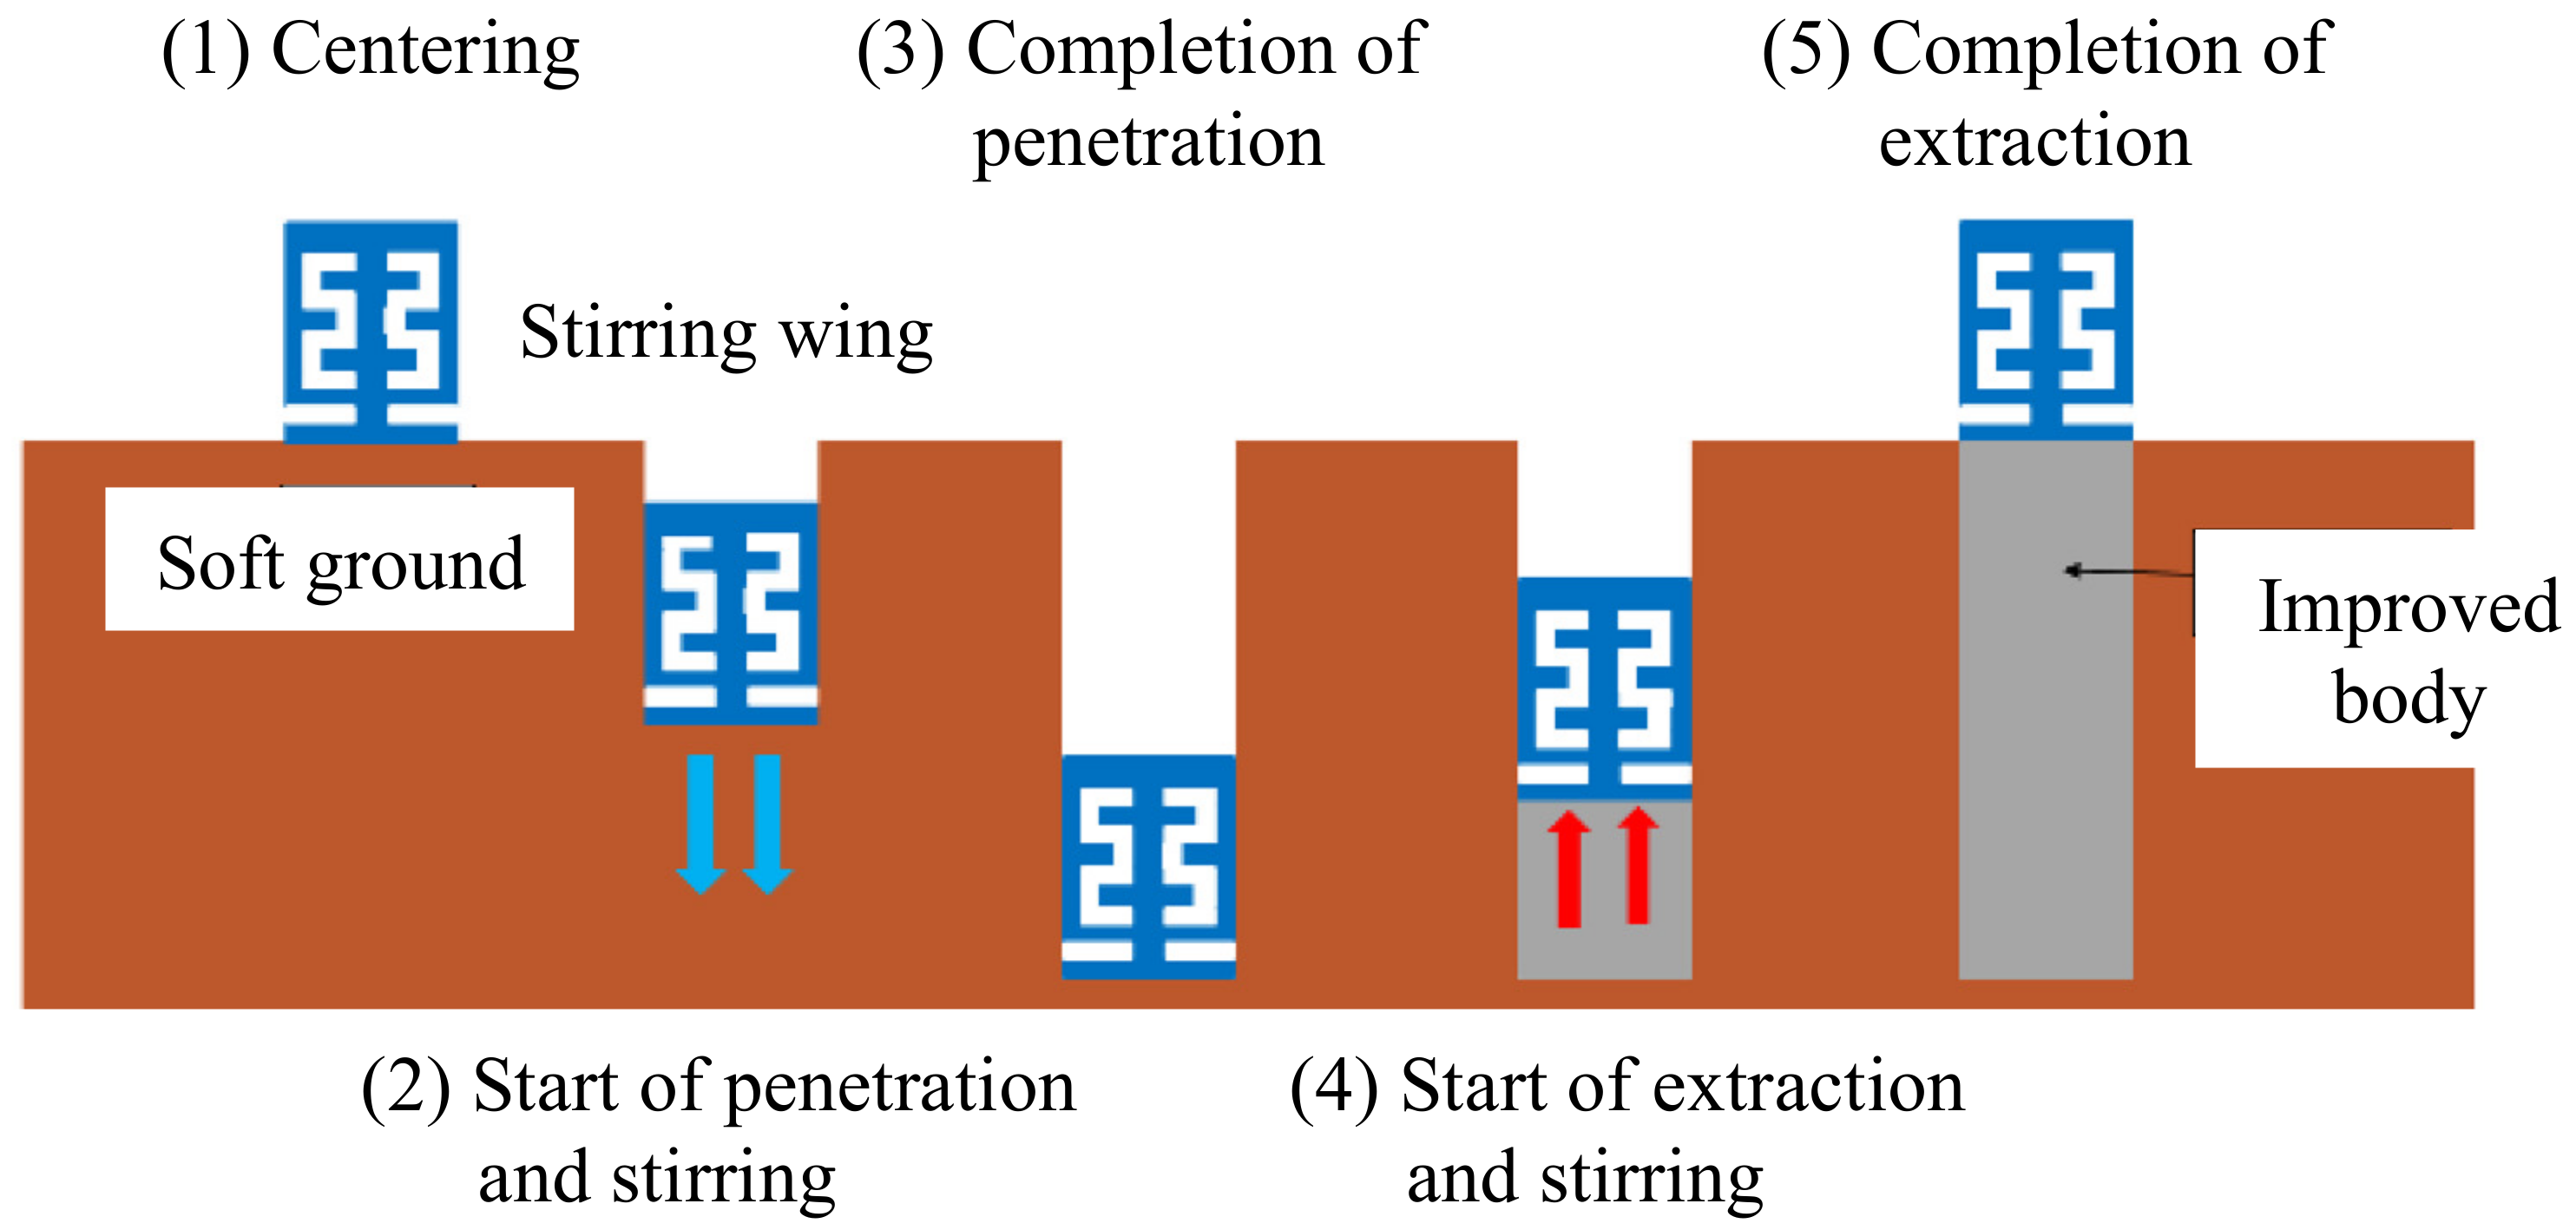
2.1. Construction Methods

Ground improvement has various sustainable effects on soft grounds, such as the prevention of liquefaction, increase in bearing capacity, and promotion of consolidation. Currently, there are many ground-improvement methods, such as the replacement method, accelerated consolidation method, compaction method, solidifying method, reinforcement method, and injection method. They are selected for use according to the characteristics of the targeted soft ground and the purpose of the improvement. Deep mixing methods (DMMs) comprise one of the solidifying methods among ground-improvement methods. In DMMs, while the stirring wing penetrates the targeted soft ground, slurry-like or powder-like solidifying material and the soft ground are forcibly stirred and mixed to construct a columnar improved body in the targeted soft ground. One of the DMMs, the relative stirred deep mixing method (RS-DMM), is a method of rotating the inner and outer wings of the stirring wing in opposite directions at different speeds while discharging a slurry-like solidifying material from the tip of the stirring wing [9,12,13]. By rotating the inner and outer wings in opposite directions, it is possible to add the effects of “kneading” and “mixing” to the mixing of the targeted soft ground and the solidifying material. One of the issues that can occur when a DMM is applied to a soft ground is “co-rotation”. Co-rotation is the phenomenon in which the unimproved parts remain due to their rotating together with the cohesive soil that becomes attached to the stirring wing during stirring and mixing. It occurs especially in cohesive soil and causes variations in the quality of the improved bodies. Cohesive soil adheres to the stirring wing due to the cohesion force of the cohesive soil, further cohesive soil adheres due to the cohesion force of the adhered cohesive soil, and cohesive soil also adheres to the outside. In this way, the mass of cohesive soil becomes larger and larger and results in the stirring capacity of the stirring wing becoming significantly reduced. The RS-DMM prevents such co-rotation by “kneading” and “mixing” and makes it possible to construct a high-quality, high-strength improved body without variation.
DMMs are used not only as liquefaction countermeasures but also as measures against the subsidence of embankments, the prevention of the slip destruction of grounds including embankments, the stabilization of foundation structures, and so on, and they can be applied under a wide range of ground conditions. The construction flow of DMMs is shown in Figure 1 and is described in the following:
(1)
Axial core set of the stirring wing: The construction position is determined, and the axial core of the stirring wing is set.
(2)
Penetration and stirring of the stirring wing: Penetration and stirring are performed while solidifying material is discharged from the tip of the stirring wing.
(3)
Bottoming and tip treatment: After the specified construction depth has been reached, stirring is performed with the stirring wing for 1 min.
(4)
Extraction and stirring of the stirring wing: Extraction and stirring is performed while the solidifying material is discharged from the tip of the stirring wing. The stirring wing rotates in the opposite direction to that during the penetration.

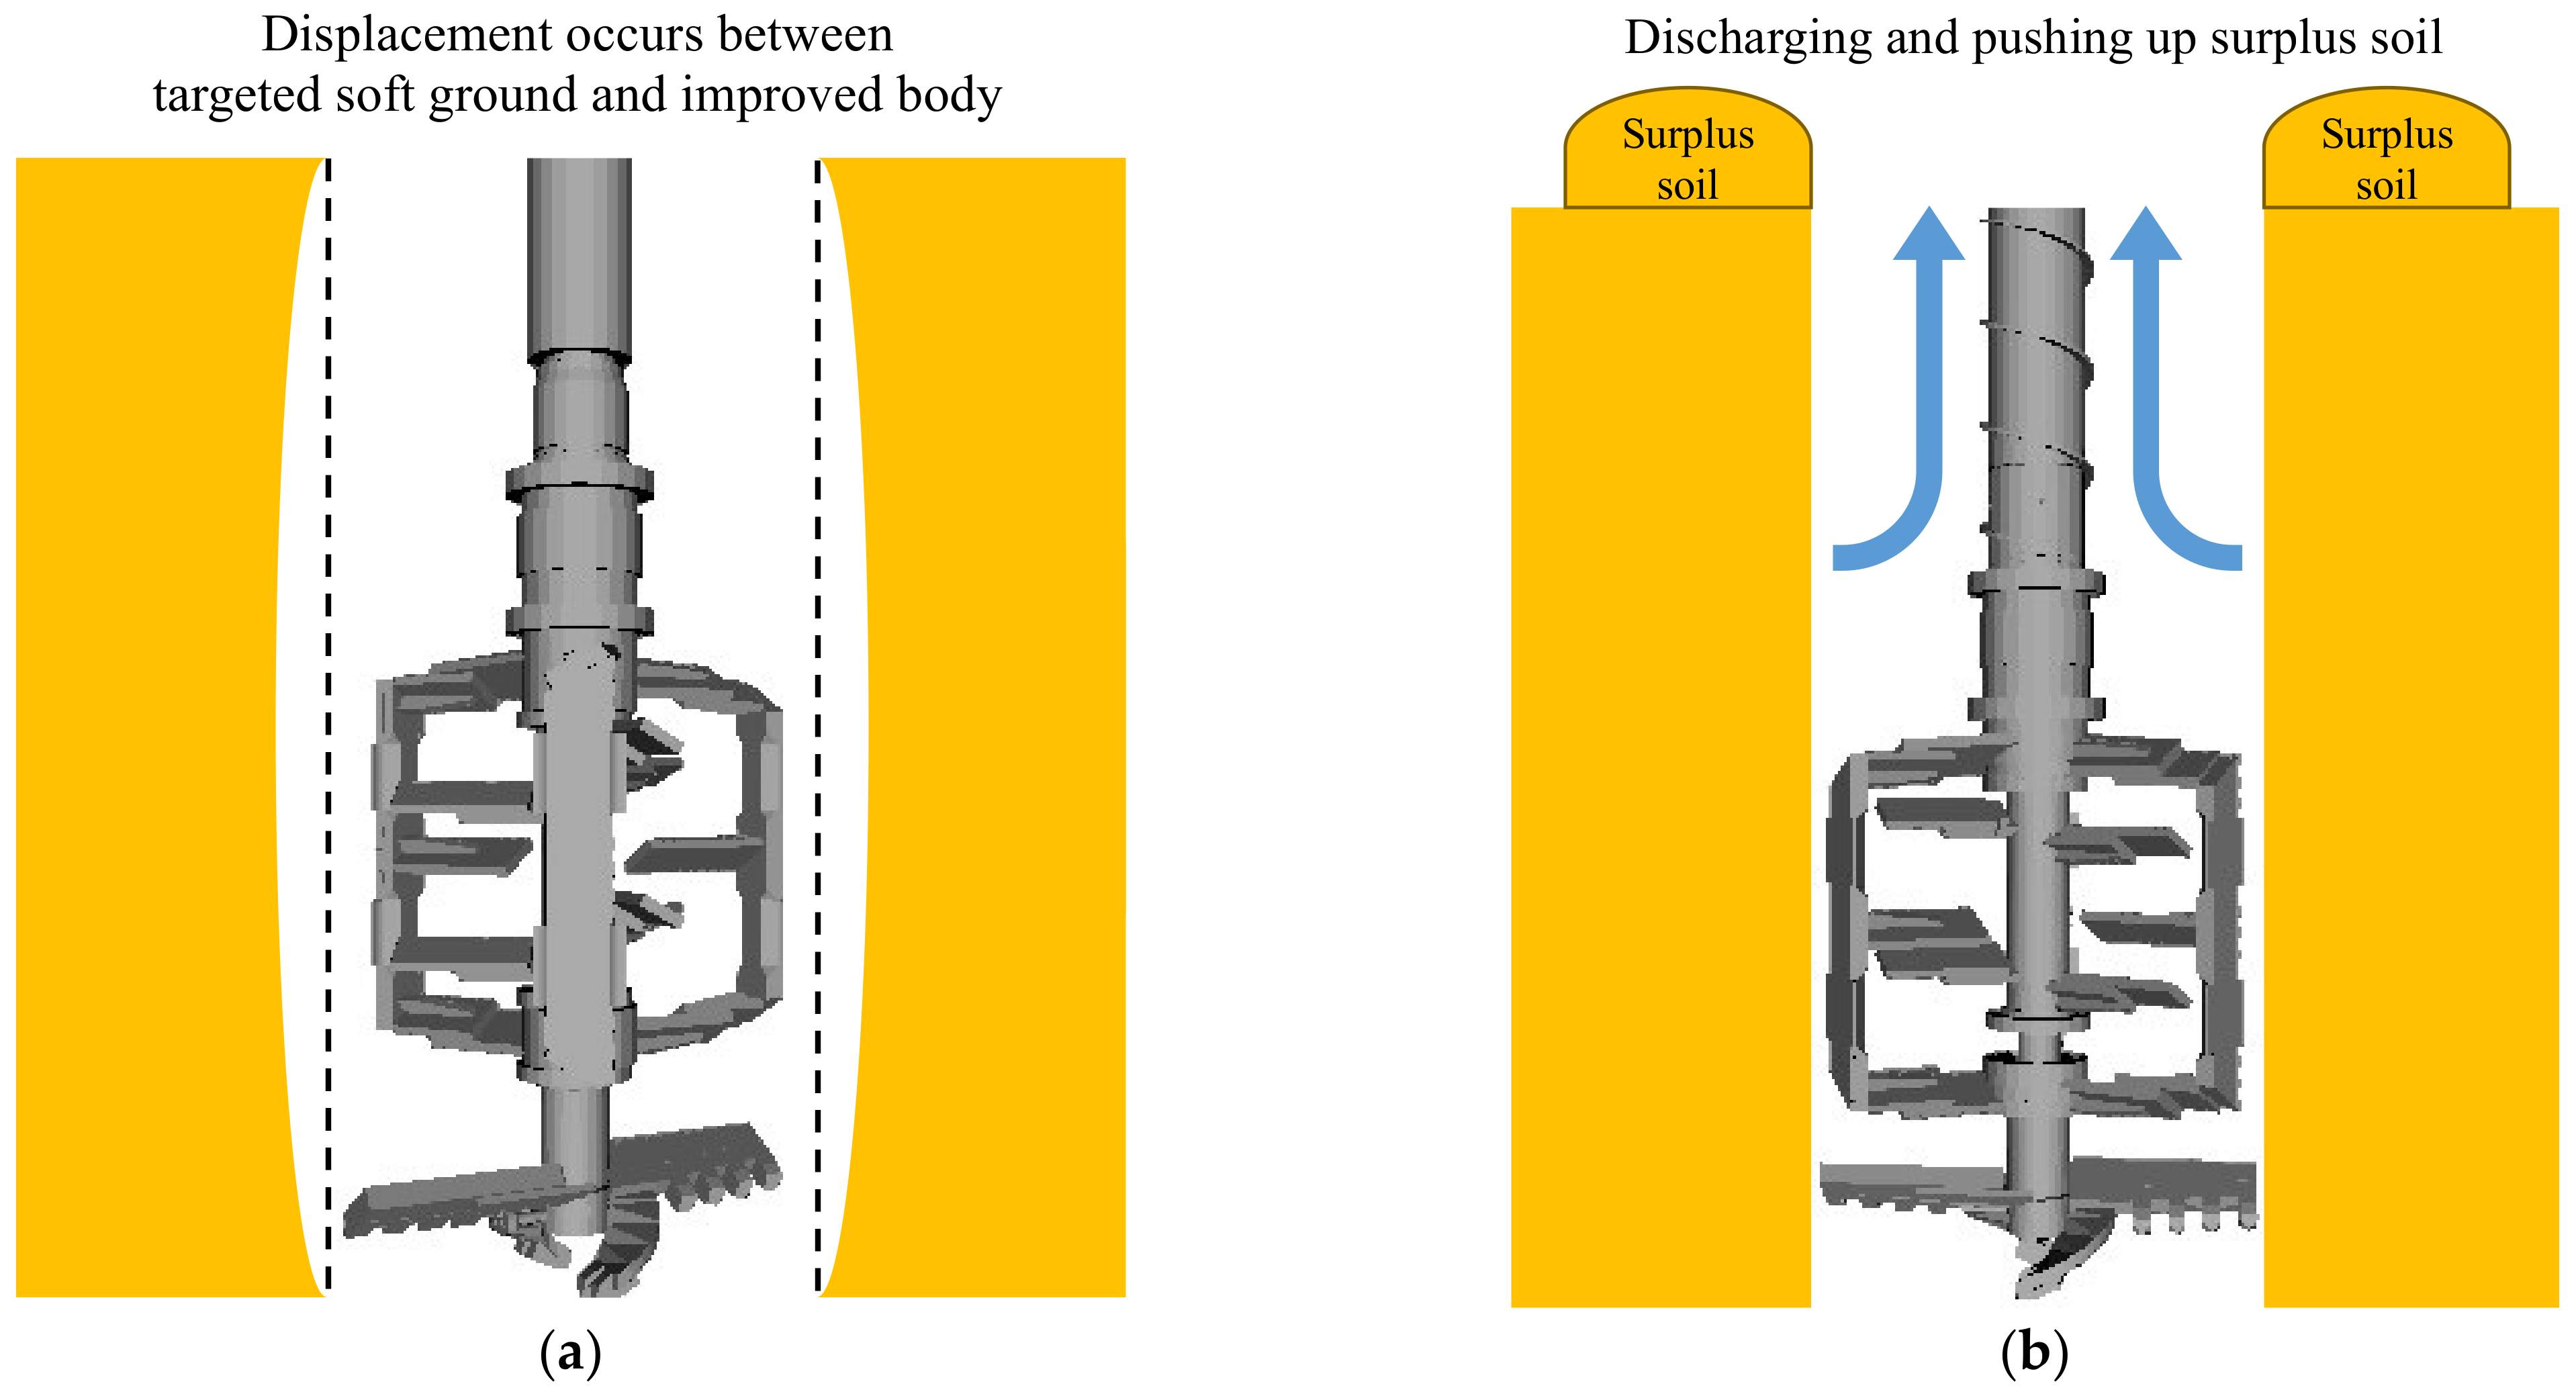
2.2. Occurrence of Displacement and Displacement Reduction Type of Stirring Wing

One of the situations that may arise when performing ground improvement using the relative stirred deep mixing method (RS-DMM) is the effect of “displacement”. When applying the RS-DMM, it is necessary to penetrate the stirring wing into the targeted soft ground and inject a slurry-like solidifying material. When this solidifying material is injected, the material pushes the surrounding soft ground out, increasing the pressure inside the soft ground and causing “displacement” [14,15].
If there are railroads or buildings around the construction site, the construction must be executed while giving due consideration to the impact of displacement. Especially in construction works near railways, there must be strict control of track displacement, and the construction must be handled with the utmost of care.
The stirring wing of the displacement reduction type (DRT) is used in the above situations. The stirring wing of the DRT uses the stirring wing rod as a spiral rod. In order to suppress the displacement, it is necessary to prevent the solidifying material from pushing out the ground, but the effect of the spiral rod promotes the discharge of excess soil equivalent to the solidifying material injection, as shown in Figure 2, and the displacement can be suppressed by releasing the internal pressure in the soft ground. By using the stirring wing of the DRT, it is possible to reduce the displacement as well as its influence on the surrounding structures.

3. Computer-Aided Engineering Analysis with Particle-Based Methods

3.1. Computer-Aided Engineering (CAE)

Computer-aided engineering (CAE) is an alternative technology for large-scale experiments, conducted in a room or in situ, using prototypes that have been prepared in a study as part of the development process of “manufacturing”. In other words, CAE is a general term for technology that simulates and analyzes prototypes on a computer created by a computer-aided design (CAD) and so on, considering the site conditions [16,17,18,19]. At the same time, CAE may refer to computer-aided engineering work or its tools for the prior examination, design, manufacturing, and process design of construction methods and products. In the field of geotechnical engineering, CAE can be used not only to visualize the inside of the ground and the stress loading on the inside of the ground but also to estimate the results of experiments that would entail very high costs and/or phenomena that would be difficult to reproduce. In addition, by performing appropriate post-processing, it is possible to communicate with other people in a visually easy-to-understand manner.
In this study, a simulation using a CAE analysis, based on the moving particle semi-implicit (MPS) method as one of the typical particle-based methods (PBMs), that is an “MPS-CAE analysis”, for the RS-DMM, is performed as a kind of ground-improvement method, and the visible and measurable performance in the targeted soft ground is evaluated.
The possibility and validity of applying the MPS-CAE analysis to the ground and ground-improvement methods has been clarified by Inazumi et al. [13,18,20,21,22] and Nakao et al. [23].

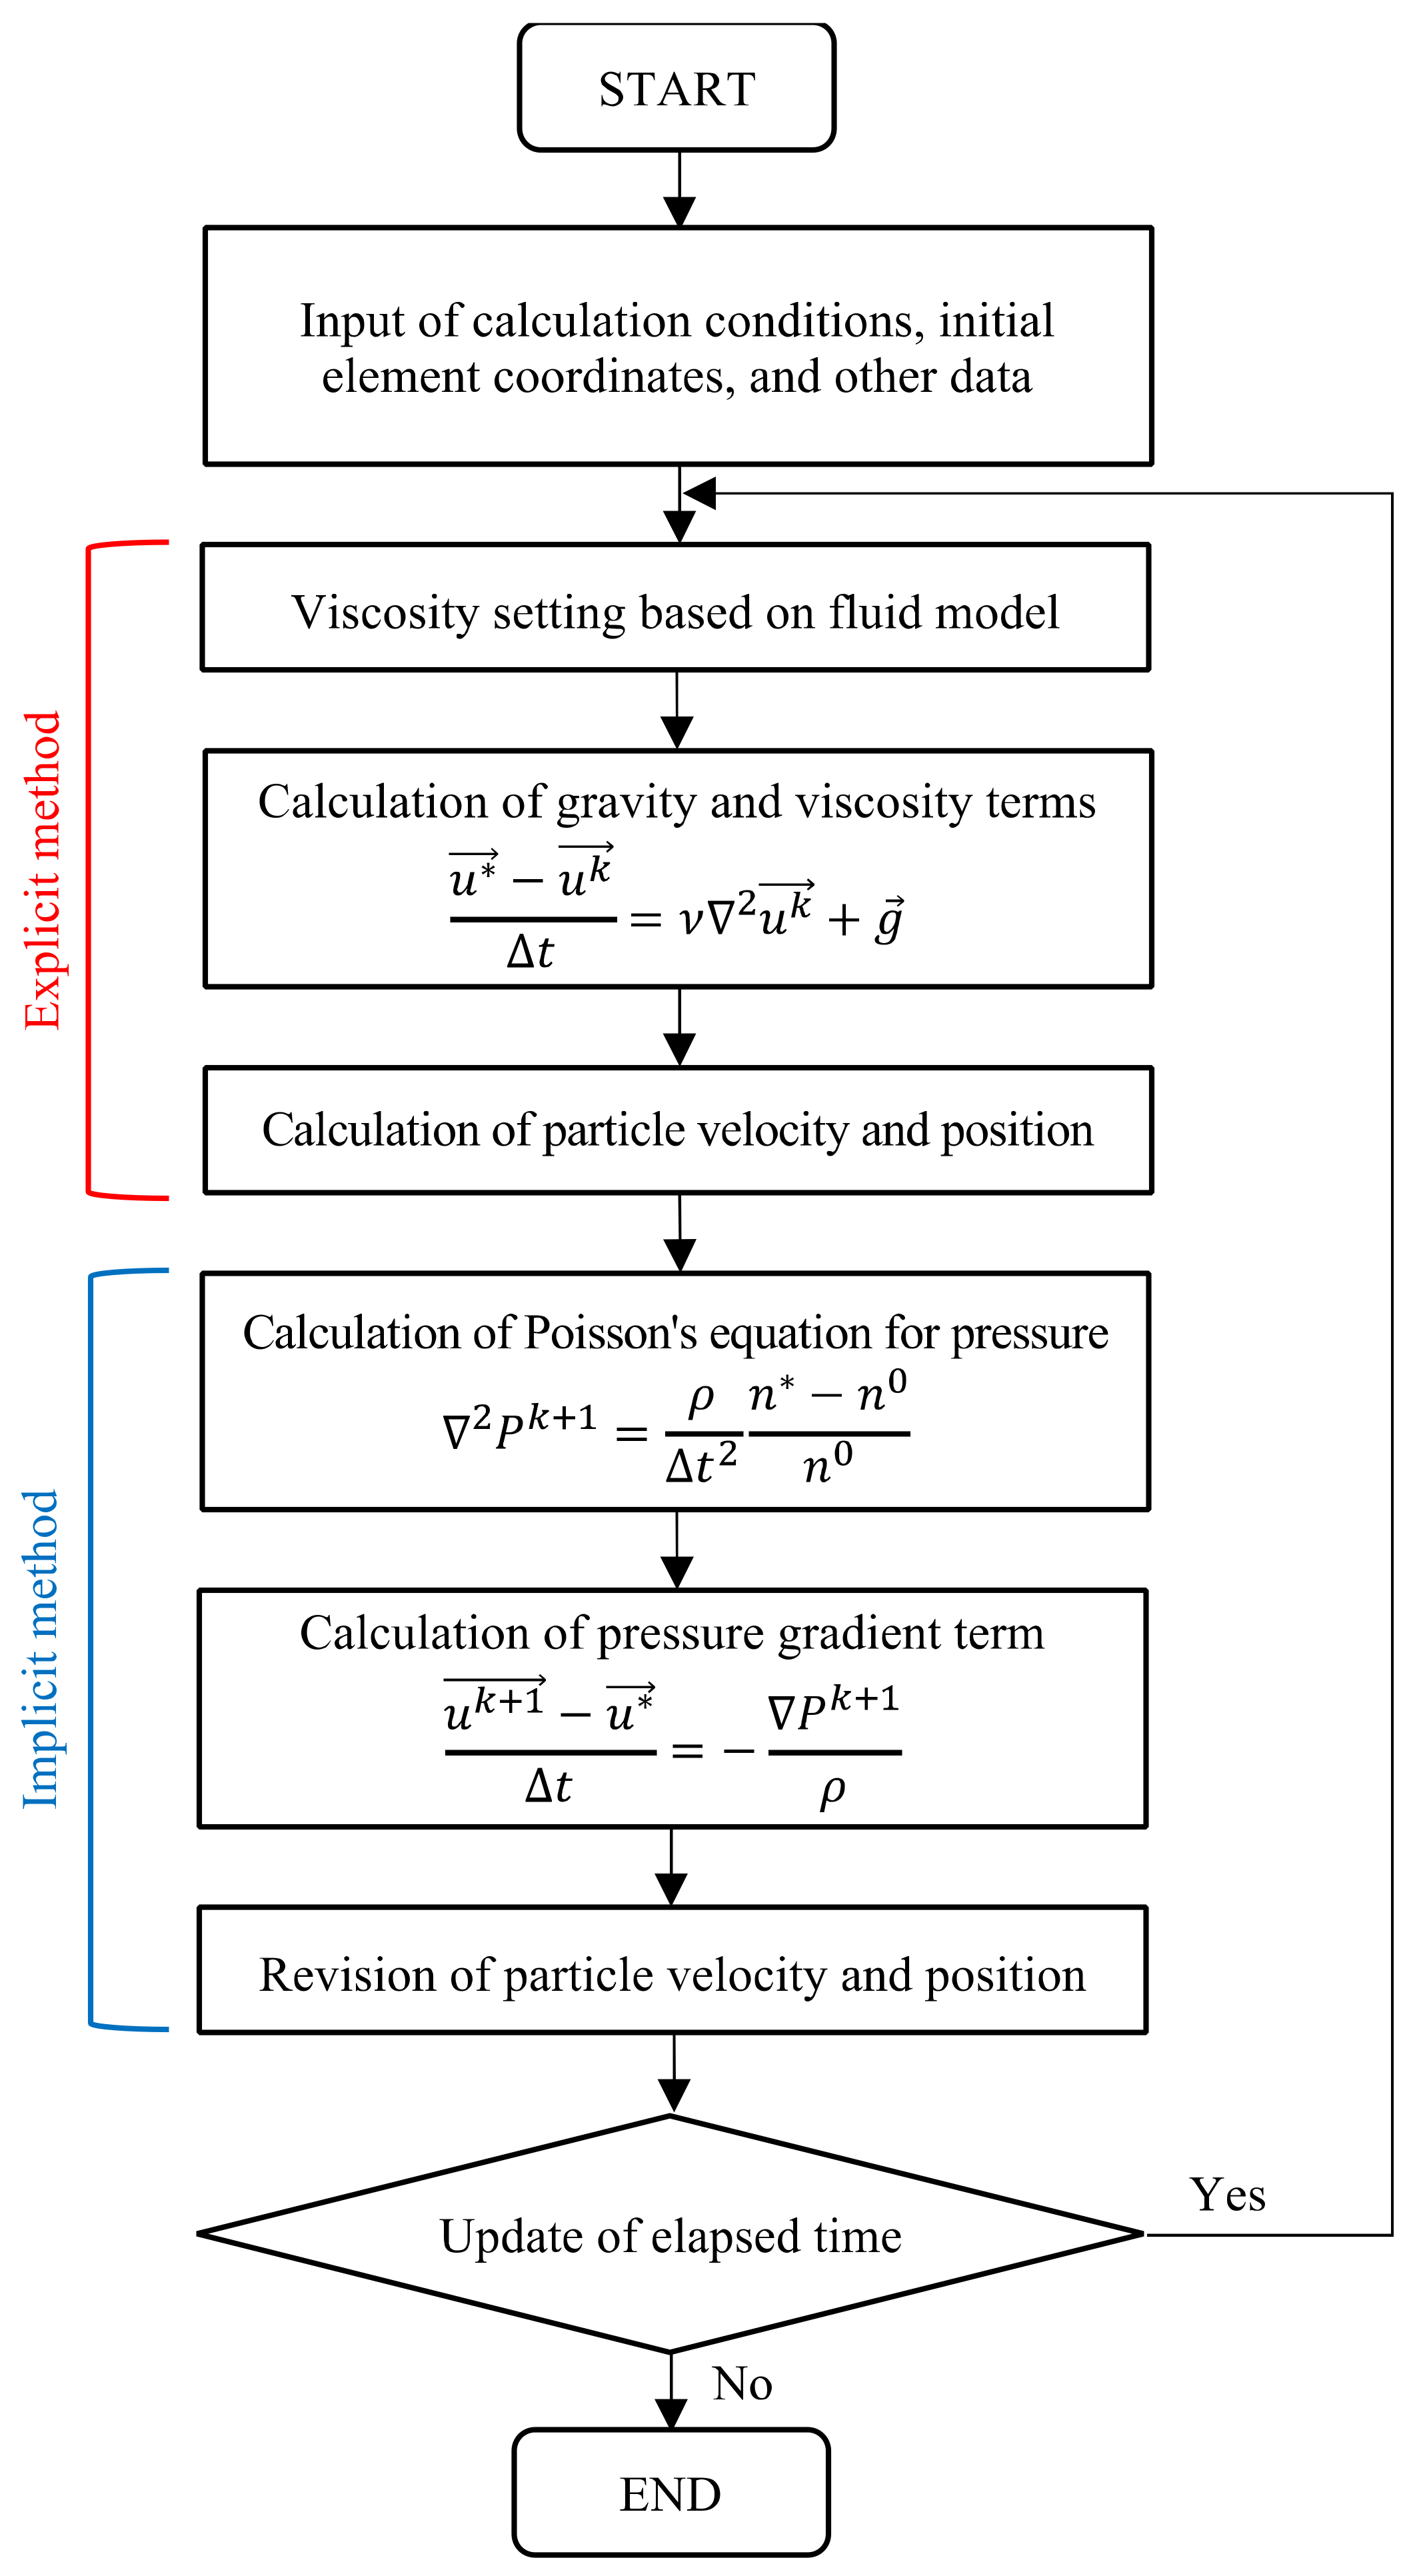
3.2. Particle-Based Methods (PBMs) and Moving Particle Semi-Implicit (MPS) Method

A major feature of particle-based methods (PBMs) is that, unlike the finite element method (FEM) and the finite difference method (FDM), they do not use a lattice, but instead discretize the continuum as particles that move each calculation point with a physical quantity. However, this causes a large difference in the governing equation. When describing the behavior of a continuum, the Euler method (with lattice: FEM, FDM, and so on) and the Lagrange method (non-grid: PBM) are available. In the Lagrange method, the calculation point moves as the object moves and deforms, so the convection term disappears from the governing equation. Equations (1) and (2) show the Navier–Stokes equations by the Euler method and the Lagrange method, respectively [13,21,24,25,26]:
u x , t t + u x , t · u x , t = 1 ρ P x , t + υ 2 u x , t + g x , t
D u X , t D t = 1 ρ P x , t + υ 2 u X , t + g X ,   t
where u is the velocity, P is the pressure, g is the external force, ρ is the density, and υ is the kinematic viscosity coefficient.
The moving particle semi-implicit (MPS) method, one of the typical PBMs, is an incompressible flow analysis method that discretizes a continuum with particles, and the basic governing equations are the continuity equation shown in Equation (3) and the Navier–Stokes equation shown in Equation (4):
D ρ D t = 0
D u D t = P ρ + ν 2 u + g
where D/Dt represents the Lagrange derivative, ρ is the density, u is the velocity, P is the pressure, ν is the coefficient of kinematic viscosity, and g is the gravity. In PBMs, the Navier–Stokes equation is divided into two stages, namely, the pressure term is calculated explicitly from Equation (5) and the pressure gradient term is implicitly calculated from Equations (6) and (7):
u * u k Δ t = ν 2 u k + g
2 P k + 1 = ρ Δ t 2 n * n 0 n 0
u k + 1 u * Δ t = P k + 1 ρ
where n is the particle number density (dimensionless quantity representing the density of the particle arrangement), n0 is the standard particle number density, and k is the time step. The * indicates the physical quantity at the stage when the explicit calculation is completed. Figure 3 shows the calculation algorithm of the MPS.

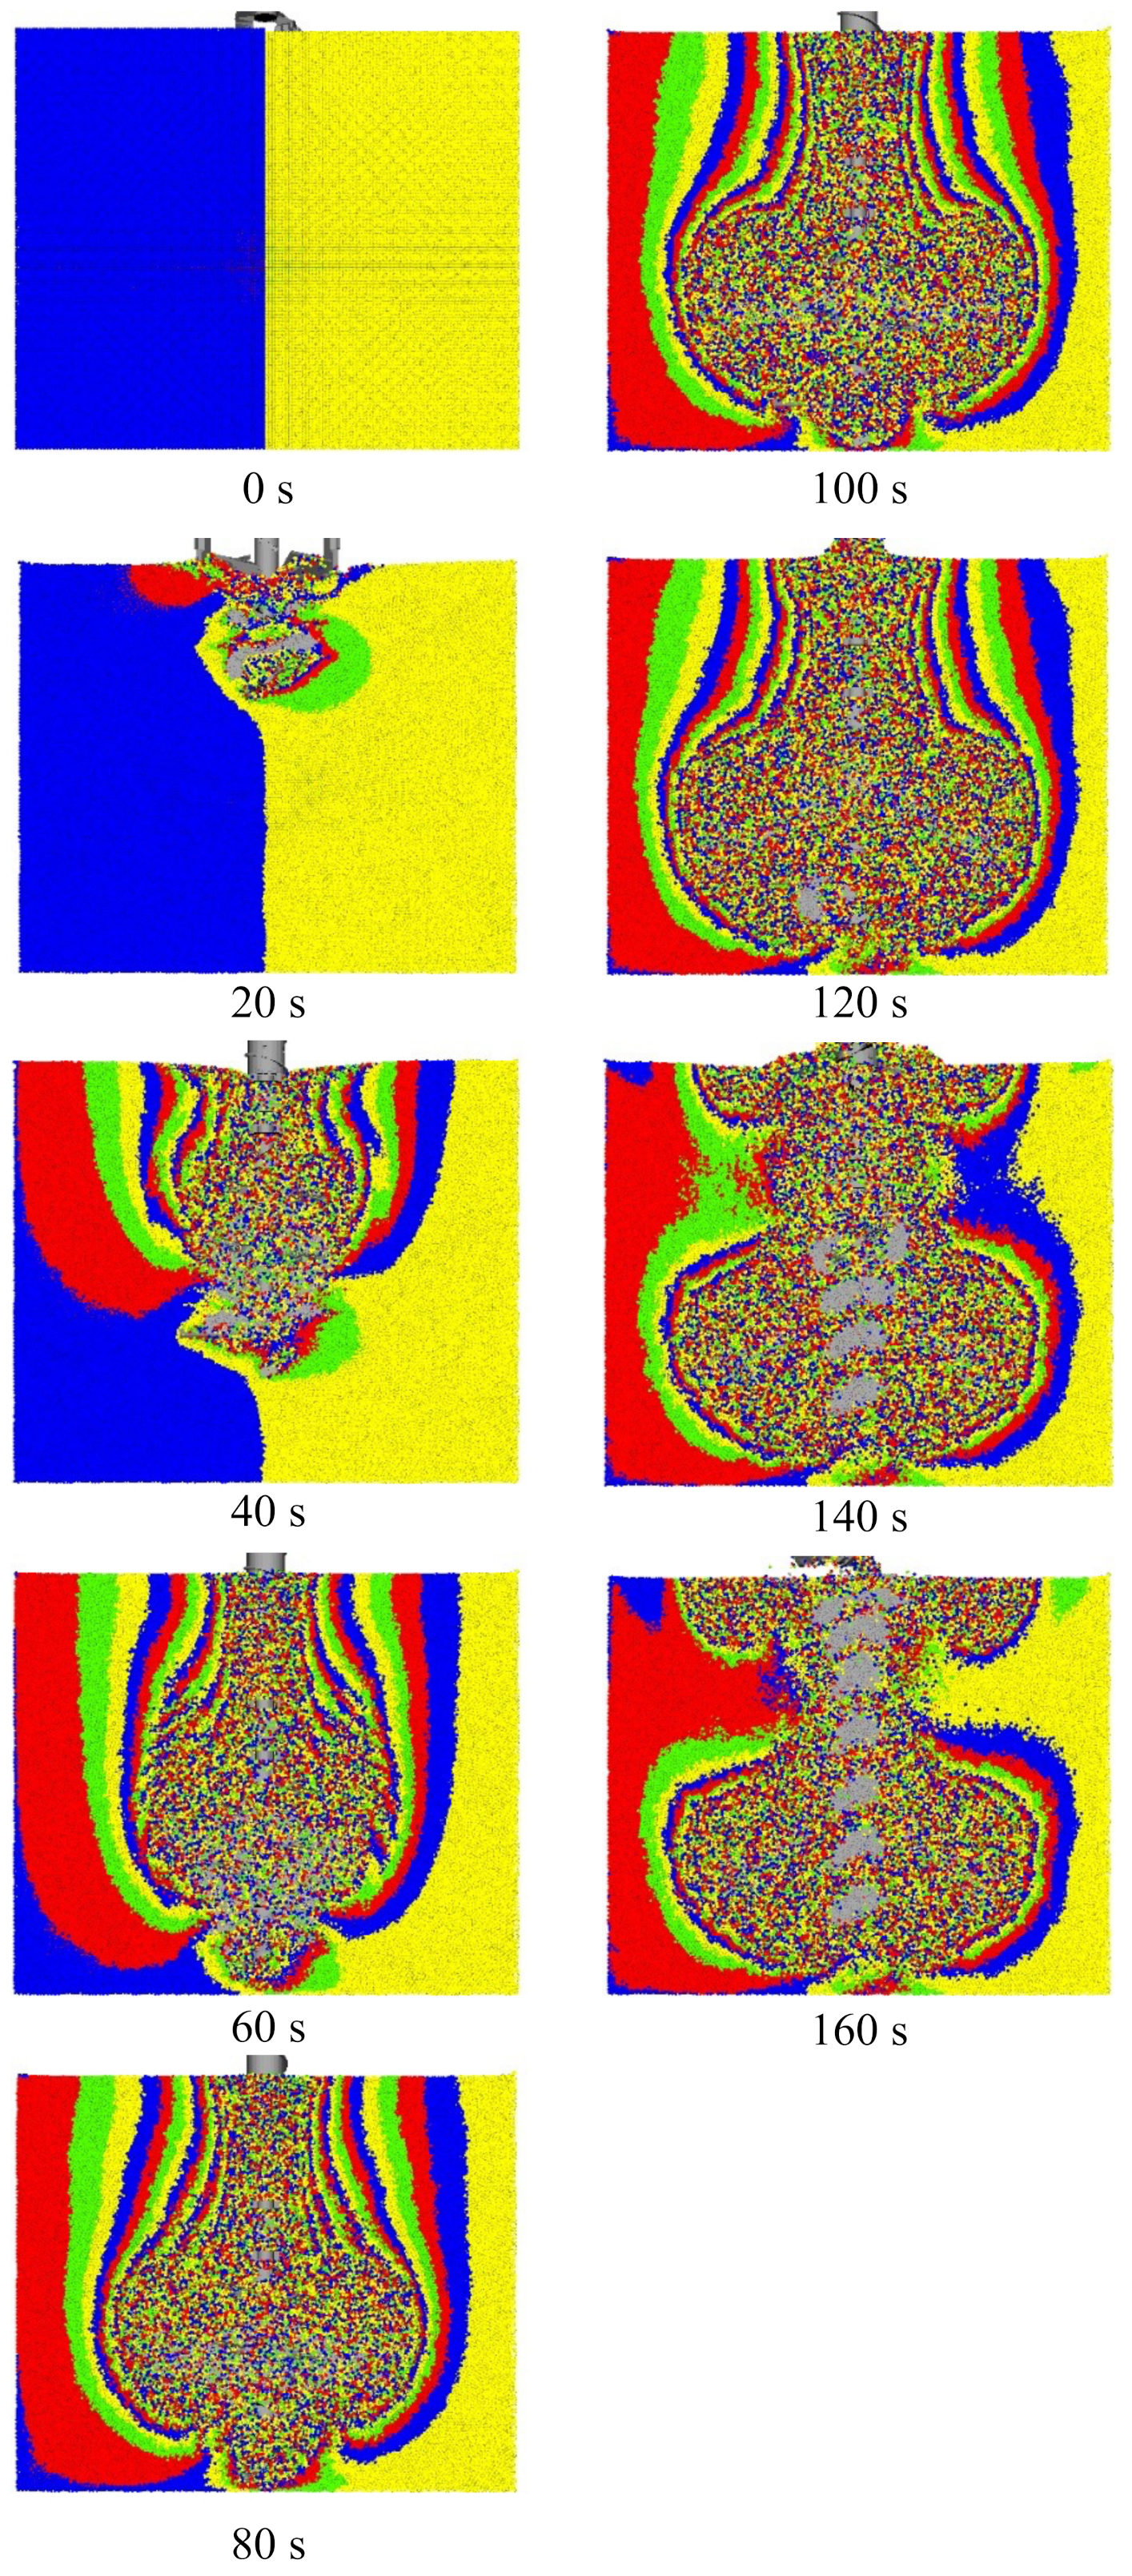
3.3. Visualization in Ground by MPS-CAE Analysis

Conventionally, when performing ground-improvement work, the construction management is carried out by repeating measures based on the empirical rules of the site. This is because the target of the construction is the ground, and it is impossible to directly and visually check the ground and its internal conditions during the construction. Therefore, what is required is the visualization of the ground. By simulating the ground improvement in advance and visualizing the construction status, it is possible to carry out surveys, designs, and construction management based on scientific methods. In addition, ground improvement situations can be simulated by applying various conditions, such as physical property values and the movements of the stirring wing, which can be useful for improving the economic efficiency and quality of the ground-improvement work.
Nakao et al. (2021) used an MPS-CAE analysis to three-dimensionally model the process of penetration and stirring by the RS-DMM on a computer, and examined the behavior inside a targeted soft ground and the effect of the RS-DMM on the surrounding ground. They succeeded in visually capturing the process of penetration and stirring by the RS-DMM and the inside of the targeted soft ground in the MPS-CAE analysis. It has also been confirmed that the simulation results by the MPS-CAE analysis are in good agreement with the results of the mixture model experiment. However, a quantitative evaluation based on the results of an MPS-CAE analysis has not been achieved, and the inside of the targeted soft ground must be measurably reproduced and evaluated. After that, if various external factors inside the ground can be incorporated into the MPS-CAE analysis, it is expected that the co-rotation mechanism can be successfully investigated and that an effective ground-improvement method can be designed and developed.
In this study, the visualization of the RS-DMM, a kind of ground-improvement method, was attempted using an MPS-CAE analysis, which is one of the numerical analysis methods. By expressing the targeted soft ground and the solidifying material as collections of particles, the purpose is to evaluate how they are stirred and the quality of the improved body in the MPS-CAE analysis. In addition, the performance of the displacement reduction and the quality of the improved body when the stirring wing of the DRT was used were compared with those when the stirring wing of the normal type (NT) was used, and the performances were evaluated.

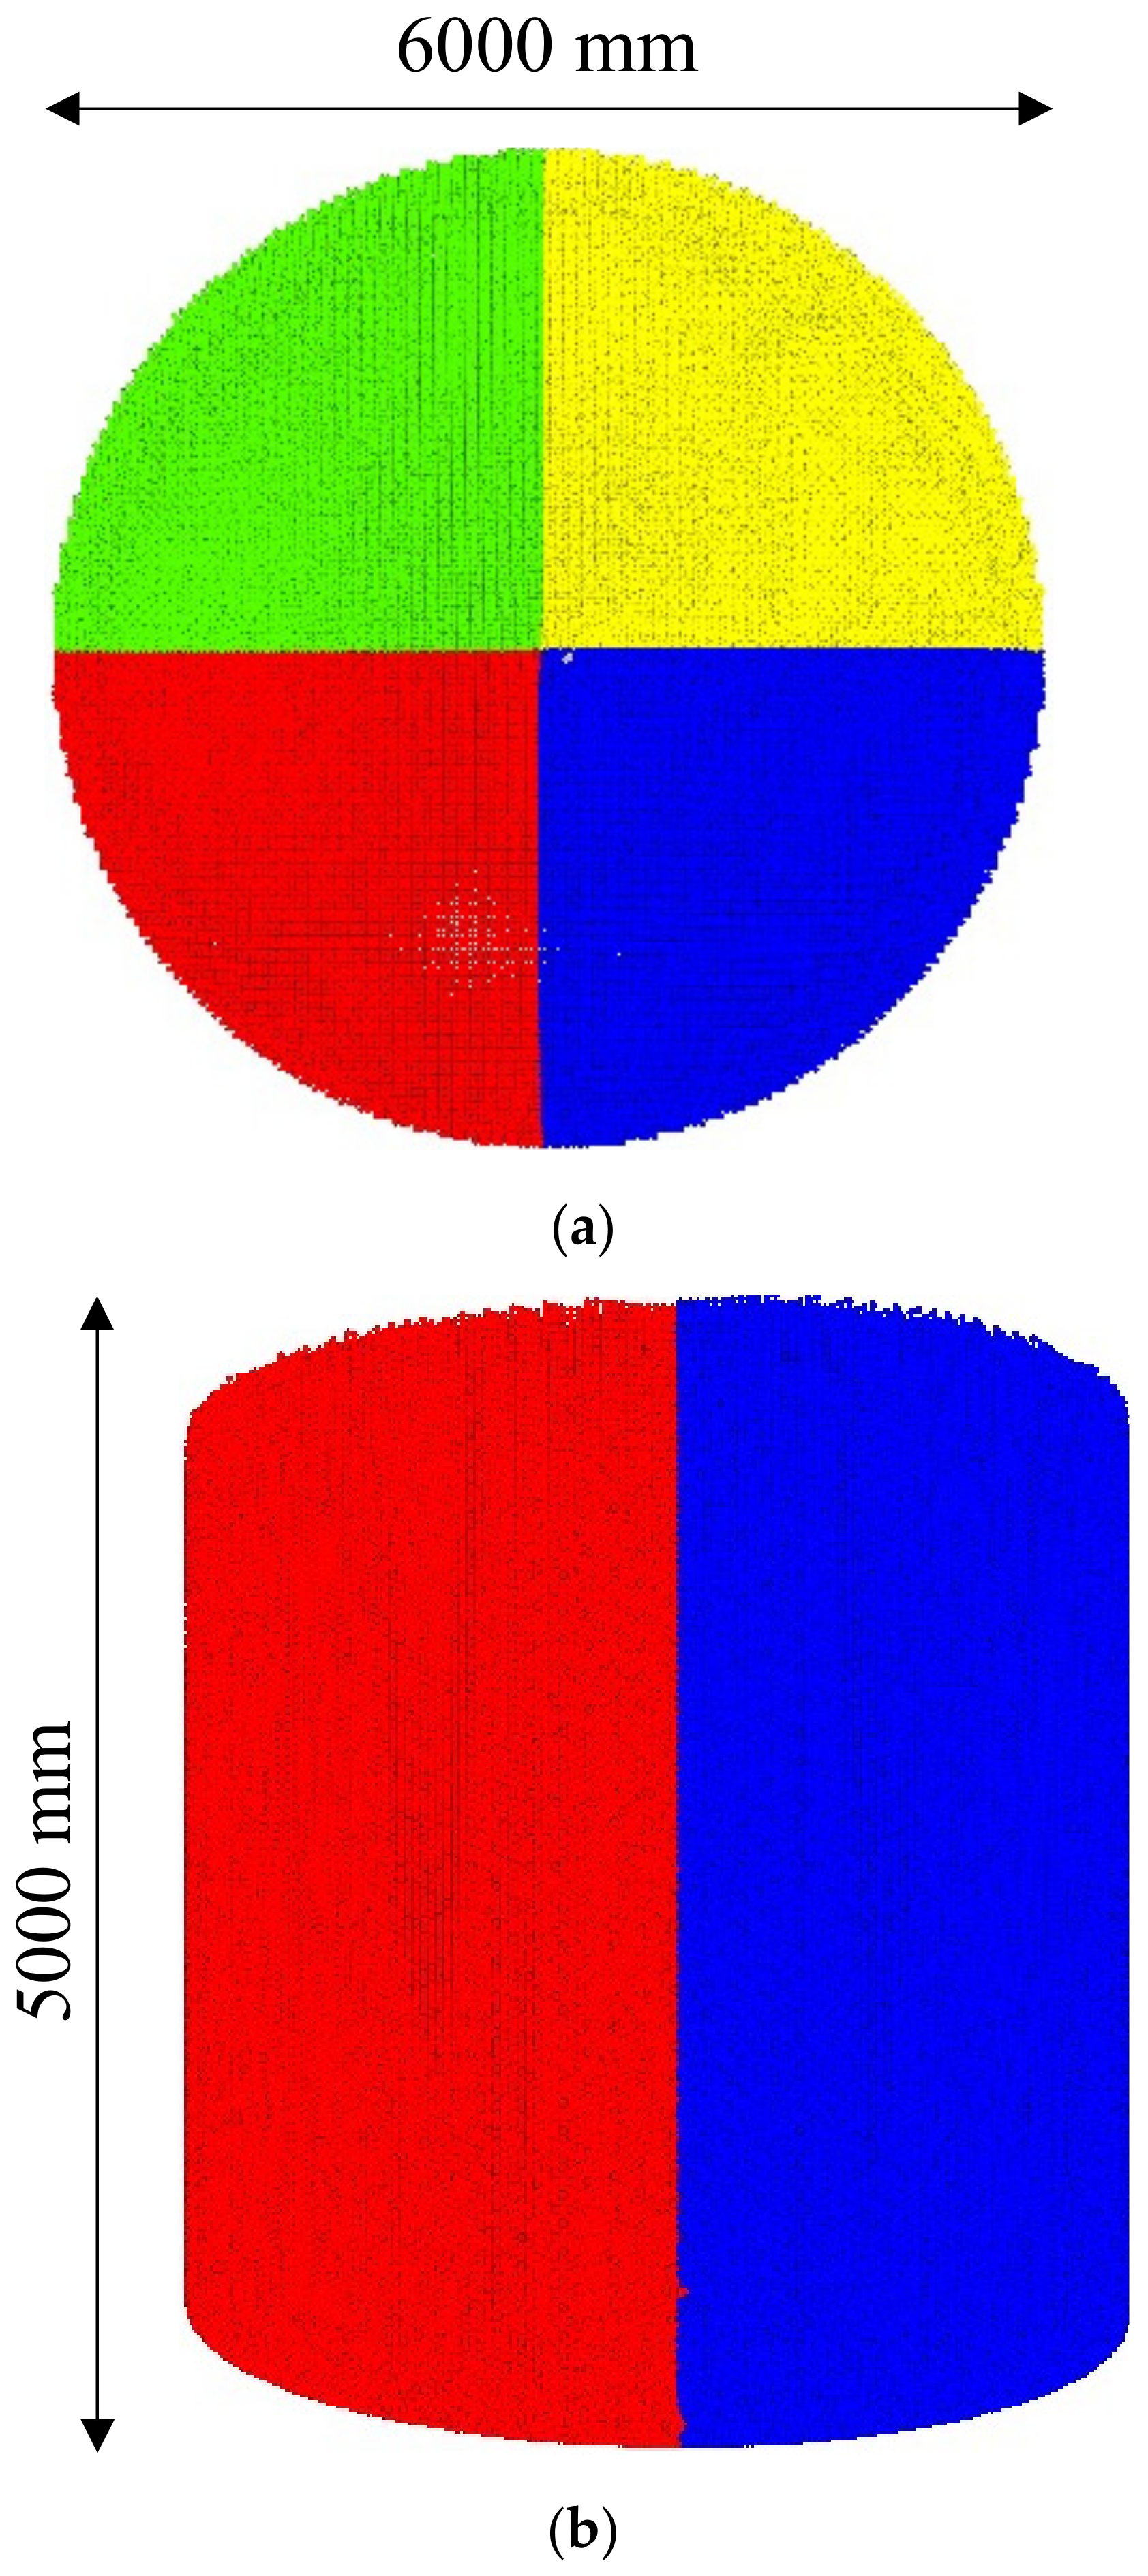
4. Parameter Setting and Analysis Model

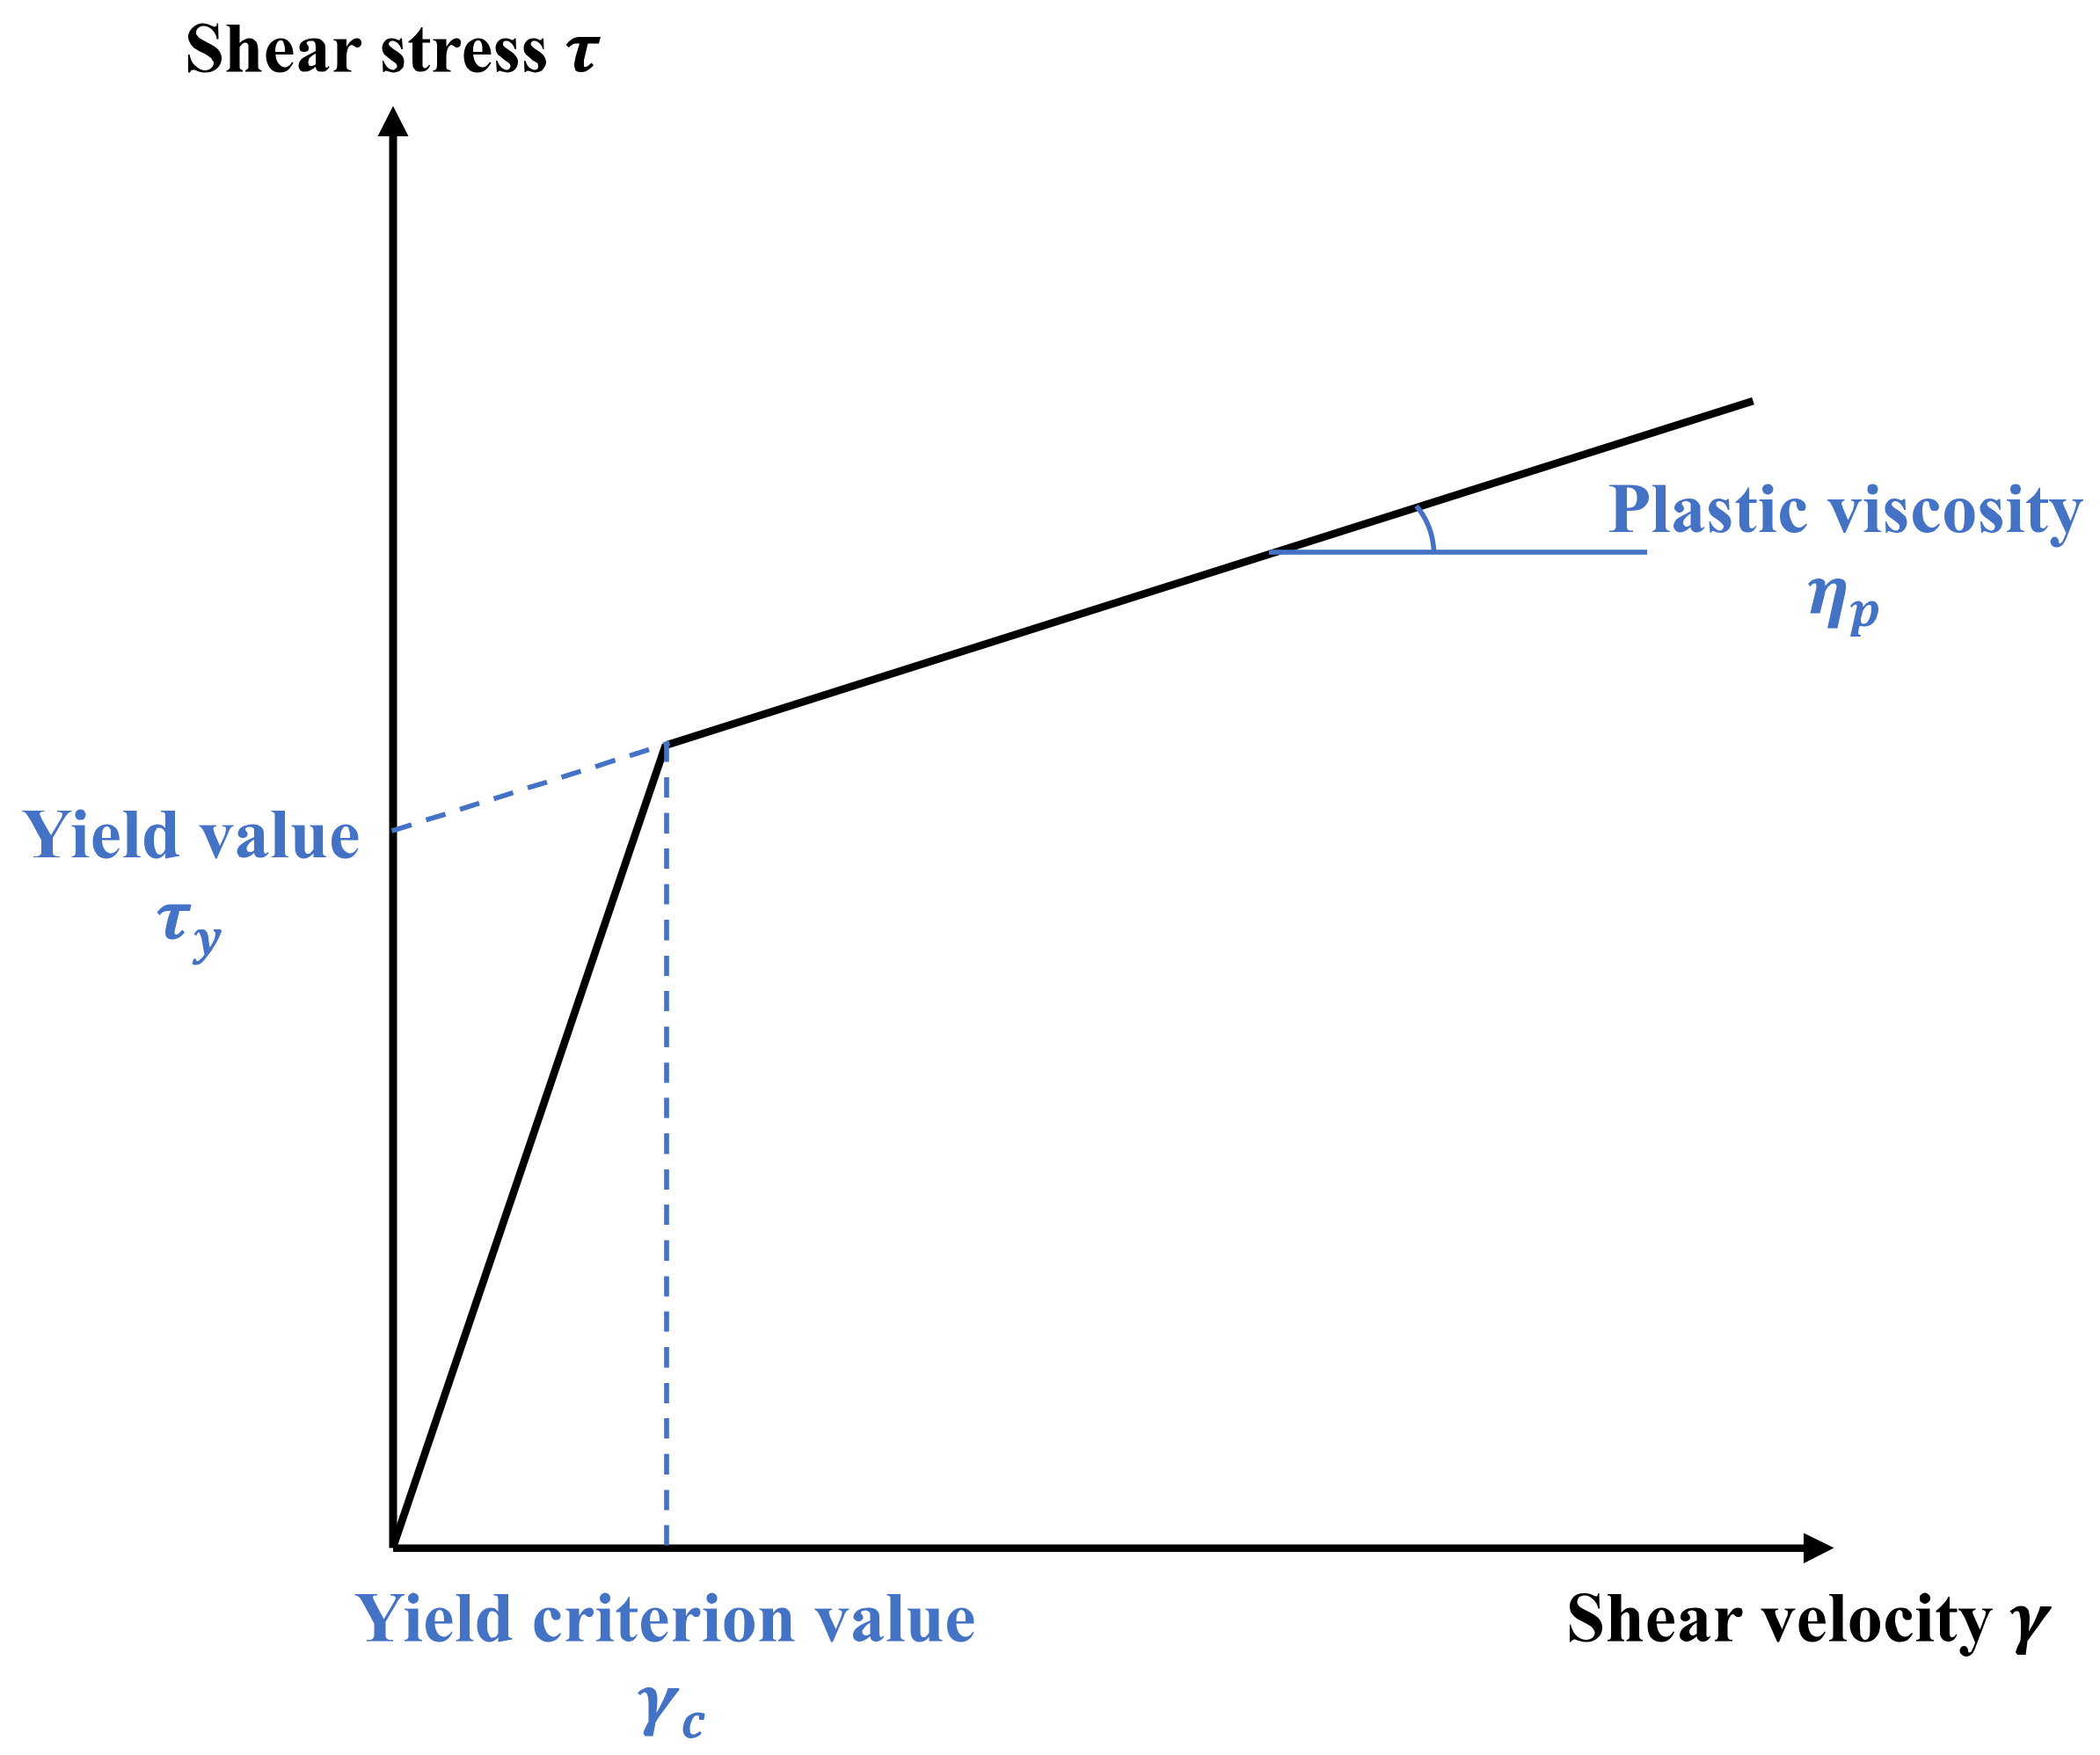
4.1. Bingham Fluid Model

The MPS-CAE analysis requires the determination of the rheological parameters for each fluid. In this analysis, the rheological properties of the cement slurry and targeted soft ground are assumed as Bingham fluid models, which are non-Newtonian fluids because they are mixtures of various substances.
The Bingham fluid model is a fluid in which the strain ratio remains 0 until the shear stress exceeds the yield value. The authors adopted the bi-viscosity model, which behaves as a viscoelastic fluid when flowing and as a highly viscous fluid when immobile (see Figure 4). The apparent viscosity when flowing is shown in Equation (8), and the apparent viscosity when immobile is shown in Equation (9):
η = η p + τ y γ ˙                   γ ˙ γ c ˙
η = η p + τ y γ c ˙                   γ ˙ < γ c ˙
where τ y is the yield value, η p is the plastic viscosity, γ ˙ is the average shear velocity, and γ c ˙ is the yield reference value at the boundary between the fluid state and the immobility state. A preliminary analysis was performed in this analysis, and the result was γ c ˙ = 1 . In the preliminary analysis, the value of γ c ˙ was constantly changed and set in terms of flow time, solution stability, and calculation time.

4.2. Parameter Setting

The parameters required for this analysis are density, yield value, and plastic viscosity. Table 1 shows the parameters used in this analysis.
Regarding the analysis parameters of the cement slurry, the density was determined by measuring the mass using a quantitative container with a known volume, and the plastic viscosity was determined using a rotary viscometer. The rotary viscometer employs a B-type viscometer (DV2T), which is relatively easy to handle. The yield value was set to 10 Pa in this analysis by referring to the yield stress of an unconfined compression test on fresh concrete as the yield value of the Bingham fluid.
Regarding the analysis parameters of the ground, the targeted soft ground was determined by assuming a soft ground that needs improvement, referring to the results of tests on soil collected from the field site of the soft ground [21,22]. For the yield value, the authors referred to half of the unconfined compressive strength.

4.3. Analysis Model

In this study, the RS-DMM, which is a kind of ground-improvement method, is reproduced by an MPS-CAE analysis, and the behavior of each particle assumed as cement slurry and the behavior of the targeted soft ground are evaluated. In order to perform the analysis, two types of stirring wing, NT and DRT, as well as one ground model, were modeled on a computer using CAE.
The stirring wing used in the RS-DMM is composed of an inner wing and an outer wing, which are rotated in opposite directions to penetrate and stir. The rod part of the stirring wing of the NT is columnar, while that of the stirring wing of the DRT is spiral. Figure 5 shows the stirring wing model used in this analysis. In addition, when performing the analysis, it is necessary to set the parameters related to the rotation, penetration, and volume of the cement slurry being injected into the stirring wing. The parameters shown in Table 2 were set by referring to the construction results of the RS-DMM, which is the analysis target of this study.
A columnar ground model, with a diameter of 6000 mm and a height of 5000 mm, was used as the targeted soft ground. In the PBMs, the inter-particle distance, which corresponds to the size of the particles, was set to 40 mm in consideration of the calculation load. In addition, the targeted soft ground was divided into four parts in advance and color-coded so that it would be easier to evaluate the state of the stirring and mixing of the targeted soft ground and the cement slurry to be injected during excavation and the state of stirring by the stirring wing (see Figure 6). The particles of the solidifying material injected from the stirring wing are displayed in gray.

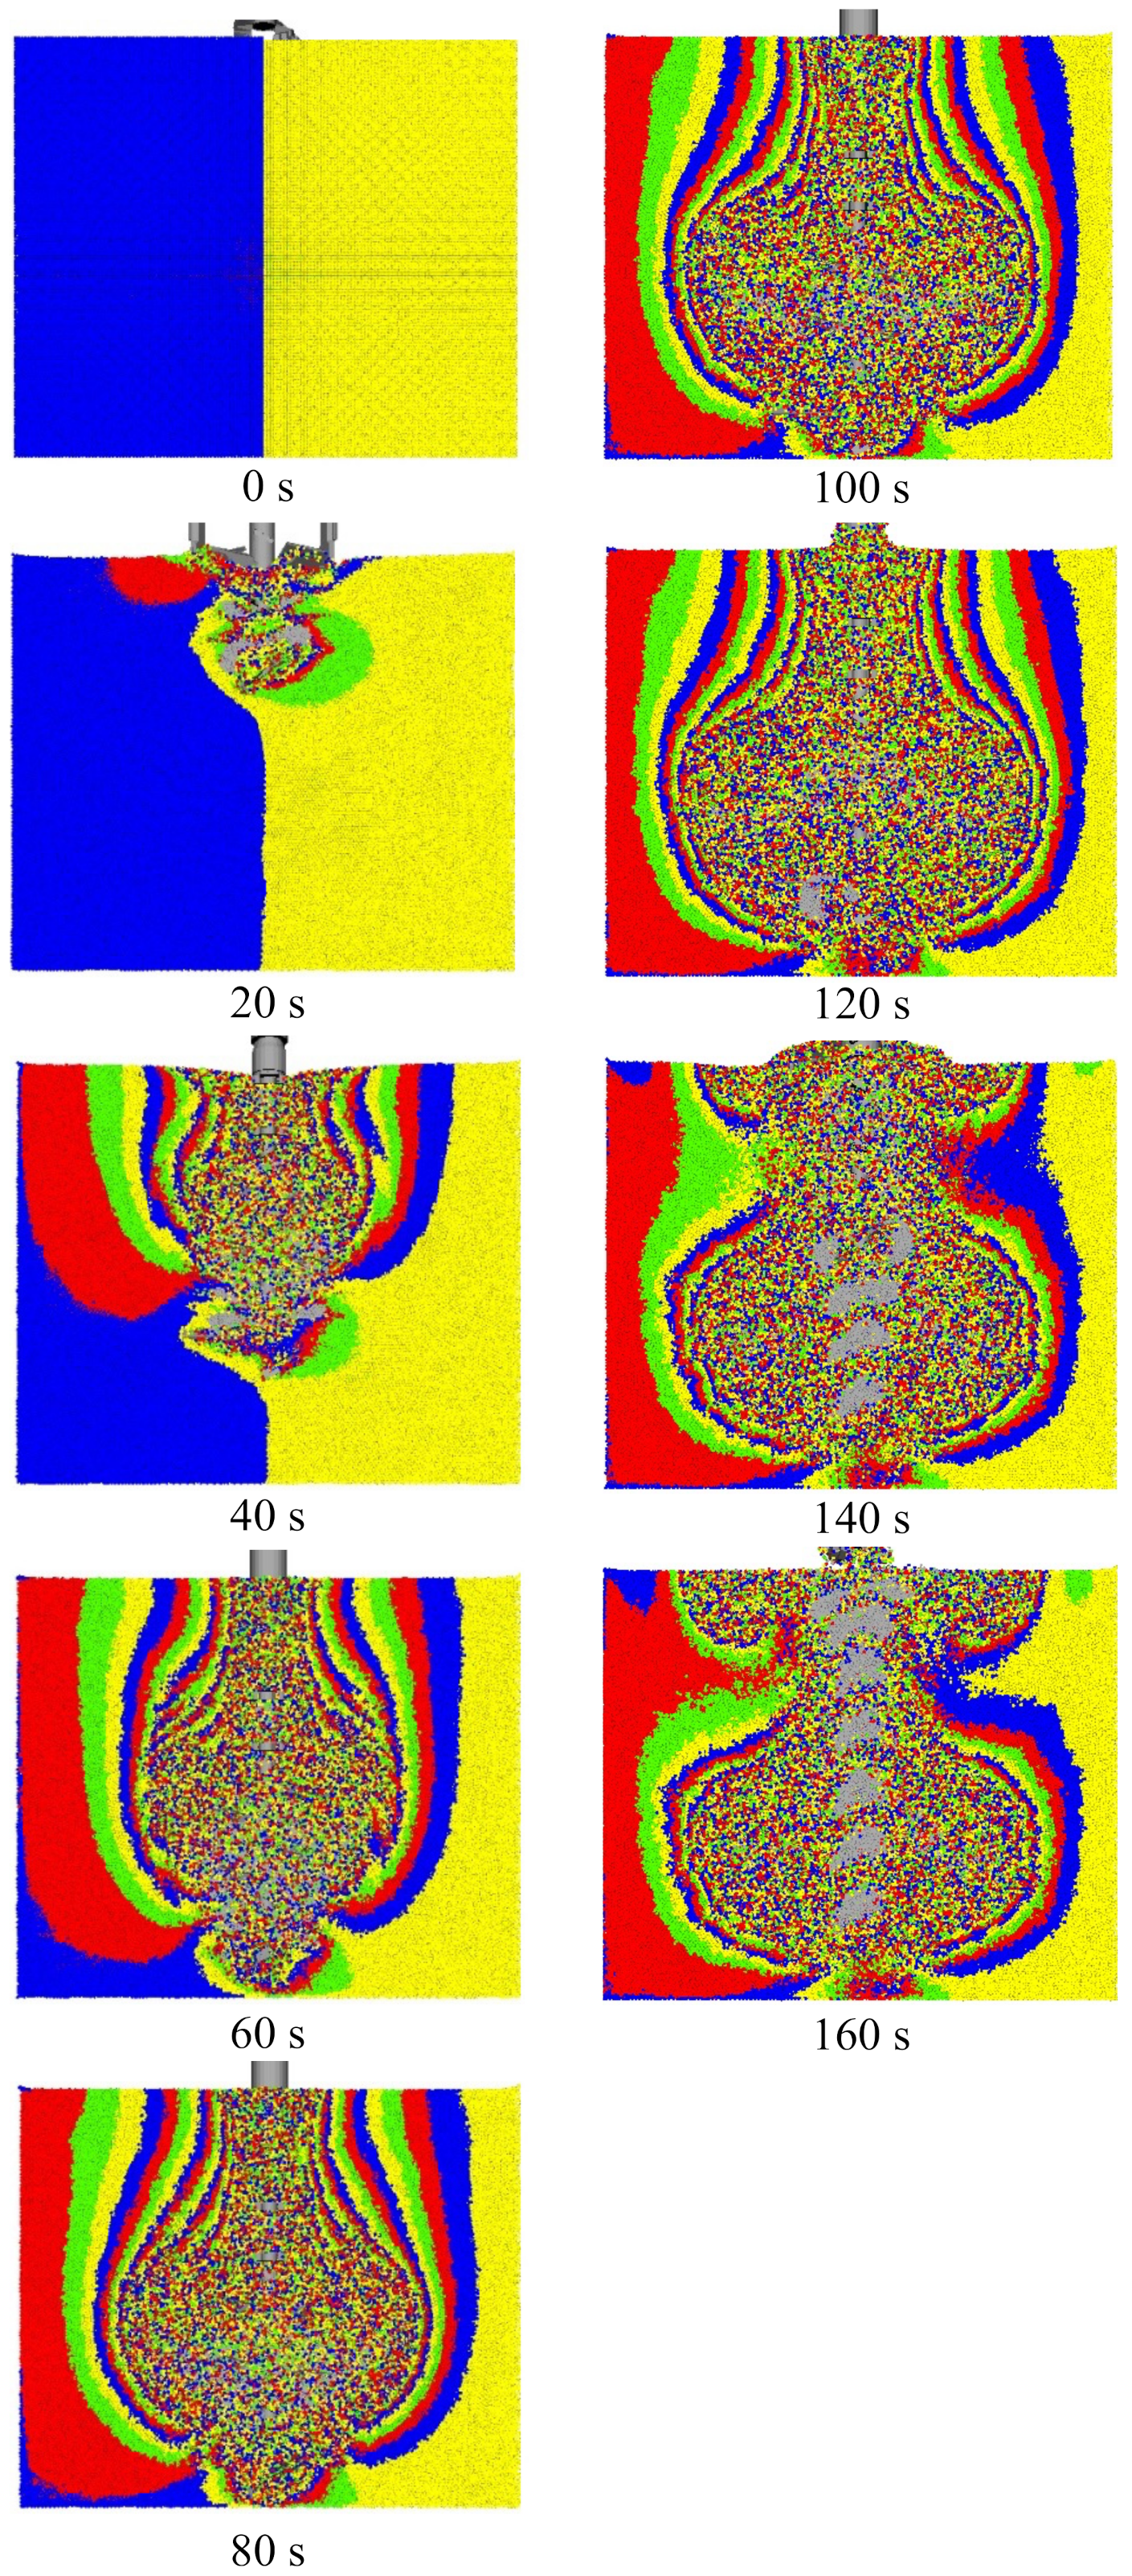
4.4. Analysis Case and Evaluation Method

In order to conduct a visible and measurable evaluation of the displacement reduction performance when the stirring wing of the DRT is used, the results are compared with the results when the stirring wing of the NT is used.
In the evaluation of the displacement reduction performance, attention was paid to the moving velocity of the particles assuming the targeted soft ground. In order to suppress the occurrence of displacement due to the construction, it is important to discharge the surplus soil generated when the solidifying material is injected. For the particles inside the targeted soft ground during the analysis, the velocity components in the Z-axis direction were color-coded, and the mechanism of the discharging surplus soil and its performance were evaluated. In order to quantitatively evaluate the performance of the discharging surplus soil, the volume of discharging surplus soil was estimated by measuring the Z-axis velocity of the particles existing in the specified region and calculating the flow ratio. The volumes of discharging surplus soil in the two cases of the stirring wing of the NT and the stirring wing of the DRT were estimated, and the results were compared.
In addition, in order to compare the construction process of the improved body when the stirring wing of the NT is used and when the stirring wing of the DRT is used, the cross section during the analysis is cut out, and the behavior of the particles, assuming the cement slurry and the targeted soft ground, were visually evaluated. Specifically, the difference in the quality of the improved body due to the difference in the stirring wing, the effect of the stirring wing of the DRT on the improved body, and the distribution of the solidifying material were evaluated.

5. Analysis Results and Discussion

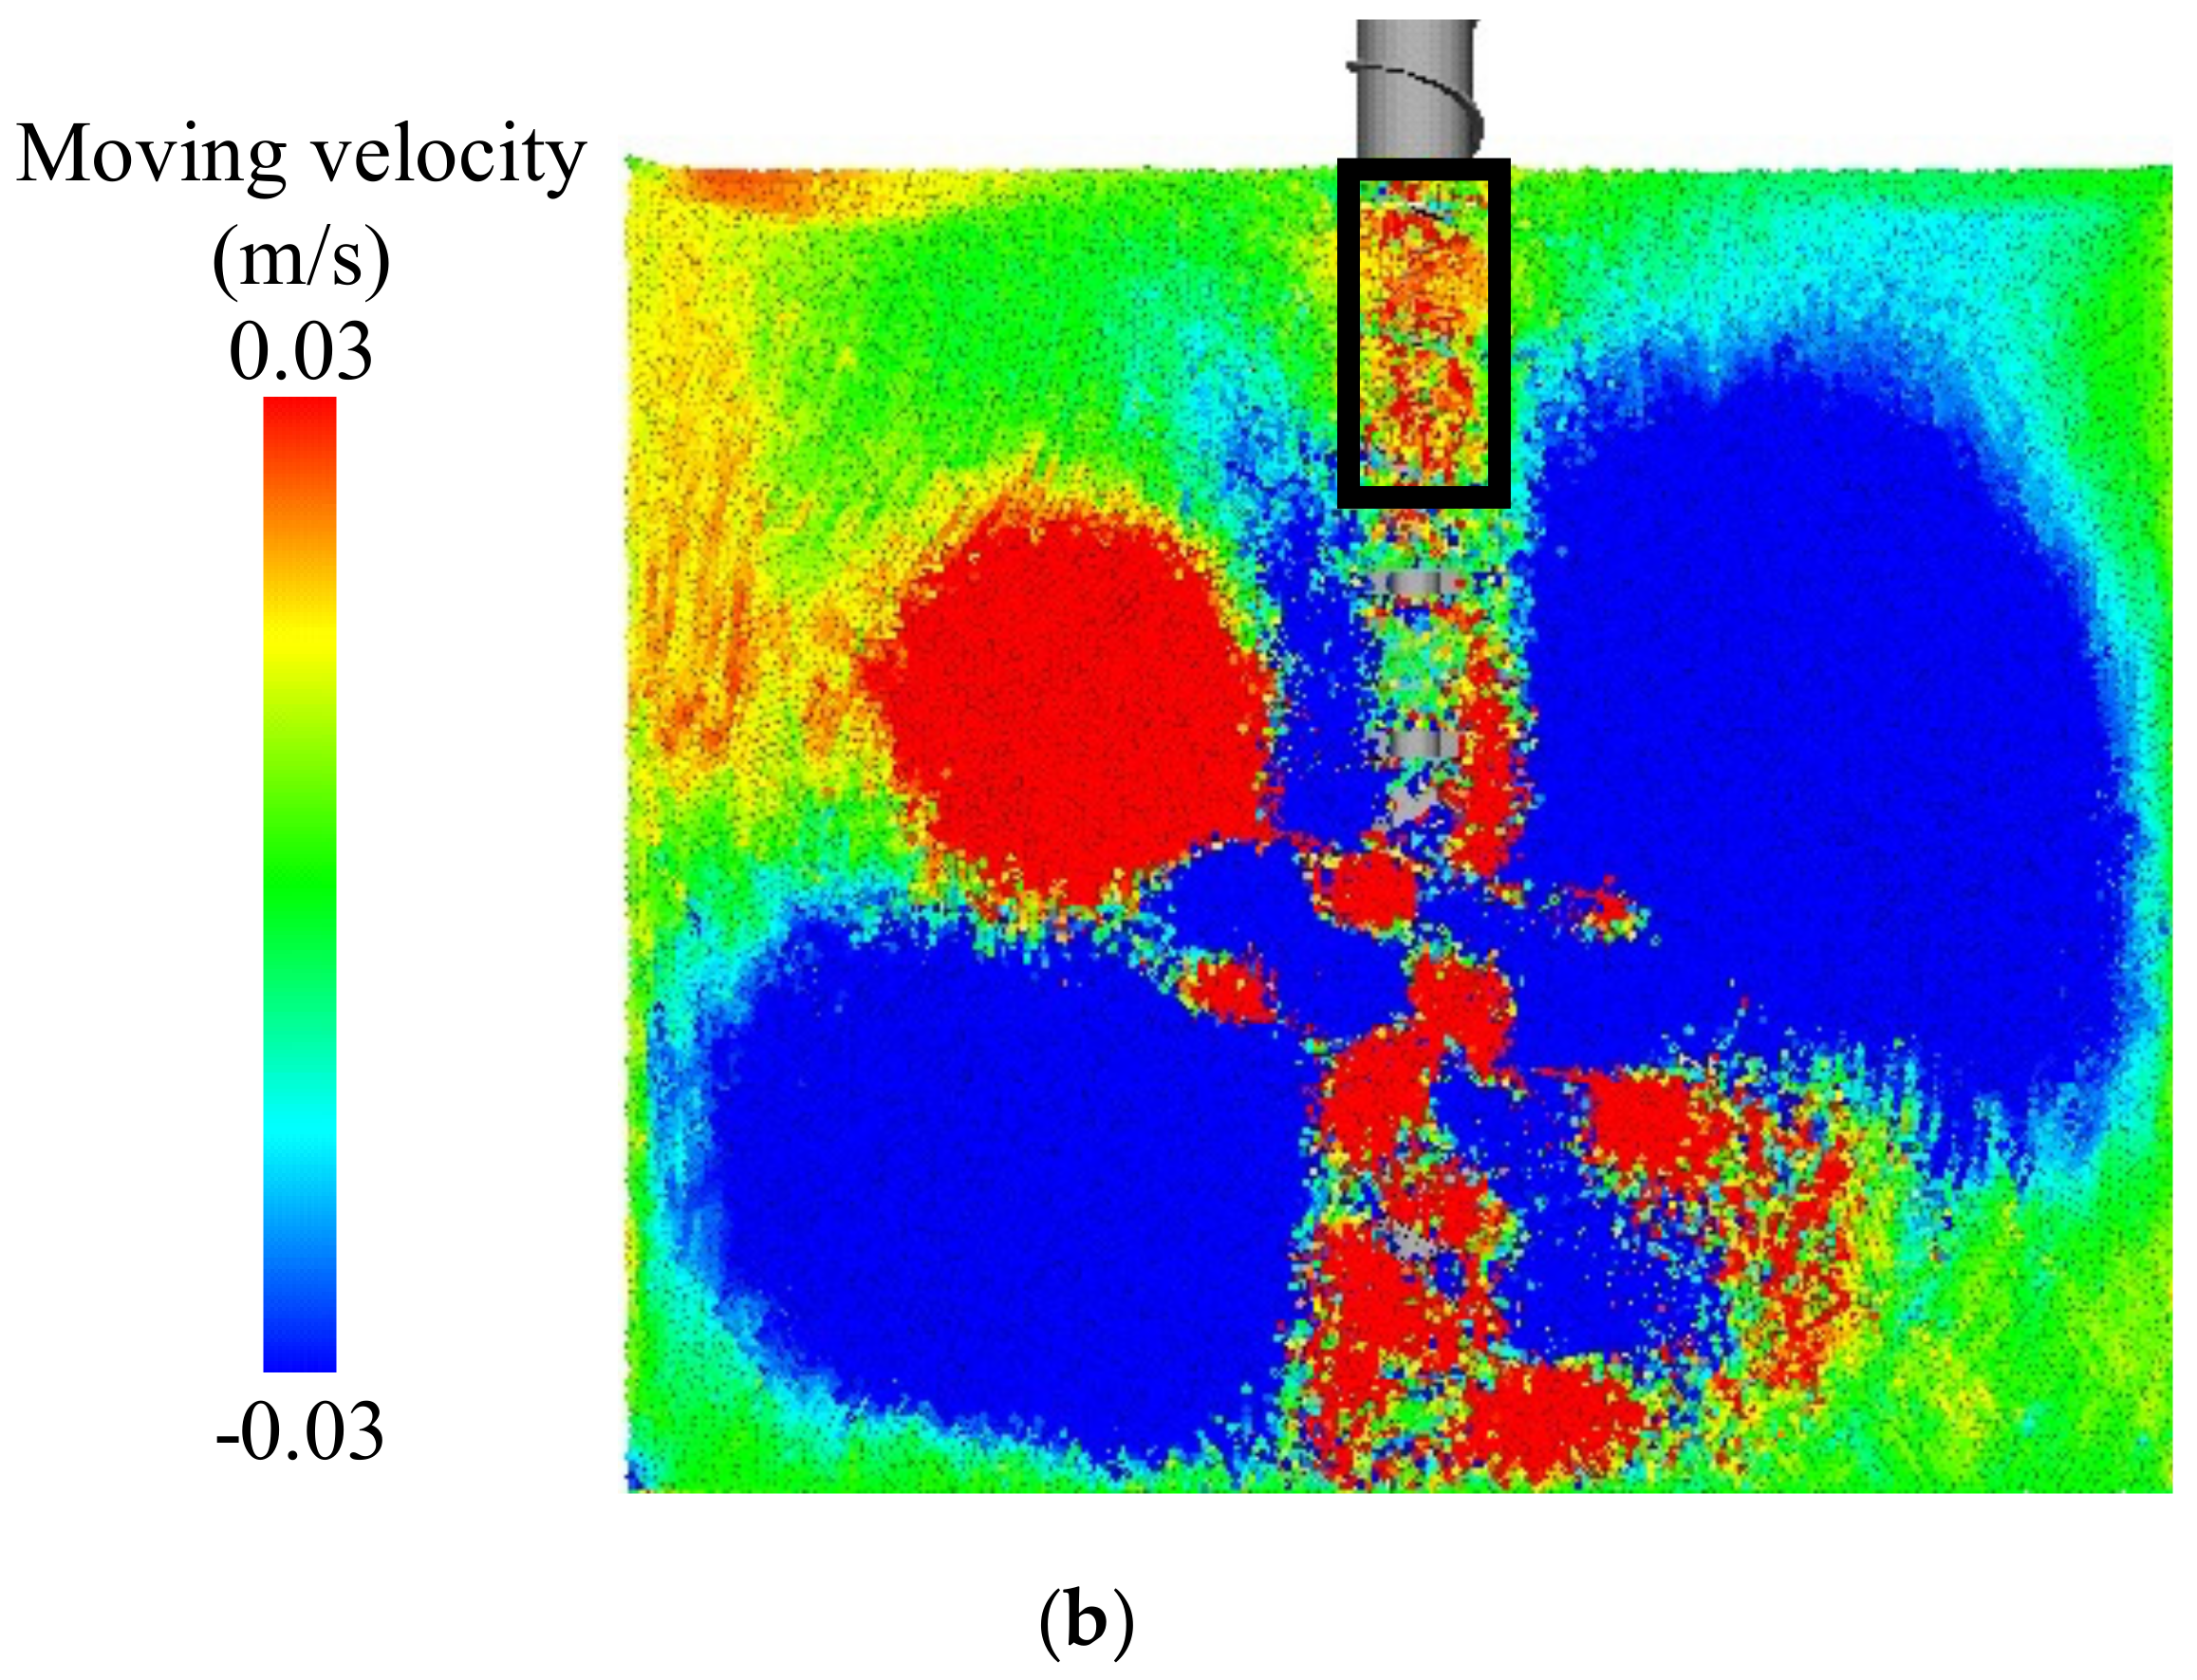
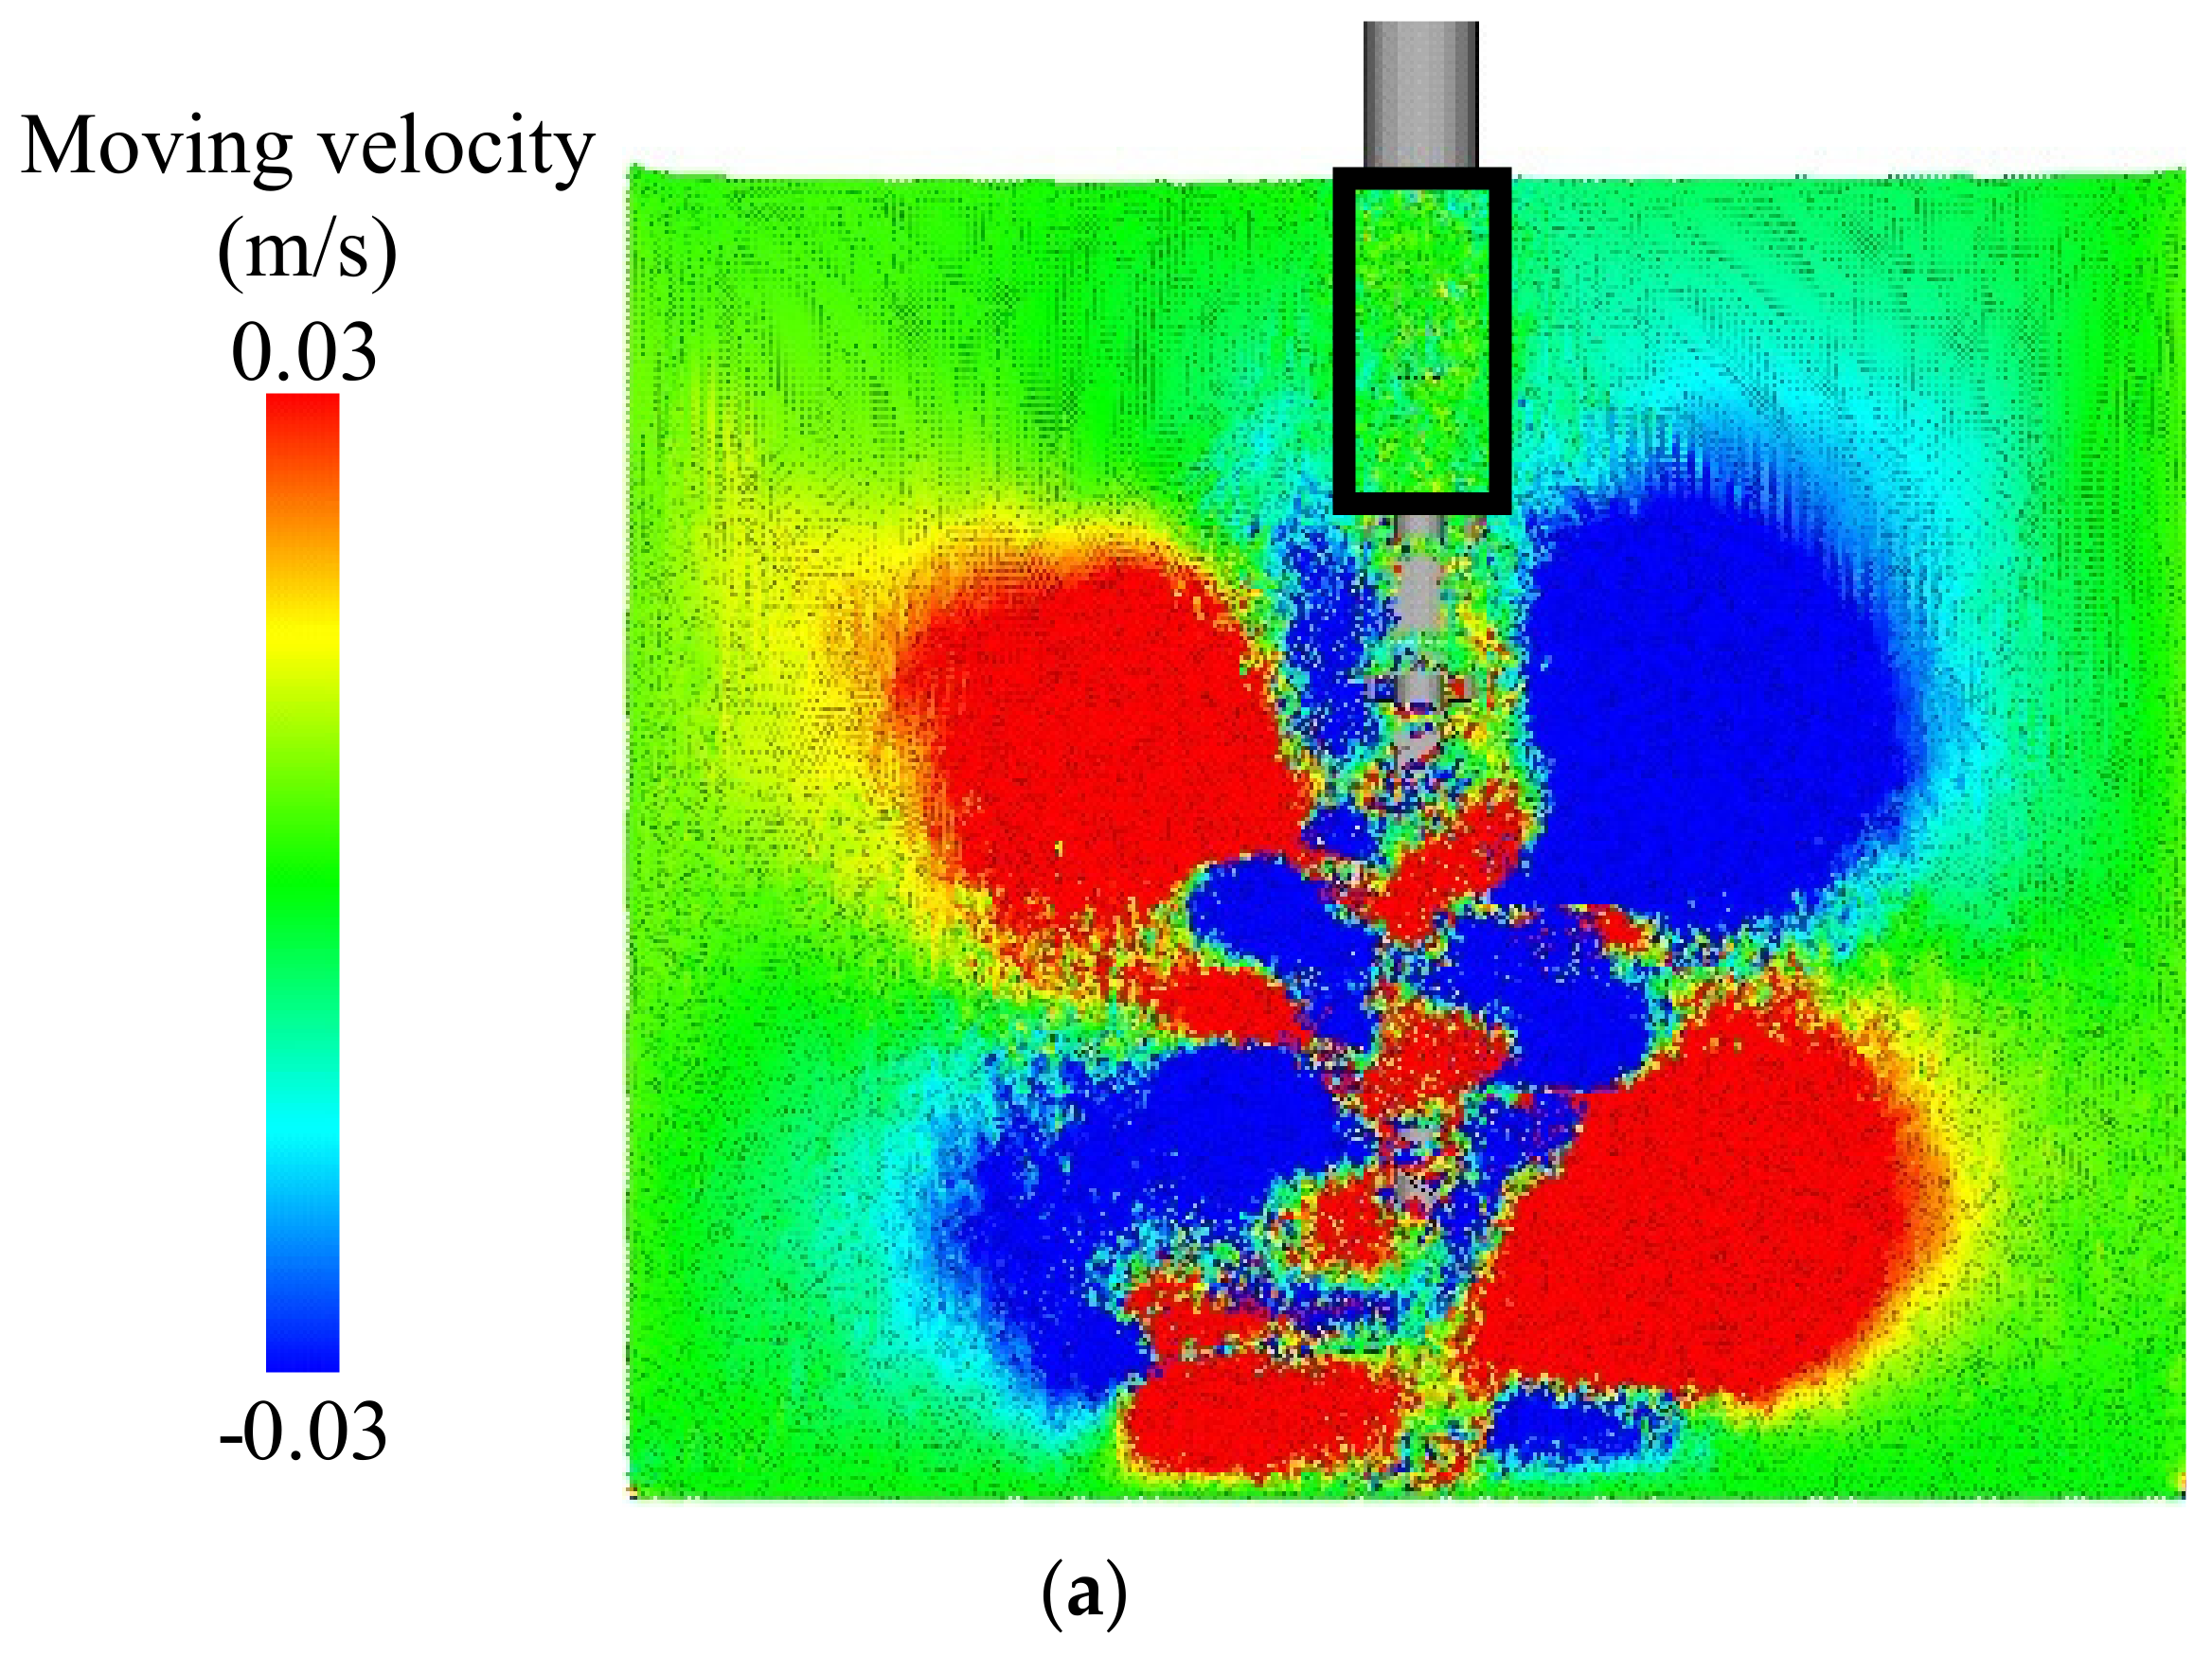
5.1. Visualization for Performance of Discharging Surplus Soil by Velocity Display

The conditions during the discharge of surplus soil in the RS-DMM construction were evaluated by the distribution of the moving velocity of the particles. Figure 7 shows the analysis cross section at the stage (at 70 s) when the penetration and stirring are completed and the static stirring is performed at the bottom. Focusing on the moving velocity of the particles around the rod in the figure (the area surrounded by the black rectangle), in the case of using the stirring wing of the NT, many particles with a moving velocity close to 0 m/s are distributed. On the other hand, in the case of using the stirring wing of the DRT, there are many particles with a moving velocity of 0.3 m/s or more. Due to the effect of the spiral rod attached to the stirring wing of the DRT, particles are forcibly moved upward, and the surplus soil is discharged. Therefore, construction using the stirring wing of the DRT in the RS-DMM is found to be effective for suppressing displacement.

5.2. Quantitative Evaluation of Discharge of Surplus Soil

In order to quantitatively evaluate the performance of the discharge of the surplus soil, the volume of the discharging surplus was estimated. The volume of the discharging surplus soil was estimated at the stage of static stirring at the bottom (40 s from 70 to 110 s) after the completion of the penetration and stirring.
The volume of the discharging surplus soil was calculated using the following equation, Equation (10), assuming the flow ratio of the particles that had passed through the cross section:
Q = A · v
where Q is the unit volume, A is the cross-sectional area, and v is the moving velocity of the particles. Regarding the cross-sectional area, the cross-sectional area through which the particles pass was calculated by subtracting the cross-sectional area of the rod (ϕ = 440 mm) from the cross-sectional area around the rod (500 mm × 500 mm) and was set to 0.1 m2. For the moving velocity of the particles, the average moving velocity of the particles around the rod (the area surrounded by the black rectangle), shown in Figure 7, was adopted. The average moving velocity of the particles was calculated every 0.1 s, and the unit volume was calculated every 0.1 s in the same way to estimate the volume of discharging surplus soil for 40 s.
Table 3 shows the results of calculating the volume of discharging surplus soil. When the stirring wing of the NT was used, the average moving velocity of the particles was very slow, namely, 0.007 m/s. As a result, the total volume of discharging surplus soil over 40 s was 0.026 m3. It can be confirmed that the discharge of surplus soil is rarely performed. On the other hand, when using the stirring wing of the DRT, the average moving velocity of the particles was 0.152 m/s. More particles continued to be discharged when using the stirring wing of the DRT than when using that of the NT, namely, the total volume of discharging surplus soil was 0.609 m3 over 40 s. With the stirring wing of the DRT, about 23 times more surplus soil was discharged than with that of the NT. In this study, the volume of discharging surplus soil was calculated within a limited range and time, so it is possible that the value was smaller than the actual volume of discharging surplus soil. However, because there was a large difference in the volumes of the discharging surplus soil, even under these measurement conditions, it can be said that the stirring wing of the DRT provides an excellent performance in discharging surplus soil.

5.3. Comparison of Improved Body Due to Different Stirring Wing

The construction process and quality of the improved body constructed using the stirring wing of the NT and the improved body constructed using the stirring wing of the DRT are compared. Figure 8 and Figure 9 show the analysis cross sections using the stirring wings of the NT and the DRT, respectively. The construction process is described every 20 s in order to compare the construction process of the improved body. It can be seen in these figures that there are no major differences in each construction process. In both cases, penetration and stirring are performed in a columnar shape while injecting the solidifying material at the beginning. After that, stirring is conducted so that the lower part swells from 60 to 100 s. This is thought to be due to the fact that static stirring is performed for 1 min at the bottom and that the surrounding ground is also stirred at the same time due to the viscosity of the ground. Then, from around 120 s, extraction and stirring are started while injecting the solidifying material again. As the solidifying material is injected from the lower part of the stirring wing, in accordance with the rotation of the stirring wing, there are some parts that do not exist in the cross-sectional display, but they are present in the columns as a whole. Therefore, it is unlikely that the quality will vary. In addition, the stirring wing is pulled out of the ground to the ground surface from 140 s to 160 s. At that time, the particles near the ground surface are stirred over a wider area than the particles per 1 m underground. Compared to the inside of the ground, the particles on the ground surface have a higher degree of freedom of movement, and it is thought that the range has expanded due to the large wavy effect.
From the above results, it is thought that the difference the in stirring wings does not affect the construction process of the improved body. However, construction using the stirring wing of the DRT can suppress the discharge of surplus soil and displacement while maintaining the quality of the improved body, but it exists near the ground surface due to the discharge of surplus soil. As the surplus soil contains solidifying material, it is necessary to dispose of it as industrial waste instead of disposing it as residual soil in the usual manner.

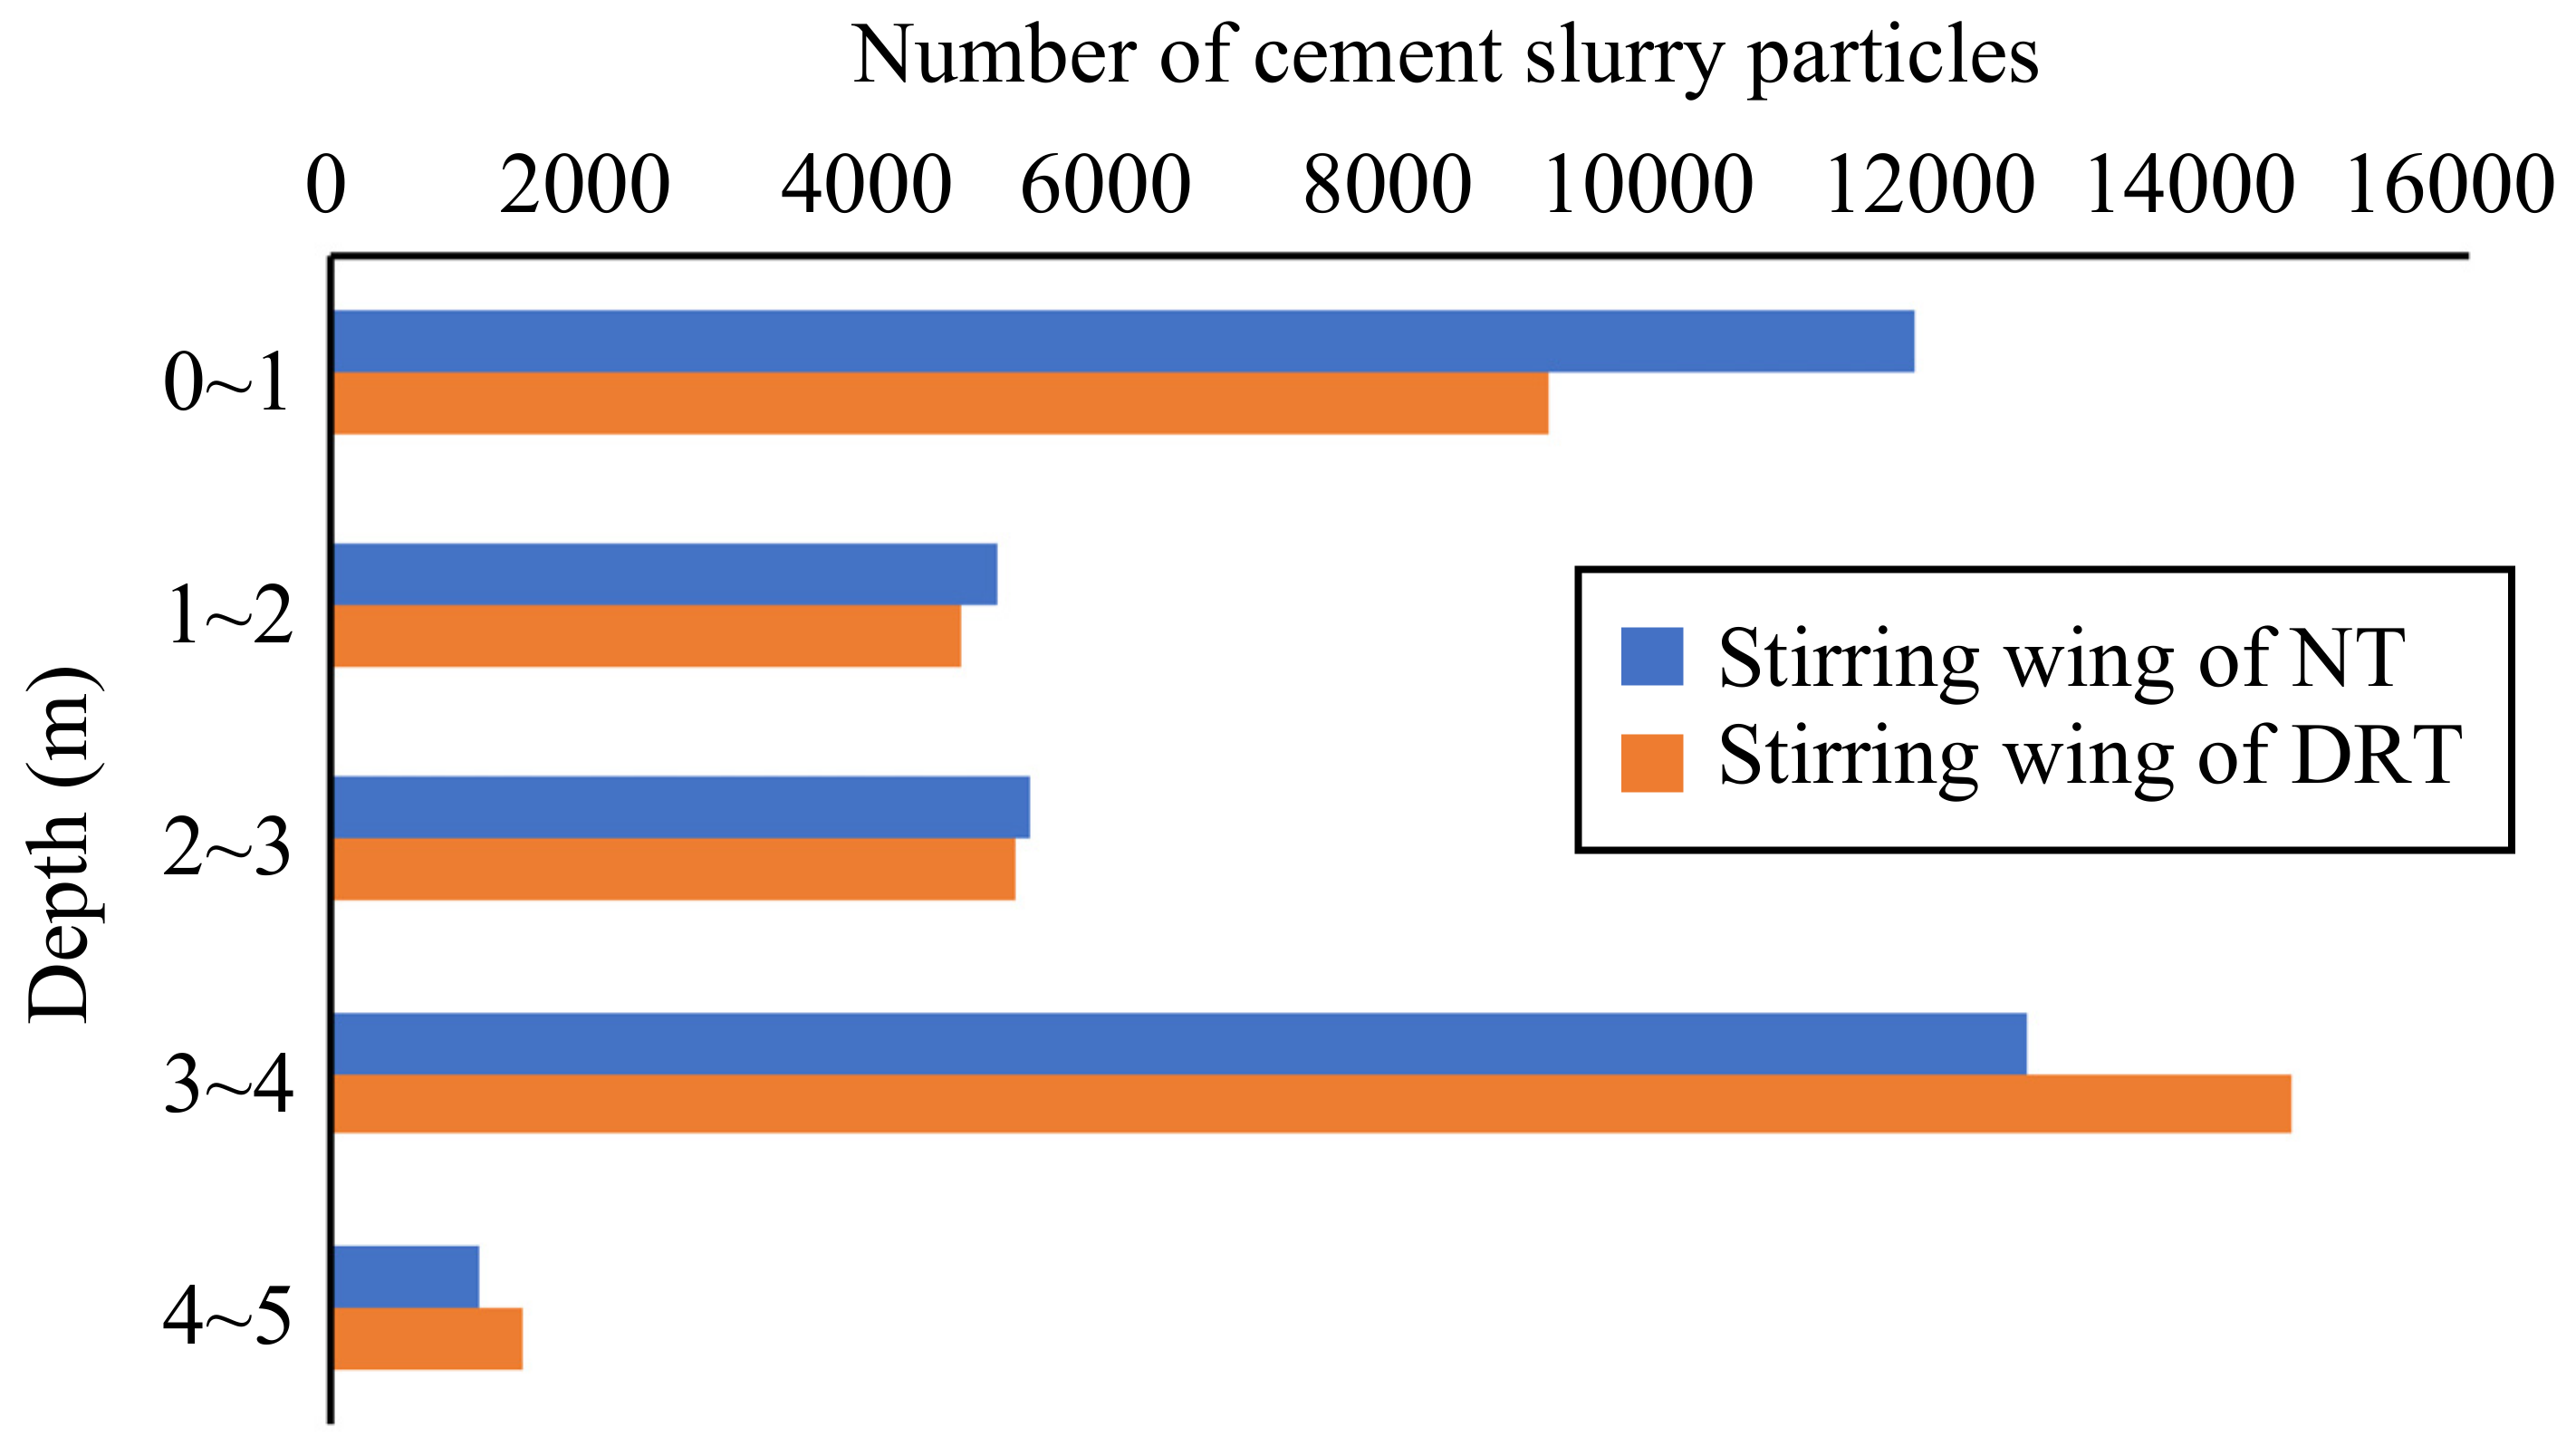
5.4. Depth Distribution of Injected Cement Slurry

In order to compare the distribution of injected cement slurry in the depth direction, the ground at the end of the analysis was divided into depths of 1 m, and the number of cement slurry particles existing in each range was measured. The results are shown in Figure 10. In both cases of the NT and DRT stirring wings, the number of particles present at a depth of 3 to 4 m was the largest, followed by 0 to 1 m, 2 to 3 m, 1 to 2 m, and 4 to 5 m. The reason why many cement slurry particles exist at the depths of 3 to 4 m and 0 to 1 m is considered to be that the operation of the stirring wing is changed (started/stopped). It is thought that this is because the cement slurry particles moved together with the soil particles pushed by the movement of the stirring wing, and the particles stayed due to the stoppage of the stirring wing. In addition, the number of cement slurry particles is extremely small at a depth of 4 to 5 m, but this result is inevitable because only the tip of the stirring wing can reach this region.
The big difference between the two cases was at the depths of 0 to 1 m and 3 to 4 m. At 0 to 1 m, the number of cement slurry particles increased in the case of the stirring wing of the NT, but at 3 to 4 m, the number of cement slurry particles increased. The reason for this is thought to be an increase in the pressure inside the ground due to the injection of the solidifying material. The cause of the displacement is an increase in pressure inside the ground due to the injection of the solidifying material, and the discharge of surplus soil is performed to release this pressure. In the NT, without the discharge of surplus soil, it is considered that many soil particles and cement slurry particles adhered to the stirring wing due to the increase in pressure and were carried to the ground surface at the same time as the stirring wing was being pulled out. On the other hand, in the DRT, it is considered that the amount of soil particles and cement slurry particles adhering to the stirring wing decreased due to the release of pressure.
The effect of the improved body on the strength characteristics cannot be evaluated by the MPS-CAE analysis used in this study; thus, other treatments, such as curing, are also required. However, it was confirmed that the presence or absence of discharged surplus soil may affect the distribution of the solidifying material. In the future, it will be necessary to clarify this point by conducting strength tests.

5.5. Applicability and Validity of Analysis in Real Fields

As the subject of this study, the displacement reduction performance of just one improved body was evaluated in this analysis. Therefore, it will be necessary to increase the number of improved bodies and bring them closer to the site construction. The targeted soft ground was expressed here as an aggregate of the same particles, but grounds are originally non-uniform and contain impurities, such as stones and dust. By bringing the ground model settings closer to those of the site ground, it will be possible to perform more practical simulations. The targeted soft ground was set as a columnar region in this study, but site grounds originally exist semi-permanently, and it will be necessary to consider the effects of earth pressure and groundwater in the future. In addition, the validity of these analysis results must be evaluated by conducting an indoor model experiment. When conducting a model experiment, it will be necessary to carry out the experiment under conditions and an environment that imitate those of the targeted soft ground in situ.
Considering the above points, an analysis and model experiment must be carried out in the future that can more closely reflect the conditions of the construction site.

6. Conclusions

In this study, the performance of a visible and measurable evaluation of the relative stirred deep mixing method was conducted using an MPS-CAE analysis. By visualizing the case using the stirring wing of the NT and the case using the stirring wing of the DRT, the evaluation was performed by comparing the two cases. The results and findings obtained in this study are shown in the following.
(1)
It was possible to visually evaluate the discharge of surplus soil by the spiral rod attached to the stirring wing of the DRT.
(2)
It was quantitatively shown that more surplus soil was discharged when the stirring wing of the DRT was used than when the stirring wing of the NT was used.
(3)
No significant difference was found between the improved body using the stirring wing of the NT and the improved body using the stirring wing of the DRT. Therefore, it was confirmed that the construction could be executed without affecting the improved body even if the surplus soil was discharged.
(4)
Comparing the analysis results, it was found that the construction using the stirring wing of the DRT had a better displacement reduction effect than the stirring wing of the NT.
(5)
A simulation of the relative stirred deep mixing method using an MPS-CAE analysis was achieved. By changing the conditions, such as the ground and solidifying material parameters, the rotation speed of the stirring wing, the penetration speed, and the injection volume of the solidifying material, it was possible to perform simulations according to more construction conditions. The visualization of the ground improvement by an MPS-CAE analysis is thought to have contributed to an improvement in construction efficiency, quality, and economy, as well as the development of new research on construction technology and displacement. Thus, further studies will be required in the future.

Author Contributions

Conceptualization, S.I.; methodology, K.N., S.I. and T.T.; software, K.N. and S.I.; validation, S.T. and T.S.; formal analysis, K.N. and S.I.; investigation, T.T., S.T. and T.S.; resources, T.T., S.T. and T.S.; data curation, S.I. and T.S.; writing—original draft preparation, K.N. and S.I.; writing—review and editing, S.I.; visualization, S.I.; supervision, S.I.; project administration, S.I. All authors have read and agreed to the published version of the manuscript.

Funding

This research received no external funding.

Institutional Review Board Statement

Not applicable.

Informed Consent Statement

Not applicable.

Data Availability Statement

Data sharing is applicable to this article.

Conflicts of Interest

The authors declare no conflict of interest.

References

  1. Ishihara, K.; Araki, K.; Toshiyuki, K. Liquefaction in Tokyo Bay and Kanto Regions in the 2011 Great East Japan Earthquake. 1755 Lisbon Earthq. Revisit. 2013, 28, 93–140. [Google Scholar] [CrossRef]
  2. Kazama, M.; Kawai, T.; Mori, T.; Kim, J.; Yamazaki, T. Subjects of the liquefaction research seen to the liquefaction damage of the great east japan earthquake disaster. J. Jpn. Assoc. Earthq. Eng. 2018, 18, 26–39. [Google Scholar] [CrossRef] [Green Version]
  3. Yasuda, S.; Harada, K.; Ishikawa, K.; Kanemaru, Y. Characteristics of liquefaction in Tokyo Bay area by the 2011 Great East Japan Earthquake. Soils Found. 2012, 52, 793–810. [Google Scholar] [CrossRef] [Green Version]
  4. Ma, B.; Cai, K.; Zeng, X.; Li, Z.; Hu, Z.; Chen, Q.; He, C.; Chen, B.; Huang, X. Experimental Study on Physical-Mechanical Properties of Expansive Soil Improved by Multiple Admixtures. Adv. Civ. Eng. 2021, 2021, 1–15. [Google Scholar] [CrossRef]
  5. Ma, B.; Li, Z.; Cai, K.; Liu, M.; Zhao, M.; Chen, B.; Chen, Q.; Hu, Z. Pile-Soil Stress Ratio and Settlement of Composite Foundation Bidirectionally Reinforced by Piles and Geosynthetics under Embankment Load. Adv. Civ. Eng. 2021, 2021, 1–10. [Google Scholar] [CrossRef]
  6. Adachi, Y.; Kizuki, T.; Tsuchiya, J.; Inazumi, S. Visualization of pile and ground improvement work by introducing ICT construction. Geotech. Eng. J. 2018, 66, 24–25. [Google Scholar]
  7. Inazumi, S.; Adachi, Y.; Nguyen, H.S.; Takaue, T. Ground improvement work with N-value estimation by measurement of current value. Innov. Infrastruct. Solut. 2021, 6, 1–14. [Google Scholar] [CrossRef]
  8. Nguyen, H.-S. Integration of information and communication technology (ict) into cement deep mixing method. Int. J. GEOMATE 2020, 19, 194–200. [Google Scholar] [CrossRef]
  9. The Society of Materials Science Japan (JSMS). DCS Method, 2nd Version; Technical Evaluation Certificate, No. 1006; The Society of Materials Science Japan (JSMS): Kyoto, Japan, 2015. [Google Scholar]
  10. Koshizuka, S.; Oka, Y. Moving-Particle Semi-Implicit Method for Fragmentation of Incompressible Fluid. Nucl. Sci. Eng. 1996, 123, 421–434. [Google Scholar] [CrossRef]
  11. Yamanoi, M.; Kasahara, T. Basics of particle based CFD software, “Particleworks” and our approach into casting engineering. J. Jpn Foundry Eng. Soc. 2014, 86, 965–969. [Google Scholar]
  12. Yokoi, T.; Okuno, R.; Ookori, K. Construction case of large diameter relative mixing method. Found. Eng. Equip. 2017, 45, 41–43. [Google Scholar]
  13. Inazumi, S.; Jotisankasa, A.; Nakao, K.; Chaiprakaikeow, S. Performance of mechanical agitation type of ground-improvement by CAE system using 3-D DEM. Results Eng. 2020, 6, 100108. [Google Scholar] [CrossRef]
  14. Gigwon, H. Experimental study on soft ground with DCM column. J. Korean Geosynth. Soc. 2020, 19, 35–44. [Google Scholar] [CrossRef]
  15. Shen, S.-L.; Wang, Z.F.; Cheng, W.C. Estimation of lateral displacement induced by jet grouting in clayey soils. Géotechnique 2017, 67, 621–630. [Google Scholar] [CrossRef]
  16. Adeli, H.; Kumar, S. Distributed Computer-Aided Engineering for Analysis, Design, and Visualization; CRC Press: Boca Raton, FL, USA, 2020. [Google Scholar]
  17. Chang, K.H. Product Design Modeling Using CAD/CAE: The Computer Aided Engineering Design Series; Elsevier: Amsterdam, The Netherlands, 2014. [Google Scholar]
  18. Inazumi, S.; Tanaka, S.; Komaki, T.; Kuwahara, S. Evaluation of effect of insertion of casing by rotation on existing piles. Geotech. Res. 2021, 8, 25–37. [Google Scholar] [CrossRef]
  19. Pan, Z.; Wang, X.; Teng, R.; Cao, X. Computer-aided design-while-engineering technology in top-down modeling of mechanical product. Comput. Ind. 2016, 75, 151–161. [Google Scholar] [CrossRef]
  20. Inazumi, S.; Kaneko, M.; Shigematsu, Y.; Shishido, K.-I. Fluidity evaluation of fluidisation treated soils based on the moving particle semi-implicit method. Int. J. Geotech. Eng. 2017, 12, 325–336. [Google Scholar] [CrossRef]
  21. Inazumi, S. Mps-Cae simulation on dynamic interaction between steel casing and existing pile when pulling out existing piles. Int. J. Geomate 2020, 18, 68–73. [Google Scholar] [CrossRef]
  22. Inazumi, S.; Kuwahara, S.; Ogura, T.; Hamada, S.; Nakao, K. Visualization and performance evaluation of existing pile pulling method with pile tip chucking by MPS-CAE. Jiban Kogaku Janaru (Jpn. Geotech. J.) 2020, 15, 383–393. [Google Scholar] [CrossRef]
  23. Nakao, K.; Inazumi, S.; Takaue, T.; Tanaka, S.; Shinoi, T. Visual evaluation of relative deep mixing method type of ground-improvement method. Results Eng. 2021, 10, 100233. [Google Scholar] [CrossRef]
  24. Sanyal, J.; Goldin, G.M.; Zhu, H.; Kee, R.J. A particle-based model for predicting the effective conductivities of composite electrodes. J. Power Sources 2010, 195, 6671–6679. [Google Scholar] [CrossRef]
  25. Zhu, C.; Chen, Z.; Huang, Y. Coupled Moving Particle Simulation–Finite-Element Method Analysis of Fluid–Structure Interaction in Geodisasters. Int. J. Géoméch. 2021, 21, 04021081. [Google Scholar] [CrossRef]
  26. Nohara, S.; Suenaga, H.; Nakamura, K. Large deformation simulations of geomaterials using moving particle semi-implicit method. J. Rock Mech. Geotech. Eng. 2018, 10, 1122–1132. [Google Scholar] [CrossRef]
Figure 1. Outline of construction process of DMMs.
Sustainability 14 00058 g001
Figure 2. Stirring wing of NT and stirring wing of DRT: (a) Stirring wing of NT; (b) Stirring wing of DRT.
Sustainability 14 00058 g002
Figure 3. Calculation algorithm for MPS.
Sustainability 14 00058 g003
Figure 4. Concept of bi-viscosity model.
Sustainability 14 00058 g004
Figure 5. Stirring wing model used for MPS-CAE analysis: (a) Stirring wing of NT; (b) Stirring wing of DRT.
Sustainability 14 00058 g005
Figure 6. Targeted soft ground model used for MPS-CAE analysis: (a) Plan (top) view; (b) Side view.
Sustainability 14 00058 g006
Figure 7. Analysis cross section (velocity component in Z-axis direction) at stage of static stirring at bottom: (a) Stirring wing of NT; (b) Stirring wing of DRT.
Sustainability 14 00058 g007aSustainability 14 00058 g007b
Figure 8. Analysis cross section of construction using stirring wing of NT.
Sustainability 14 00058 g008
Figure 9. Analysis cross section of construction using stirring wing of DRT.
Sustainability 14 00058 g009
Figure 10. Depth distribution of injected cement slurry particles.
Sustainability 14 00058 g010
Table 1. MPS-CAE analysis parameters.
Density
ρ (kg/m3)
Yield Value
τ y (Pa)
Plastic Viscosity
η p (Pa s)
Cement slurry1500100.28
Soft ground16001,000,0001000
Table 2. MPS-CAE analysis parameters related to stirring wing behavior.
Elapsed Time Classification
(s)
Rotational Speed of Inner Wing (rpm)Rotational Speed of Outer Wing
(rpm)
Penetration Speed (m/s)Injected Volume of Solidifying Material (m3/s)
0~10−1020−0.10
10~50−1020−0.10.03
50~110−102000
110~15010−200.10.03
150~16010−200.10
Table 3. Calculation results of volume of discharging surplus soil.
Average Moving Velocity for
40 s (m/s)
Total Volume of Discharging Surplus Soil for 40 s (m3)
Stirring wing of NT0.0070.026
Stirring wing of DRT0.1520.609
Publisher’s Note: MDPI stays neutral with regard to jurisdictional claims in published maps and institutional affiliations.

