Article

Industrial Buildings with Zero Energy Consumption: Cathedral Warehouse for Sherry Wines

by
Eduardo Galán Navia-Osorio
1,
Fernando R. Mazarrón
1,
César Porras-Amores
2,* and
Ignacio Cañas
1
1
Departamento de Ingeniería Agroforestal, Escuela Técnica Superior de Ingeniería Agronómica, Alimentaria y de Biosistemas, Universidad Politécnica de Madrid, Avenida Puerta de Hierro, nº 2, 4, 28040 Madrid, Spain
2
Departamento de Construcciones Arquitectónicas y su Control, Escuela Técnica Superior de Edificación, Universidad Politécnica de Madrid, Avenida Juan de Herrera, 6, 28040 Madrid, Spain
*
Author to whom correspondence should be addressed.
Sustainability 2022, 14(1), 563; https://doi.org/10.3390/su14010563
Submission received: 4 November 2021 / Revised: 26 December 2021 / Accepted: 30 December 2021 / Published: 5 January 2022
(This article belongs to the Special Issue Indoor Environment in Sustainable Buildings)

Abstract

:
The industrial sector needs solutions and strategies that allow buildings to reduce their energy consumption and develop their daily business activities. This paper discusses the long-term monitoring measures of indoor thermal conditions in a warehouse with zero energy consumption. The objective is to promote the use of passive design strategies within the industrial sector by analyzing an example of the feasibility of achieving controlled environmental conditions with zero energy consumption. In total, more than a million data points were processed and analyzed in different periods of the year. Experimental measurements showed strong gradients in the vertical distribution of temperature, this being a key aspect of the general behavior of the indoor environment of the warehouse. A standard comparison variable was developed to quantify the monthly and daily evolution of vertical stratification of the air to explain in detail the thermal behavior of the warehouse throughout the year. The results showed the efficacy of the design of these constructions to mitigate the high temperatures typical in a Mediterranean-Oceanic climate. This example of ingenuity in passive design demonstrates how, by combining the right strategies, the desired conditions can be obtained without any energy consumption.

1. Introduction

The first step to comply with the European Union goals of Near-to-zero energy buildings is to reduce the energy consumption in buildings. Most of building consumption is related to the use of active systems to maintain interior comfort [1]. The industrial sector consumed 52% of global delivered energy in 2008, and its energy consumption increases by an average of 1.5% per year over the projection [2]. The industrial sector needs solutions and constructive strategies that allow the buildings to reduce their energy consumption as well as develop their daily business activities. Numerous studies are focused on the reduction of the energy consumption in residential, public, and commercial buildings. However, there are a lot fewer studies focused on the industrial field. Industrial buildings have high thermal loads and air-change rates, long operating hours, and great pollution control or other environmental requirements [3]. A good alternative for reducing the energy demand of a building is to implement passive design strategies [4,5,6,7]. Previous studies support that passive design buildings can save more than 50% of total primary energy consumption [8].
There are many studies that focus on investigating the indoor environment and thermal stratification in industrial buildings, as well as its interaction with humans. For example, several researchers have evaluated the effects of moderate cold and heat stress on factory workers in Southern Africa, in aspects related to full-scale simulations [9]; skill and performance in the cold and the heat [10,11]; skin temperature, oral temperature, heart rate, and comfort vote [12]; comparison between naive and skilled workers [13]; performance and physiological reactions to increased humidity [14]. Other more recent studies have focused on adaptive thermal comfort for workers, quantifying psychological and behavioral changes in workers due to the COVID-19 pandemic situation [15]. However, there is less research on evaluating the indoor environment in industrial buildings and their interaction with stored products.
The present study is focused on a building located in the south of Spain, a cathedral warehouse, an example of passive building design in the agricultural industrial sector. Cathedral warehouses present a centenary constructive design and are commonly used for the aging of the Sherry wines of Jerez. In its interior, the wine is placed in the lower part of the warehouse, placing them at different heights and placing those of better quality and older close to the ground. Chemical and biological processes that require very particular environmental conditions take part during the elaboration process of the wines. Specifically, in biological aging, the environmental conditions of both temperature and air humidity must be consistent and maintained for decades [16].
A cathedral warehouse provides special environmental conditions for the aging of Sherry wines. These conditions are necessary for the proliferation of a layer of yeast that grows on the surface of the wine, called “veil of flor” [17]. When these environmental conditions change, the biological process through which wines are processed is usually altered [18]. The studies carried out about this type of wines (one hundred indexed articles in the last five years) focus on the physicochemical properties, economic aspects, commercial aspects, etc. However, no studies have been found that analyze the design points of the industrial building that make possible the aging of this unique product. On the contrary, in other types of wines, there are several studies on the relation between construction and the indoor environment [19,20,21].
In this paper, the complex way of working warehouse of the cathedral is examined in detail, analyzing the different factors that make possible an ideal indoor environment throughout the year. To obtain such conditions, avoiding the characteristic high temperatures of a warm climate and achieving the right humidity level, the buildings base their control on a combination of factors such as air stratification, ventilation, or thermal inertia of the floor and the walls. Among the mentioned factors, as will be seen later, the great indoor height of these buildings and the air stratification this fact implies must be noted. The stratification of the air temperature is a very significant phenomenon of the building behavior, which may be of great importance in high-rise buildings.
At present, there are few studies focused on investigating the phenomenon of stratification or air temperature in warehouses. Mark Armstrong et al. [22] analyzed the energy savings of cold weather destratification of a warehouse facility. The results include both environmental conditions’ and energy savings’ analysis of a fan system in a Toronto warehouse where energy losses over the total cost are up to 5%. Fernando R. Mazarrón et al. [23] carried out an evaluation of low-rise basement constructions in the winery industry, showing that interior environmental conditions present much greater stability than exterior conditions (70% reduction in annual temperature variation and 98% reduction in daily variation reduction). C. Porras-Amores et al. [24] analyzed the vertical temperature gradients existing in warehouses, quantifying their value and analyzing their evolution over the year. The stratification values shown in the research could be helpful for low-rise warehouses for products sensitive to temperature changes. In view of little information about the stratification of air temperature in warehouses without HVAC systems, this fact should be further explored more deeply.
Furthermore, this research reveals the indoor behavior of the high-rise cathedral warehouse for Sherry wines. There are no precedents in analyzing the behavior and effectiveness of the strategy used in cathedral warehouses, combining great interior height and upper ventilation openings. In addition, no studies were found analyzing the evolution of the temperature inside this type of construction.

2. Materials and Methods
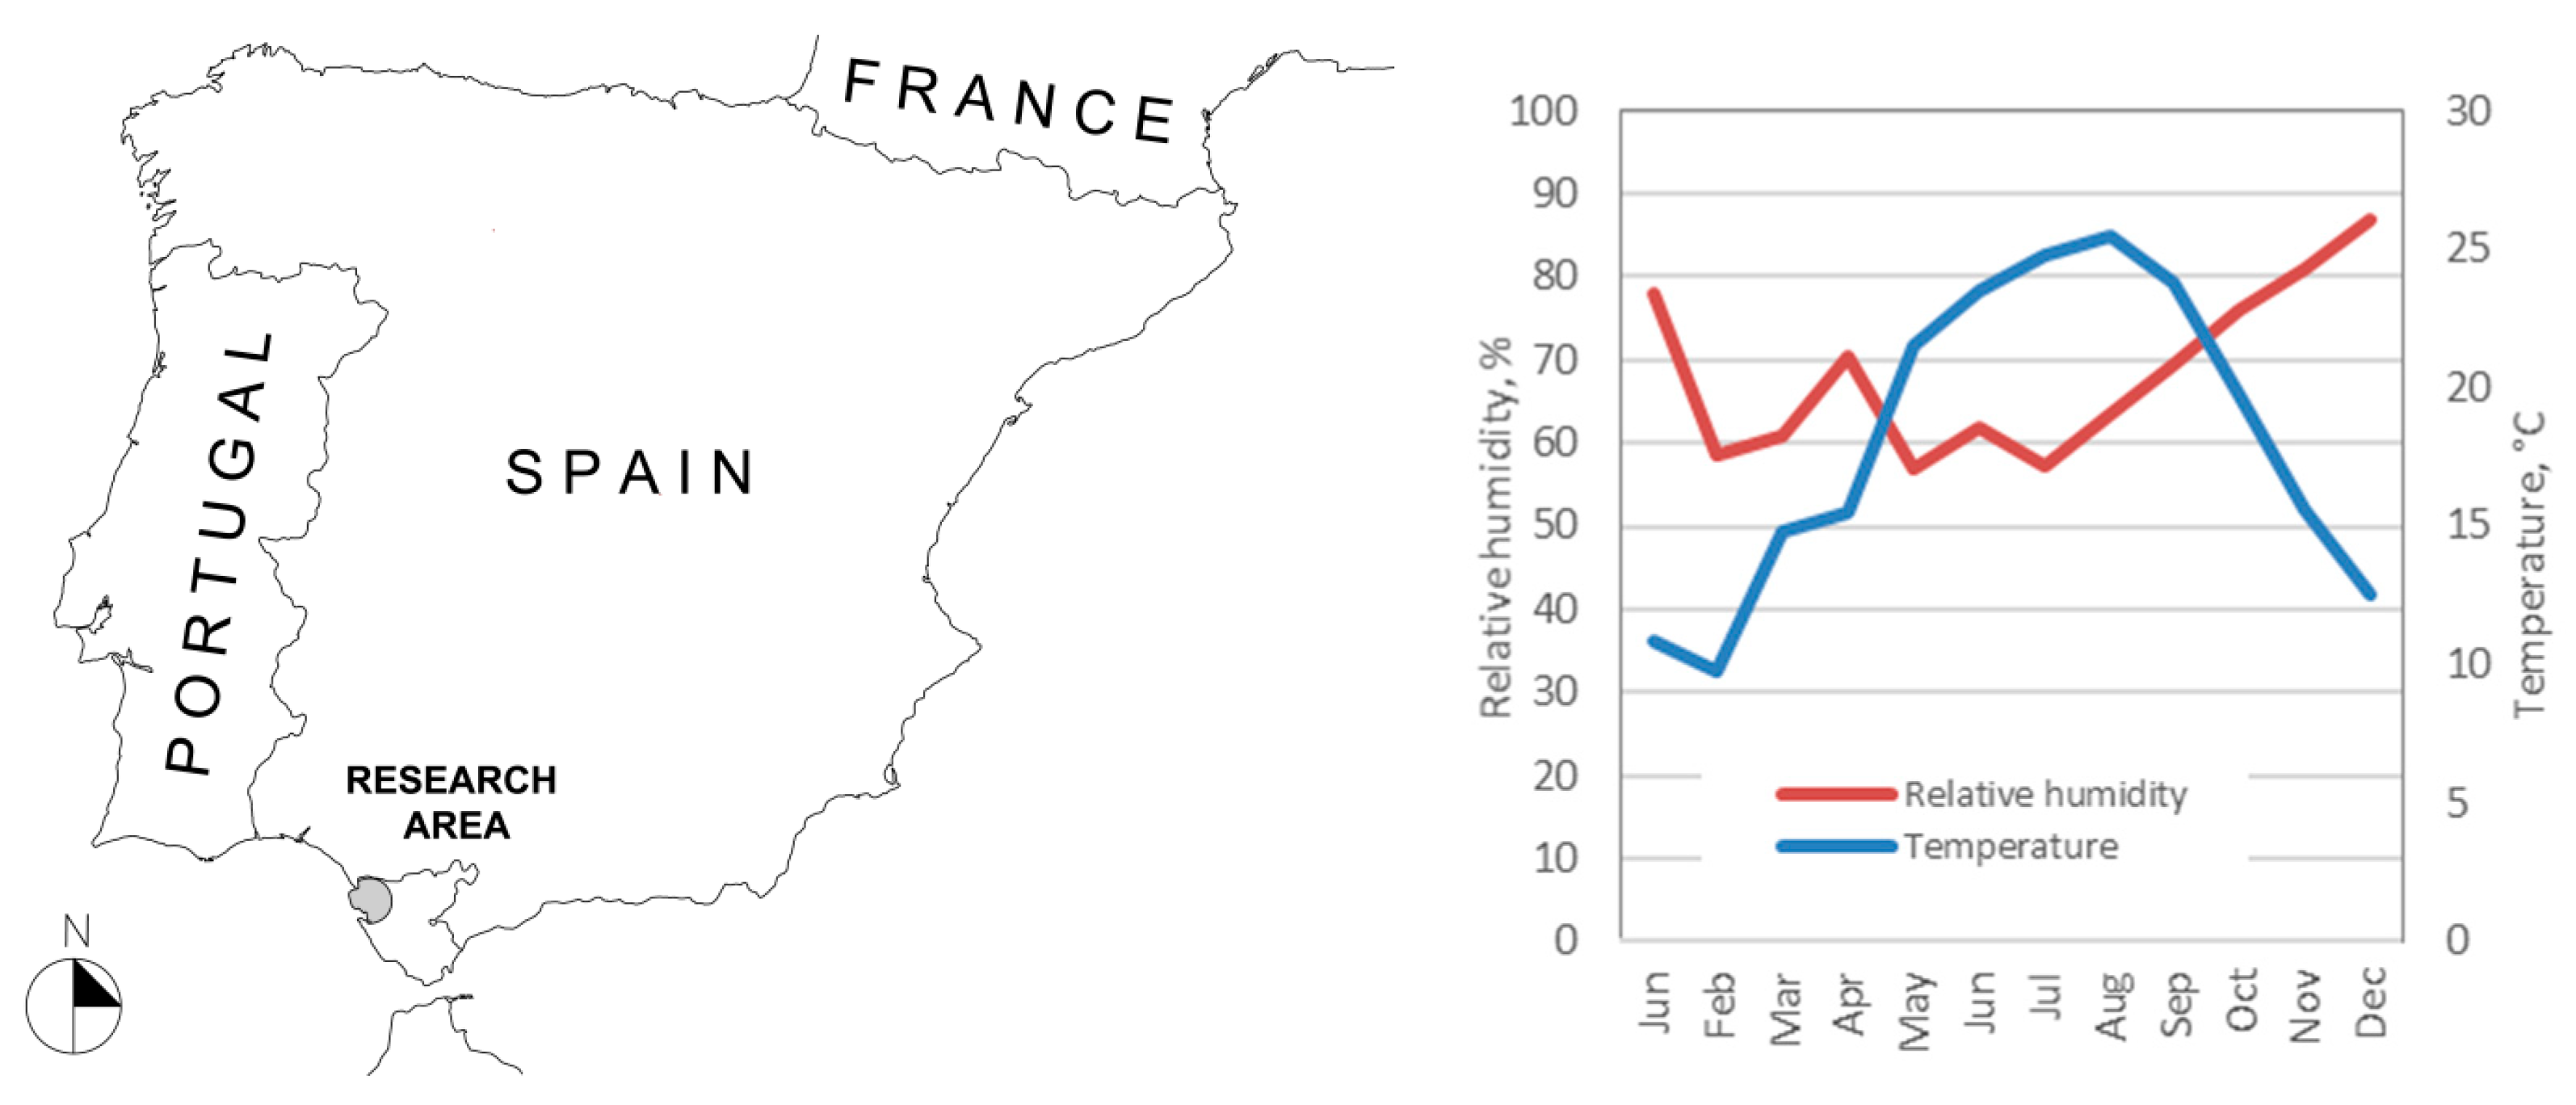
2.1. Area of Study

The study area is the west coast of the province of Cádiz, located in the south of Spain. It is an area known as “El Marco de Jerez” (area of Jerez), a place with ancient wine tradition, where quality and internationally known Sherry wines are produced (Figure 1).
The Jerez area has a Mediterranean-Oceanic climate with moderate temperatures all year round. The average annual temperature in the year of study was 18.2 °C, with maximum temperatures around 40 °C in August and minimum temperatures of 0 °C in January.
The air humidity is quite high, except for the dry months, with an average annual relative humidity of 68%. The wind has a great influence on the humidity. When the wind comes from the west, 100% humidity may be reached, while when it comes from the east, humidity can lower to 20%.

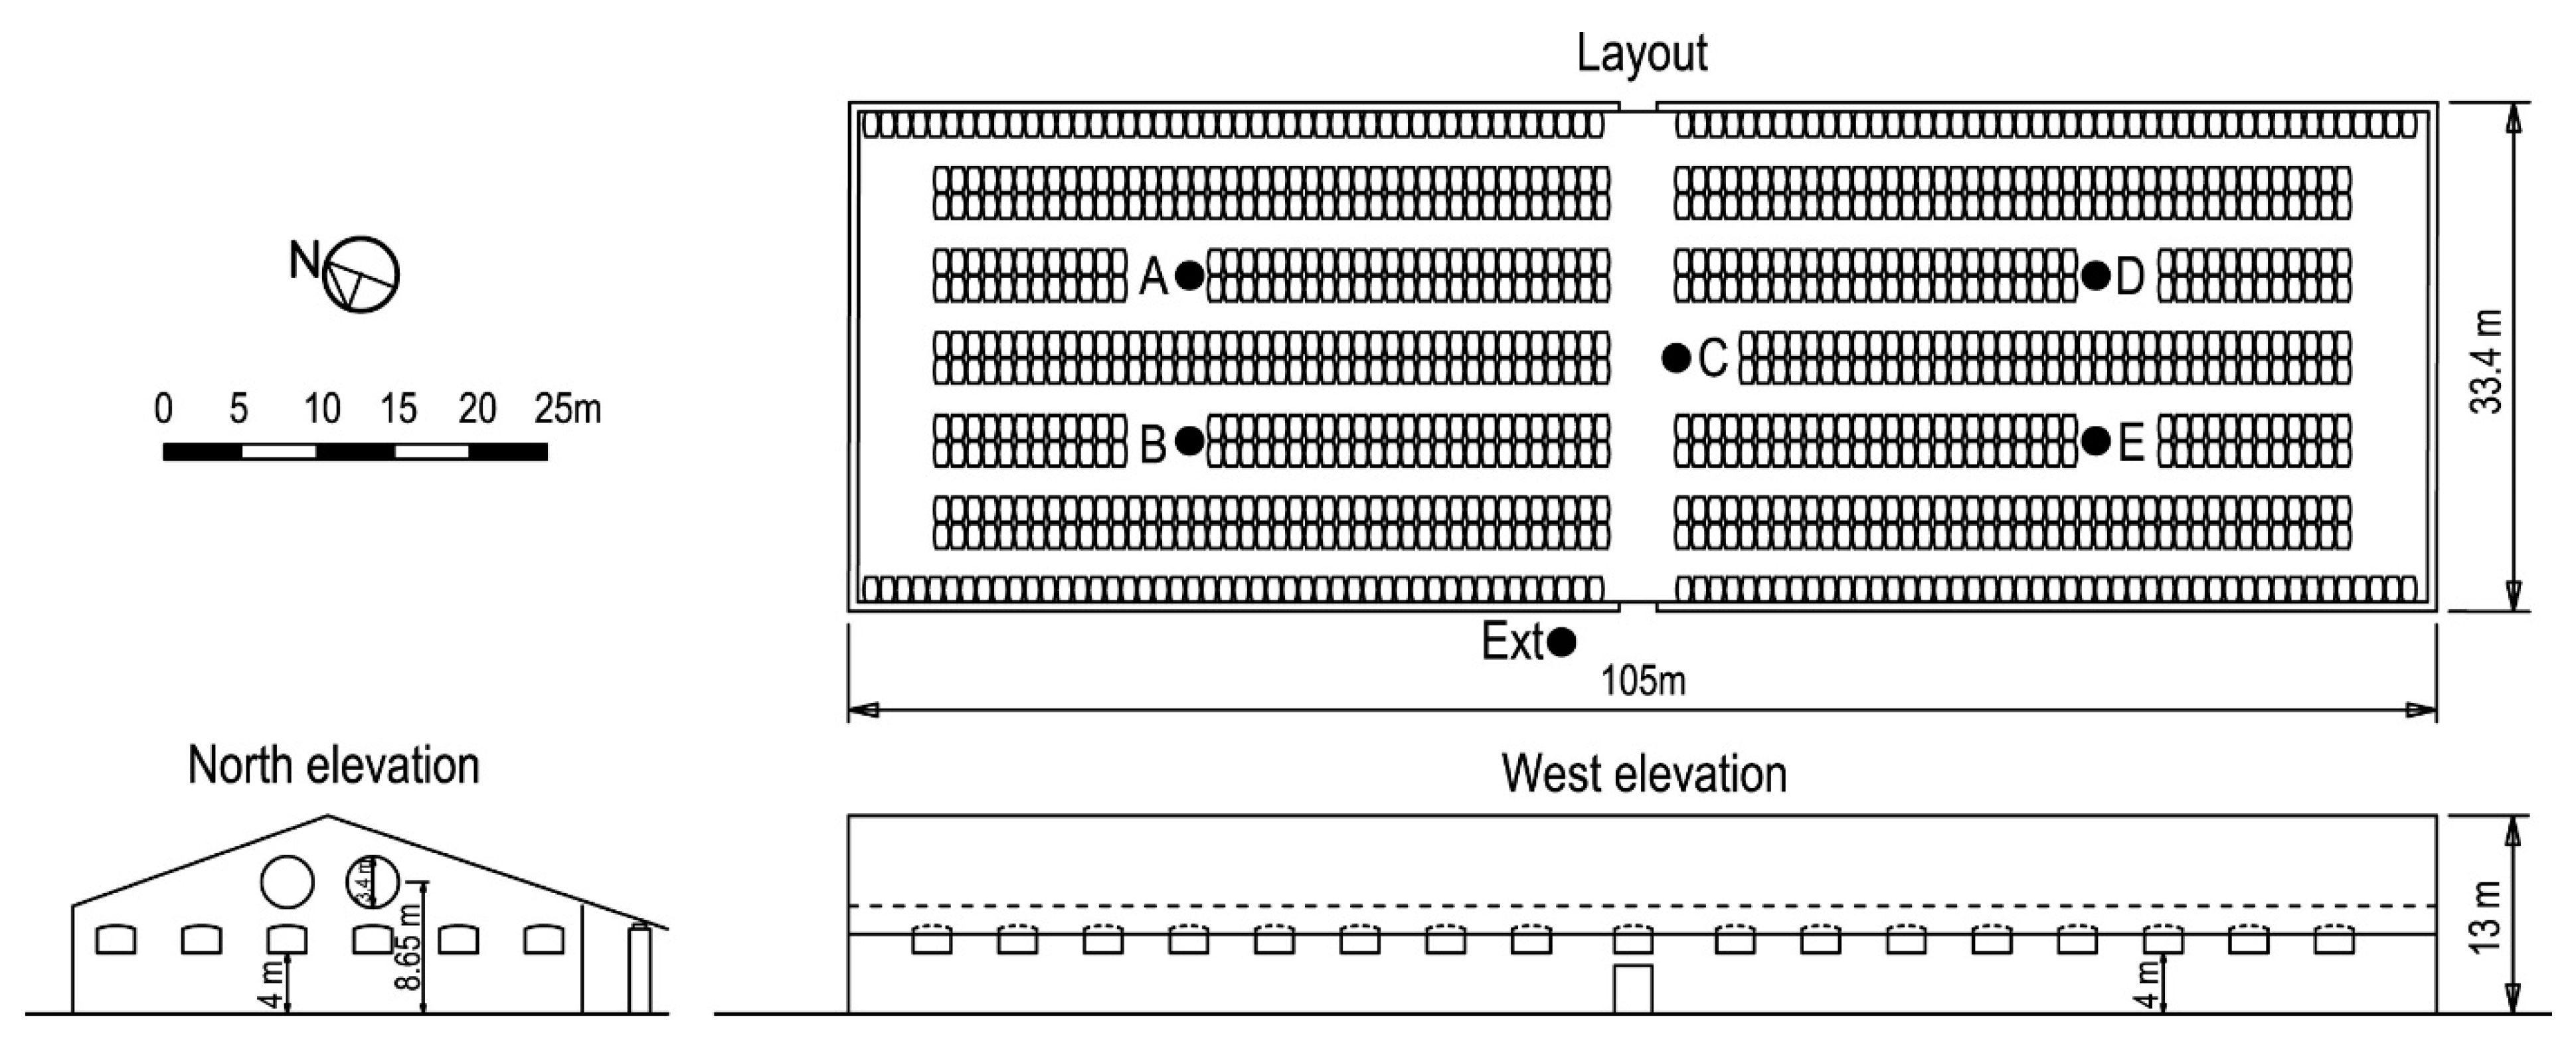
2.2. Analyzed Building

This paper examines the complex way of working of a zero-energy industrial building, establishing the relationship between the indoor environment and the passive and constructive systems employed in the cathedral warehouse. To do so, a representative building with the architecture of the area has been monitored. The building has an orientation (northwest-southeast) that is ideal for capturing the environmental humidity from the sea and avoiding the high insolation over both longitudinal façades (Figure 2).
Next, the main constructive features of the building are described:
  • It has a pitched roof with two slopes that meet at a central ridge. The orientation of the building and the design of the roof with two slopes allow the indoor heating of the building during the summer months to be lower, as the heat interchange is mainly done through one of the slopes. The materials that form the roof are ceramic roofing tiles (exterior material), mortar of lime and sand mortar, thick compact cooked clay bricks (5 cm), and a mixture of wood slats. The entire roof relies on large wood joists. the thermal characteristics of the roof are shown in Table 1.
  • The structure is made of several courses of pillars (60 cm2) that hold the roof and of load-bearing 80 cm thick walls that work as a closing. The pillars are made of stone and brick and support large wooden beams where the joists are supported. The very large span, in addition to its structural function, allows for ventilation and the height of the ceiling. The walls are made with mortar (lime, sand, and water), stone masonry, and mortar (lime, sand, and water). Exterior walls help maintain indoor environmental humidity due to the materials they have been built with. Sandstone has high hygroscopic properties that allow the wall to absorb water from the terrain [16]. The indoor and outdoor finishing is hygroscopic and allows the transpiration of the building. The white lime exterior finishing (reflecting) reduces the effect of sun beams.
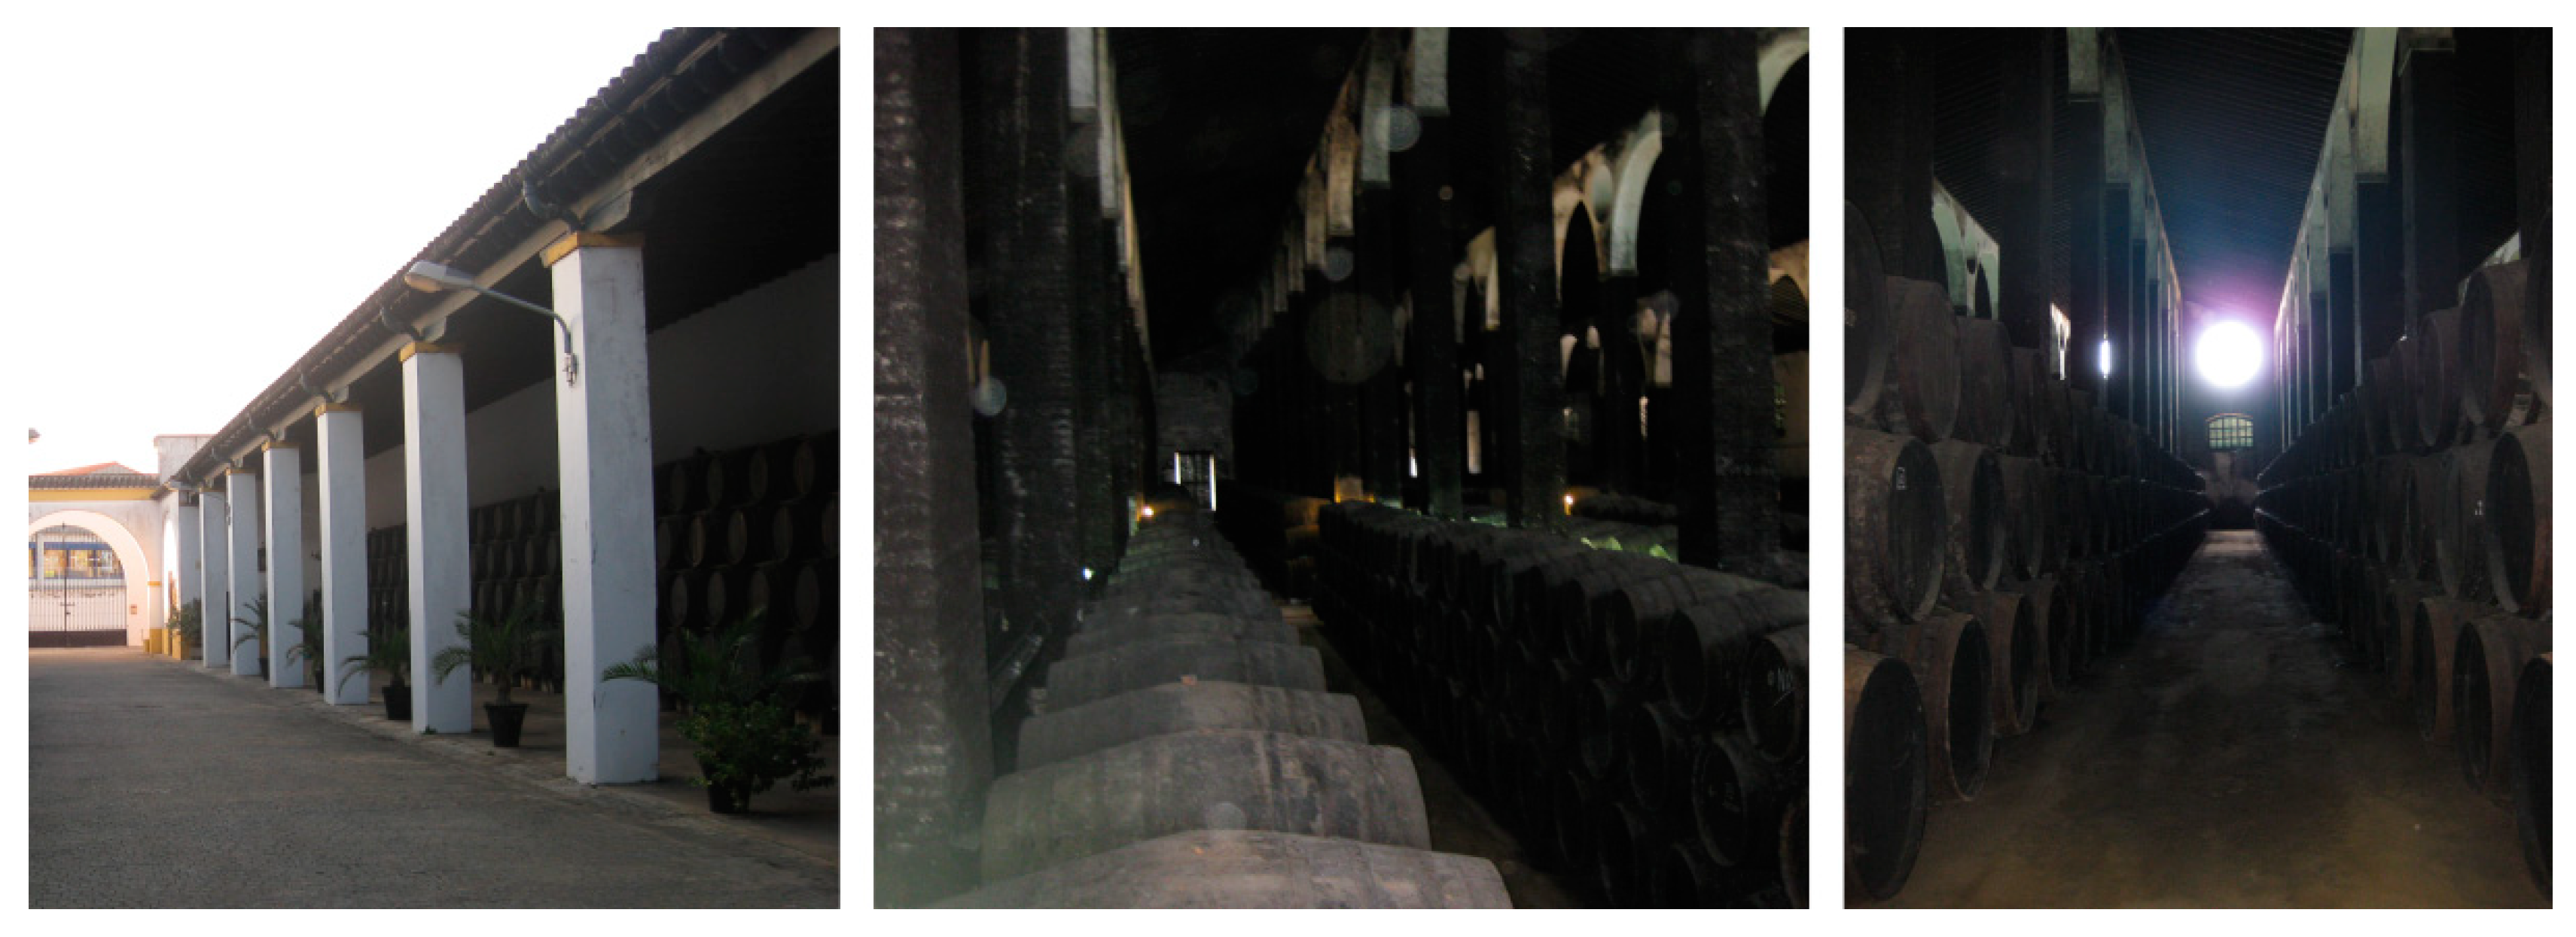
  • Voids in façade: The accesses to the building, made of large wood doors, are placed in the central part of the longitudinal façades. The window openings (1.6 m × 2.5 m) are located four meters from the ground and distributed throughout the perimeter of the building. The openings do not have windows [25], but they have an iron bar frame and are usually covered with thick esparto blinds, allowing ventilation in addition to preventing direct entry of sunlight and subsequent indoor heating of the building. The window voids located at great height favor natural ventilation and transpiration inside the building. Additionally, there are two large round openings in the upper northwest part of the building, close to the roof, that have the function of favoring ventilation.
  • The pavement is formed by long concrete flooring as distributors, and the rest of the floor is built with a mix of sand, lime, and some iron (Figure 3). Their use has traditionally been justified as a means to conserve humidity and as a passive refrigerator in the lower area, where the product is stored [16]. When the outdoor temperature is high, the sand floor is watered to reduce the temperature by evaporative cooling.

2.3. Monitoring

Firstly, a preliminary study was carried out using nonpermanent sensors and a thermographic camera to offer a global idea of the indoor hygrothermal behavior of the constructive elements of the building in different periods (warmer and colder season), as well as to help design the permanent monitoring plan. To do so, a thermographic calibrated camera Model FLIR B335 with a FOL18 lens (thermal sensitivity/NETD 50 mK; IR resolution 320 × 240 pixels and Spectral range 7.5–13 μm) was used.
Subsequently, a permanent monitoring plan was designed using temperature and humidity sensors distributed in different indoor and outdoor areas of the building (Figure 2). The goal of the installed sensors system is to track in detail and for a long period of time the main environmental parameters of the wine aging process carried out inside the building.
To determine the horizontal variations of temperature and relative humidity, sensors were installed in the four quadrants of the useful surface in which the space is divided, as well as in the center of the building. The sensors were placed at an intermediate height of storage of the product. Since the preliminary analysis showed a great hygrothermal uniformity throughout the warehouse, numerous temperature sensors were installed at spots A, C, and E (Figure 2) were installed with the aim of monitoring in detail the vertical variations throughout the year. The thermography inspections were verified to show that the considerable temperature differences were vertical.
Therefore, temperature probes were placed at different heights of 0.1, 1.2, 2.4, 3.6, 4.8, 6, 7.2, and 8 m, along with a temperature and humidity sensor at 10.2 m in the highest central area, covering a large part of the vertical profile from the ground up to the area close to the roof. Outdoor conditions were monitored through a sensor located close to the construction, protected from solar radiation and rain with a special case.
During the monitoring process, Hobo® Pro V2 data loggers with interior temperature sensors of the type thermistor and capacitive type relative humidity (precision ±0.18 °C at 25 °C and ±2.5% from 10% rh to 90% rh) and four channel Hobo® data loggers with exterior temperature probes (precision ±0.25 °C at 20 °C and resolution 0.03 °C at 20 °C) were used. The measurement interval was set at 15 min for all loggers for one year, obtaining a total of 1.059.212 data points.

2.4. Analysis of the Data

Thermograms obtained in the preliminary inspections were processed through commercial software, obtaining temperature profiles along the construction. The analysis of the thermograms made clear the differences between the different elements of the construction, showing significant variances of temperature. The information obtained in this analysis served as a basis for optimizing the permanent monitoring system. Temperature and relative humidity data were processed and analyzed to quantify the average variations, both horizontal and vertical.
Given the large vertical temperature variations recorded in the warmer season, the influence of the height of the building on vertical temperature is analyzed in detail throughout the year. To do so, the data obtained through the monitoring were statistically processed in order to characterize the stratification of the temperature and the influence of the exterior temperature.
After conducting a preliminary analysis of the temperature profiles obtained (Figure 4), a linear temperature variation was assumed, in which the temperature increases constantly with height. This approximation was valid for the purpose of the article (as it will be analyzed in the results), allowing one to carry out a comparison between the average values of variation along the months, and between some areas and others.
In this way, the model that relates the difference in temperature between any height and the height close to the floor (ΔT) with the height (h) is as follows:
ΔT = β1h + ε
where β1 (°C/m) represents the way in which changes in the independent variable (height) influence the dependent variable (difference of temperature with respect to the temperature in a spot close to the ground), ε being an error term which represents unexplained variation in the dependent variable, assuming a linear regression. Linear regression analysis has been carried out for each of the 35,136 instants in which the temperature profile was monitored in the different areas of the building (A, C, E).

3. Results

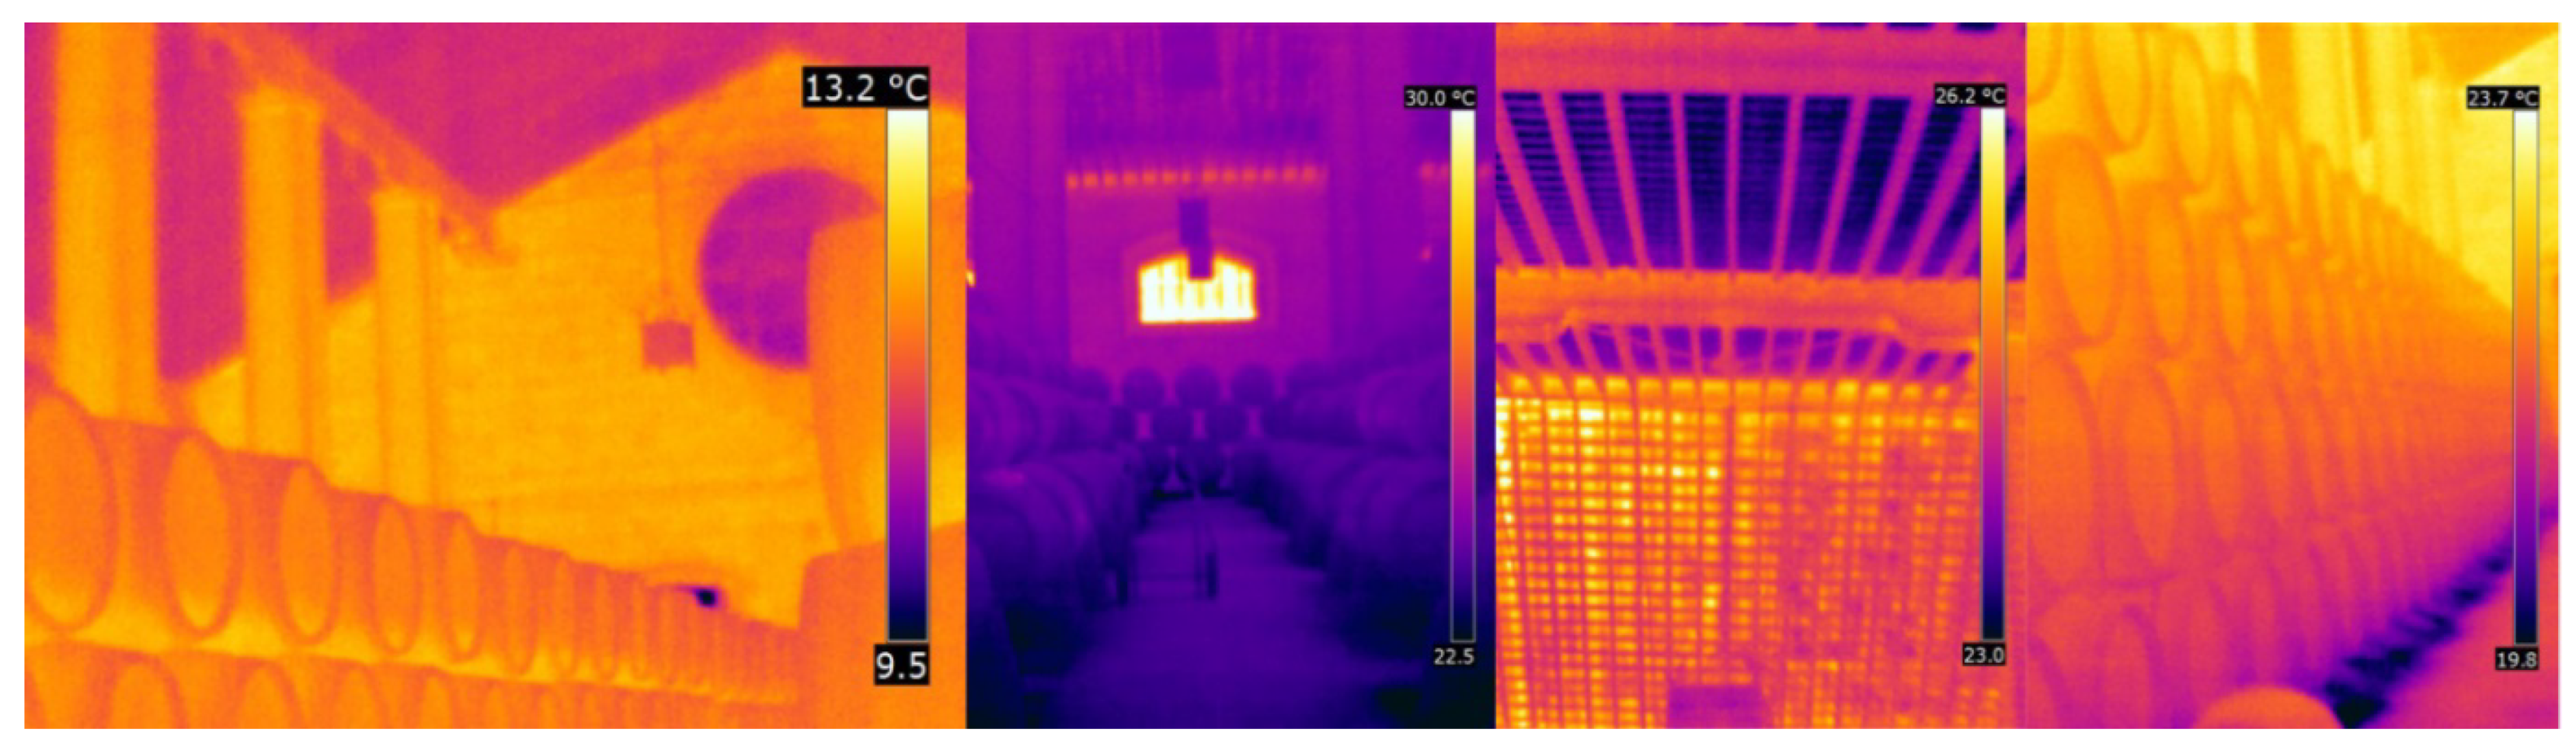
3.1. Preliminary Analysis through Thermographic Inspection

Preliminary thermography inspections provided qualitative information on the overall thermal behavior of the building, helping to optimize and decide the permanent monitoring plan. In addition, the qualitative analysis carried out tried to offer a global vision of the thermal behavior of the constructive elements inside the building in different periods.
In the hottest season, differences of several degrees were recorded between elements close to the roof and those close to the floor. In the area where the product was stored (up to four meters) the variations were also high, particularly in the summer. The sand floor and the area close to it maintained a lower temperature than the rest of the construction elements (Figure 4). This phenomenon seems to highlight air stratification inside the building. On the contrary, horizontal variations along the cathedral warehouse seemed to be less significant, showing differences lower than ≈1 °C.
In the summer months, when the daily insolation in the roof was at its highest, the differential heating of the two slopes was clear, even with differences higher than ≈3 °C (Figure 4). It was also observed how in this period the highest temperatures were reached in the upper strata of the building. This phenomenon may confirm the correct use of great heights to avoid reaching temperatures that are too high in the area of storage of Sherry wines.
On the contrary, the changes seemed to be less evident in the colder months, with smaller differences, both vertical and horizontal. In the winter, the roof could be several degrees cooler than the elements of the lower indoor area. As expected, ventilation holes were the elements that presented a lower temperature in the winter and a higher temperature in the summer. However, the great abundance of these elements is justified, as it plays a very important role in the regulation of ventilation, an aspect that will be analyzed later through the permanent monitoring plan. The differences in temperature found in the wall and in the big round opening made clear the great thermal inertia of the thick walls and their ability to dampen the daily temperatures.
The first approach to indoor environmental behavior conducted in this section indicates the existence of strong vertical temperature gradients and small horizontal variations in the summer and winter days studied. In addition, natural ventilation is made through the entrance openings (windows and high round openings) of the warehouse, this being a key aspect in the regulation of the indoor environment. For these reasons, the permanent monitoring system has focused on the analysis of the vertical stratification of the temperatures.

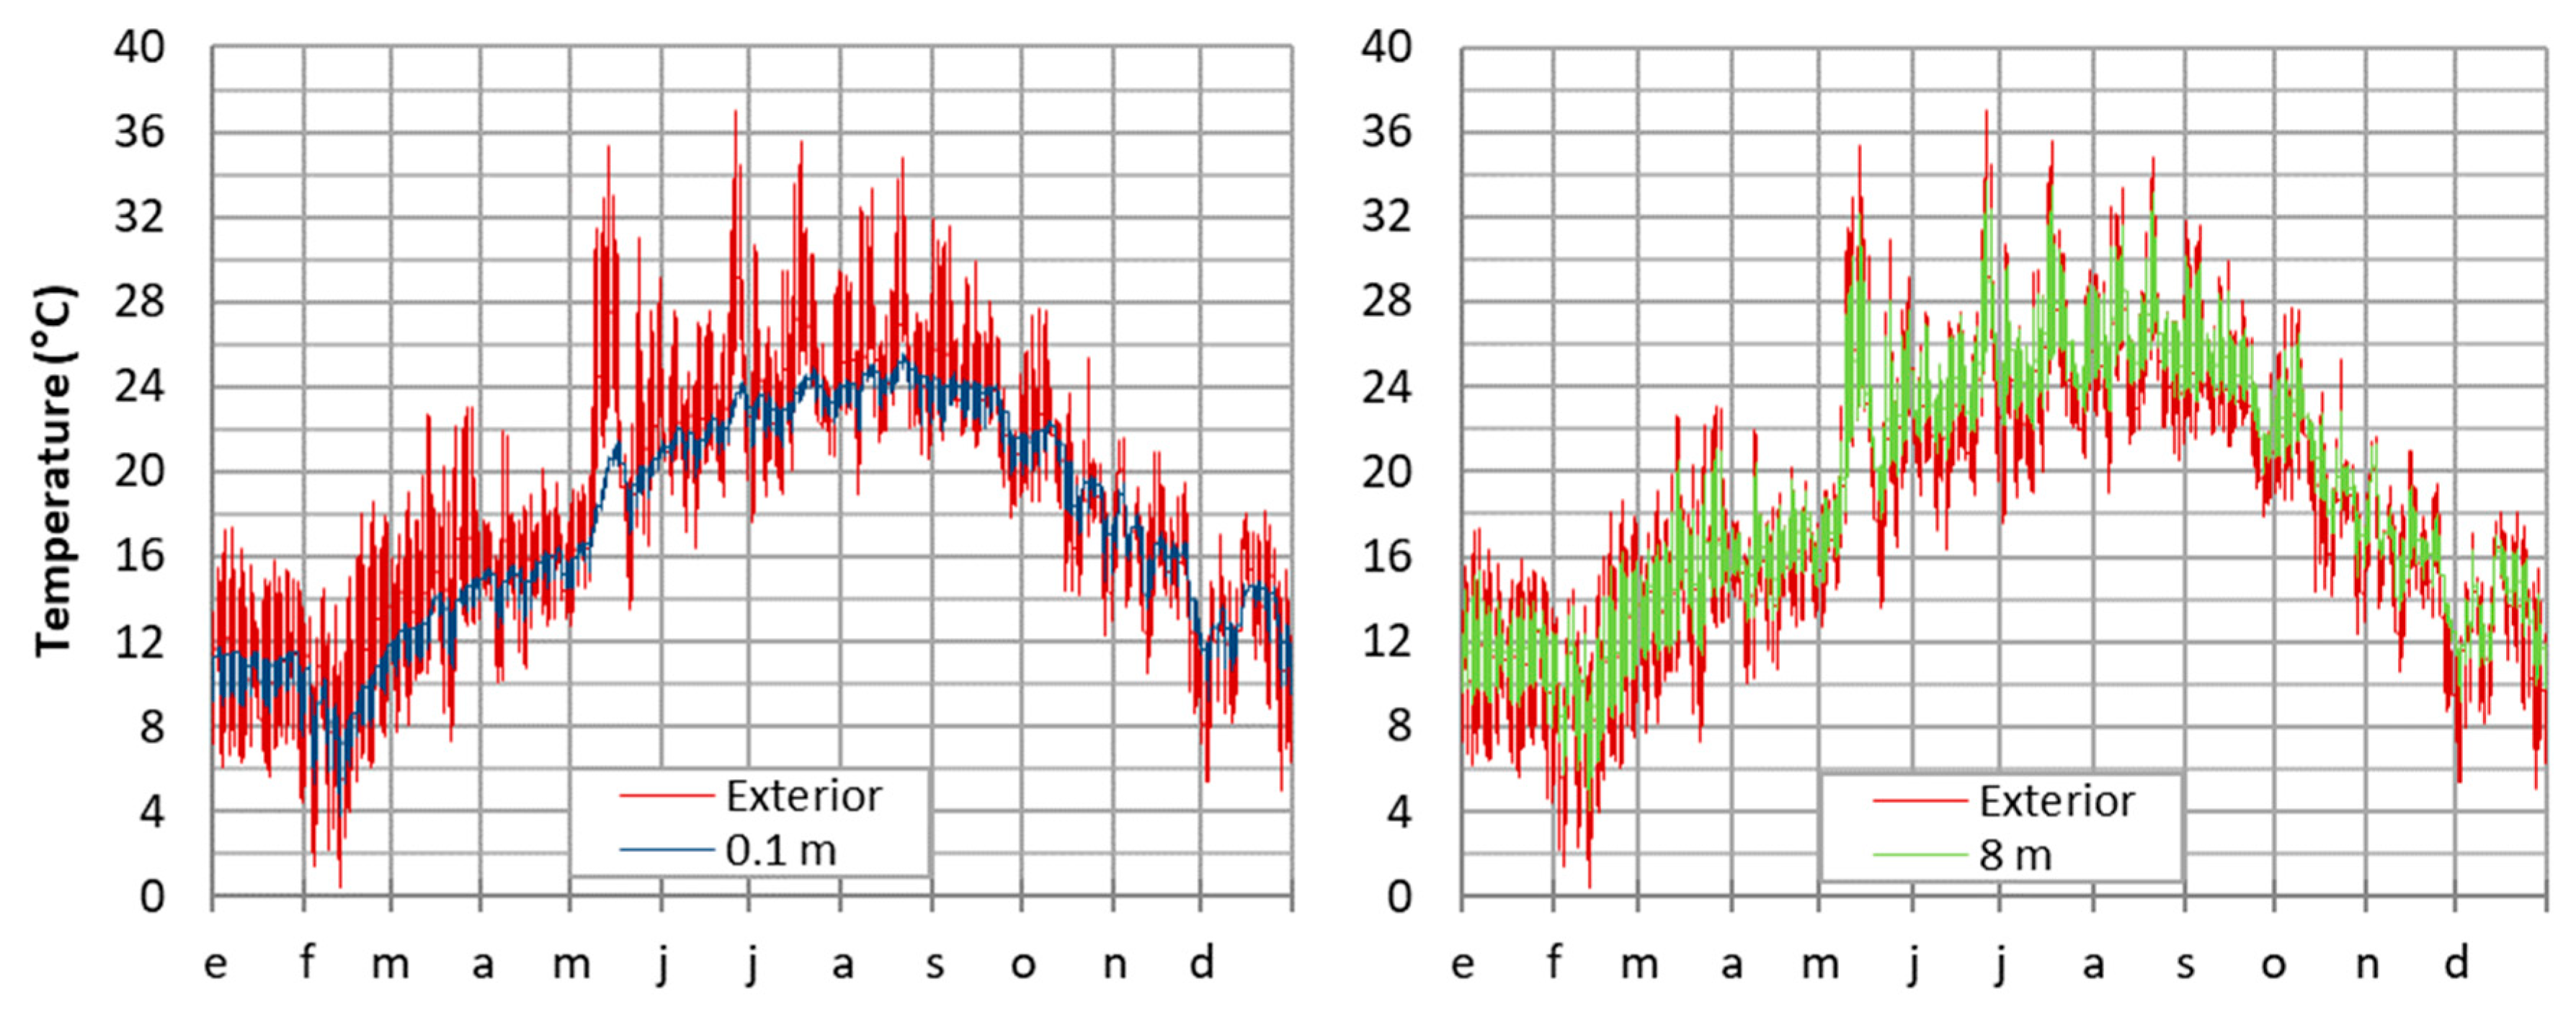
3.2. Analysis of The Data of Permanent Monitoring

The analysis of the indoor and outdoor temperature data monitored for a year allowed confirming the preliminary results obtained with thermography. In general, the registered horizontal variations were not significant.
For the horizontal distribution of air temperature, the average annual values obtained at different heights were 0.33 ± 0.25 °C at 0.1 m; 0.35 ± 0.17 °C at 1.2 m; 0.36 ± 0.11 °C at 2.4 m; 0.38 ± 0.09 °C at 3.6 m; 0.27 ± 0.08 °C at 4.8 m; 0.21 ± 0.08 °C at 6 m; 0.06 ± 0.08 °C at 7.2 m; 0.02 ± 0.1 °C at 8 m. At a great height, the differences were very small on all surfaces of the warehouse, which indicated higher homogenization of the air in these strata. In the same way, the relative humidity on all horizontal surfaces of the building appeared to be relatively stable, with an average difference from 0.4 ± 1% to 2 m.
The lower area of the warehouse where the wine is stored was much more stable than the high area in front of the changes in outdoor temperature. The differences between the lower area and the area close to the roof may go over 10 °C in the hottest times of the summer months (Figure 5). As height increased, the influence of the exterior and the daily changes registered increased.
The intensity of the vertical temperature gradients varied depending on the height and time of year. Given this behavior, a detailed study of the vertical distribution of temperatures throughout the year was carried out. To do so, the monthly average temperatures were calculated for each height monitored in each of the studied areas. The monthly averages were used to represent the temperature profile for each month (Figure 6). Since the building has a gable roof, the height monitored in the central part (10.2 m) was higher than on its sides (8.0 m) due to the slope of the roof. However, only seven months of data could be obtained from the sensor located at 10.2 m, due to a problem in the data recording.
Vertical air stratification showed important differences depending on the time of year, increasing with outdoor temperature (Figure 6). The monthly average differences between the upper and lower parts may go over 3.3 °C of monthly average in the warm months. In contrast, in the cold months, the differences were considerably smaller (1 °C), with close values along all the vertical profiles. This phenomenon was due to existing temperature differences between the roof and the strata close to the floor, the temperature of which was conditioned by the own floor and the infiltration of exterior air through the entrances of the building.
In the summer, the highest incidental radiation on the roof heated up the indoor air, which, being lighter, remained in the high areas, so the differences with the lower strata increased. Hot air infiltrations through the higher round openings also remained in the higher area. In the winter, the roof had a lower temperature than the floor and the air of the lower strata. This implies that the roof cooled the air in the upper strata, which was heavier than the lower strata air and went down, creating homogenization of the air and smaller differences. The cold air coming from outdoor infiltrations would increase this phenomenon.
When the monthly temperature curves of the warm months were examined in detail (Figure 6), a bigger increase of the temperature differences among the first four meters appeared. From that height on, coinciding with the height of the window openings, the increase was much more moderate or even non-existing, with some peak in the area close to the roof. This phenomenon, along with the greater similarity of indoor and outdoor temperature from four meters on, seemed to indicate that the air was more static and stratified in the lower part of the building, while as the height increased, there was a homogenization of the air and outdoor infiltrations.
Indoor thermal stratification seems to be a key aspect in the operation of the indoor environment of the warehouse, since it allows one to understand the global thermal behavior of the construction. Therefore, in the following section, a standard comparison variable that quantifies both the monthly and daily evolution of vertical thermal stratification of the air is proposed to explain the hygrothermal behavior and ventilation of the building throughout the year.

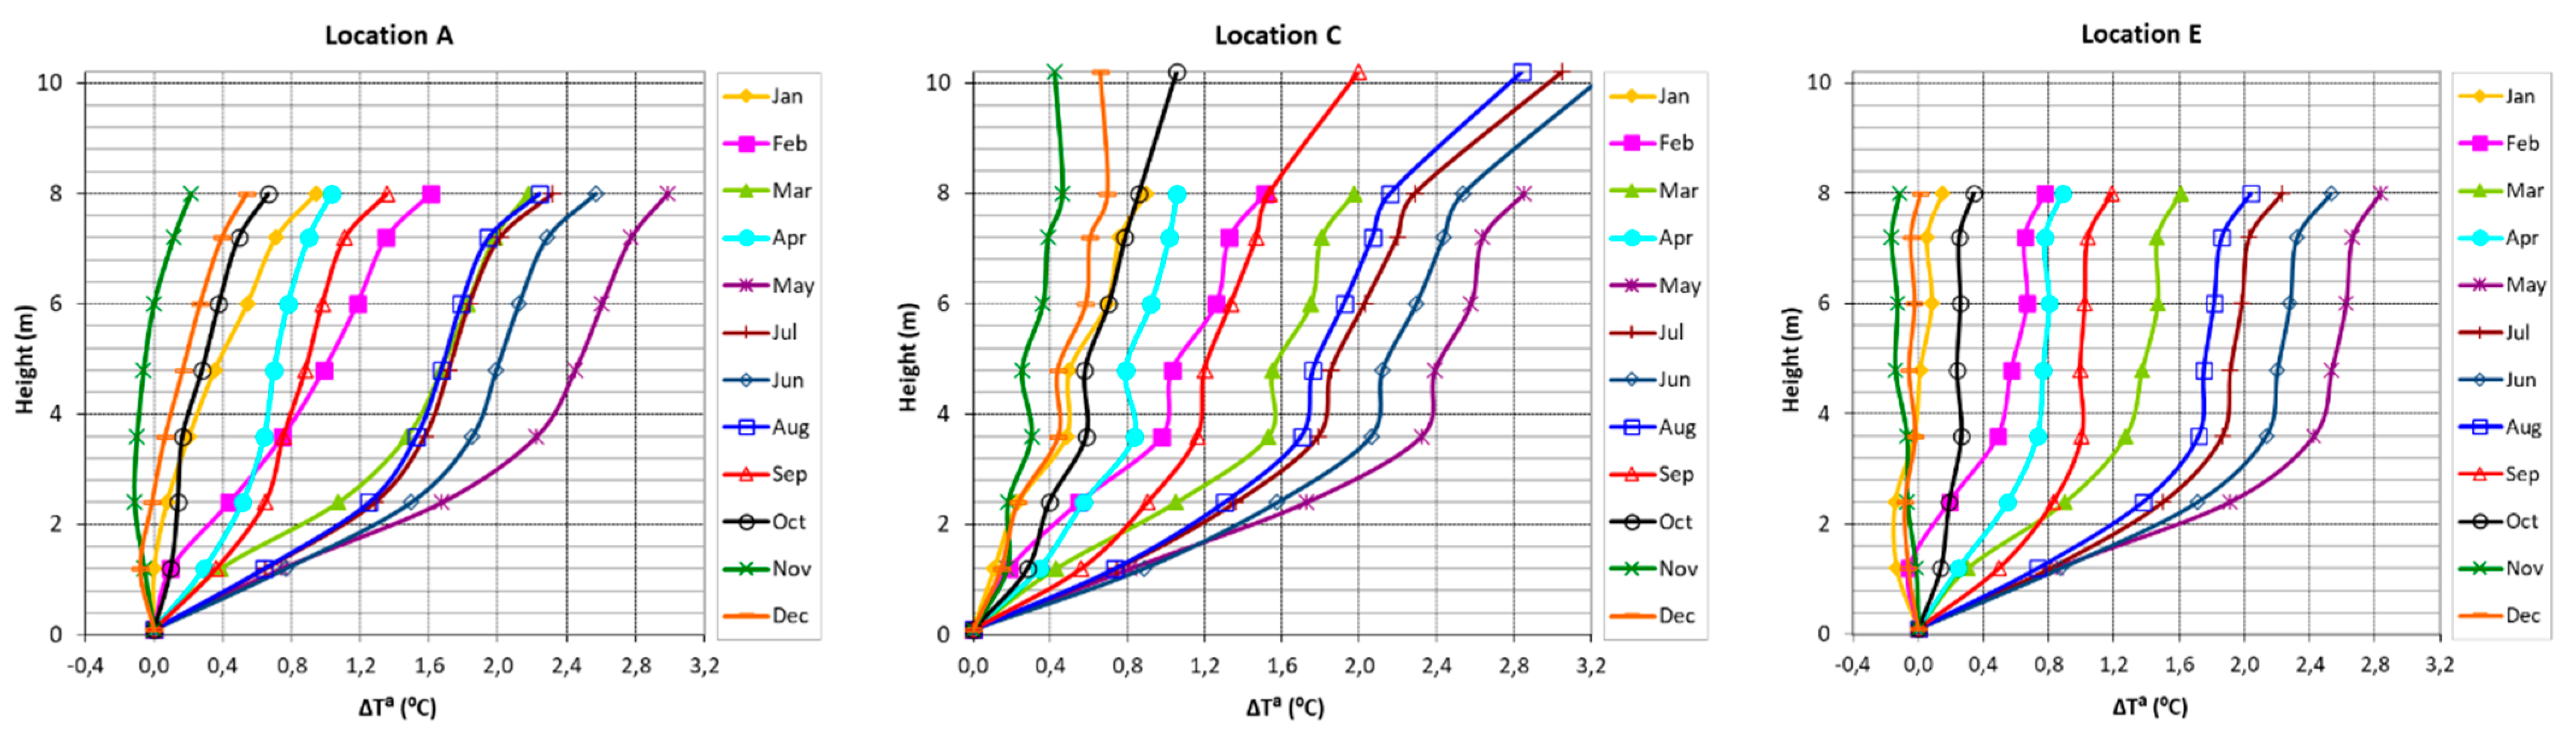
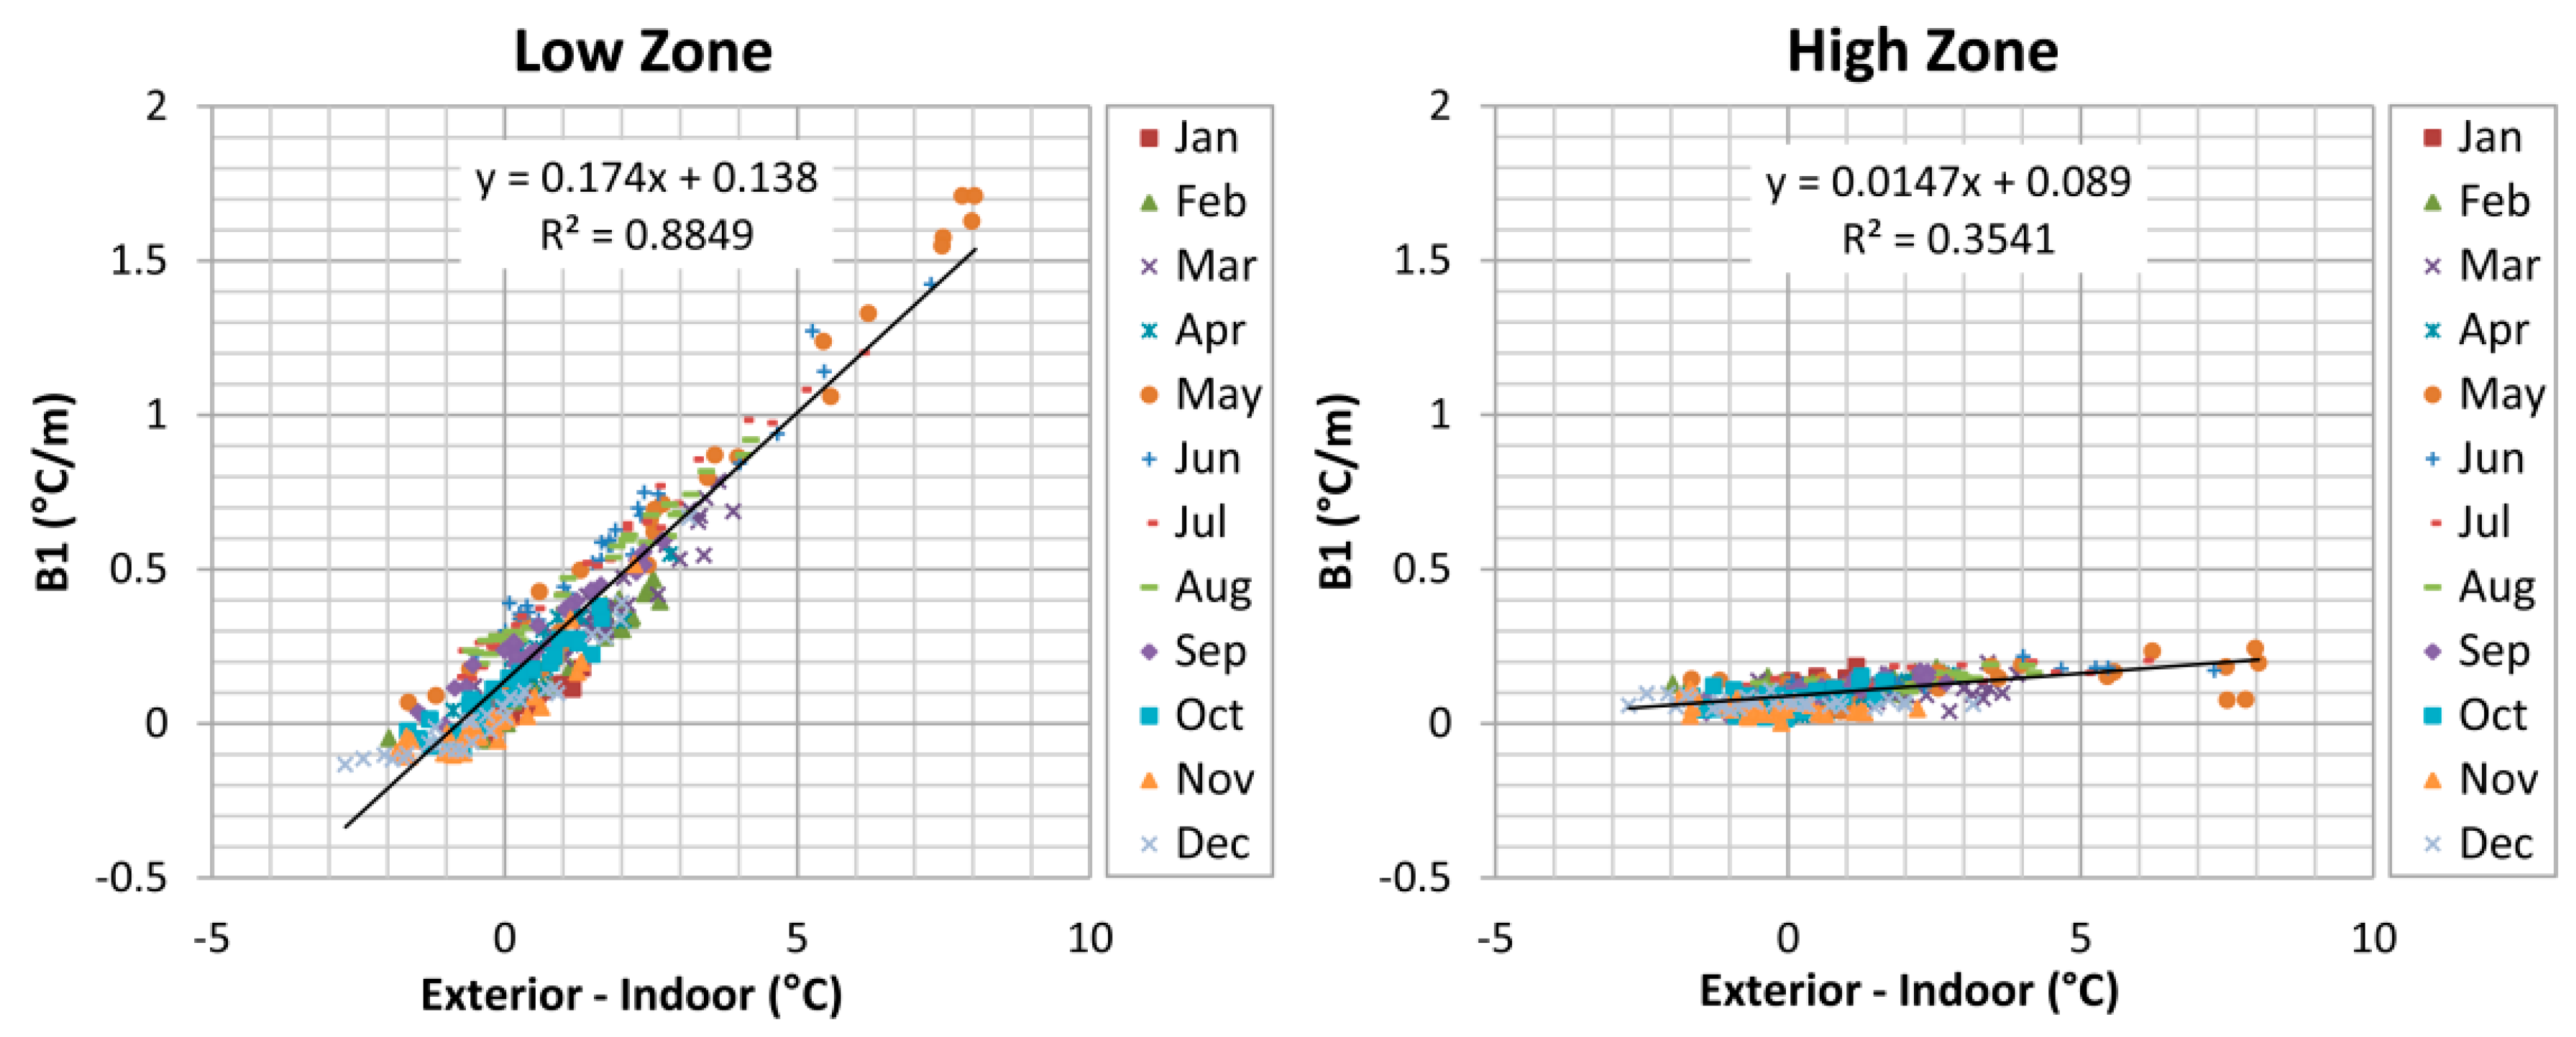
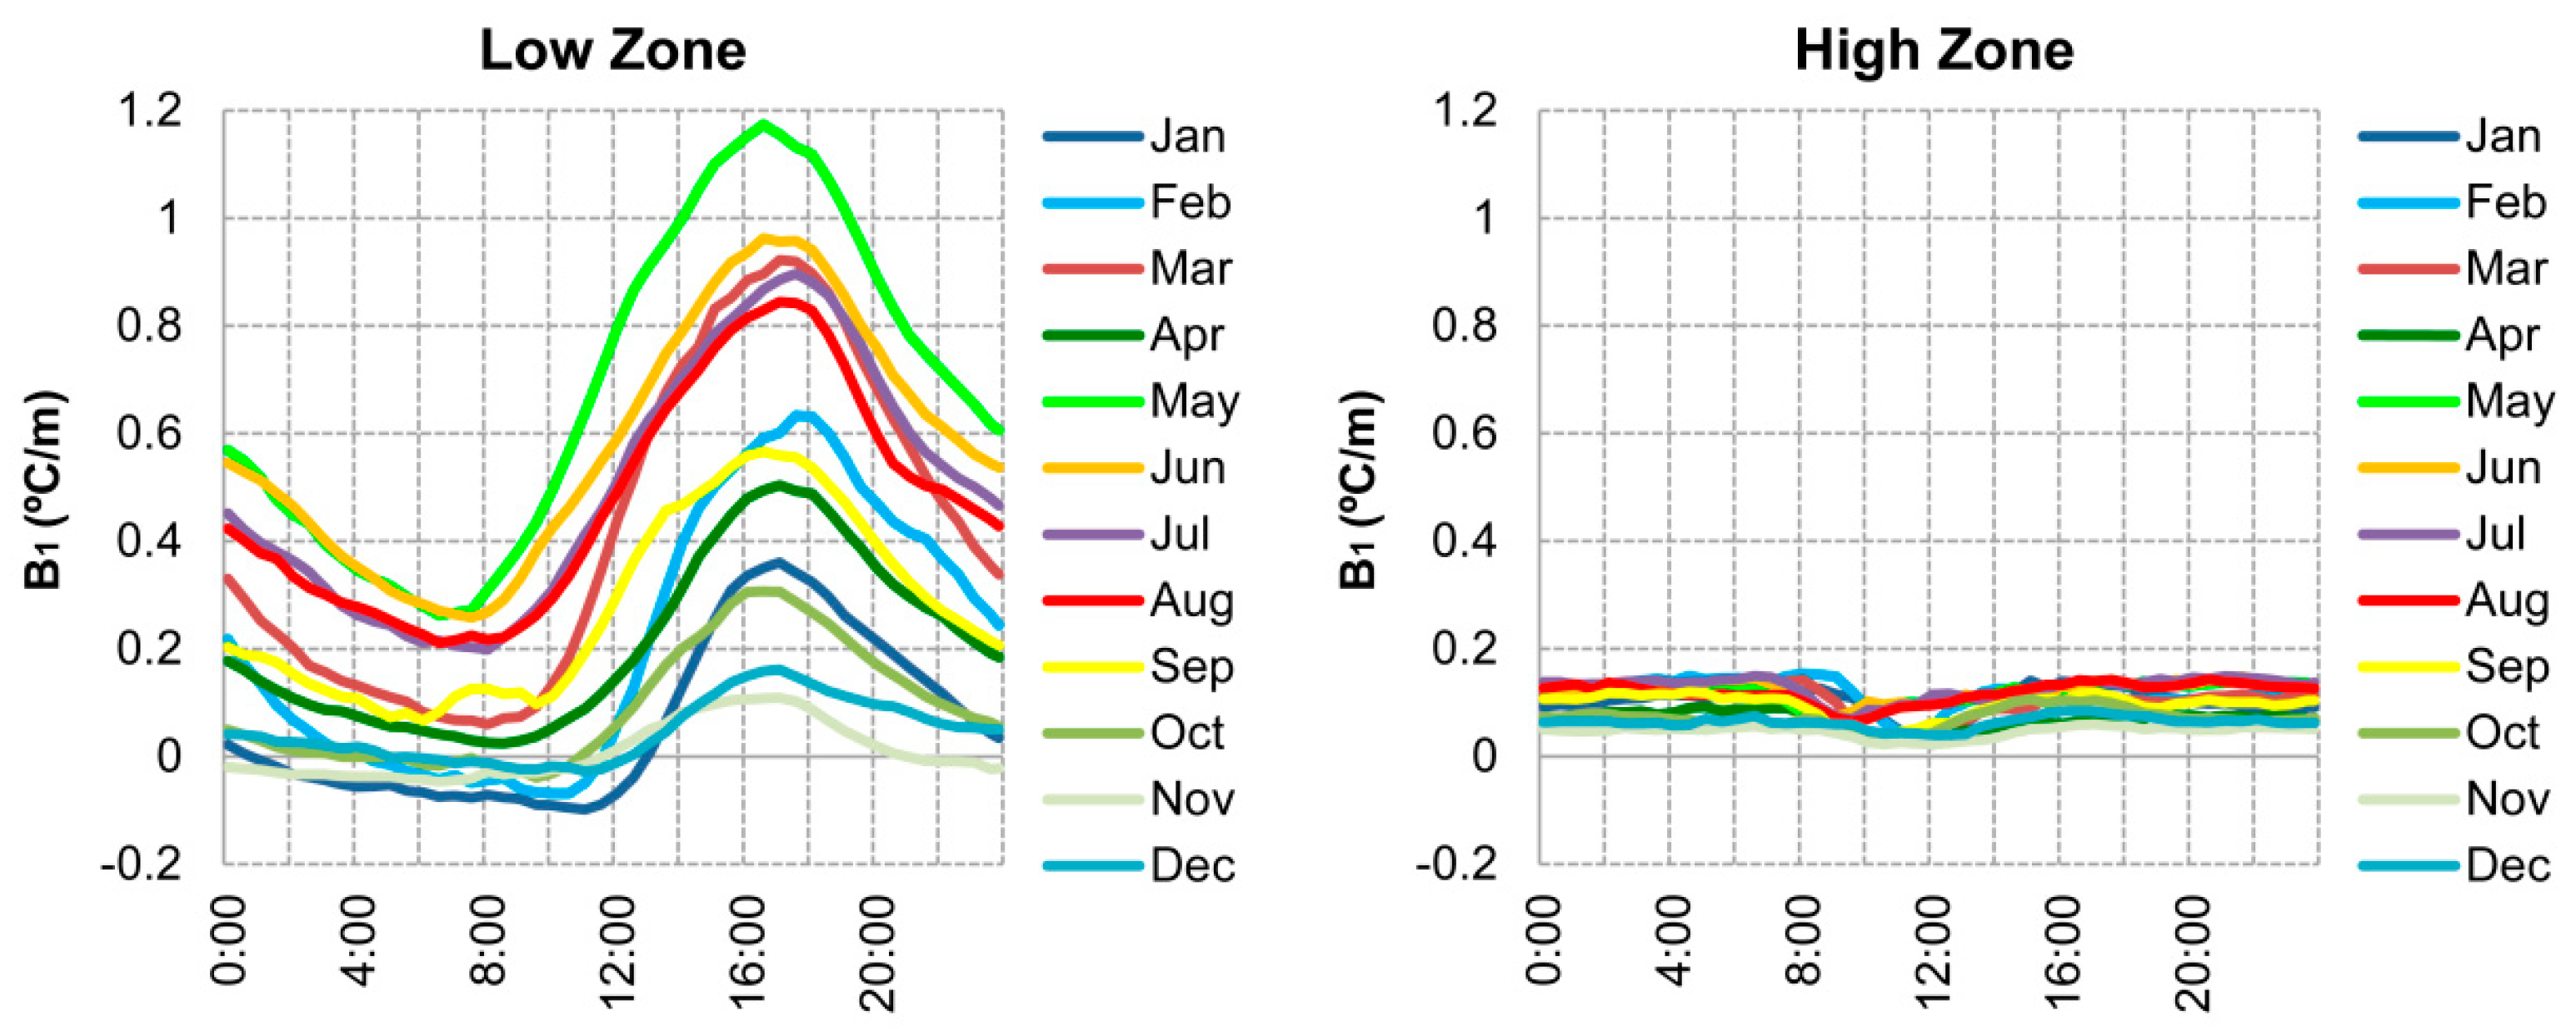
3.3. Statistical Analysis of the Vertical Stratification of the Temperature

To perform a comparative study and quantify the stratification of the temperature throughout the year, a linear regression analysis of the temperature data was carried out. For each height, an average of the data obtained in the different areas of the warehouse was calculated. The area close to the roof was not analyzed due to the impossibility of getting data from the last two meters close to the ceiling. Before the adjustment was performed, it was taken into account that the thermal stratification rupture line seems to be close to the window hole. Therefore, the curve that defines the vertical distribution of temperature was divided into two parts: the lower area (0–4 m) and the higher area (4–8 m). For each of these groups, a simplified model of linear variation was assumed. That approximation was acceptable taking into account the purpose of the study and allowed us to have a standard variable of comparison (the gradient of the line of stratification), solving the problem of the change of curvature.
Linear regression analysis was carried out for each of the 35,136 instants in which the temperature profile was monitored in the different areas of the building (A, C, E). The model relates the difference of temperature with respect to the spot closest to the ground (dependent variable) with height (independent variable). The slope of the straight line obtained in the (β1) represents the °C of variation for each meter of height. The monthly average of the analysis carried out is shown in Table 2. In the high area, the adjustment of the model was very good for all months, with values of R2 between 0.89 and 0.97. In the low area, the adjustment was equally good in the warmer months. In the coldest months, the existing reduced temperature differences created a slightly worse adjustment, although they were also associated with very little estimation errors, lower than 0.07 °C/m.
The variable standard of comparison (coefficient β1) represents an average value and allows comparisons to be made between different periods and heights, not reflecting the variations that occur on a day. From the analysis, it can be concluded that the stratification of the temperature in the lower part of the building was higher than that in the higher area most of the year, being particularly noticeable in the hottest months. In the lower area, monthly average values of up to 0.68 °C/m were reached, while in the higher area, the values were lower than 0.15 °C/m. Performing an analysis of the variation of the stratification values (β1) for the entire period, it can be concluded that there was a statistically significant difference (p = 0.0000 of the F-test) between the stratification of the higher strata and the lower strata at the 95% confidence level. The analysis reinforced the hypothesis of the existence of two differentiated areas inside the building, which were separated at a height close to the line where the window openings of the façade start.
In the lower part of the warehouse, the values of β1 in the warm months were much higher than those obtained in the cold months. Analyzing the values of β1 against the differences in temperature between the interior (a more stable area, close to the floor) and the exterior, a clear relationship could be observed between the increase in the outdoor temperature and the stratification of the lower area (Figure 7). Thus, the mechanism of protection against high temperatures was based on an accumulation of cold air in the lower area protected from daily changes by the thick external walls (thermal inertia), where a lower temperature of the floor and the evaporative cooling by regular watering kept the air cooler than in the upper layers. In this way, the shorter the distance to the floor, the cooler the air and the more protected the wine against sudden increases in temperature.
On the contrary, in the upper area, the average values of β1 were small when the temperatures were high, registering a much reduced increase with increasing outdoor temperature. The temperature in this area presents small differences along several meters, except for the area close to the roof, where the temperature tended to increase due to heating. Taking into account that the temperature in the upper area presented values and variations similar to that of the outdoor temperature, the few differences in several meters could be due to homogenization of the hot air produced by the infiltrations of outdoor air through the window and round openings. Therefore, the combination of the high height of the warehouse and the large ventilation holes reduced the high temperatures of the roof, thus protecting the wine from heat.
Differences between the lower area and the higher area were small during the coldest months; with an average β1 monthly lower than 0.1 °C/m. The stratification values were very small, and very similar temperatures were registered in the whole profile. The coldest roof temperature, detected by thermography (Figure 4), explained this phenomenon, since it cooled the air in the upper strata, with the consequent descent to the lower strata homogenizing the air.
The monthly stratification analysis reflected the evolution throughout the year, but it did not reflect the variations experienced throughout the day. Analyzing the variations of the β1 along the day, a differential daily behavior can be observed between the lower area and the upper area (Figure 8). In the stratification lower area, the variations throughout the day were noticeable, increasing as the outdoor temperature increased, from sunrise to the daily maximum between 16:00 and 18:00. From that moment on, they decreased to the minimum values right before sunrise, when the outdoor temperature also reached its minimum.
The biggest differences along the day occurred in the hottest months, and the smallest ones in the coldest months. Maximum values of all year (1.2 °C/m monthly average) were obtained in May, since the effect of a large increase in outdoor temperature was combined with a cooler ground temperature in the summer months, confirmed by a minimum value close to 0.3 °C/m. As the cold months began to settle, the floor became cooler, and stratification tended to disappear at night (Figure 8). It was confirmed that annual behavior was reproduced daily, conditioned by variations in outdoor temperature and floor temperature.
In contrast, in the upper part, there was little difference in stratification throughout the day, independent of the temperature of the outdoors and the time of year. Values remain relatively constant throughout the days and months, between 0.1 and 0.2 °C/m. It was confirmed that in this area, there was constant homogenization of the air, breaking the stratification of the air. Although the differences of temperature between the different spots were steady, the temperature of each one experienced higher variations along the day than in the lower area, being an area with large variations of temperature and higher temperatures.

4. Conclusions

Experimental measurements showed strong gradients in the vertical distribution of temperature, this being a key aspect of the general behavior of the indoor environment of the construction. The methodology developed from statistical procedures allowed one to establish a standard comparison variable (coefficient β1) to assess the monthly and daily behavior of indoor thermal stratification. The methodology could be useful to others who wish to conduct long-term studies of the thermal stratification of air inside high-rise buildings, such as the cathedral warehouses for Sherry wines. The large amount of data processed (over one million) allowed us to evaluate and characterize the thermal behavior of the warehouse during the year.
In addition, this research revealed the unknown indoor behavior of the cathedral warehouse for Sherry wines. The results indicated that the indoor environment was conditioned by a combination of elements in the building design, among which one must point out the great indoor height, the windows, and the ventilation round openings located at a high position, the sand floor, and thick exterior walls. The combination of all these elements favored the creation of two areas with different thermal behavior, which were a lower area more protected and more stable where the wine is placed and an upper one with higher temperatures and bigger daily variations. The differences between the lower area and the area close to the roof may go over 10 °C in the summer months. In the lower part of the warehouse, the stratification values in the warm months were much higher than those obtained in the cold months. Monthly average stratification values of up to 0.68 °C/m were reached, reaching 1.2 °C/m at the central hours of the day. This phenomenon demonstrated that the mechanism of protection against high temperatures was based on accumulation of cold air in the lower area protected from daily changes by the thick external walls, where a lower temperature of the floor and evaporative cooling by regular watering kept the air cooler than in the upper layers.
In the upper part, the combination of the great height and the ventilation holes managed to isolate the roof and its high temperatures from the lower part. For that reason, the wines are piled up, placing those of higher quality and age closer to the floor.
The results showed the efficacy of the design of these constructions to mitigate the high temperatures typical of a Mediterranean-Oceanic climate and to avoid their damaging effects, providing special thermal conditions for the aging of these unique wine products. The study analyzes and verifies the effectiveness of combining great heights and upper ventilation openings to diminish the increase in temperature and exterior radiation. The passive design of the cathedral warehouse provides the right thermal conditions for the chemical and biological processes that take place in the aging of Sherry wines, which could not be reproduced by air conditioning systems. This example of ingenuity in passive design demonstrates the potential of passive design strategies in the industrial sector, which are feasible for achieving controlled environmental conditions without any energy consumption.
Studies like this are necessary to generate more specific scientific information that engineers and architects can use for designing the indoor environment in high-rise warehouses. Future research can be conducted to develop more complex models with external weather data as an input and explore the benefits of passive technologies in different climatic regions.

Author Contributions

Conceptualization, E.G.N.-O. and I.C.; methodology, F.R.M. and C.P.-A.; software, E.G.N.-O. and C.P.-A.; formal analysis, F.R.M. and I.C.; investigation, E.G.N.-O., F.R.M., C.P.-A. and I.C.; resources, I.C.; data management, E.G.N.-O., F.R.M. and C.P.-A.; writing—original draft preparation, E.G.N.-O. and C.P.-A.; writing—review and editing, F.R.M. and I.C.; visualization, E.G.N.-O. and I.C.; supervision, F.R.M. and C.P.-A.; project administration, F.R.M. and C.P.-A.; funding acquisition, I.C. All authors have read and agreed to the published version of the manuscript.

Funding

This research was funded by the Spanish Ministry of Economy and Competitiveness, grant number BIA2014-54291-R.

Institutional Review Board Statement

Not applicable.

Informed Consent Statement

Informed consent was obtained from all subjects involved in the study.

Data Availability Statement

Data available on request due to restrictions of privacy. The data presented in this study are available on request from the corresponding author. The data are not publicly available due to privacy. Please contact corresponding author before use.

Acknowledgments

This research has been possible thanks to the research team and companies which have participate in the BIA 2014-54291-R research project.

Conflicts of Interest

The authors declare no conflict of interest.

References

  1. Rodriguez-Ubinas, E.; Montero, C.; Porteros, M.; Vega, S.; Navarro, I.; Castillo-Cagigal, M.; Matallanas, E.; Gutiérrez, A. Passive design strategies and performance of Net Energy Plus Houses. Energy Build. 2014, 83, 10–22. [Google Scholar] [CrossRef] [Green Version]
  2. EIA. International Energy Outlook 2011; Tech. Rep. DOE/EIA-0484; Administration, E.I., Ed.; Center for Strategic and International Studies: Washington, DC, USA, 2011. [Google Scholar]
  3. Akbari, H.; Sezgen, O. Analysis of energy use in building services of the industrial sector in California: Two case studies. Energy Build. 1992, 19, 133–141. [Google Scholar] [CrossRef] [Green Version]
  4. Filippín, C.; Flores Larsen, S.; Beascochea, A.; Lesino, G. Response of conventional and energy-saving buildings to design and human dependent factors. Sol. Energy 2005, 78, 455–470. [Google Scholar] [CrossRef]
  5. Lam, J.C.; Yang, L.; Liu, J. Development of passive design zones in China using bioclimatic approach. Energy Convers. Manag. 2006, 47, 746–762. [Google Scholar] [CrossRef]
  6. Eshraghi, J.; Narjabadifam, N.; Mirkhani, N.; Sadoughi Khosroshahi, S.; Ashjaee, M. A comprehensive feasibility study of applying solar energy to design a zero energy building for a typical home in Tehran. Energy Build. 2014, 72, 329–339. [Google Scholar] [CrossRef]
  7. Badescu, V.; Laaser, N.; Crutescu, R.; Crutescu, M.; Dobrovicescu, A.; Tsatsaronis, G. Modeling, validation and time-dependent simulation of the first large passive building in Romania. Renew. Energy 2011, 36, 142–157. [Google Scholar] [CrossRef]
  8. Feist, W.; Schnieders, J.; Dorer, V.; Haas, A. Re-inventing air heating: Convenient and comfortable within the frame of the Passive House concept. Energy Build. 2005, 37, 1186–1203. [Google Scholar] [CrossRef]
  9. Wyon, D.; Kok, R.; Lewis, M.I.; Meese, G.B. Effects of moderate cold and heat-stress on factory-workers in Southern-Africa. 1. Introduction to a series of full-scale simulation studies. South Afr. J. Sci. 1982, 78, 184–189. [Google Scholar]
  10. Wyon, D.; Kok, R.; Lewis, M.I.; Meese, G.B. Effects of moderate cold and heat-stress on factory-workers in Southern-Africa. 2: Skill and performance in the cold. South Afr. J. Sci. 1982, 78, 190–197. [Google Scholar]
  11. Kok, R.; Lewis, M.I.; Meese, G.B.; Wyon, D. Effects of moderate cold and heat-stress on factory-workers in Southern-Africa. 3. skill and performance in the heat. South Afr. J. Sci. 1982, 78, 306–314. [Google Scholar]
  12. Lewis, M.I.; Meese, G.B.; Kok, R.; Wentzel, J.D.; Wyon, D. Effects of moderate cold and heat-stress on factory-workers in Southern-Africa. 4. skin temperature oral temperature heart rate and comfort vote. South Afr. J. Sci. 1983, 79, 28–37. [Google Scholar]
  13. Meese, G.B.; Kok, R.; Lewis, M.I. Effects of moderate cold and heat-stress on factory-workers in Southern-Africa. 5. comparison between naive and skilled workers. South Afr. J. Sci. 1984, 80, 517–526. [Google Scholar]
  14. Kok, R.; Lewis, M.I.; Meese, G.B. Effects of moderate cold and heat-stress on factory-workers in Southern-Africa. 6. performance and physiological reactions to increased humidity. South Afr. J. Sci. 1988, 84, 50–63. [Google Scholar]
  15. Kumar, S.; Mathur, A.; Singh, M.K.; Rana, K.B. Adaptive thermal comfort study of workers in a mini-industrial unit during summer and winter season in a tropical country, India. Build. Environ. 2021, 197, 107874. [Google Scholar] [CrossRef]
  16. Ambrosy, l.G.d.B. Las Bodegas Del Vino de Jerez; Agrarias, I.N.d.I., Ed.; Mº Agricultura, Pesca y Alimentación: Madrid, Spain, 1984. [Google Scholar]
  17. Ángeles Pozo-Bayón, M.; Victoria Moreno-Arribes, M. Chapter 2-Sherry Wines. In Advances in Food and Nutrition Research; Ronald, S.J., Ed.; Academic Press: Cambridge, MA, USA, 2011; pp. 17–40. [Google Scholar]
  18. Jackson, R.S. 9-Specific and Distinctive Wine Styles. In Wine Science, 3rd ed.; Jackson, R.S., Ed.; Academic Press: San Diego, CA, USA, 2008; pp. 520–576. [Google Scholar]
  19. Mazarrón, F.R.; Cid-Falceto, J.; Cañas, I. Ground Thermal Inertia for Energy Efficient Building Design: A Case Study on Food Industry. Energies 2012, 5, 227–242. [Google Scholar] [CrossRef]
  20. Mazarrón, F.R.; Cañas, I. Seasonal analysis of the thermal behaviour of traditional underground wine cellars in Spain. Renew. Energy 2009, 34, 2484–2492. [Google Scholar] [CrossRef]
  21. Mazarrón, F.R.; Cid-Falceto, J.; Cañas, I. An assessment of using ground thermal inertia as passive thermal technique in the wine industry around the world. Appl. Therm. Eng. 2012, 33–34, 54–61. [Google Scholar] [CrossRef]
  22. Armstrong, M.; Chihata, B.; MacDonald, R. Cold Weather Destratification Energy Savings of a Warehousing Facility. In Ashrae Transactions 2009, Proceedings of the ASHRAE 2009 Annual Meeting: Louisville, KY, USA, 20–24 June 2009; Volume 115, pp. 513–518.
  23. Mazarrón, F.R.; López-Ocón, E.; Garcimartín, M.A.; Cañas, I. Assessment of basement constructions in the winery industry. Tunn. Undergr. Space Technol. 2013, 35, 200–206. [Google Scholar] [CrossRef]
  24. Porras-Amores, C.; Mazarrón, F.; Cañas, I. Study of the Vertical Distribution of Air Temperature in Warehouses. Energies 2014, 7, 1193–1206. [Google Scholar] [CrossRef] [Green Version]
  25. Richard Glass, C.; Walters, K.F.; Gaskell, P.H.; Lee, Y.C. Recent advances in computational fluid dynamics relevant to the modelling of pesticide flow on leaf surfaces. Pest Manag. Sci. 2010, 66, 2–9. [Google Scholar] [CrossRef] [PubMed]
Figure 1. Research area of the study (left) and annual ambient conditions (right).
Sustainability 14 00563 g001
Figure 2. Elevations and ground floor of the building. Situation of the monitoring spots selected (A, B, C, D and E).
Sustainability 14 00563 g002
Figure 3. Photographs of the studied zero-energy building.
Sustainability 14 00563 g003
Figure 4. Thermal images from inside the building.
Sustainability 14 00563 g004
Figure 5. Indoor air temperature close to the floor and of the roof vs. outdoor temperature.
Sustainability 14 00563 g005
Figure 6. Curves of the vertical stratification of the monthly average temperature in different areas of the warehouse (A, C, E).
Sustainability 14 00563 g006
Figure 7. Stratification of indoor air measured through coefficients β1 with respect to thermal variation between interior and exterior. Daily average values.
Sustainability 14 00563 g007
Figure 8. Stratification of indoor air measured through coefficients β1 along the day.
Sustainability 14 00563 g008
Table 1. Characteristics of the construction system of the walls and roof.
MaterialThickness
(m)
Density
(kg/m3)
Conductivity
(W/m·K)
WallsU-Value: 0.886 W/m2K
Mortar (lime, sand, and water)0.02521001.3
Stone masonry0.60020500.55
Mortar (lime, sand, and water)0.02521001.3
RoofU-Value: 3.125 W/m2K
Ceramic tiles0.040020001.00
Nonventilated air chamber0.1001.2930.50
Mortar (lime, sand, and water)0.02521001.3
Compact cooked clay bricks0.05023000.82
Table 2. Results and coefficients of the linear regression model. Model summary (R square, standard error of the estimation, significance level), unstandardized coefficients (β1, standard error of the estimation, significance level).
Low AreaHigh Area
Model SummaryUnstand.
Coefficient
Model SummaryUnstand.
Coefficient
MonthR2Errβ1ErrR2Errβ1Err
Jan0.740.060.060.020.950.040.110.02
Feb0.880.100.220.040.930.050.130.02
Mar0.980.100.420.040.940.050.110.02
Apr0.920.060.210.020.970.020.070.01
May0.950.180.680.070.930.050.130.02
Jun0.950.190.580.070.950.050.130.02
Jul0.950.160.500.060.950.050.140.02
Aug0.950.150.470.060.940.050.130.02
Sep0.860.120.280.040.940.040.100.02
Oct0.770.050.090.020.940.030.080.01
Nov0.770.050.010.020.890.020.050.01
Dec0.800.070.050.030.940.030.070.01
Publisher’s Note: MDPI stays neutral with regard to jurisdictional claims in published maps and institutional affiliations.

