Abstract
Coal-based thermal power generation has long been the main source of power generation in the mainland of China. The efficiency of power generation is an important factor that determines the energy conservation and emission reduction as well as the sustainable development of the power industry in China. By comparing the regional differences of 30 provinces in the mainland from 2013 to 2017, this study uses the Super-DDF model and the TFEE to comprehensively evaluate the energy efficiency of thermal power generation. Empirical results: Overall efficiency: eastern efficiency (1.181) is the highest, followed by western (0.956), central (0.951) and northeastern (0.926). Total factor energy efficiency: eastern efficiency (0.923) is the highest, followed by western (0.754), central (0.742) and northeastern (0.710). The government and power industry managers should fully consider the regional differences in the field of thermal power generation when formulating policies so as to improve the power efficiency and promote the green development of power industry in China. Based on the analysis results, although the coal-fired power industry is more mature than other alternative energy industries, the expansion of thermal power generation cannot be considered if CO2 emissions are to be reduced. Additionally, the market share and competitiveness of the local power industry can be increased based on the different conditions of the resource endowments of each region.
1. Introduction
In the past few decades, China’s increasing power demand and heavy dependence on coal-fired power generation have resulted in severe air pollution problems not only in China, but also in the neighboring countries, such as Japan and South Korea. Experts call on the Chinese government to take effective environmental protection measures as soon as possible to curb the possible negative effects of air pollution on its environment and its people’s health. With the rapid economic growth, a large number of coal-fired power plants have been built across China in recent years to cope with the power shortage. At present, nearly three-quarters of China’s new power generation capacity comes from thermal power generation, with coal-fired power being the major sources of power generation. Experts point out that the high dependence on coal-fired power generation has meant China’s air pollution problems continue to worsen and may even affect its neighboring countries. The Chinese government must act as soon as possible to reduce the rate of environmental degradation.
Therefore, in 2013, a “Coal Control Plan” was initiated to deal with the problem of environmental pollution in China. The plan requires provinces and cities in key regions of China to reduce coal consumption. In 2014, China and United States proposed a joint statement on climate change which showed China’s determination to improve its environmental problems. Additionally, in the 2015 Paris Agreement, China made a commitment to reaching the reduction target with other countries to jointly undertake the responsibility of climate protection. In 2016, driven by its ambitious green goals and government policies, China aimed to transfer to the renewable energy power generation model from its original coal-fired power generation. However, in 2017, coal consumption in China increased dramatically because three quarters of the electricity demand in China still came from coal industry. Moreover, renewable energy is in its development stage and cannot be used immediately and stably to meet the huge energy demand in China. Although coal consumption in China is reducing, many problems, such as power supply instability, unemployment problem of the workers, coal prices and costs, and thermal power generation efficiency, are all a tug-of-war on environmental protection and economic levels.
This article takes geographical environment factors and energy efficiency into the consideration and provides a set of measurement standards for the power industry in various provinces or regions so as to improve the efficiency and development of energy industry in China. A further analysis of the energy efficiency in China’s eastern, central, northeast, and western provinces is conducted in order to provide a reference for the local governments or power industry managers to achieve higher thermal power generation efficiency and, at the same time reduce carbon emissions. There are huge differences in terms of economy, geographical environment, and natural resources in these four regions. Therefore, the improvement of thermal power generation efficiency and the implementation of policies should be differentiated according to different conditions. Taking into account regional differences, the Super-DDF undesired model is used in this article to help reduce unnecessary waste of energy input and non-energy input in an optimal way and also to reduce the air pollution problem in China.
The contribution of this article is to propose a new VRS Super-DDF model, which is different from the VRS super-efficiency DDF model introduced by scholars in the past. Firstly, this model has more generalized application. Secondly, the input and output excess problem, caused by the estimation bias of the super-efficiency model, has been overcome through the optimal adjustment of the vector. Finally, in Section 3 of the research method, A4 and A5 put forward the monotonicity hypothesis as well as the translation invariance and unit independence through removing the proportional unit. The adoption of this new VRS Super-DDF model can not only solve the problems of the previous DEA model, but also the problems of unintended output and negative data. Furthermore, the use of TFEE in this paper can help analyze the factors that affect energy efficiency, economic development, energy consumption and environmental pollution. Therefore, through proper adjustment of TFEE model, factors that affect energy efficiency can be found to improve air pollution and promote sustainable economic and environmental development.
2. Literature Review
To determine the performance of thermal power plants, their power generation efficiency, operational efficiency, and environmental efficiency should be analyzed. Sozen (2010) [1] used Charnes, Cooper, and Rhodes (CCR) [2] and Banker, Charnes, and Cooper (BCC) [3] models to analyze the power generation efficiency of 11 lignite power plants, one hard-coal-fired power plant, and three gas-fired power plants in Turkey. Eguchi et al. (2020) [4] used data envelopment analysis (DEA) to explore the changes in the power generation efficiency of China’s thermal power industry from 2009 to 2011 and showed that the efficiency of large-scale power plants exceeds small-scale power plants 13%.The best operating performance of China’s power plants is the central power plant, followed by the eastern power plant, and the worst is the western power plant, was mainly caused by the gap between the coal quality and power plant equipment technology. Bi et al. (2014) [5] used DEA to explore the performance of China’s power industry from 2007 to 2009 and showed that controlling pollutant emissions can effectively improve the energy and environmental efficiency. However, The efficiency of energy and environment in China is not as expected. These differences are due to the gap between the geographical environment and the distribution of economic resources.
To reduce energy consumption, carbon emissions, and environmental impacts, the Chinese government has formulated several laws and regulations. Peng et al. (2018) [6] analyzed the efficiency of power plants from the perspective of tax systems and laws and used the marginal cost model to explore the scientific and technological efficiency of thermal power plants in 30 administrative regions in China from 2004 to 2013. They showed that the thermal power industry accounts for 4.49% of the total output, of which the weighted average marginal cost of CO2 emissions reduction is 316.51 yuan/ton, which is higher than the carbon price of the pilot project of the current emissions trading system, and the marginal cost of carbon reduction is positively related to the regional power scale. Wang et al. (2018) [7], using DEA to explore the impact of raising the pollution tax on China’s power generation industry, showed that improving scientific and technological efficiency can reduce energy input and SO2 emissions. However, in the short term, China’s thermal power industry pursues cost efficiency rather than ecological efficiency, and there is no significant difference in SO2 emissions due to the relatively low pollution tax rate. An and Zhai (2020) [8], used DEA to explore carbon tax pricing in thermal power generation from 1997 to 2018 and showed that while overall power demand will continue to grow in 2020, the implementation of the increasing block carbon tax policy is conducive to achieving the dual goals of reducing costs and carbon emissions of China’s thermal power industry. Chen and Jin (2020) [9], using DEA to explore the impact of environmental regulations on the productivity of the thermal power industry at the provincial level from 2009 to 2016, showed that the average marginal cost of CO2 emissions reduction in the thermal power industry was 595.32 yuan/ton, which is higher than the carbon price of the current trading system. They also suggested using different methods to achieve the expected regulatory level.
Duan et al. (2016) [10] used DEA to explore the thermal power generation and CO2 emission efficiency in 30 administrative regions in China from 2005 to 2012 and showed that technological progress was the main driving force for improving the energy efficiency and efficiency of CO2 emissions. Malmquist productivity index of many provinces showed a downward trend from 2007 to 2008; therefore, there should be a balance between the protection of the power supply system and energy conservation and emission reduction targets. Liu (2017) [11] used DEA, Malmquist productivity index, and regression analysis to explore the total factor efficiency of China’s thermal power industry from 2005 to 2014 and found that the technological progress index and scale efficiency index primarily affected the total-factor energy efficiency (TFEE) of the thermal power industry, and effective control of coal combustion aided in improving energy efficiency. Using the Tobit model, Qin et al. (2020) [12] discussed the separation of environmental efficiency and market area of the thermal power industry and showed that the thermal power industry and in China is facing the problem of market-oriented reform, and the differences between the developed and underdeveloped areas of the Three Gorges increase, although the cost of thermal power generation is lower than that of renewable energy. Lima F et al. (2017) [13] and Wang H et al. (2018) [14] Take to the Logarithmic Mean Divisia Index (LMDI) decomposition method analyzes the relationship between energy consumption and CO2 emissions through data from different countries or regions, and discusses that the level of technology and energy efficiency play an important role in saving energy consumption and coal emissions. However, in order to formulate energy saving and carbon reduction, it is necessary to tailor policies in accordance with the local economic and cultural aspects, so as to more accurately discuss the differences in energy efficiency and technology brought about by different regional levels.
There are many measures of power plant performance, such as carbon efficiency, technical efficiency, and production efficiency calculated using DEA, but there is no detailed analysis of the factors affecting power plant efficiency. Therefore, this study aims to apply super-efficiency directional distance function (DDF) to explore the efficiency of thermal power plants in 30 provinces of China from 2013 to 2017 and to analyze the impact of TFEE on the efficiency of thermal power plants, and proposes recommendations for policy makers. During the implementation of the “Twelfth Five-Year Plan” period in Mainland China, the main energy supply is still fossil energy such as coal and oil. Therefore, in accordance with the plan of “Controlling the East, Stabilizing the Central Region, and Developing the West”, 14 large coal bases can be promoted more smoothly Construction. In the energy regional development strategy model, the principle of “speeding up the western region, stabilizing the central region, and optimizing the eastern region” is adopted to promote energy development plans in the eastern, central and western regions. From the standpoint of energy, economy, and national defense and security, mainland China has the east as the main core, and then promotes other regions. Therefore, this article further explores through the verification whether the efficiency of the east is due to the implementation of policies, compared with Other areas have higher efficiency values.
Hypothesis 1.
Average energy efficiency of eastern China is higher than that of other regions.
Hypothesis 2.
Average TFEE of eastern China is higher than that in other regions.
3. Research Methods
3.1. Super-Efficiency DDF Model
For decades, Färe (1996) [15], because of the Directional Distance Function (DDF), when measuring efficiency and establishing a model, Chen (2018) [16] can consider the adjustment ratio of input and output at the same time. Therefore, many scholars have begun to use it. Moreover, DDF may be more comprehensive in ranking than the input-oriented and output-oriented DEA models. Later, Ray (2008) [17] proposed that under the assumption of vrs technology, under the DDF, the Nerlove-Luenberger (N-L) super-efficiency model was established. However, this model has two shortcomings (1) may be due to poor output, to change the target formula (2) because of the above situation, some DMU can not be estimated. Therefore, Chen et al. (2013) [18] gave the direction vector of DDF in advance, and got the modified VRS super-efficiency model. Lin and Chen (2015) pointed out that the model of Chen et al. (2013) [18] would be limited to negative output targets and only applicable to positive variables. Portela (2004) [19] and Esmaeilzadeh (2013) [20] proposed super RDM + model and super RDM − model, respectively, but when the selected DMU is the maximum or minimum output when measuring efficiency, it is not applicable. Lin and Chen (2015) [21] An improved super-efficiency model was proposed. At first, there was an appropriate reference set based on DDF, but it only solved mathematical problems. Later, Lin and Chen (2015) [21] proposed a super-efficiency DDF model with negative input. The direction vector parameters cannot be changed. Song (2019) [22] will cause distortion of efficiency evaluation. Wei et.al (2019) [23] solves the infeasibility problem of the traditional DDF-based VRS super-efficiency model and discusses how to use it in DDF Choose a suitable direction vector to make the VRS super-efficiency model based on DDF have general conditions.
3.2. VRS Supper Efficiency Model Based on DDF
Suppose there are n DMUs, we use (j = 1, 2,…, n) to represent the j-th DMU, where the i-th input is expressed as (i = 1, 2,…, k), and the r-th output is expressed as (r = 1, 2,…, m), which is not out of generality. Assume that there is at least one input. , such that:
We assume that there is at least one output, , such that {}{}. The production possibility set indicates that the convexity axiom and inefficiency axiom must be satisfied. For the (H) to be evaluated, the super-efficiency possibility set of VRS is defined as follows:
For h , the input-output set of to be evaluated, assuming a group of direction vectors ), the DDF on T can be expressed as follows:
The DDF is a set of nonnegative and nonzero vectors that can be selected arbitrarily. To establish a more general super-efficiency model, the direction vector was set as follows:
Next, the following direction distance function is obtained:
According to the DDF, the following models were established to evaluate the super efficiency:
Max
Given a directional vector if inequality (11) and conditions (a) and (b) are satisfied simultaneously, then the corresponding VRS Super-DDF model always has feasible solutions.
- (a)
- if and cannot exist simultaneously at any time , , i = 1, 2,…, k
- (b)
- = 2 *max { and = 0 cannot exist simultaneously at any time, r =
where whether it is a good output or an undesired output, the absolute value guarantees the positive value.
- A1.) = 1 − D ,), Where D is DDF,
- A2. T-indication:
- A3. Translation:
- A4. Input Monotonicity: , ))
- A5. Output Monotonicity: ))
3.3. TFEE Methodology
TFEE index is useful and necessary to exist. TFEE can understand from different perspectives that changes in energy efficiency are caused by economic, social or environmental factors. The implementation of energy-saving and carbon-reduction policies will have the right medicine to drive the goal of sustainable development of energy, economy and environment Hu and Wang (2006) [24] introduced the TFEE index to solve the traditional deviations in the use of energy efficiency indicators. TFEE has the following three characteristics: First, TFEE can deal with multiple inputs and outputs, which implies that it is considered framework of the total element. Second, TFEE can be readjusted on certain amount of traditional energy efficiency which ranging from 0 to 1, according to efficiency-front at each stage. Third, the target energy input can be measured, which is more meaningful for policy makers. Then, based on the theory of Hu and Wang (2006) [24], we go further following Faré and Grosskopf (2004) [25] to advance more generally method of Chung et al. (1997) [26] to solve the linear programming (LP) problem. In fact, the directional distance function (DDF) not only enables us to expand the good output, but also reduces the bad output to achieve efficiency improvements. Suppose, we focus on output orientation, for example: total factor bad output efficiency. Therefore, we must use the direction distance function to calculation. In terms of energy efficiency, relative to the input-oriented distance function, the efficiency score of the h-th DMU can be solved by the following optimization problem:
The TFEE model is set as follows:
St.
where e denotes energy input, denotes the directional vector for energy input, denote Super-DDF efficiency, is input of other DMU, is input of , is output of , and is output of other DMU. On one hand, if we take = , the optimal solution, , can be interpreted as the proportional contraction in energy to stand onto the efficient frontier. On the other hand, if we take = 1, , would be denoted the number of decreases in energy input, i.e., total energy slack.
Therefore, for example, we set = and then the DDF-type TFEE can be represented as the following equation:
4. Empirical Analysis
The data used in this study were obtained from the China Labor Statistical Yearbook, the China Energy Statistical Yearbook, the China Power Yearbook, and CEADs Database. Considering the regional differences, the empirical study in this paper is conducted in accordance with the general data of 30 provinces in China. The data sample included the thermal power industry of each province and we excluded Tibet, Hongkong, Taiwan, and Macao from the sample. Taking the availability and statistical consistency of the data into account, this article used the data from 2013 to 2017 because this period happened to be in middle of China’s 12–5 plan and 13–5 plan. We would like to compare the energy efficiency performance of thermal power generation during these two plan periods through different policy implementations so as to analyze whether different provinces have different existing resource endowments. First, we compared the energy efficiency of provinces with different natural and social resources. The analysis sample was divided into eastern, central, western and northeastern regions (Figure 1). The eastern region includes Beijing, Tianjin, Hebei, Shanghai, Jiangsu, Zhejiang, Fujian, Shandong, Guangdong and Hainan. The central region includes Shanxi, Anhui, Jiangxi, Henan, Hubei, and Hunan. The western region includes Inner Mongolia, Guangxi, Shaanxi, Chongqing, Sichuan, Guizhou, Yunnan, Qinghai. Additionally, northeastern region includes Liaoning, Jilin and Heilongjiang.
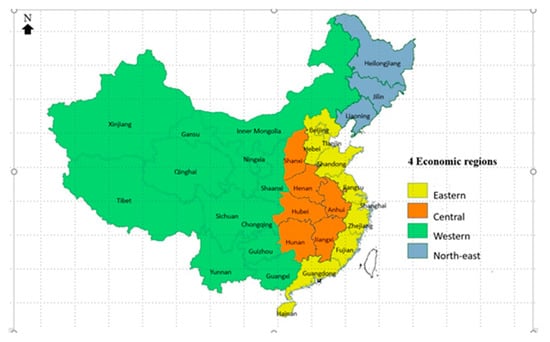
Figure 1.
Map source drawing of this study.
4.1. Data and Indicators
Selecting suitable variables is very important for measuring energy efficiency since the DEA model measures the relationship between input variables and output variables. This study uses the SUPER_DDF model, labor, energy consumption, installed capacity and auxiliary power consumption as input and power generation, GDP supported by power and CO2 emissions as output (Table 1).

Table 1.
Variables and Data source.
4.2. Descriptive Statistics
In Appendix A are the descriptive statistics of four regions and cities in China from 2013 to 2017. According to the table, the largest labor force population belongs to the northeastern region of 2013, and the minimum labor force occurs in the west region of 2017. The maximum value of labor force is observed in Guangdong of 2013, and the minimum value is in Hainan of 2017. The maximum energy consumption occurs in the eastern region of 2017, and the minimum energy consumption occurs in the western region of 2013. The maximum value of energy consumption is observed in Shandong in 2016, and the minimum value is in Hainan in 2013. The maximum installed capacity occurs in the eastern region of 2017, and the minimum installed capacity occurs in the western region of 2013. The maximum auxiliary power consumption occurs in the eastern region of 2017, and the minimum auxiliary power consumption occurs in the northeastern region of 2013. The maximum power generation occurs in the eastern region of 2017, and the minimum power generation occurs in the western region of 2014. The maximum value of power generation is observed in Shandong in 2016, and the minimum value is in in Qinghai 2015. The maximum GDP supported by power occurs in the eastern region of 2017, and the minimum data occurs in the western region of 2013. The maximum value of GDP supported by power is in Shandong in 2016, and the minimum value is in Qinghai in 2015. The maximum CO2 emission occurs in the eastern region of 2014 and the minimum data occurs in the western region of 2015.
Figure 2 shows the changes in input and output variables from 2013 to 2017. This study preliminarily judges the efficiency of thermal power generation in the future based on the trends of the average data. According to the graph, we can clearly see the trends of the input variables. The labor force is decreasing year by year, and the installed capacity, auxiliary power consumption and energy consumption are increasing by years. As for the output variables, the GDP supported by power has shown a rapid upward trend year by year. Carbon emissions and power generation were abnormal in 2014. Carbon emissions have been significantly higher while power generation reduces sharply. Economic growth, price of coal and other fossil fuels as well as technology related problems may have caused this situation. Because excessive carbon dioxide emission will cause severe air pollution, China begun to use clean energy to replace petrochemical energy and further used other alternative renewable energy sources to slow down the deterioration of the environment. Additionally, in 2014, China built 22 gigawatts of hydroelectric power, 21 gigawatts of wind power, 11 gigawatts of solar power, and more than 5 gigawatts of nuclear power.
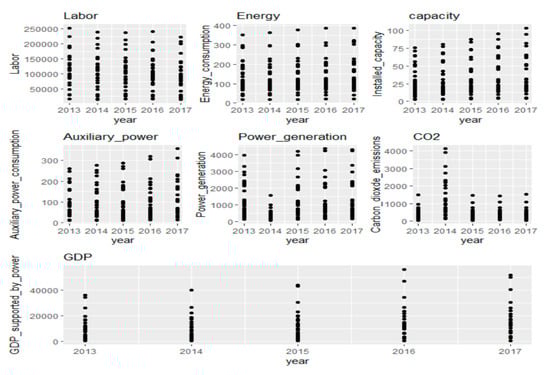
Figure 2.
Variations in variables from 2013 to 2017 graphed from this study.
5. Results
5.1. Super-Efficiency DDF
In order to measure the efficiency of thermal power generation, this paper takes the coal thermal power generation industry from 2013 to 2017 as the research object and uses the Super-DDF model to calculate the efficiency value.
Table 2 shows the efficiency values of four different regions in China. The average efficiency of China’s thermal power generation industry is 1.0040. Among the four regions, the eastern region has the highest average panel efficiency (1.1810), followed by the western region (0.9560) and the central region (0.9510), and the northeastern region (0.9260). We see that China’s annual average overall efficiency is showing a downward trend. Among all regions, the western region has decreased the most in its annual average efficiency value, reaching 0.0850. The annual average efficiency value of the eastern region changed the least during the study period. With continuous reforms and opening-up policy, the focus of China’s economic development has gradually shifted to the eastern region, owing to its superior geographical location. China has gradually readjusted its industrial structure and reduced the proportion of high energy consuming secondary industry, while vigorously developing the tertiary industry. Although coal-fired power plants have relatively low energy efficiency, advanced technologies can be used to improve their efficiency. The western region is rich in mineral resources, but its economic foundation is weak, and production technology is relatively immature. Many problems, such as the waste of resources, are still hindering the development of western regions. However, Qinghai and Ningxia are short of heavy industry and large-scale energy-consuming enterprises, which means that they have superior environmental quality and can contribute to the overall energy utilization efficiency in the western region. Although the central region has a large population and is considered to be the main agricultural production base of China, government investment in this region is relatively low and technology level is relatively low, which leads to the waste of valuable energy resources. Northeastern China is historically an important industrial base. From the early days of the People’s Republic of China to the 1990s, northeastern China’s industrial base has been fueling China’s economic development. The energy resource endowment of northeastern China is characterized by the “two less and four more” concept, i.e., less coal and natural gas, more oil, biomass, wind energy, and solar energy resources. The long-term heavy industry development finally leads to high energy consumption and high pollution. Consequently, the proportion of coal and oil consumption in northeastern China is far higher than that of the entire country, and energy utilization efficiency is relatively low.
Table 2.
Super-efficiency DDF of thermal power plants in 30 provinces of China.
At the provincial and city level, although the energy efficiency of China’s thermal power industry showed a slightly downward trend from 2013 to 2017 and dropped to its lowest level of 0.9890 in 2016, the overall level was 1.004, which indicates an efficient use of energy. The efficiency values of 10 provinces and cities are greater than 1, and among them are the following: Beijing, Tianjin, Shanghai, Jiangsu, Shandong, and Hainan in the east; Anhui in the central region; Inner Mongolia, Qinghai, and Ningxia in the western region. Hainan (2.1130), Qinghai (1.4110), and Jiangsu (1.2460) have the highest energy utilization levels. Among the 20 provinces and cities with low energy efficiency, Yunnan (0.8130), Guangxi (0.8150) and Sichuan (0.8170) in the western China region showed the poorest performance. The provinces that showed a slightly declining trend in national energy efficiency include Heilongjiang in northeastern China and Tianjin, Zhejiang, Fujian, Shandong, Guangdong and Hainan in eastern China; Shanxi, Henan and Hebei in central China; Guizhou, Yunnan, Shaanxi, Gansu and Hainan in the western China; Qinghai and Ningxia Autonomous Region in central China. Among them, three provinces that showed the largest decline were Qinghai (42.5%), Guangxi (18.6%), and Heilongjiang (9.4%). Other provinces and cities with a gradual trend of energy efficiency improvement include the following: the Liaoning and Jilin provinces in the eastern region; the cities of Beijing, Hebei, Shanghai, and Jiangsu in the eastern region; Anhui, Jiangxi, and Hunan provinces in the central region; Sichuan province in the western region. The provinces with the largest growth trend include Sichuan in the western region (11.2%), Jiangxi in the central region (8.9%), and Jiangsu in the eastern region (12.2%). In Sichuan province, carbon efficiency has been improved and the GDP output value has substantially increased. Moreover, the allocation of input and output and the performance of the efficiency value have improved every year in Jiangxi.
5.2. TFEE Results
To determine the factors influencing the efficiency of the thermal power industry in four regions and 30 provinces and cities from 2013 to 2017, we used the TFEE to measure the efficiency of thermal power industry in terms of inputs and outputs (Table 3 and Figure 3).
Table 3.
TFEE of thermal power plants in 30 provinces/cities in China.
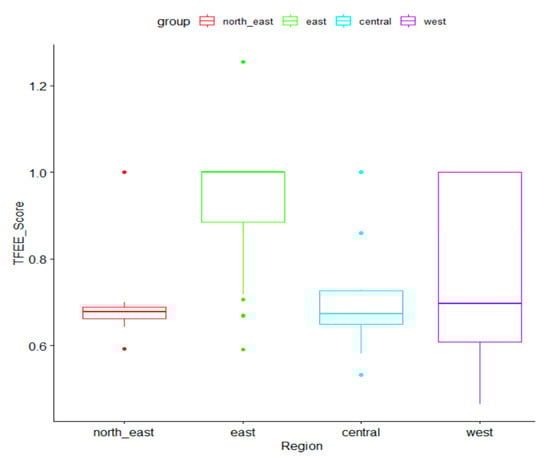
Figure 3.
TFEE verification results. Data source: this study was organized.
5.2.1. Regional Level
The average panel TFEE in the eastern, central, western, and northeastern regions are 0.9230, 0.7537, 0.7415 and 0.7103, respectively, indicating that the thermal power industry in the eastern region is the most efficient in terms of factor allocation and utilization (Table 3). This result is consistent with the efficiency value of the peer DDF. The regional distribution of the efficiency of input factors shows that the eastern region has the highest energy efficiency, followed by the central, western, and northeastern regions. The eastern region has the highest energy consumption efficiency, followed by the central, northeastern, and western regions. The eastern region has the highest efficiency of installed capacity, followed by the central, northeastern, and western regions. The eastern region has the highest auxiliary power consumption efficiency, followed by the northeastern, central, and western regions. Among the output factors, the efficiency of CO2 emissions is the highest in the eastern region, followed by the western, central, and northeastern regions. The eastern region has the highest power generation efficiency, followed by the central, western, and northeastern regions. The eastern region has the highest efficiency of GDP supported by power, followed by the northeastern, central, and western regions.
The Kruskal–Wallis test was applied in this study, and the empirical results are consistent with the first hypothesis of this study (Figure 3). Based on the assumption that TFEE is equal to the median efficiency of each region, because the chi-square test statistic value is 44.493 > , the null hypothesis is rejected, indicating differences among the four regions. Further, the pairwise Wilcoxon rank sum test was conducted, and the results show that at p_value = 3.5 × 10⁻⁷ < 0.05, (west, east) exhibits the most significant difference, followed by p_value = 3.1 × 10⁻⁶ < 0.05, (east, northeast); p_value = 2.3 × 10⁻⁶ < 0.05, (east, middle) is also significant, but there is no significant difference in other areas. In conclusion, there are substantial regional differences in energy efficiency in China’s thermal power industry, and the eastern region is significantly different from the other three regions with the highest efficiency in all factors.
5.2.2. Provincial Level
The average TFEE of the thermal power industry in 30 provinces and cities of China is 0.8014 (Table 3). Ten provinces and cities have a factor efficiency value of 1, namely Beijing, Tianjin, Inner Mongolia, Shanghai, Jiangsu, Anhui, Shandong, Hainan, Qinghai, and Ningxia. They are more efficient in factor allocation than other provinces and cities. Sichuan (0.5213), Yunnan (0.5245), and Guangxi (0.6199) have the lowest average factor efficiency and the efficiency of each factor is lower than the average. The average installed capacity (0.9176) and power generation (0.9332) exhibit the highest efficiency. Meanwhile, average labor force (0.6862) and CO2 emissions (0.4923) exhibit the lowest efficiency, which shows that they have the greatest influence on the efficiency performance of thermal power plants, and the efficiency for almost half of power plants in China are lower than the average. Hunan (0.3046) in the central region and Yunnan (0.2783) and Sichuan (0.1453) in the western region have the lowest labor efficiency. Hebei (0.0242) in the eastern region and Shanxi (0.0223) and Hunan (0.0218) in the central region have the lowest efficiency of CO2 emissions, which suggests that Hunan should prioritize the improvement of labor allocation and energy efficiency to reduce carbon emissions.
5.2.3. Element Level
The empirical results show that the average efficiency of the thermal power industry in provinces and cities with satisfactory TFEE performance is relatively high.
During 2013–2017, energy consumption, installed capacity, and auxiliary power consumption in China’s thermal power industry increased annually by 9.25%, 27.0% and 14.86%, respectively. Additionally, the input and output of power generation, GDP supported by power as well as CO2 emissions increased by 7.4%, 50.53% and 2.75%, respectively. Although the input resources of thermal power plants have increased, the overall energy efficiency has decreased by 2.72%.
In the TFEE analysis, although the average efficiency of labor force (0.6862) is lower than the average (0.8014), the efficiency values have increased by 6.04% owing to the decrease in investment (−10.57%). Moreover, owing to the increasing investment in installed capacity and auxiliary power consumption, their efficiency values (0.9176 and 0.8657) are the highest among the input factors, even though the efficiency decreased by 2.32% and 2.40%, respectively.
5.3. Policy Recommendation
This research proposes the Super-DDF and TFEE models under VRS, which can provide the Chinese government with the ability to select the most appropriate energy and non-energy input to reduce the waste of resources and re-allocate resources distribution. Narrowing the gap among different regions will help reduce the probability of coal price fluctuations and maintain the stability of power supply.
- Through comprehensive analysis of the position of thermal power generation in the power industry and the heterogeneity of the four regions, the local governments can adjust energy consumption in advance in order to diversify the energy structure and design the scale and structure of the power industry. Improving the efficiency of thermal power generation is of far-reaching significance for environmental protection, economies of scale, and green and sustainable development of China.
- China not only plays an important role in the thermal power generation industry, but also faces up to the resource reallocation of the thermal power generation industry. The central and local governments need to work together to promote green energy and improve energy efficiency goals. Through effective resource allocation, the problems of overcapacity and the waste of energy input can be solved, and many inefficient thermal power plants can be eliminated. The higher energy efficiency brought about by the improvement of energy technology can enable China to carry out the most suitable resource allocation strategy.
6. Conclusions
In this study, super-efficiency DDF was used to evaluate the energy efficiency of the thermal power industry in 30 provinces and cities of China from 2013 to 2017, and the TFEE method was used to analyze the efficiency of each factor.
- Overall energy efficiency in four regions from 2013 to 2017 is high, but the distribution is uneven. There are differences in energy efficiency among regions in terms of energy conservation and emissions reduction potentials. The efficiency of the thermal power industry in eastern China (1.181) is the highest, followed by western (0.956), central (0.951), and northeastern China (0.926).
- At the provincial and city level, the overall energy efficiency of the thermal power industry from 2013 to 2017 is 1.026, which shows a slightly downward trend and an effective use of energy. The energy utilization efficiency of 10 provinces and cities is higher than 1, among them are Beijing, Tianjin, Shanghai, Inner Mongolia, Jiangsu, Anhui, Shandong, Hainan, Qinghai, and Ningxia.
- From 2013 to 2017, the average panel TFEE in the eastern, the central, the western, and the northeastern region is 0.923, 0.754, 0.742 and 0.710, respectively.
- The average factor efficiency of the thermal power industry in 30 provinces and cities from 2013 to 2017 is 0.8014, and the provinces and cities with average factor efficiency of 1 are the same as those with high energy efficiency.
- Average power generation (0.9332) and installed capacity (0.9176) are the most efficient factors, and CO2 emissions (0.4923) and labor (0.6862) are the least efficient factors.
Author Contributions
Data curation, I.-F.L.; Formal analysis, Y.F., C.-C.L., I.-F.L. and P.-C.L.; Funding acquisition, Y.F.; Investigation, I.-F.L. and A.-C.Y.; Methodology, C.-C.L. and A.-C.Y.; Project administration, C.-C.L.; Resources, A.-C.Y.; Software, I.-F.L.; Supervision, C.-C.L.; Validation, Y.F. and A.-C.Y.; Visualization, Y.F. and A.-C.Y.; Writing – original draft, I.-F.L.; Writing – review & editing, Y.F., C.-C.L. and P.-C.L. All authors have read and agreed to the published version of the manuscript.
Funding
This research was funded by the projects as below: Responsibility Definition of Leading Cadres’ Resources and Environment Audit Based on Ecological Carrying Capacity (2019M663953XB), Economic growth and sustainable utilization of water resources in Shaanxi Province(2020KJXX-038), Environmental protection and economic growth in the Yellow River Basin (20ZD195-180), The path to improve the efficiency of energy conservation and emission reduction in Xi’an (XA2020-RKXYJ-0095), Study on Efficiency Evaluation and Promotion Path of Urban Water Pollution Control in Shaanxi Province(2015D064), The sub-project of the Chinese Academy of Sciences Class A Strategic Leading Science and Technology Special Project “Science and Technology Project for the Construction of a Beautiful Chinese Ecological Civilization”(XDA23060304).
Institutional Review Board Statement
Not applicable.
Informed Consent Statement
Not applicable.
Data Availability Statement
The datasets generated during and/or analyzed during the current study are available from the corresponding author on reasonable request.
Conflicts of Interest
The authors declare no conflict of interest.
Appendix A
Input (I) and output (O) descriptive statistics by 4 region and cities in China from 2013 to 2017.
Table A1.
The descriptive statistics of four regions and cities in China from 2013 to 2017.
Table A1.
The descriptive statistics of four regions and cities in China from 2013 to 2017.
| Variable | Input | Output | ||||||
|---|---|---|---|---|---|---|---|---|
| Unit | Person | Million Tons | Million kW | 100 Million kW h | 100 Million kW h | Mt | 100 Million Yuan | |
| Year | Group | Labor | Energy_Consumption | Installed_Capacity | Auxiliary_Power_Consumption | Power_Generation | CO2 | GDP |
| 2013 | east | 103,982.8 | 180.209 | 37.271 | 107.309 | 1759.091 | 379.635 | 16,070.21 |
| 2013 | northeast | 129,955.7 | 140.73 | 22.083 | 61.338 | 826.996 | 376.878 | 10,045.62 |
| 2013 | central | 128,558.8 | 152.618 | 33.503 | 119.212 | 1509.288 | 527.016 | 11,916.96 |
| 2013 | west | 93,513.18 | 103.174 | 20.885 | 79.612 | 930.388 | 286.779 | 4550.728 |
| Average | All_region | 114,002.6 | 144.183 | 28.436 | 91.868 | 1256.441 | 392.577 | 10,645.88 |
| 2014 | east | 100,498 | 184.104 | 40.166 | 111.861 | 380.24 | 1809.139 | 17,571.38 |
| 2014 | northeast | 125,825 | 141.06 | 22.667 | 62.469 | 368.71 | 864.864 | 10,957.57 |
| 2014 | central | 126,583.8 | 157.427 | 35.385 | 116.431 | 530.765 | 1478.903 | 13,087.96 |
| 2014 | west | 95,850.64 | 108.243 | 22.725 | 85.5 | 294.629 | 956.591 | 5108.677 |
| Average | All_region | 112,189.4 | 147.708 | 30.236 | 94.065 | 393.586 | 1277.374 | 11,681.4 |
| 2015 | east | 96,051 | 187.948 | 42.898 | 117.164 | 1780.536 | 381.126 | 19,603.91 |
| 2015 | northeast | 120,966.3 | 139.783 | 22.993 | 67.372 | 840.295 | 356.342 | 11,916.45 |
| 2015 | central | 124,969.2 | 158.65 | 38.862 | 115.479 | 1431.188 | 513.035 | 14,261.7 |
| 2015 | west | 94,411.09 | 111.131 | 24.911 | 83.534 | 946.102 | 286.226 | 5775.39 |
| Average | All_region | 109,099.4 | 149.378 | 32.416 | 95.887 | 1249.53 | 384.183 | 12,889.36 |
| 2016 | east | 94,580.3 | 192.371 | 44.539 | 118.9 | 1827.2 | 389.338 | 22,517.01 |
| 2016 | northeast | 117,585.7 | 137.75 | 23.317 | 80.49 | 832.844 | 362.83 | 12,494.03 |
| 2016 | central | 117,564 | 161.023 | 41.015 | 104.115 | 1488.385 | 507.715 | 15,870.99 |
| 2016 | west | 91,950.46 | 114.052 | 27.192 | 90.972 | 956.119 | 297.801 | 6639.4 |
| Average | All_region | 105,420.1 | 151.299 | 34.016 | 98.619 | 1276.137 | 389.421 | 14,380.36 |
| 2017 | east | 94,354 | 195.868 | 46.53 | 127.034 | 1897.166 | 387.585 | 24,142.42 |
| 2017 | northeast | 110,462 | 140.357 | 24.047 | 79.984 | 843.683 | 361.833 | 12,712.98 |
| 2017 | Central | 113,303.3 | 163.948 | 41.585 | 112.103 | 1582.897 | 532.993 | 17,904.46 |
| 2017 | west | 84,858.55 | 118.657 | 28.871 | 98.948 | 1026.143 | 308.546 | 7568.221 |
| Average | All_region | 100,744.5 | 154.708 | 35.258 | 104.517 | 1337.472 | 397.74 | 15,582.02 |
| PANEL | Average | 108,291.2 | 149.455 | 32.072 | 96.991 | 1102.633 | 568.259 | 13,035.8 |
| max | 129,955.7 | 195.868 | 46.53 | 127.034 | 1897.166 | 1809.139 | 24,142.42 | |
| min | 84,858.55 | 103.174 | 20.885 | 61.338 | 294.629 | 286.226 | 4550.728 | |
Data source: This study was organized.
References
- Sözen, A.; Alp, I.; Özdemir, A. Assessment of operational and environmental performance of the thermal power plants in Turkey by using data envelopment analysis. Energy Policy 2010, 38, 6194–6203. [Google Scholar] [CrossRef]
- Charnes, A.; Cooper, W.W.; Rhodes, E. Measuring the efficiency of decision making units. Eur. J. Oper. Res. 1978, 2, 429–444. [Google Scholar] [CrossRef]
- Banker, R.D.; Charnes, A.; Cooper, W.W. Some Models for Estimating Technical and Scale Inefficiencies in Data Envelopment Analysis. Manag. Sci. 1984, 30, 1078–1092. [Google Scholar] [CrossRef] [Green Version]
- Eguchi, S.; Takayabu, H.; Lin, C. Sources of inefficient power generation by coal-fired thermal power plants in China: A metafrontier DEA decomposition approach. Renew. Sustain. Energy Rev. 2021, 138, 110562. [Google Scholar] [CrossRef]
- Bi, G.-B.; Song, W.; Zhou, P.; Liang, L. Does environmental regulation affect energy efficiency in China’s thermal power generation? Empirical evidence from a slacks-based DEA model. Energy Policy 2014, 66, 537–546. [Google Scholar] [CrossRef]
- Peng, J.; Yu, B.-Y.; Liao, H.; Wei, Y.-M. Marginal abatement costs of CO2 emissions in the thermal power sector: A regional empirical analysis from China. J. Clean. Prod. 2018, 171, 163–174. [Google Scholar] [CrossRef]
- Wang, K.; Mi, Z.; Wei, Y.-M. Will Pollution Taxes Improve Joint Ecological and Economic Efficiency of Thermal Power Industry in China?: A DEA-Based Materials Balance Approach. J. Ind. Ecol. 2018, 23, 389–401. [Google Scholar] [CrossRef] [Green Version]
- An, Y.; Zhai, X. SVR-DEA model of carbon tax pricing for China’s thermal power industry. Sci. Total Environ. 2020, 734, 139438. [Google Scholar] [CrossRef] [PubMed]
- Chen, B.; Jin, Y. Adjusting productivity measures for CO2 emissions control: Evidence from the provincial thermal power sector in China. Energy Econ. 2020, 87, 104707. [Google Scholar] [CrossRef]
- Duan, N.; Guo, J.-P.; Xie, B.-C. Is there a difference between the energy and CO2 emission performance for China’s thermal power industry? A bootstrapped directional distance function approach. Appl. Energy 2016, 162, 1552–1563. [Google Scholar] [CrossRef]
- Liu, J.-P.; Yang, Q.-R.; He, L. Total-Factor Energy Efficiency (TFEE) Evaluation on Thermal Power Industry with DEA, Malmquist and Multiple Regression Techniques. Energies 2017, 10, 1039. [Google Scholar] [CrossRef] [Green Version]
- Qin, Q.; Jiao, Y.; Gan, X.; Liu, Y. Environmental efficiency and market segmentation: An empirical analysis of China’s thermal power industry. J. Clean. Prod. 2020, 242, 118560. [Google Scholar] [CrossRef]
- Lima, F.; Nunes, M.L.; Cunha, J.; Lucena, A. Driving forces for aggregate energy consumption: A cross-country approach. Renew. Sustain. Energy Rev. 2017, 68, 1033–1050. [Google Scholar] [CrossRef] [Green Version]
- Wang, H.; Zhou, P. Assessing global CO2 emission inequality from consumption perspective: An index decomposition analysis. Ecol. Econ. 2018, 154, 257–271. [Google Scholar] [CrossRef]
- Chambers, R.G.; Chung, Y.; Färe, R. Benefit and Distance Functions. J. Econ. Theory 1996, 70, 407–419. [Google Scholar] [CrossRef]
- Yang, F.; Wei, F.; Li, Y.; Huang, Y.; Chen, Y. Expected efficiency based on directional distance function in data envelopment analysis. Comput. Ind. Eng. 2018, 125, 33–45. [Google Scholar] [CrossRef]
- Ray, S.C. The directional distance function and measurement of super-efficiency: An application to airlines data. J. Oper. Res. Soc. 2008, 59, 788–797. [Google Scholar] [CrossRef]
- Chen, Y.; Du, J.; Huo, J. Super-efficiency based on a modified directional distance function. Omega 2013, 41, 621–625. [Google Scholar] [CrossRef]
- Lin, R.; Chen, Z. Super-efficiency measurement under variable return to scale: An approach based on a new directional distance function. J. Oper. Res. Soc. 2015, 66, 1506–1510. [Google Scholar] [CrossRef]
- Portela, M.C.A.S.; Thanassoulis, E.; Simpson, G. Negative data in DEA: A directional distance approach applied to bank branches. J. Oper. Res. Soc. 2004, 55, 1111–1121. [Google Scholar] [CrossRef] [Green Version]
- Hadi-Vencheh, A.; Esmaeilzadeh, A. A new super-efficiency model in the presence of negative data. J. Oper. Res. Soc. 2013, 64, 396–401. [Google Scholar] [CrossRef]
- Wei, F.; Song, J.; Jiao, C.; Yang, F. A modified slacks-based ranking method handling negative data in data envelopment analysis. Expert Syst. 2019, 36, e12329. [Google Scholar] [CrossRef] [Green Version]
- Tang, J.; Liu, J.; Chen, J.; Wei, F. Performance Ranking Method Based on Superefficiency with Directional Distance Function in DEA. Math. Probl. Eng. 2020, 2020, 2458343. [Google Scholar] [CrossRef]
- Hu, J.-L.; Wang, S.-C. Total-factor energy efficiency of regions in China. Energy Policy 2006, 34, 3206–3217. [Google Scholar] [CrossRef]
- Färe, R.; Grosskopf, S. Modeling undesirable factors in efficiency evaluation: Comment. Eur. J. Oper. Res. 2004, 157, 242–245. [Google Scholar] [CrossRef]
- Chung, Y.H.; Färe, R.; Grosskopf, S. Productivity and Undesirable Outputs: A Directional Distance Function Approach. J. Environ. Manag. 1997, 51, 229–240. [Google Scholar] [CrossRef] [Green Version]
Publisher’s Note: MDPI stays neutral with regard to jurisdictional claims in published maps and institutional affiliations. |
© 2022 by the authors. Licensee MDPI, Basel, Switzerland. This article is an open access article distributed under the terms and conditions of the Creative Commons Attribution (CC BY) license (https://creativecommons.org/licenses/by/4.0/).