
Impact of Age on Takeover Behavior in Automated Driving in Complex Traffic Situations: A Case Study of Beijing, China

Abstract
:1. Introduction
2. Methodology
2.1. Participants
2.2. Study Design and Measures
2.3. Apparatus
2.4. Procedure
3. Results
3.1. Result of Different Driving Tasks
3.2. Result of Different Warning Time
3.3. Result of Different Driving Scenarios
4. Discussion
5. Conclusions
Author Contributions
Funding
Acknowledgments
Conflicts of Interest
References
- Dotzauer, M.; de Waard, D.; Caljouw, S.R.; Poehler, G.; Brouwer, W.H. Behavioral adaptation of young and older drivers to an intersection crossing advisory system. Accid. Anal. Prev. 2015, 74, 24–32. [Google Scholar] [CrossRef]
- Cicchino, J.B.; McCartt, A.T. Critical older driver errors in a national sample of serious US crashes. Accid. Anal. Prev. 2015, 80, 211–219. [Google Scholar] [CrossRef] [PubMed]
- Andrews, E.C.; Westerman, S.J. Age differences in simulated driving performance: Compensatory processes. Accid. Anal. Prev. 2012, 45, 660–668. [Google Scholar] [CrossRef] [PubMed]
- Svetina, M. The reaction times of drivers aged 20 to 80 during a divided attention driving. Traffic Inj. Prev. 2016, 17, 810–814. [Google Scholar] [CrossRef] [PubMed]
- Takahashi, R.; Kobayashi, M.; Sasaki, T.; Yokokawa, Y.; Momose, H.; Ohhash, T. Driving simulation test for evaluating hazard perception: Elderly driver response characteristics. Transp. Res. Part F-Traffic Psychol. Behav. 2017, 49, 257–270. [Google Scholar] [CrossRef] [Green Version]
- Nichols, A.L.; Classen, S.; McPeek, R.; Breiner, J. Does Personality Predict Driving Performance in Middle and Older Age? An Evidence-Based Literature Review. Traffic Inj. Prev. 2012, 13, 133–143. [Google Scholar] [CrossRef]
- Doroudgar, S.; Chuang, H.M.; Perry, P.J.; Thomas, K.; Bohnert, K.; Canedo, J. Driving performance comparing older versus younger drivers. Traffic Inj. Prev. 2017, 18, 41–46. [Google Scholar] [CrossRef]
- Depestele, S.; Ross, V.; Verstraelen, S.; Brijs, K.; Brijs, T.; van Dun, K.; Meesen, R. The impact of cognitive functioning on driving performance of older persons in comparison to younger age groups: A systematic review. Transp. Res. Part F-Traffic Psychol. Behav. 2020, 73, 433–452. [Google Scholar] [CrossRef]
- Nakano, Y.; Sano, S.; Yamakage, Y.; Kojima, T.; Kishi, C.; Takahasi, C.; Iribe, Y.; Kawanaka, H.; Oguri, K. Assessment and Prediction of Older Drivers’ Driving Performance. In Proceedings of the 2014 IEEE Intelligent Vehicles Symposium Proceedings, Dearborn, MI, USA, 8−11 June 2014; pp. 158–163. [Google Scholar]
- Wood, J.M.; Black, A.A.; Mallon, K.; Kwan, A.S.; Owsley, C. Effects of Age-Related Macular Degeneration on Driving Performance. Investig. Ophthalmol. Vis. Sci. 2018, 59, 273–279. [Google Scholar] [CrossRef] [Green Version]
- Shanmugaratnam, S.; Kass, S.J.; Arruda, J.E. Age differences in cognitive and psychomotor abilities and simulated driving. Accid. Anal. Prev. 2010, 42, 802–808. [Google Scholar] [CrossRef]
- Adrian, J.; Postal, V.; Moessinger, M.; Rascle, N.; Charles, A. Personality traits and executive functions related to on-road driving performance among older drivers. Accid. Anal. Prev. 2011, 43, 1652–1659. [Google Scholar] [CrossRef]
- Bieri, R.; Jaeger, M.; Gruber, N.; Nef, T.; Mueri, R.M.; Mosimann, U.P. A novel computer test to assess driving-relevant cognitive functions—A pilot study. Int. Psychogeriatr. 2014, 26, 229–238. [Google Scholar] [CrossRef] [PubMed] [Green Version]
- Izullah, F.R.; Koivisto, M.; Aho, A.; Laine, T.; Hamalainen, H.; Qvist, P.; Peltola, A.; Pitkakangas, P.; Luimula, M. NeuroCar Virtual Driving Environment Simultaneous Evaluation of Driving Skills and Spatial Perceptual-attentional Capacity. In Proceedings of the 2016 7th IEEE International Conference on Cognitive Infocommunications, Wroclaw, Poland, 16−18 October 2016; pp. 31–36. [Google Scholar]
- Yamaguchi, K.; Nakayama, M.; Sun, Q.; Xia, J. Prediction of Cognitive Performance of Drivers using Eye Fixation Behaviours. In Proceedings of the 23rd International Conference Information Visualisation, Paris, France, 2−5 July 2019; pp. 186–190. [Google Scholar]
- Adrian, J.; Moessinger, M.; Charles, A.; Postal, V. Exploring the contribution of executive functions to on-road driving performance during aging: A latent variable analysis. Accid. Anal. Prev. 2019, 127, 96–109. [Google Scholar] [CrossRef]
- Chapman, L.; Sargent-Cox, K.; Horswill, M.S.; Anstey, K.J. The Impact of Age Stereotypes on Older Adults’ Hazard Perception Performance and Driving Confidence. J. Appl. Gerontol. 2016, 35, 642–652. [Google Scholar] [CrossRef] [PubMed]
- Bunce, D.; Young, M.S.; Blane, A.; Khugputh, P. Age and inconsistency in driving performance. Accid. Anal. Prev. 2012, 49, 293–299. [Google Scholar] [CrossRef]
- Ortiz-Peregrina, S.; Ortiz, C.; Casares-Lopez, M.; Castro-Torres, J.J.; del Barco, L.J.; Anera, R.G. Impact of Age-Related Vision Changes on Driving. Int. J. Environ. Res. Public Health 2020, 17, 7416. [Google Scholar] [CrossRef]
- Wood, J.; Chaparro, A.; Hickson, L. Interaction between visual status, driver age and distracters on daytime driving performance. Vis. Res. 2009, 49, 2225–2231. [Google Scholar] [CrossRef] [Green Version]
- Rumschlag, G.; Palumbo, T.; Martin, A.; Head, D.; George, R.; Commissaris, R.L. The effects of texting on driving performance in a driving simulator: The influence of driver age. Accid. Anal. Prev. 2015, 74, 145–149. [Google Scholar] [CrossRef]
- Sportillo, D.; Paljic, A.; Ojeda, L. Get ready for automated driving using Virtual Reality. Accid. Anal. Prev. 2018, 118, 102–113. [Google Scholar] [CrossRef] [PubMed]
- Lu, Z.; Coster, X.; de Winter, J. How much time do drivers need to obtain situation awareness? A laboratory-based study of automated driving. Appl. Ergon. 2017, 60, 293–304. [Google Scholar] [CrossRef] [PubMed] [Green Version]
- Kim, H.J.; Yang, J.H. Takeover Requests in Simulated Partially Autonomous Vehicles Considering Human Factors. IEEE Trans. Human-Mach. Syst. 2017, 47, 735–740. [Google Scholar] [CrossRef]
- Zhang, B.; de Winter, J.; Varotto, S.; Happee, R.; Martens, M. Determinants of take-over time from automated driving: A meta-analysis of 129 studies. Transp. Res. Part F Traffic Psychol. Behav. 2019, 64, 285–307. [Google Scholar] [CrossRef]
- Körber, M.; Gold, C.; Lechner, D.; Bengler, K. The influence of age on the take-over of vehicle control in highly automated driving. Transp. Res. Part F Traffic Psychol. Behav. 2016, 39, 19–32. [Google Scholar] [CrossRef] [Green Version]
- Gold, C.; Happee, R.; Bengler, K. Modeling take-over performance in level 3 conditionally automated vehicles. Accid. Anal. Prev. 2018, 116, 3–13. [Google Scholar] [CrossRef]
- Gold, C.; Koerber, M.; Lechner, D.; Bengler, K. Taking Over Control From Highly Automated Vehicles in Complex Traffic Situations: The Role of Traffic Density. Hum. Factors 2016, 58, 642–652. [Google Scholar] [CrossRef] [PubMed]

| Variables | Percentage | |
|---|---|---|
| Age | 18–30 | 35.7% |
| 31–60 | 33.3% | |
| 61+ | 31.0% | |
| Sex | Male | 76.2% |
| Female | 23.8% | |
| Driving experience | <10 years | 42.9% |
| 10–20 years | 33.3% | |
| >20 years | 23.8% | |
| Variable | Unit | Variable Type | Definition |
|---|---|---|---|
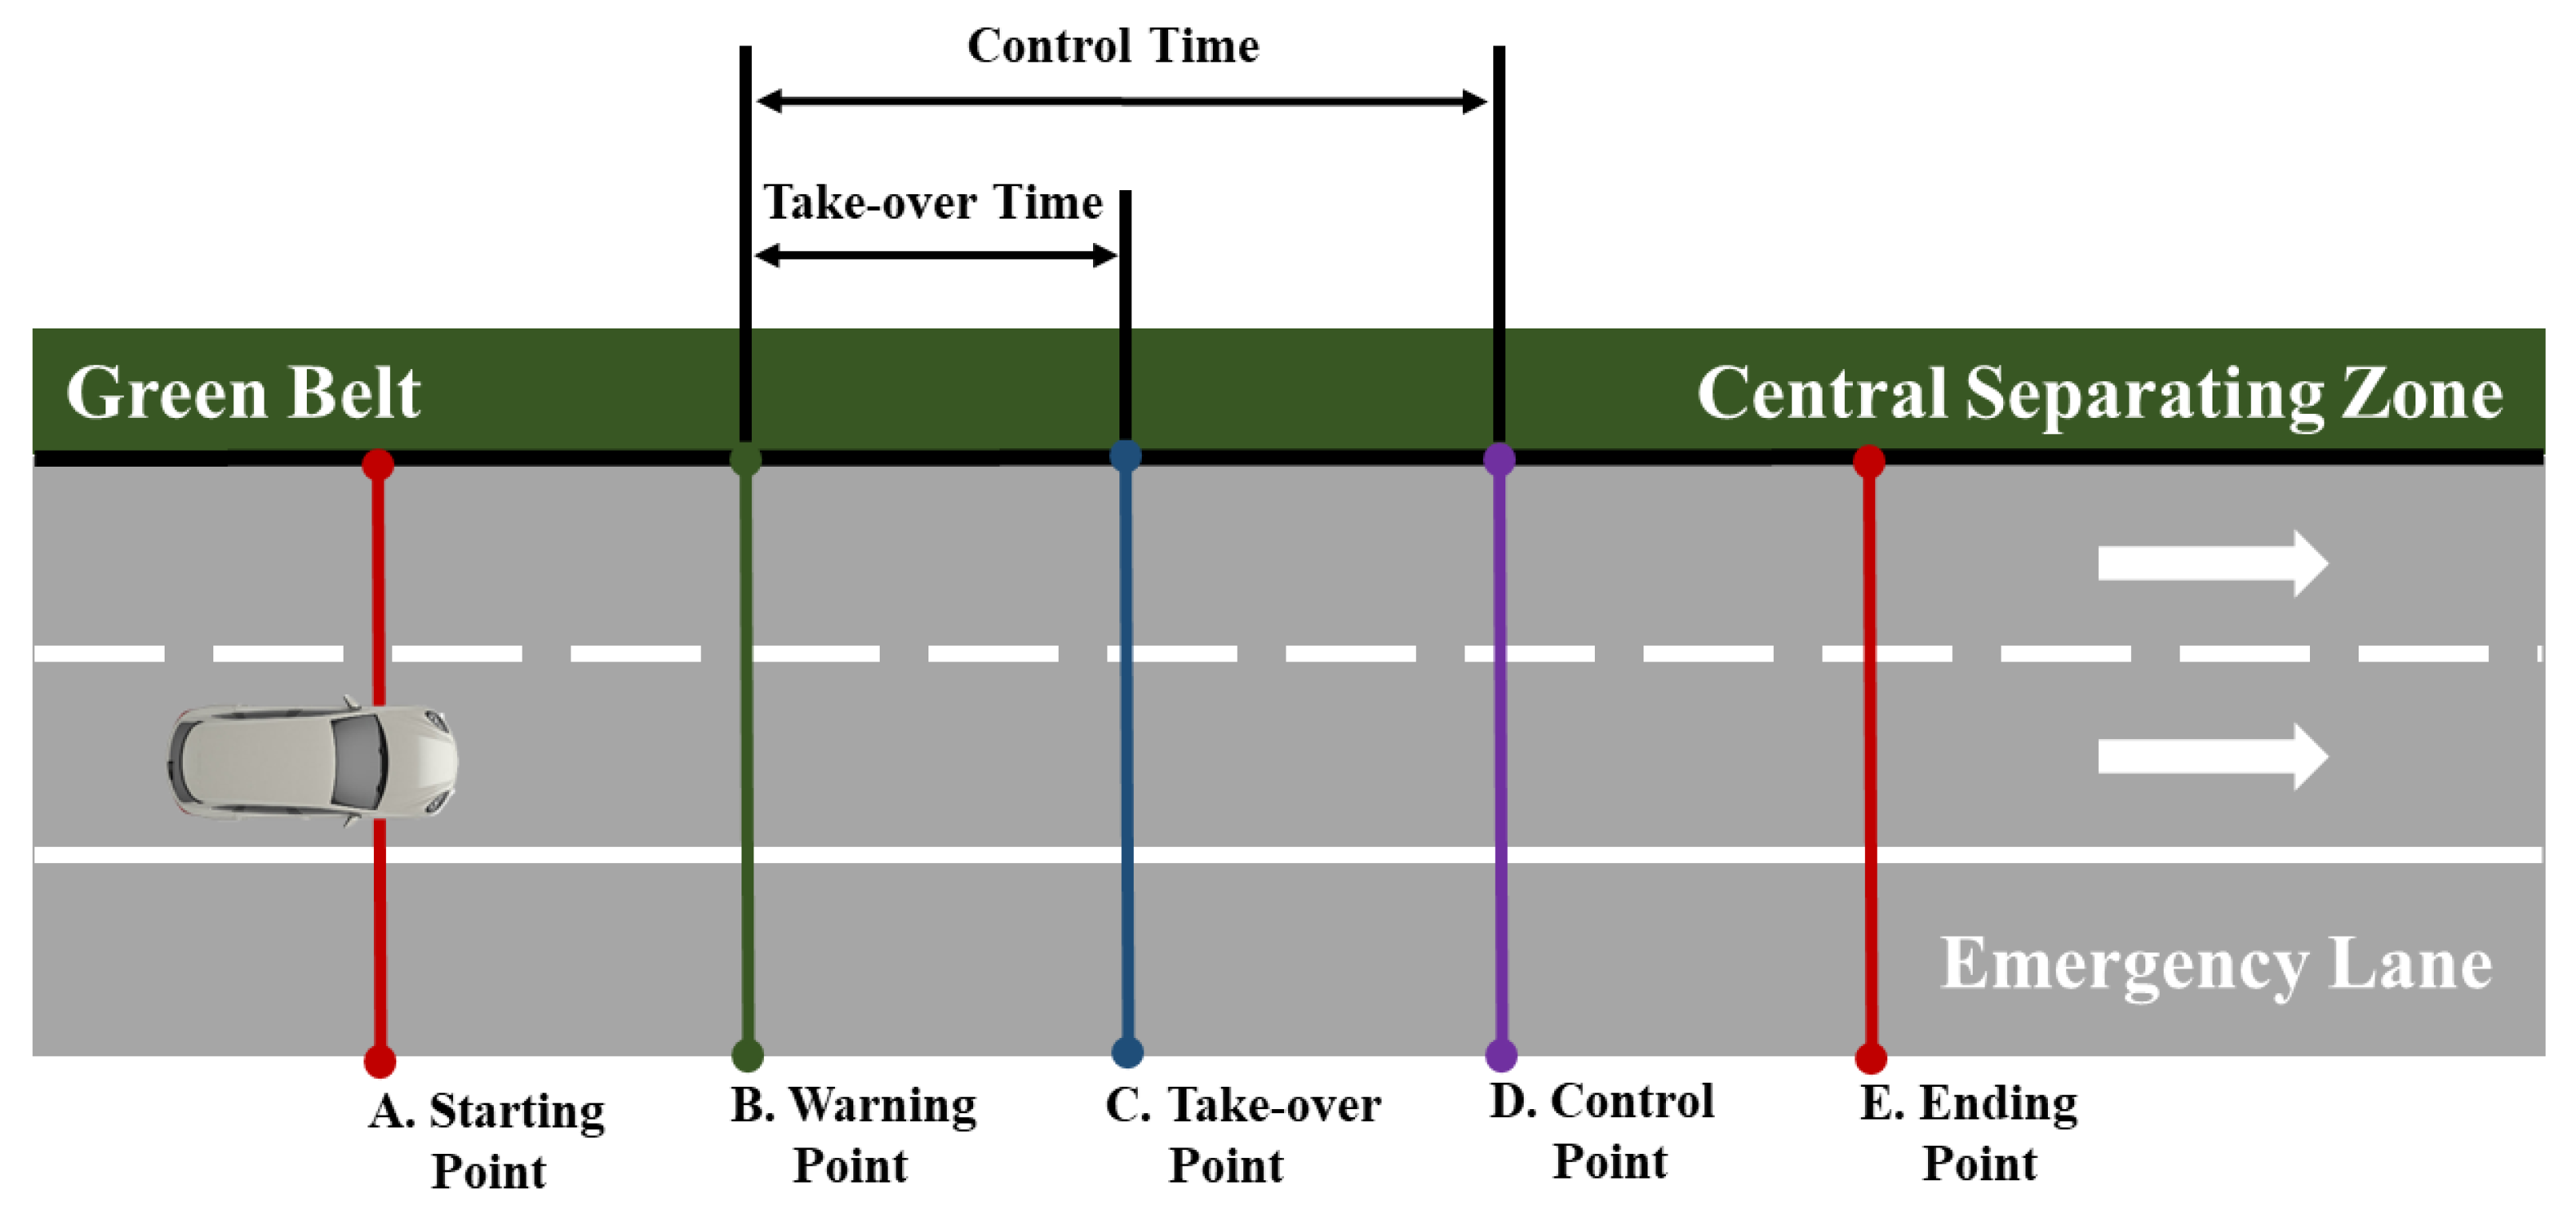
| Takeover time (TOT) | (s) | Time related to takeover | Time between warning signal and takeover |
| Control time (CT) | (s) | Time related to takeover | Time between warning signal and the first input after takeover |
| Mean speed (MS) | (m/s) | Takeover quality | Mean speed between warning signal and vehicle in stability |
| Mean lateral offset (MLO) | (m) | Takeover quality | Mean lateral offset between warning signal and vehicle in stability |
| Variables | Task | Young | Middle | Old | SIG (Young × Old) | SIG (Middle × Old) |
|---|---|---|---|---|---|---|
| TOT (s) | Working (SD) | 3.89 (1.00) | 4.11 (1.11) | 4.63 (1.92) | 0.000 *** | 0.006 *** |
| Entertainment (SD) | 3.73 (0.99) | 3.86 (1.30) | 3.73 (1.11) | 0.003 *** | 0.119 | |
| SIG | 0.229 | 0.125 | 0.000 *** | |||
| CT (s) | Working (SD) | 5.31 (1.96) | 5.02 (1.25) | 5.74 (2.02) | 0.072 * | 0.003 *** |
| Entertainment (SD) | 5.25 (1.90) | 4.99 (1.84) | 4.76 (1.17) | 0.857 | 0.153 | |
| SIG | 0.815 | 0.873 | 0.000 *** | |||
| MS (km/h) | Working (SD) | 70.31 (17.95) | 67 (17.57) | 70.37 (17.16) | 0.981 | 0.166 |
| Entertainment (SD) | 69.74 (18.09) | 66.86 (16.47) | 71.07 (16.23) | 0.673 | 0.024 ** | |
| SIG | 0.807 | 0.951 | 0.764 | |||
| MLO (m) | Working (SD) | 0.48 (0.22) | 0.45 (0.22) | 0.52 (0.21) | 0.205 | 0.023 ** |
| Entertainment (SD) | 0.47 (0.19) | 0.47 (0.20) | 0.53 (0.20) | 0.011 ** | 0.002 *** | |
| SIG | 0.612 | 0.454 | 0.675 |
| Variables | Warning Time | Young | Middle | Old | SIG (Young × Old) | SIG (Middle × Old) |
|---|---|---|---|---|---|---|
| TOT (s) | 5 s (SD) | 3.90 (1.04) | 4.04 (1.32) | 4.21 (1.80) | 0.100 | 0.363 |
| 10 s (SD) | 3.73 (0.93) | 3.93 (1.09) | 4.14 (1.41) | 0.008 ** | 0.180 | |
| SIG | 0.195 | 0.532 | 0.769 | |||
| CT (s) | 5 s (SD) | 5.52 (1.84) | 5.30 (1.76) | 5.45 (1.80) | 0.791 | 0.518 |
| 10 s (SD) | 5.04 (1.97) | 4.72 (1.27) | 5.04 (1.59) | 0.998 | 0.159 | |
| SIG | 0.055 * | 0.006 ** | 0.083 * | |||
| MS (km/h) | 5 s (SD) | 72.02 (17.93) | 68.82 (17.40) | 72.48 (17.39) | 0.848 | 0.133 |
| 10 s (SD) | 68.04 (17.75) | 65.06 (16.28) | 68.96 (15.16) | 0.684 | 0.089 * | |
| SIG | 0.089 * | 0.100 | 0.132 | |||
| MLO (m) | 5 s (SD) | 0.45 (0.20) | 0.44 (0.21) | 0.50 (0.20) | 0.071 * | 0.048 ** |
| 10 s (SD) | 0.50 (0.20) | 0.47 (0.21) | 0.55 (0.21) | 0.073 * | 0.012 ** | |
| SIG | 0.073 * | 0.268 | 0.101 |
| Variables | Scenario | Young | Middle | Old | SIG (Young × Old) | SIG (Middle × Old) |
|---|---|---|---|---|---|---|
| TOT (s) | Main-line (SD) | 3.89 (0.97) | 4.05 (1.20) | 4.34 (1.67) | 0.072 * | 0.256 |
| On-ramp (SD) | 3.80 (1.00) | 3.78 (0.88) | 4.01 (1.65) | 0.352 | 0.327 | |
| Fog-cluster (SD) | 3.79 (1.03) | 4.06 (0.93) | 4.26 (1.43) | 0.033 * | 0.357 | |
| Accident (SD) | 3.77 (0.98) | 4.04 (1.66) | 4.10 (1.72) | 0.248 | 0.835 | |
| SIG | 0.572 | 0.728 | 0.529 | |||
| CT (s) | Main-line (SD) | 5.25 (1.59) | 4.99 (1.49) | 5.47 (1.83) | 0.478 | 0.133 |
| On-ramp (SD) | 4.78 (1.33) | 4.59 (1.11) | 4.98 (1.84) | 0.468 | 0.166 | |
| Fog-cluster (SD) | 5.78 (2.36) | 5.16 (1.08) | 5.44 (1.37) | 0.303 | 0.415 | |
| Accident (SD) | 5.30 (2.13) | 5.27 (2.22) | 5.10 (1.73) | 0.613 | 0.67 | |
| SIG | 0.397 | 0.361 | 0.449 | |||
| MS (km/h) | Main-line (SD) | 90.13 (9.80) | 88.82 (8.34) | 87.52 (10.70) | 0.158 | 0.489 |
| On-ramp (SD) | 53.02 (10.62) | 51.67 (9.42) | 53.45 (7.55) | 0.809 | 0.331 | |
| Fog-cluster (SD) | 71.90 (13.20) | 66.48 (9.49) | 74.55 (12.40) | 0.248 | 0.001 *** | |
| Accident (SD) | 64.96 (13.84) | 60.49 (12.56) | 67.51 (13.44) | 0.32 | 0.007 *** | |
| SIG | 0.000 *** | 0.000 *** | 0.000 *** | |||
| MLO (m) | Main-line (SD) | 0.39 (0.21) | 0.35 (0.21) | 0.49 (0.20) | 0.02 ** | 0.001 *** |
| On-ramp (SD) | 0.48 (0.14) | 0.45 (0.15) | 0.49 (0.12) | 0.614 | 0.08 * | |
| Fog-cluster (SD) | 0.57 (0.23) | 0.57 (0.25) | 0.61 (0.26) | 0.376 | 0.411 | |
| Accident (SD) | 0.44 (0.17) | 0.46 (0.16) | 0.50 (0.19) | 0.104 | 0.273 | |
| SIG | 0.057 ** | 0.019 *** | 0.543 |
Publisher’s Note: MDPI stays neutral with regard to jurisdictional claims in published maps and institutional affiliations. |
© 2022 by the authors. Licensee MDPI, Basel, Switzerland. This article is an open access article distributed under the terms and conditions of the Creative Commons Attribution (CC BY) license (https://creativecommons.org/licenses/by/4.0/).
Share and Cite
Gong, J.; Guo, X.; Pan, L.; Qi, C.; Wang, Y. Impact of Age on Takeover Behavior in Automated Driving in Complex Traffic Situations: A Case Study of Beijing, China. Sustainability 2022, 14, 483. https://doi.org/10.3390/su14010483
Gong J, Guo X, Pan L, Qi C, Wang Y. Impact of Age on Takeover Behavior in Automated Driving in Complex Traffic Situations: A Case Study of Beijing, China. Sustainability. 2022; 14(1):483. https://doi.org/10.3390/su14010483
Chicago/Turabian StyleGong, Jianguo, Xiucheng Guo, Lingfeng Pan, Cong Qi, and Ying Wang. 2022. "Impact of Age on Takeover Behavior in Automated Driving in Complex Traffic Situations: A Case Study of Beijing, China" Sustainability 14, no. 1: 483. https://doi.org/10.3390/su14010483
APA StyleGong, J., Guo, X., Pan, L., Qi, C., & Wang, Y. (2022). Impact of Age on Takeover Behavior in Automated Driving in Complex Traffic Situations: A Case Study of Beijing, China. Sustainability, 14(1), 483. https://doi.org/10.3390/su14010483