Article

The Organization’s Sustainable Work Stress and Maladjustment Management Plan by Predicting Early Retirement through Big Data Analysis: Focused on the Case of South Korea

1
Department of Education, Education College, Korea University, Seoul 02841, Korea
2
Department of Liberal Arts, Wesley Creative Convergence College, Hyupsung University, Hwaseong-si 18330, Korea
*
Author to whom correspondence should be addressed.
Sustainability 2022, 14(1), 434; https://doi.org/10.3390/su14010434
Submission received: 3 December 2021 / Revised: 26 December 2021 / Accepted: 27 December 2021 / Published: 31 December 2021

Abstract

:
The purpose of this study is to verify the predictive model of early retirees’ responses to work stress and maladjustment to the company by utilizing big data analytics and to extract the reasons for early retirement from the personnel information. Company A’s personnel information of employees working in the company for 10 years was used, K-Nearest Neighbor (K-NN) algorithm was used to verify the predictive model of early retirees, and Decision Tree Analysis algorithm was used to extract the causing factors. According to the analysis results, first, the verification of the predictive model of early retirees based on the personnel information data showed 98% accuracy. Second, among the personnel information items, the ranking of items with high relevance for early retirement was the distance between the company and the residence (first place), the recent promotion history (second place), and whether or not to have the license (third place) out of a total of 18 items. The results of the analysis conducted in this study suggest that HRD intervention is required in the provision of problem-solving solutions involved in the HRM field, which is expected to be effective as a basic diagnostic tool for HR diagnosis involving HRD and HRM. In addition, this study may provide a detailed analysis of early retirement due to work stress and maladjustment of young people.

1. Introduction

The topic of organization in this era is focused on how to survive in an uncertain, volatile, complex, and ambiguous future. In addition to the rapid pace of change, understanding the causal relationship of environments within domestic company markets and organizations is not simple, and it is difficult to predict variables in future situations. Thus, it has become important to predict what strategies are needed for the organizations and what management-level coping and prevention strategies are needed to carry them out.
According to the data of Saramin HR Co., Ltd., the biggest recruitment portal site in the country, seven out of ten office workers (69.7%) delay changing jobs due to COVID-19. Looking at the root causes, 53.4% of the respondents said that the companies they were hoping to work for did not post a job opening, followed by 48.1% due to serious uncertainty caused by unfavorable conditions of management, 20.4% due to the suspension of employment of the companies they were trying to apply for, and 14.5% of the respondents said they could not make time to apply for another company due to their increased tasks at work [1]. The survey suggested that the turnover market could be extremely high once the COVID-19 crisis subsided.
According to the research on the status of recruitment and retraining of new employees by Korea Employee Union, early retirement not only increases company costs but also adversely affects organizational culture. A company usually spends an average of 19.5 months retraining new employees, with a total cost of 6,084,000 KRW (including direct and indirect costs) per person. In addition, it turned out that the turnover rate had a negative influence on the rest of the organization. Increased workload due to colleague changes, reduced commitment to the organization, and psychological loss could lead to the resignation of other employees [2]. Generation of retirees in the organization can have a negative influence.
Despite the importance of employee retention, most companies do not have a system that identifies early retirement, and most take action after the retirees leave [3]. The employment information service is conducting “a survey of university graduates’ careers” in order to indirectly analyze the reasons for early retirement. There is also a thesis on the actual situation and causes of early retirement [4]. From HRD’s perspective, managing separation is an important issue for implementing strategic HRD [5]. According to Kwon Dae-bong and Cho Dae-yeon [6], HRD is defined as an ongoing process to solve problems based on the programs for individual, organizational, and career development, team and organizational-level problems, enhancing individual achievements, and above all, emphasis on detecting problems.
In addition, most of the previous studies on early retirement are generally studies in the field of HRM [7] and collecting data by questionnaire [4,7,8,9]. Regression analysis statistics technique is mainly used in the case of research methods that collect data from these questionnaires. This regression analysis is a statistical method of assuming a model and estimating that model from the data of measured variables to establish the relevance between variables, and is an analysis that predicts the value of dependent variables by the value of independent variables. Kim Young-park and Kim Hyung-joong [3] pointed out limitations on utilization in the future for decision-making in the research to identify the causative variables. In addition, despite attempts to form a single wheel called HR linked to HRM/HRD and look into interactions between them, the results revealed a significant position in the organizations. Research linked with “HRM” and “HRD” is not being actively carried out [7].
As a prediction strategy to deal with these changes becomes important, big data analysis is drawing attention in various fields. People living in the digital world society are forming organic connections with the Internet. In addition, in the digital world, the era of big data has arrived, leading to the era of artificial intelligence. Since big data solves problems occurring in people’s lives, studies are getting the limelight. Big data helps create new values by solving current life problems and predicts the future by figuring out the current status of a particular topic and analyzes patterns or trends [10].
Considering the information above, this study aims to understand, examine, and analyze causes of early retirement by utilizing the personnel information, seeking solutions that can be provided in terms of HRD. Additionally, this study seeks to find information and analysis for HRD using such personnel information. To conduct this study, company A’s employee information working in the company for 10 years was utilized, and K-Nearest Neighbor (K-NN) algorithm was used to verify the predictive model or early retirees. Finally, Decision Tree Analysis algorithm was used to extract the causing factors.

2. Literature Review and Hypothesis Development

2.1. Personnel Information

This study focused on the information in the personnel record book, which contains the minimum information for the company to manage their personnel. Personnel information is a record of continuous changes from the point of entry to the point of service and until retirement.
William Jones [11] said that we should manage information not only for people, but also for work completion. He also argued that information is not fundamentally valuable and, in fact, we generally have so much information that it is the most visible way to manage other valuable resources.
William Jones [11] referred to the concept of Personal Information Management (PIM), which argued that a particular focus should be placed on organizing and maintaining information collection so that items such as information (paper documents, electronic documents, e-mail, messages, web references, and handwritten notes) needed to complete the task can be used and reused later. Personal Information Management (PIM) can always provide the right information in the right place, in the right form, and maintain sufficient completeness to meet current requirements. He also advocated for the use of tools and technology to save time and use information creatively and intelligently.
The term personnel information has two meanings [11]. The first is information that individuals experience but cannot control, such as information they use for their own personal purposes. Second is about information used to manage others, like medical doctors and health care records for patients.
In this study, we will use the second concept of personnel information presented by [11], which is information used to manage others.

2.2. Early Retirement

Early retirement differs from ‘dismissal’ or ‘regular retirement’ [12] in that it refers to leaving the organization voluntarily. The concept of early retirement was used primarily for restructuring and downsizing the organization. From the individual’s point of view, it was primarily conducted to provide an opportunity for a second [13]. However, in recent years, voluntary choices have been strengthened, such as early separation in the labor market [14] and ‘MZ generation has many early retirements within a year. Determined within an average of 5 months after joining the company’ [15] have also been seen as a result of this change. Separation is different from retirement in that it is about breaking off the employment relationship, while separation is about turnover. The concept of turnover in macroscopic studies is referred to as labor mobility, inter-regional, inter-industry, and inter-occupational transfer [16], and in micro-research, inter-enterprise research movement is referred to as accession and separation, and commonly represented as turnover [17]. Therefore, a turnover is defined as a break from employment from the organization, and the concept of separation can be explored in more detail through the prior studies.
In general, domestic research suggests that employees who enter the organization take up to three years to adjust to their jobs [18]. Therefore, in this study, the period of early separation is set at three years.

2.3. Prior Studies about Causes of Early Retirement Responses to Work Stress and Mal-Adjustment

Studies related to early separation, with the issue of college graduates’ early separation being highlighted, are being conducted. First, there are studies on the willingness of early college graduates to change jobs and factors affecting their turnover [4,19,20,21,22]. Second, there are studies of early college graduates’ job adaptation and organizational perspectives [23,24,25]. These prior studies are useful in exploring variables that affect turnover, or in looking at ways to increase early adaptation of college graduates.
Prior studies related to early separation are shown in Table 1. A majority of studies have shown early separation for reasons such as wages, working conditions, job satisfaction, and failure to adapt to the job [4,19,26]. Initial studies on the causes of early separation were mainly conducted using the Graduates Occupational Mobility Survey (GOMS). Depending on the size of the enterprise, people from small and medium enterprises were more dissatisfied with their working conditions while large enterprises had relatively greater job mismatch [4]. Overall, this is likely related to accepting questionable applicants regardless of major or degree due to job shortages.
In addition, while the most important factor for people who have job experience of three to five years was work environment, the main reasons for first year separation and turnover were salary and other issues [26]. On the other hand, Lee Cheol-sun [27]’s study concluded that early separation was caused by psychological factors such as difficulty in self-development and low evaluation rather than monetary factors. A recent survey by major agencies found that discordance of work and aptitude, salary, failure to adapt to the organizational culture, and dissatisfaction with working conditions were the biggest reasons for early retirement [28].
While efforts are being made in the enterprises to improve this early separation problem, HRD-level efforts are being emphasized, such as increasing organizational adaptability through education and improving job satisfaction through better job training [29].
As the issue of early separation among new college graduates is highlighted, studies related to this issue are being conducted. First, there are studies on the willingness of early college graduates to change jobs, and factors affecting their turnover [4,19,20,21,22]. Second, there are studies of early college graduates’ job adaptation and organizational perspectives [24,25]. These prior studies are useful in exploring variables and job factors that affect turnover.
Table 1 shows the studies related to early shownretirement summarized in the previous study [29]. A majority of studies have identified wages, working conditions, job satisfaction, organizational, and job adaptation failures as driving factors for early retirement [4,19,26]. Initial studies on the causes of early separation were mainly conducted using the Graduates Occupational Mobility Survey (GOMS). Depending on the size of the enterprise, people from small and medium enterprises were more dissatisfied with their working conditions, while large enterprises had relatively greater job mismatch [4]. Overall, this is likely related to selecting questionable applicants regardless of major or degree, driven by job shortages.

2.4. Hypotheses for Early Retirement Analysis

Through the previous literature study, it was confirmed that many studies are being conducted on the issue of early retirement. However, previous research has mainly focused on post-mortem analysis of the cause of early retirement through questionnaires or interviews. What a company or organization really wants in regard to early retirement is to prevent it before it happens. In that case, if the occurrence of early retirement can be confirmed in advance and the cause can be predicted, a more effective response method for early retirement can be prepared.
On the other hand, since the 2000s, there have been attempts to explain the problem of continuous recruitment of early retirees: that is, early turnover. Several studies mentioned the environment for continuous work [31], while others argued that characteristics such as education and training [31], job-value [32], behavioral characteristics [31], and career interruption [2,3] occur. Kim Eun-bee [32] argued that as a result of analyzing the correlation between performance, career motivation, and compensation in the corporate internal-system, the percentage of early experienced people thinking of changing jobs is higher. Previous studies focused more on exploring the supplementation of education or institutions than on differences in early turnover behavior.
Therefore, this study will investigate how early experiences respond and influence early turnover through big-data analysis. The authors suggest that the behavior of early experienced people to cope with early turnover may differ depending on the above previous studies and various causes. The three hypotheses developed in this study will be analyzed from a comparative perspective based on career.
In this paper, we try to analyze whether early retirement can be predicted and whether the cause of early retirement can be analyzed through a new method. In other words, we want to analyze the difference in data between existing employees and early retirement employees through the big data analysis method that predicts through machine learning by analyzing existing data, and then using this to analyze whether the cause of early retirement can be identified.
This can be summarized in one hypothesis as follows.
Hypothesis 1 (H1).
Early retirement response to work stress and maladjustment can be predicted using personnel information data.
This hypothesis can be summarized into the following two research questions.
Research question 1: Is the big data algorithm able to predict early retirement responses to work stress and mal-adjustment?
Research question 2: What are the causes of early retirement using the personnel information?

3. Methods and Materials
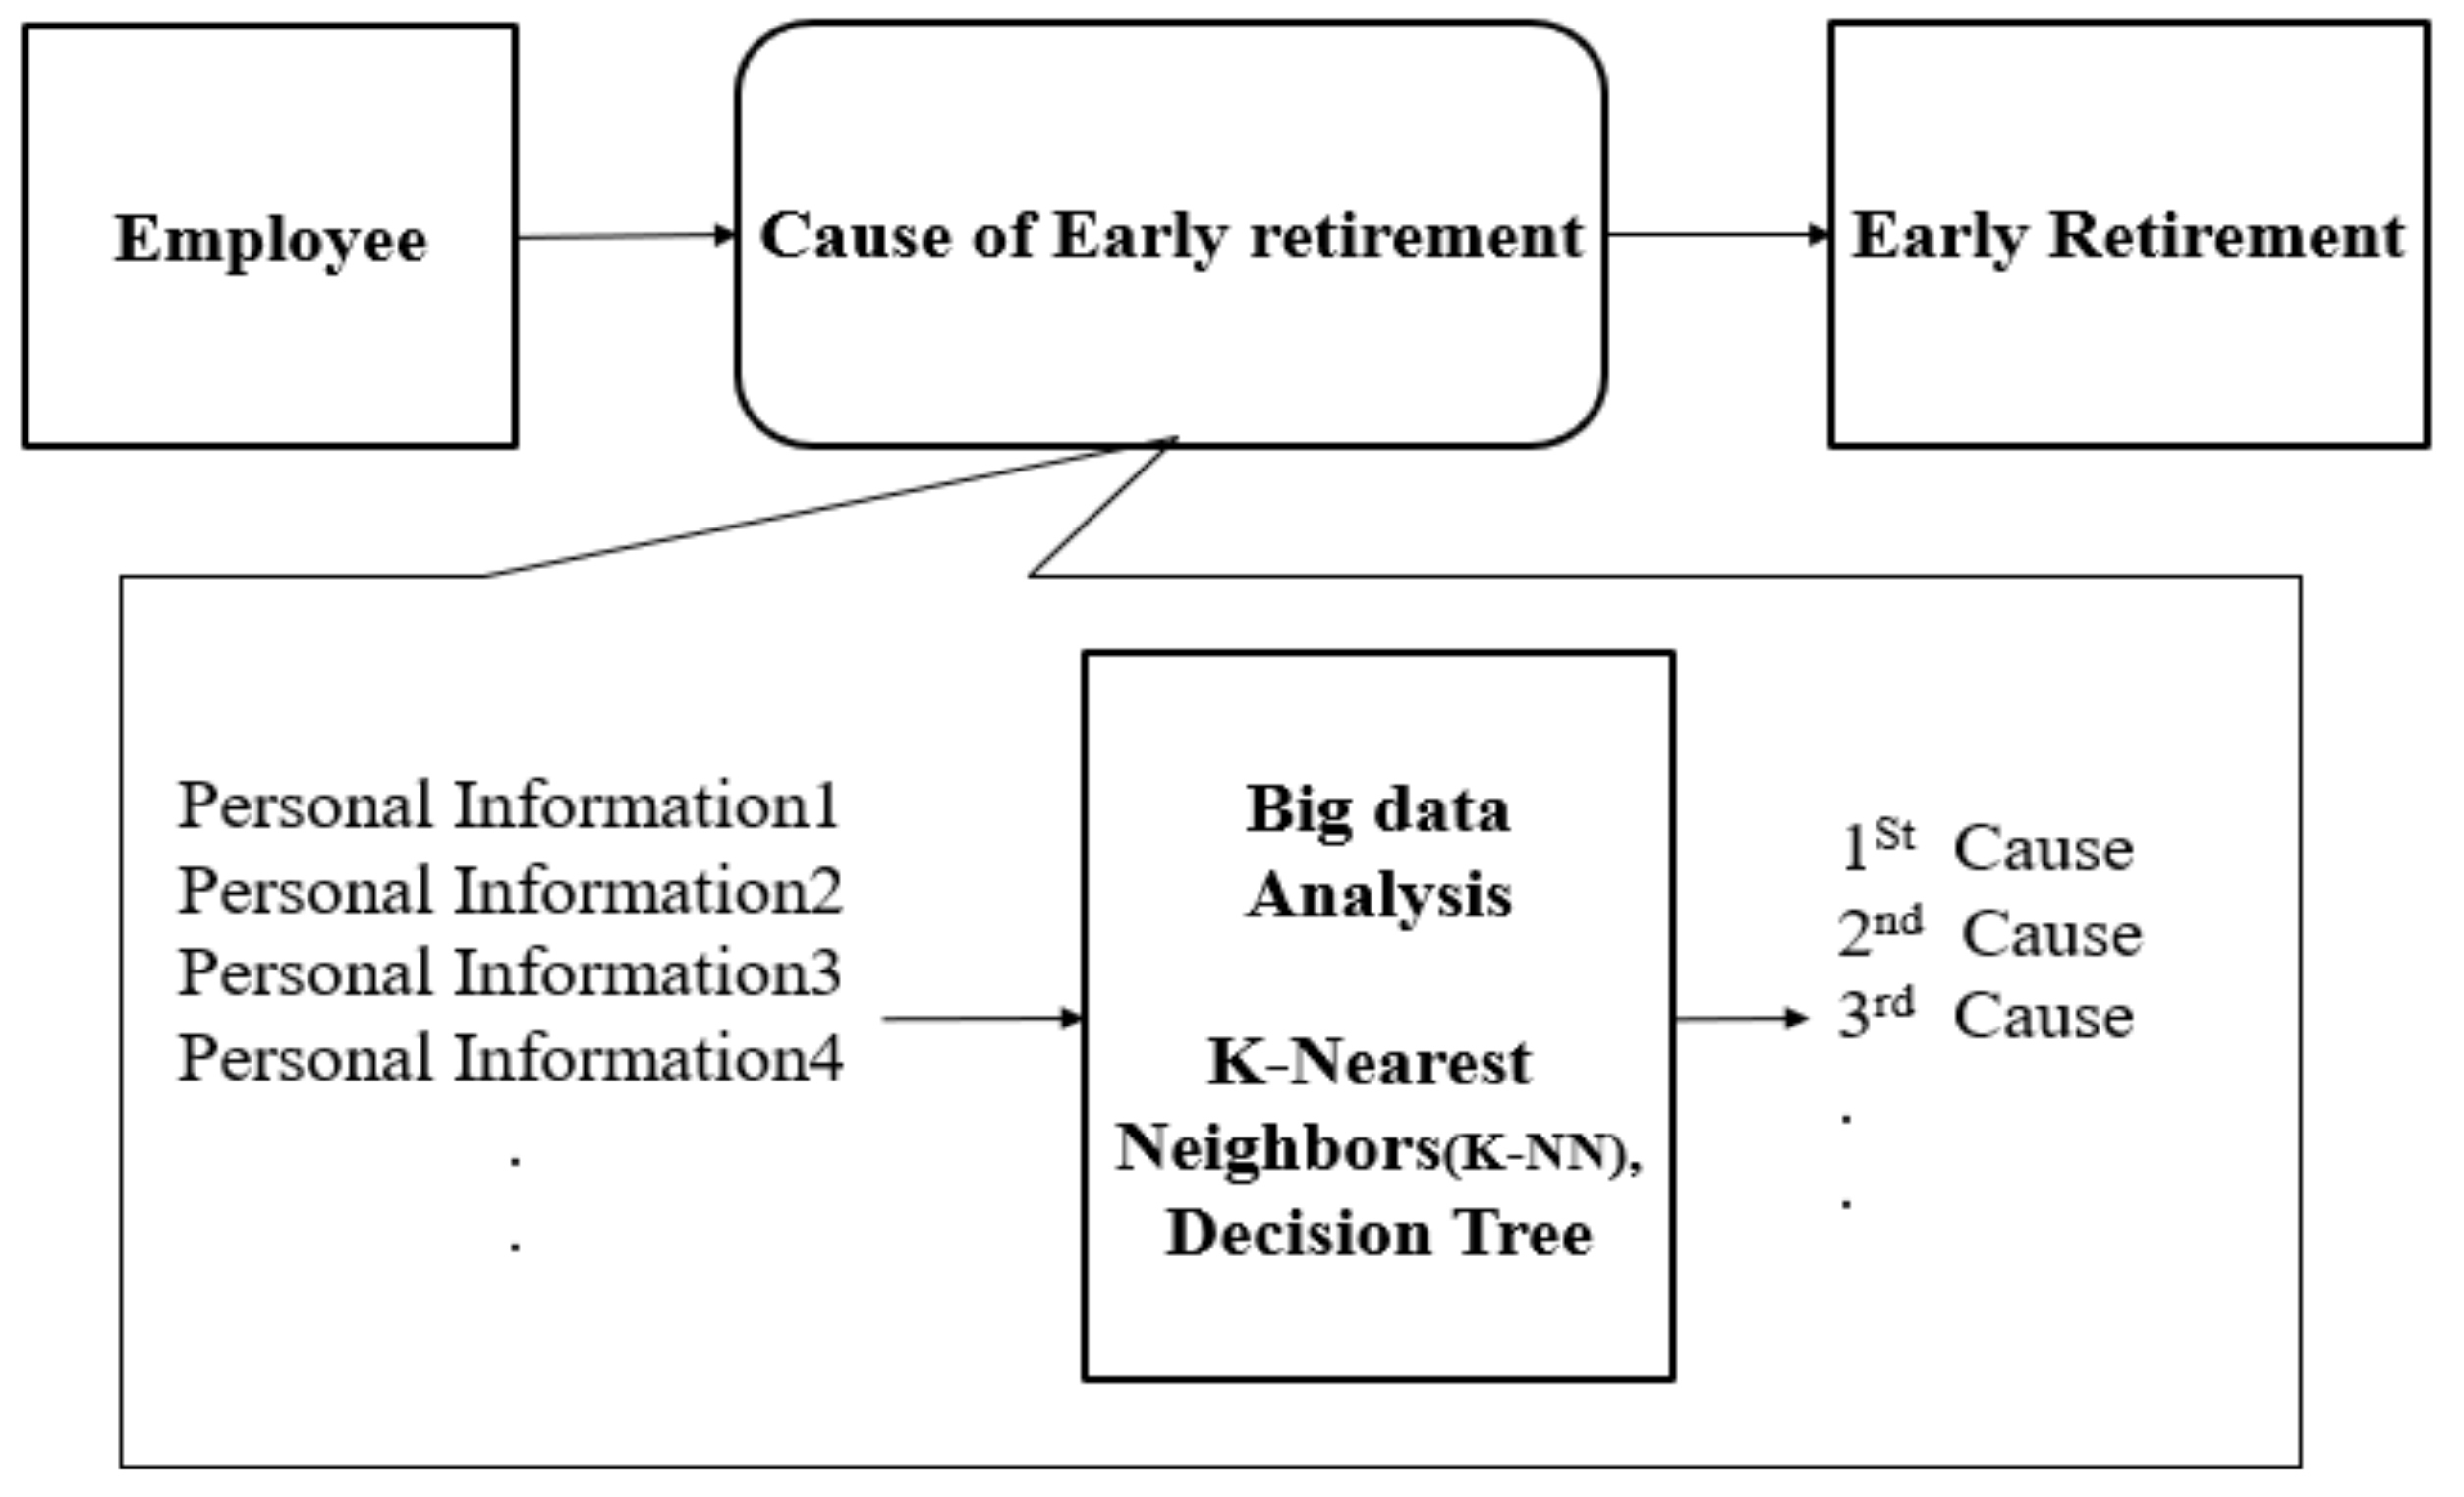
3.1. Research Model

The purpose of this study is to confirm whether early leavers can be grasped by big data analysis by utilizing personnel information, and to derive the cause of early leaving by big data analysis. Among the big data analysis methods, K-Nearest Neighbor (K-NN) algorithm analysis is performed for early leave prediction model verification, and decision tree analysis algorithm analysis method is used for causative factor extraction. These were applied to derive the result. A research model based on this was set as shown in Figure 1. As shown in Figure 1, it is assumed that there is a cause of early leaving between the worker and early leaving, and this is predicted and the cause is derived by utilizing the big data analysis method.

3.2. Maching Learning

The method to analyze the big data used in this study is machine learning, which is technology that automatizes prediction models. This is a method of analyzing in which variables are significant in statistical distributions by using a given normal distribution model. The difference between machine learning and existing statistical data analysis is that machine learning does not assume a statistical model for a group of data, but rather finds a distribution model on its own based on data to analyze significant differences. Machine learning’s operation principle is that it reads data (learning) and abstracts the read data (modeling). Then, the modeling where data are reflected again is evaluated to find errors and corrected for optimization. This is repeated several times to create finally optimized modeling and implement a prediction model [32].
Machine learning is largely divided into two areas―supervised learning and unsupervised learning. Supervised learning is the learning method implemented in a group of data where the aimed result value exists. In other words, it classifies and models data that are highly correlated with the outcome values in the existing data group, creating a model in which the actual value and the predicted one are close. On the other hand, unsupervised learning creates rules and models that can derive data groups and distinguish them through correlation between the data when no result value is given.
Since this study needed a model to predict early retirement through a group of data where the result value was early retirement, supervised learning’s machine learning was applied.
Programming called “R” is used for machine learning. “R” is a program developed by Bell Laboratories in 1976, improved by Ross Ihaka and Robert Gentleman in the 1990s, and released as an open source featuring a vast library specialized in statistical processing. ‘R’ operates as a unit of library and package and is used to analyze problems by utilizing the most appropriate package that corresponds to each problem.

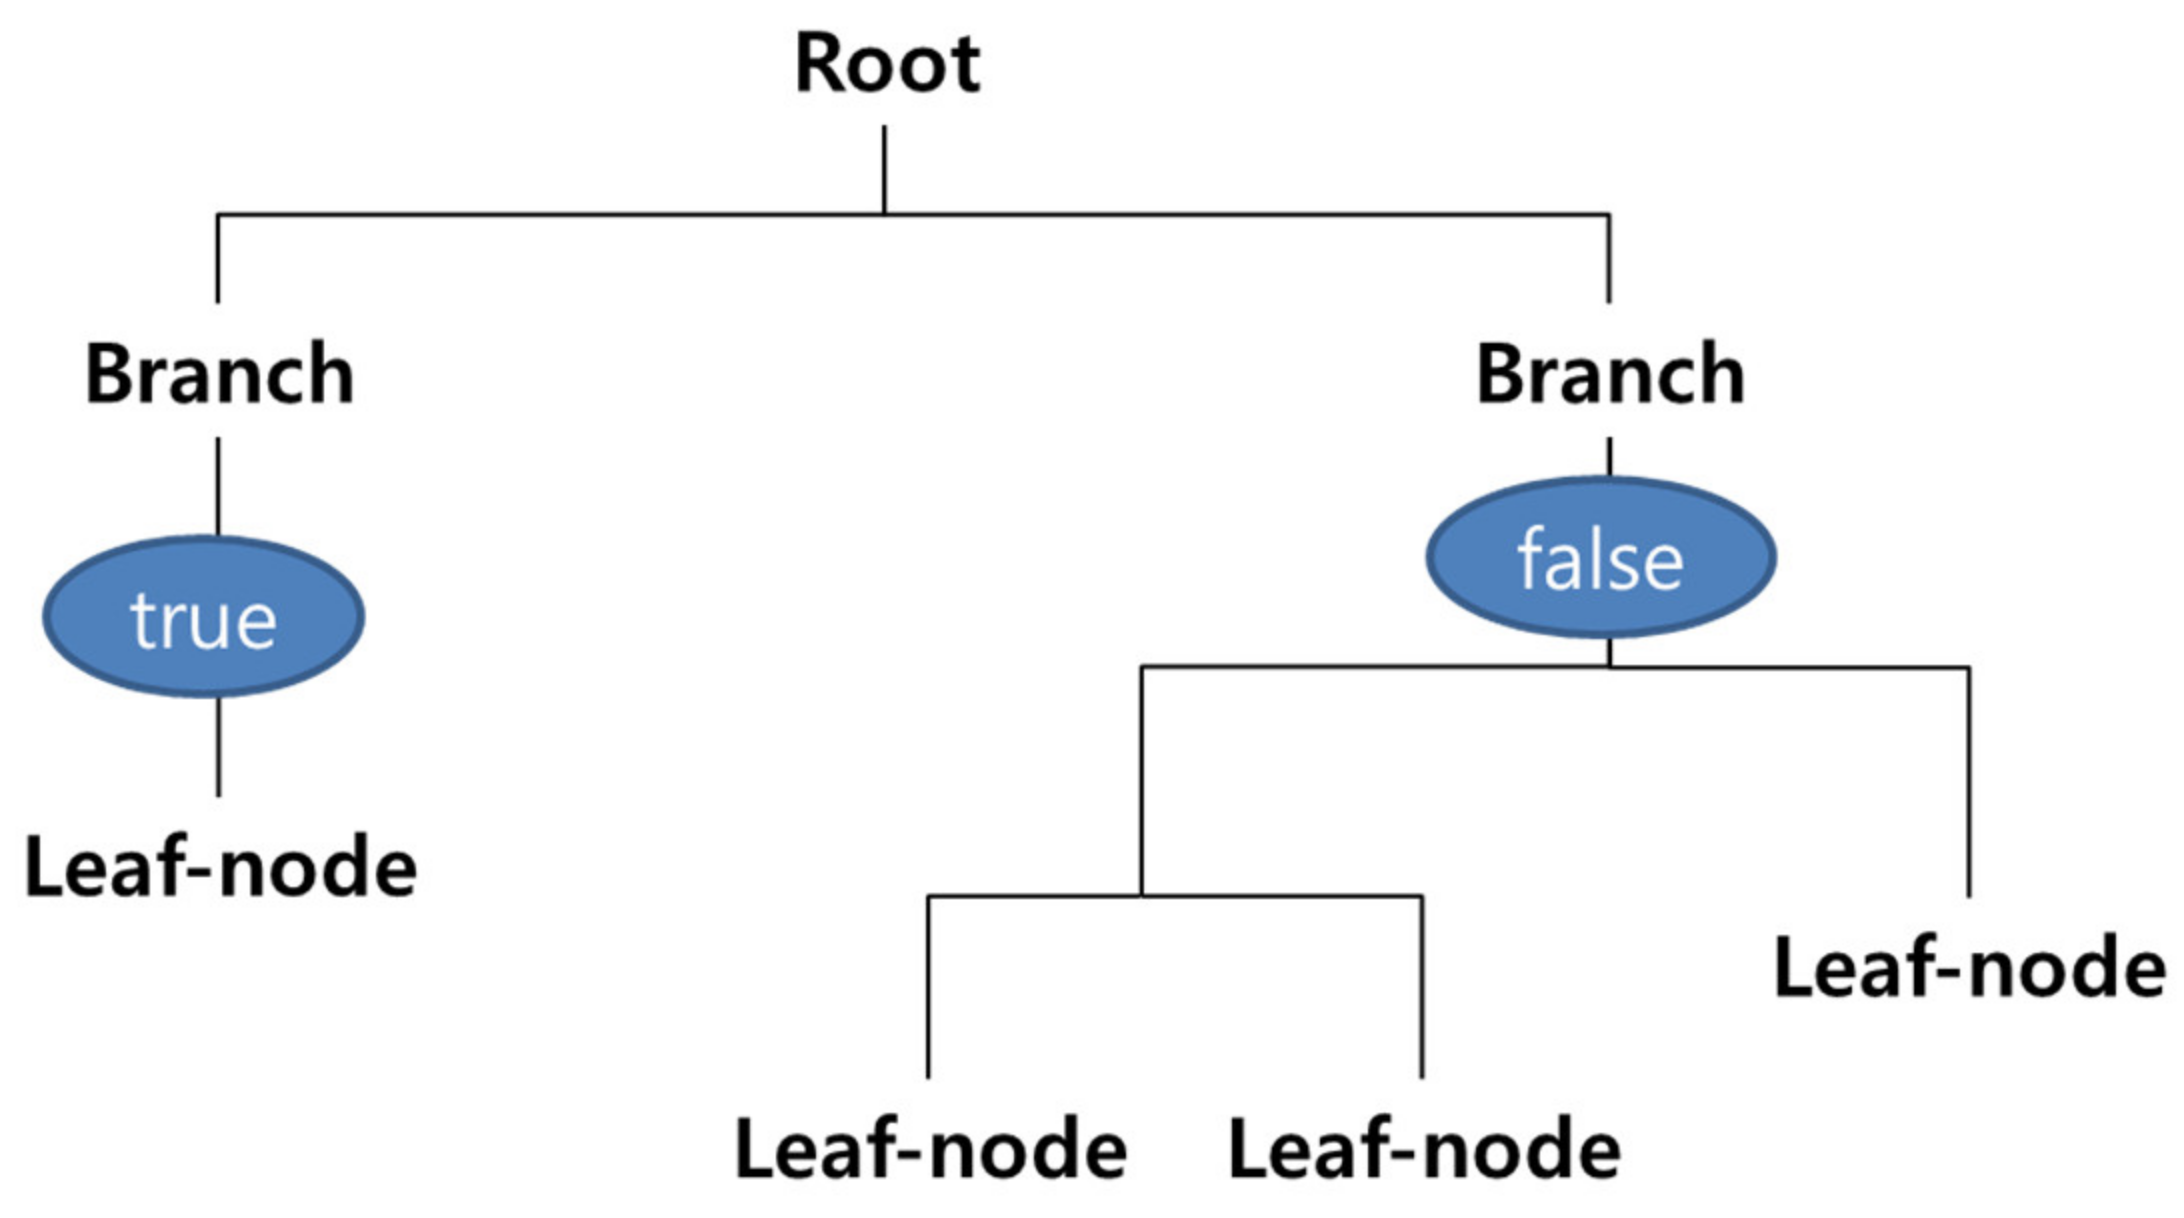
3.3. Maching Learning Technique

The prediction problem by certain variables is called classification problem.
K-Nearest Neighbors (K-NN) is the most intuitive and simple classification method to analyze classification problems. When deciding which data group the sorted data belong to, it is the way to find out which group the K-number closed data most closely resemble and to determine which group of data is sorted by majority judgement (Cover and Hart, 1967). Closed data means that the distance between data is close on the basis of arranged data. Methods to define the distance between data are Euclidean Distance and Manhattan Distance that defines the distance based on the data’s coordinate values and others. To measure the distance of data between variables, the predicted data must be numerical. In addition, when measuring the distances, if the measured units or sizes are different from each other, the distance with a bigger variable has more influence on the distance between data. Normalization of data means setting the minimum and maximum values of a variable to 0 and 1 and converting the variable values between them to values between 0 and 1. Though there is no separate rule to determine K-value that sets the number of near neighbor data values, K, which makes the model most accurate, should be found and set through the data analysis. In general, odd numbers between one to ten are used. If K-value is too small, interference of data (connection of less correlated data) may occur, leading to over analysis. On the other hand, a K-value that is too large can lead to the deduction of model that does not make good use of the data information. In “R”, in order to conduct K-Nearest Neighbor (K-NN), “class” package and K-Nearest Neighbor (K-NN) function need to be utilized.
Decision Tree is the analysis technique that discovers interrelations existing in data. As shown Figure 2, it analyzes data on the basis of an upside-down tree structure. That is, the data are split by setting a variable that serves as a root that divides the data group largely, and establishing whether the judgment on the variable is true or false. Another variable root (branch) is set again to make a final classification of the data. At this point, the data classification that finally reaches the end is called leaf node. The roots and branches are repeatedly divided so that the values of the predictors are grouped with the data groups that are relative to the same. The data that branches off from root to leaf node repeat the re-branch-off process and will eventually be grouped into the group with similar data propensity. The more branches (that is, the more splitting rules), the higher the accuracy of the analysis. However, too many branches make too many types of leaf nodes, so that the predicted size of the analyzed leaf nodes may be down-leveled, which can interfere with prediction. Therefore, in order to make a more accurate prediction model, it is necessary to limit the number of branch and leaf nodes. This is called pruning. Pruning adjusts the size of leaf node by using complexity parameter, which is similar to controlling K-value in K-Nearest Neighbor (K-NN) algorithm. In addition, Decision Tree can track the root and branch of a leaf node that reaches the desired goal, thereby tracking the factors that affect the desired target data group. In other words, it is possible to find out the propensity of the data group, and infer the reason why the target data are derived. In Decision Tree, “C50” package is used in “R”.
Therefore, in this study, K-Nearest Neighbor (K-NN) big data algorithm was applied for the verification of model to analyze the causes of early resignation using “R” analysis program, and the extraction of priority with regard to early resignation was analyzed by applying Decision Tree big data algorithm.

3.4. Subjects

Table 2 shows the current status of employee at company A for 10 years. As shown in Table 2, 290 people are currently employed, and 358 people have retired in 10 years. In this paper, early retirees are classified and analyzed through machine learning. Therefore, early retirees should be classified from the retirees.
As previously defined in this paper, workers who voluntarily resign within a relatively short tenure of less than three years are classified as early retirees. According to this definition, among the 358 employees who retired for 10 years in company A, the number of employees who resigned after serving less than 3 years was classified as 128 people. As a result, among the total personnel data, the number of early retirees was 128, and the total number of employees who were still in service or general retired was 520. This means that among the total 648 data in machine learning, there are 128 tagging data classified as early retirees and 520 data classified as comparative data.
Personnel information items, which are the subjects of machine learning analysis, were extracted from the items written in company A’s personnel database, shown in Table 2. There are 18 related items in the entire personnel database, except for those that are expected to be significantly less relevant, such as resident registration copies and employee numbers.

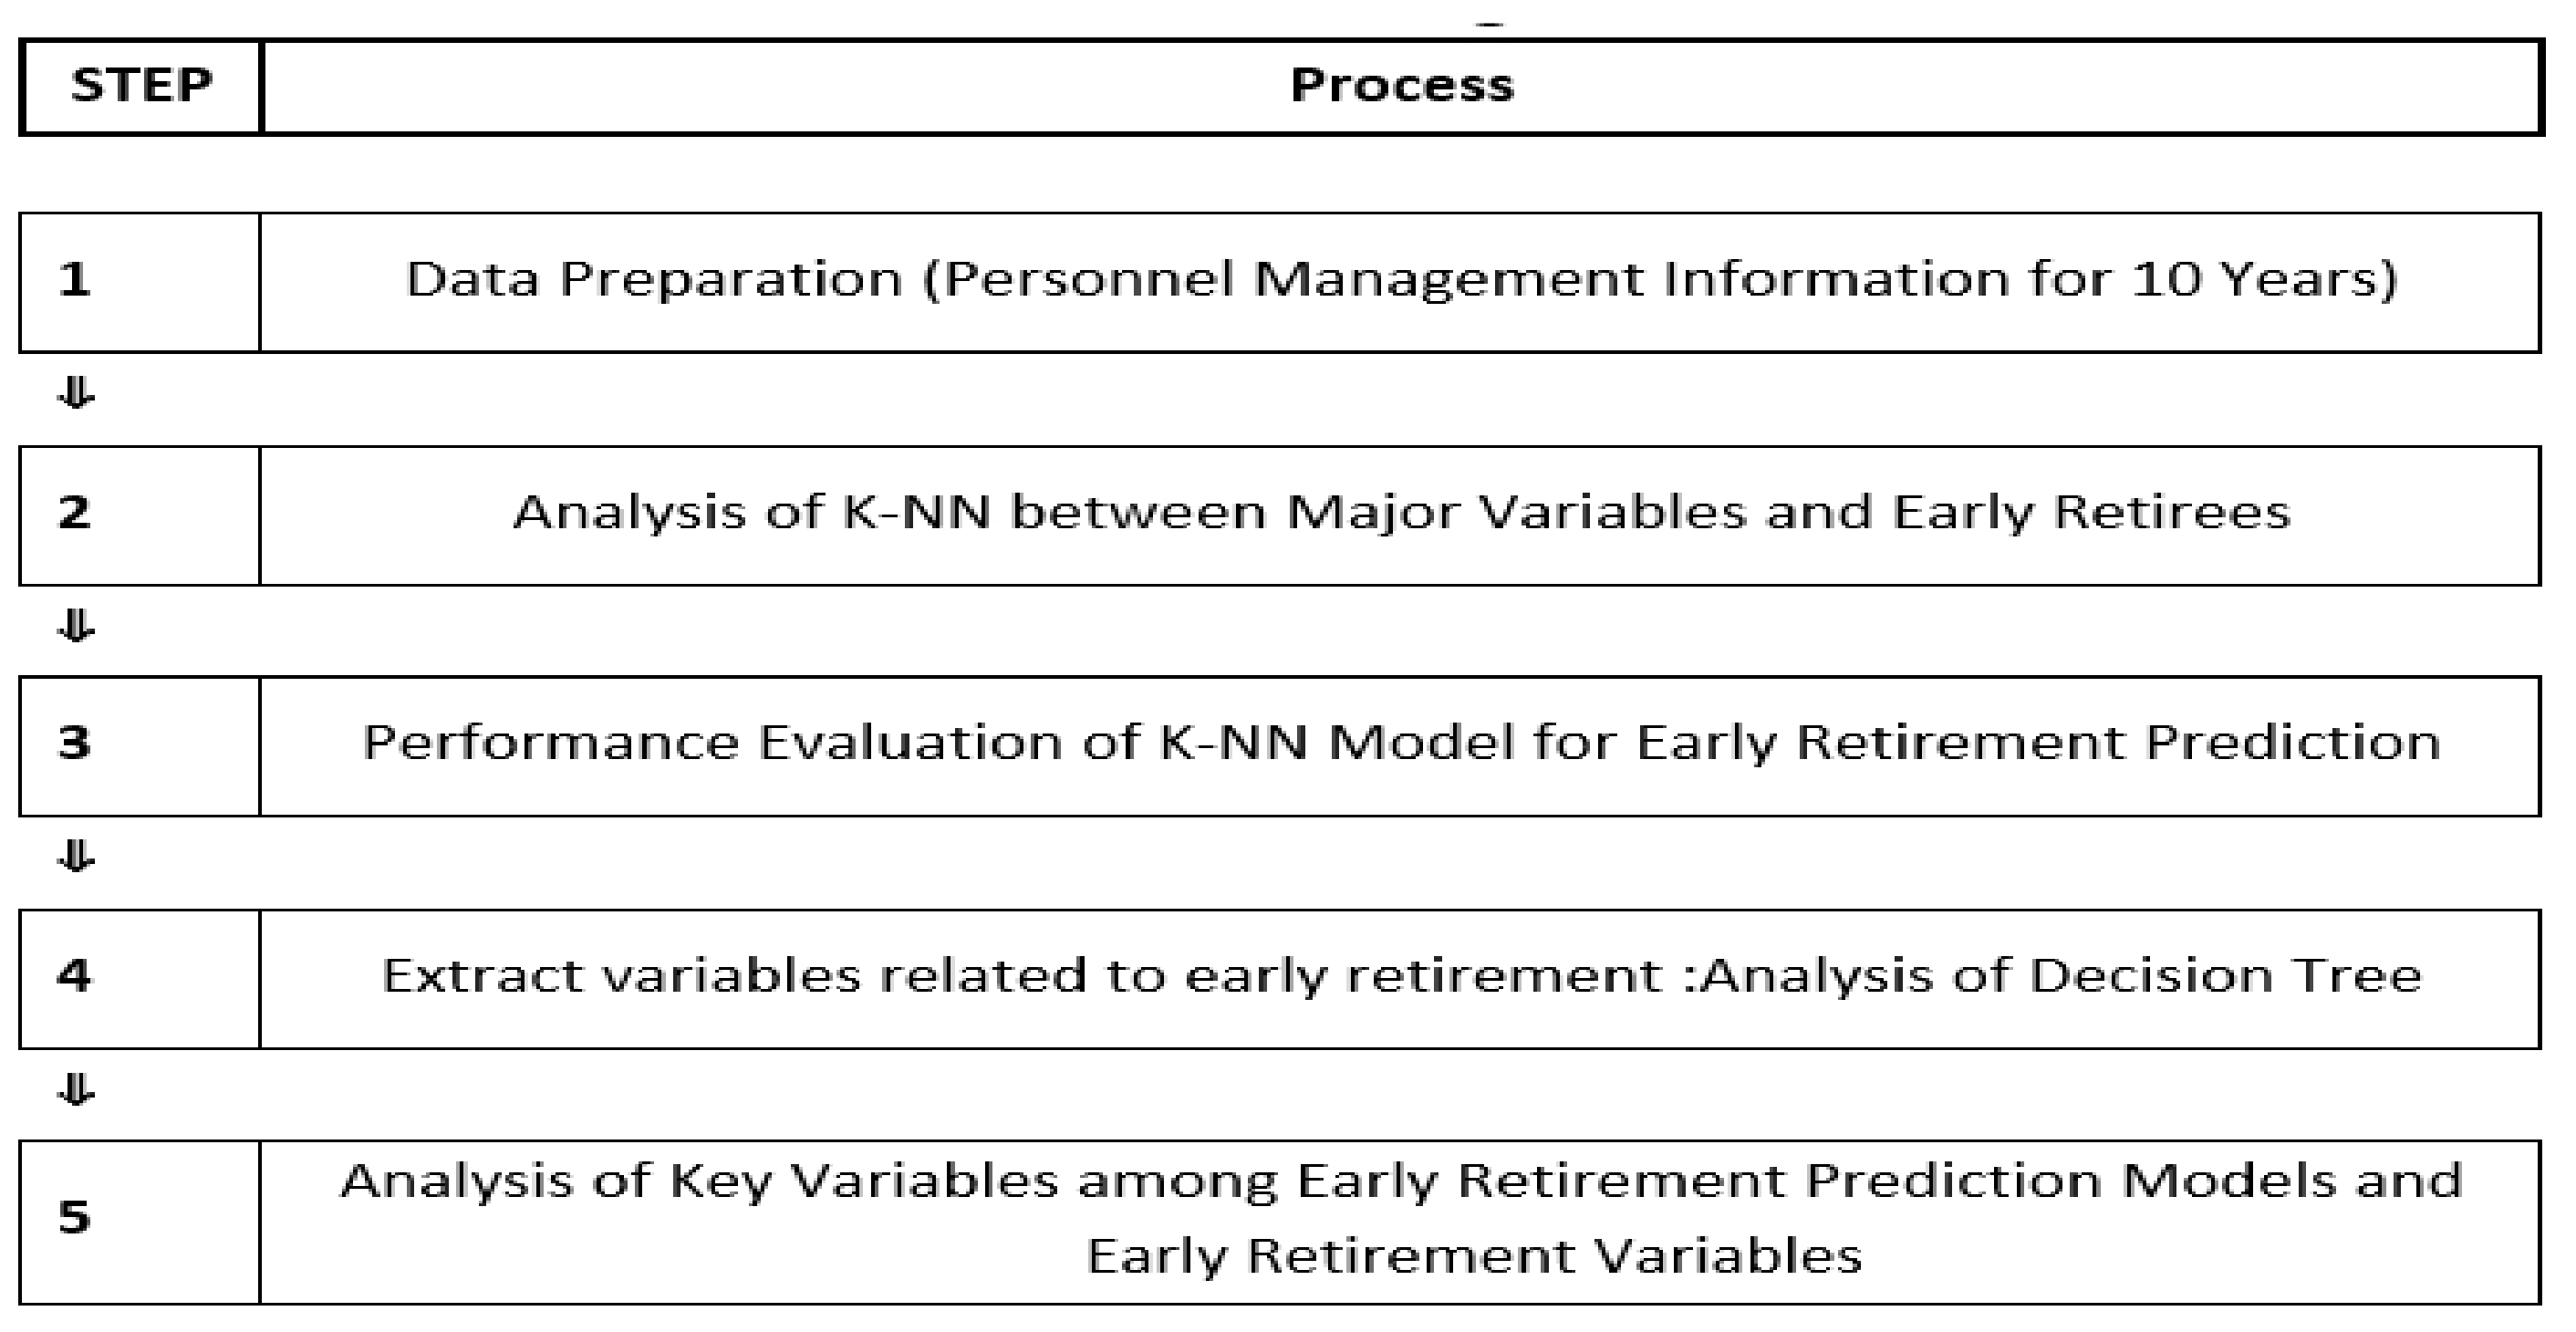
3.5. Analysis Procedure

This aims to predict early retirement through personnel information data by utilizing big data technique. In addition, it is meaningful in that it analyzes the reasons for early resignation from the perspective of HRD, and intends to find out the solution with regard to HRD. For this, the possibility to predict early retirement based on the personnel data through the big data analysis method should be checked first. It is a classification matter whether the employees would resign early or not, so K-Nearest Neighbor (K-NN) can verify the validity. If it is shown that the big data analysis using K-Nearest Neighbor (K-NN) verifies the possibility of prediction of early resignation, other big data verification methods can be applied as well. In other words, after the verification of prediction is conducted, the verification method to analyze the causes of early resignation can be applied, and Decision Tree is suitable for this.
The analysis procedure of this study, as described earlier, is as follows. First, the data of the K-company are collected and converted in order to make them suitable for machine learning. Second, to find the possibility of the prediction of early retirement through personnel data, K-Nearest Neighbor (K-NN) was first applied to see if it was possible. Third, after the possibility of the prediction of early retirement was verified, Decision Tree was applied to analyze the causes of early resignation to trace the causes of the early retirement data group, and the relevant data variables are extracted. Fourth, based on the extracted causes of the early retirement group, its correlation from the perspective of HRD was interpreted. The causes of early resignation and implications in terms of HRD were analyzed. The details of the analysis procedures are shown in Figure 3.

3.6. Data Processing for Big Data Analysis

Pre-processing of personnel information data is important to apply the research method outlined earlier. Both K-Nearest Neighbor (K-NN) and Decision Tree require normalization and standardization of the data, and, to this end, the conversion of normalization for the processing of data among the personnel items set out in Table 3 is shown in Table 4. Data of 648 who used to work or are currently working in the A-company were used for the big data analysis.

4. Results

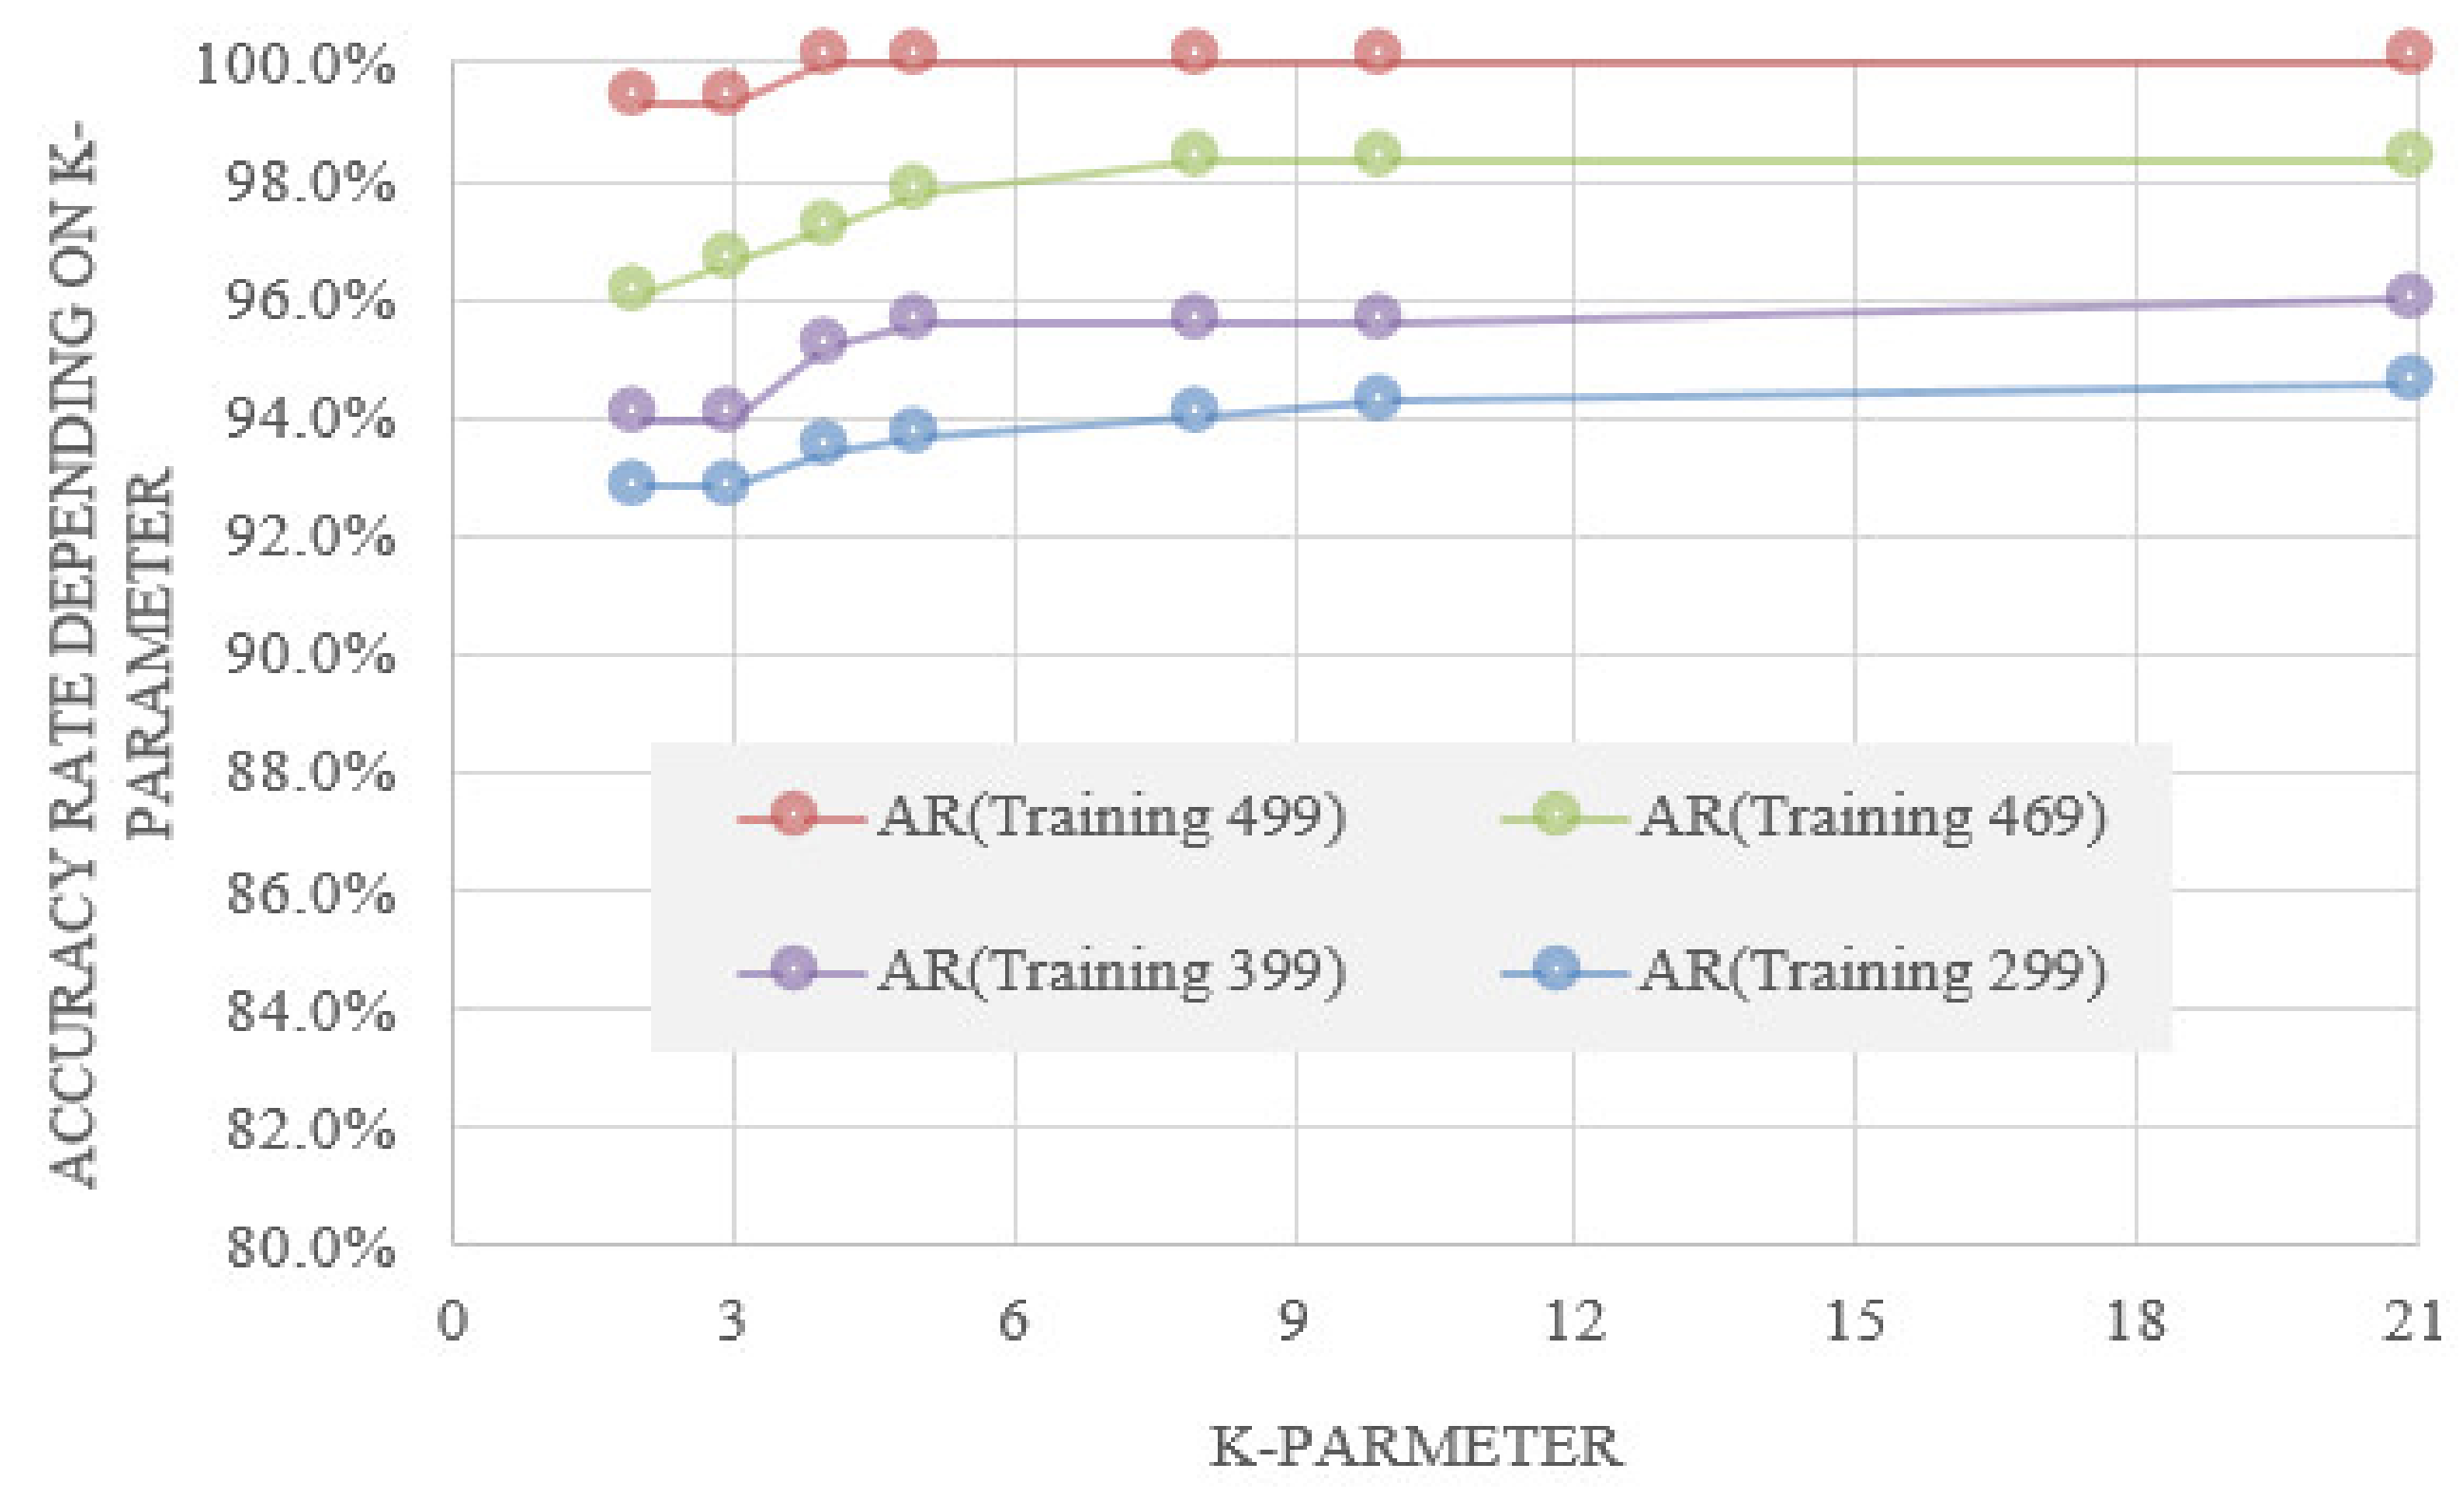
4.1. K-Nearest Neighbor (K-NN) Results

As mentioned above, K-Nearest Neighbor (K-NN) analysis technology is the simplest and most predictable big data analysis method for selecting classification problems. As revealed in the research model and research procedure, K-Nearest Neighbor (K-NN) analysis technology was first applied to confirm whether it is possible to predict the early departure of company A through big data analysis methods. To create an analytical model with all big data analysis methods, training data (Training-Data) was used to create an analytical model, as was test data (to make sure that the analytical model creates a classification well). As shown in Table 5, the accuracy of the analytical model is measured using the truth table. In other words, test data classify non-early leavers by True (T), early leavers by False (F), and accurately predicts what was predicted by T when test data were T and what was predicted by F when test data were F. The one predicted as F when T and the one predicted by T when F are classified as errors, and the accuracy is measured by the ratio when accurately predicted in all test data. For all big data analyses, this accuracy depends on the training data and model parameters used to create the analytical model. In other words, in K-NN, it depends on the training data and K-parameter value.
The outline of the data set for creating the analysis model is summarized in Table 6. As shown in Table 6, after optimizing the K-Nearest Neighbor (K-NN) early leaver analysis model by utilizing multiple Training data and K-parameter values to apply the analysis model, each analysis model is included in all the data. The remaining test data from the K-Nearest Neighbor (K-NN) analysis model confirmed whether the K-Nearest Neighbor (K-NN) analysis model used personnel information to predict early retirement.
The results of accuracy analysis based on each Training data and K-parameter value are shown in Table 7. As shown in Table 7, the K-Nearest Neighbor (K-NN) analysis model using 499 training data has the highest accuracy. However, in this case, the number of test data is small and the reliability of the model accuracy may decrease, and when checking the case where the training data are decreased and the test data are increased, the accuracy compared to the 499 model is decreased, but it is the smallest. It was confirmed that the accuracy of the 299 model for which the training data was written maintains a level of 93% or more. In addition, although there is a difference in accuracy with respect to the K-parameter value, all models show an accuracy of 90% or more. The result of summarizing the accuracy by training data and K-parameter value is shown in Figure 4.
As a result of this analysis, it was confirmed that early leave can be predicted by the K-Nearest Neighbor (K-NN) big data analysis method using personnel information.

4.2. Decision Tree Results

Next, among the big data analysis techniques, big data analysis was performed using a decision tree technique with high functionality from the viewpoint of cause analysis. Since the accuracy and cause analysis may differ for training data even with the decision tree technique, the decision tree model was optimized with different numbers of training data and the accuracy was measured. After that, all the personnel information data held was input to training data, and analysis was performed until the cause of early leaving the company was derived.
By the variable classification of the decision tree, items that are highly related to early leaving of the company are extracted from the personnel information items, and the results are shown in Table 8. In Table 8, the number of years of service with 100% contribution is excluded from the items that cause early leaving because it is a meaningless classification for those who left the company within 3 years, which is the definition standard for early leaving. It can be judged that the top three results of the subsequent personnel information items have a fairly high degree of contribution. In other words, it can be judged that the presence or absence of the article master qualification is associated with the early leaving of the company with a very high probability during the period of recent promotion. As a result, it can be said that those who leave the company early within three years are likely to be promoted recently and are qualified to write articles. It can be inferred that early retirees have a turnover in mind. Furthermore, as a peculiar cause, it was derived that the distance between company A and the worker’s place of residence is related. It can be inferred that the distance of the worker’s place of residence is also a cause of early retirement or turnover.

5. Conclusions and Discussion

This study looked into the possibility of predicting early retirement by utilizing big data analytics targeting the personnel information of company A’s early retirement. It also conducted research to check the relevant items among the personnel information. The results of this study can be summarized into the following three.
First, with big data analytics, it was possible to predict early retirement based on personnel information with a high probability of 98.3%, confirming that the prediction of early retirement using big data analytics was possible.
Second, as a result of big data analysis, it was analyzed that the cause of early leaving the company was the presence or absence of recent promotion and the presence or absence of the article master qualification. It was confirmed that the distance to the house was also related as an additional cause.
The analysis of the third cause of early resignation in the results of this study above confirmed that early retirement of company A were likely to be key personnel where lots of resources were devoted.
The implications of the results above are as follows. First, the cause analysis for HRD problem solving could be identified through big data analytics, and it may be objective data that do not reflect the subjects’ will, thereby securing the objectivity of the cause analysis more than the existing methods. Second, HRD input resources can be efficiently used since the targets can be filtered for HRD problem solving. However, it is worth noting that this analysis is the result of analyzing personnel information data of only one company. Therefore, this method may not be suitable for other companies. However, it can be said that the big data analysis method can be applied to HRD problems such as early retirement prediction.
It means that when company A in this study seeks a solution to solve early resignation, classification of the employees who are expected to resign early through big data, and interviews with the manager will be helpful to find a solution. After this study, a study on solving the response to early retirement should be conducted. Furthermore, since this is a study in South Korea, more useful research results will be derived if compared with studies in other countries.
Our study is to verify the predictive model of early retirees’ responses to work stress and maladjustment to the company by utilizing big data analytics and to extract the reasons for early retirement from the personnel information. First, it was found that among the personnel information items, the ranking of items with high relevance for early retirement was the distance between the company and the residence (first place), the recent promotion history (second place), and whether or not to have the license (third place) out. This result corresponded with the one obtained from the reference data [12,13,32]. It indicates that personnel information items are directly linked to early retirement and correlate with early retirees’ direct early retirement rate.
Second, it was identified that the verification of the predictive model of early retirees based on the personnel information data showed 98% accuracy. This means that early retirement rates can be expected through accurate individual characteristics and information analysis, which is no different from the previous research results [21,22]. The authors are interested in HRD intervention, which is required in the provision of problem-solving solutions involved in the HRM field, based on the labor market context in Korea, which has discriminatory characteristics [13,14].
The issue of early retirement of early experiences focuses on policy and institutional intervention for continuous recruitment. However, this study found that, based on big data, various environments and characteristics are connected. Rather than the difference between high and low values, it is necessary to develop customized human resource management and perspective in consideration of the characteristics and differences of early experiences.
Environmental analysis studies for the continuous work of early experienced people have actually been much discussed in previous studies. This study revealed the reason for early retirement through big data analysis. Follow-up studies on stress coping characteristics, categorization, and measurability analysis are needed to continuously create a healthy organizational culture and appropriate growth of early experiences. Since this study is a study through big data analysis, there is a lack of individual cases, but the representativeness of the sample is secured.
This study can provide accurate evidence based on detailed analysis based on personnel information such as big data on early retirement due to work stress and maladjustment of young people. This can be considered as a great utility in terms of human resource development and organizational management in that it seeks to solve more intensive problems through the appropriate resource input to the appropriate target.

Author Contributions

H.H., conceptualization, analysis, methodology, investigation, resources, data curation, visualization; E.K., conceptualization, original draft preparation, visualization, validation, and writing—review and editing; D.C., conceptualization, review, and project administration. All authors have read and agreed to the published version of the manuscript.

Funding

This research received no external funding.

Institutional Review Board Statement

Not applicable.

Informed Consent Statement

Not applicable.

Data Availability Statement

Not applicable.

Conflicts of Interest

The authors declare no conflict of interest.

References

  1. 7 Out of 10 Employees Are Delaying Their Job Change due to Corona 19! 19 May 2020. Available online: https://www.saramin.co.kr/zf_user/help/live/view?idx=106053&listType=news (accessed on 31 October 2021).
  2. Jeon, H.S.; Wang, E.J. A study on an exit interview process, influencing the withdrawal of a turnover decision: Semiconductor manufacturing plant case. Korean J. Ind. Organ. Psychol. 2014, 27, 805–830. [Google Scholar] [CrossRef]
  3. Kim, Y.P.; Kim, H.J. Predicting Early Retirees Using Personality Data. J. Digit. Contents Soc. 2019, 19, 141–147. [Google Scholar] [CrossRef]
  4. Eom, D.W. The status and causes of Early separation of separation of college graduate newcomers: Focusing on the HRM perspectives. J. Vocat. Educ. Train. 2008, 11, 237–260. [Google Scholar] [CrossRef]
  5. Song, Y.S. A Study on Defining Strategic Human Resource Development (SHRD) Domains and Tasks in large Korean enterprises. J. Corp. Educ. Talent. Res. 2009, 11, 75–98. Available online: https://www-riss-kr.oca.korea.ac.kr/link?id=A103798228 (accessed on 31 October 2021).
  6. Kwon, D.B.; Cho, D.Y. HRD Expert Armed with a System Approach. In HRD Essence, 1st ed.; Woo, S., Bae, K., Ian, J., Eds.; Parkyoungsa: Korea, Seoul, 2013; pp. 4–5. [Google Scholar]
  7. Chung, D.B. Major factors affecting turnover intention of college graduates: Comparison and analysis according to regular workers quarterly. J. Labor Policy 2019, 19, 93–127. Available online: http://www.dbpia.co.kr/journal/articleDetail?nodeId=NODE09229114 (accessed on 31 October 2021).
  8. Jang, Y.H.; Kim, T.S. Study on the Determinants of Early Retirement: Focusing on Early Retirees at the Seongseo Industrial Complex in Daegu. J. Daegu Gyeongbuk Dev. Inst. 2019, 18, 1–22. [Google Scholar] [CrossRef]
  9. Park, E.S.; Oh, K.T.; Lee, M.J. The Effect of Job Satisfaction and Wage Level on Turnover Intention: Focusing on Moderating Effect of Trust. Korea Corp. Manag. Rev. 2017, 24, 1–19. [Google Scholar] [CrossRef]
  10. Park, J.S.; Hwang, H.S. The Application of Regionalization Learning through Big Data Analysis of Space and place. Sungshin Women’s Univ. Educ. Res. Inst. 2018, 73, 129–149. [Google Scholar] [CrossRef]
  11. Jones, W. Personal Information Management; Information Science and Technology, Chapter 10; Willy: California, CA, USA, 2009; pp. 453–504. [Google Scholar] [CrossRef]
  12. Rhee, J.H. An Exploratory Study about Justice Perceptions in Early Retirement Plans and its Effects on the Consequence. J. Hum. Resour. Manag. 2002, 26, 67–88. Available online: https://scholar-dkyobobook-co-kr.oca.korea.ac.kr/searchDetail.laf?barcode=4030008012994 (accessed on 31 October 2021).
  13. Kwon, S.I. The Empitical Study on Influencing Factor of Employee’s Preretirement Decision: Emphasis on The Employees of The Banking Industries in Pusan. Silla Univ. J. 1996, 41, 39–72. Available online: https://www-riss-kr.oca.korea.ac.kr/link?id=A2051109 (accessed on 31 October 2021).
  14. Kim, J.W.; Soo, S.K. A Study on Antecedents of Early Retirement, A Comparison with Turnover. J. Korea Adult Hum. Resour. Manag. 2015, 22, 207–223. [Google Scholar] [CrossRef]
  15. MZ Generation Has Many Early Retirements within a Year. Determined within an Average of 5 Months after Joining the Company. Available online: https://www.fnnews.com/news/202106020840283018 (accessed on 2 June 2021).
  16. Cho, B.S. A Study on the Factors Influencing Voluntary Turnovers of the Employees in Physical Education and Athletic Organizations. Master’s Thesis, Seoul University, Seoul, Korea, 1997. Available online: https://www-riss-kr.oca.korea.ac.kr/link?id=T707043 (accessed on 31 October 2021).
  17. Lee, S.H. The Present Status of EIS in Regards to Domestic and International Companies in Korea. Master’s Thesis, Korea University, Seoul, Korea, 2004. Available online: https://www-riss-kr.oca.korea.ac.kr/link?id=T9553950 (accessed on 31 October 2021).
  18. Kim, S.Y.; Chang, W.S.; Kim, M.Y. Canonical correlations analysis between organizational adaptation variables and individual characteristics, structural, learning experiences at work variables for college graduate early careers. J. Koreans Educ. 2007, 26, 141–164. [Google Scholar]
  19. Lee, Y.M.; Lim, J.Y. A Research on Influential Factors Impacting the Turnover of Newcomers and the Outcomes of Successful Turnover. Korea Corp. Manag. Rev. 2010, 12, 129–153. Available online: https://www-riss-kr.oca.korea.ac.kr/link?id=A103798568 (accessed on 31 October 2021).
  20. Park, J.H.; Ru, S.J. Turnover intention and turnover behavior of early college graduates: Analysis of the influence of individual characteristics, job satisfaction, and organizational structural factors. Korean Sociol. Assoc. 2008, 2008, 853–871. Available online: https://www.dbpia.co.kr/Journal/articleDetail?nodeId=NODE01689913 (accessed on 31 October 2021).
  21. Kim, E.S.; Jung, C.Y. The Role of General Characteristics and Job Satisfaction in voluntary Turnover Process. J. Eng. Educ. Res. 2010, 23, 107–122. [Google Scholar]
  22. Lee, M.K. A Study on the Influential Factors Affecting Turnover Intention of Early Career of Graduates. J. Korean Soc. Study Career Educ. 2013, 26, 61–81. [Google Scholar]
  23. Beecroft, P.C.; Dorey, F.; Wenten, M. Turnover intention in new graduate nurses: A multivariate analysis. J. Adv. Nurs. 2008, 62, 41–52. [Google Scholar] [CrossRef] [Green Version]
  24. Park, S.Y.; Song, Y.S. Different perceptions on college-graduated employee’s competency: HRD practitioners vs. college student. J. Corp. Educ. Talent. Res. 2008, 10, 27–45. [Google Scholar]
  25. Hong, S.J.; Jyung, C.Y. The relationship among Work Adjustment, Individual Characteristics and Organizational Characteristics of Newcomers. J. Agric. Educ. Hum. Resour. Dev. 2015, 47, 125–151. [Google Scholar] [CrossRef]
  26. Lee, S.Y.; Park, C.W.; Lee, M.R. Exploration on the Young Employee’s Labor Mobility. J. Eng. Educ. Res. 2014, 17, 30–45. [Google Scholar] [CrossRef]
  27. Lee, C.S. Survey on the Status of Employee Turnover: Employee Turnover and Corporate Countermeasures. Hyundai Economic Research Institute. 2007. Available online: http://www.fki.or.kr/Common/Download.aspx?id=5bd0811c-1930-4ec3-b7d6-5f8c2cfab63c (accessed on 31 August 2021).
  28. Research on the Status of New College Graduates Leaving Early and Corporate Response. 7 June 2011. Available online: http://www.korcham.net/nCham/Service/Economy/appl/KcciReportDetail.asp?SEQ_NO_C010=20110607001&CHAM_CD=B001 (accessed on 31 October 2021).
  29. Bae, P.S. Exploring the Components of the Employment Support Program at the University Related to the Early Separation of College Graduate Newcomers. Master’s Thesis, Haiyang University, Seoul, Korea, 2017. Available online: hdl.handle.net/20.500.11754/33201 (accessed on 31 October 2021).
  30. The Korea Employer’s Federation. Investigation of the Status of Recruitment of New Employees. 2016. Available online: https://www.kefplaza.com/web/pages/gc79582b.do?bbsFlag=View&bbsId=0001&nttId=5023 (accessed on 31 October 2021).
  31. Yun, B.R. HR Analytics Applying Machine Learning for Retention Classification. Master’s Thesis, Seoul University, Seoul, Korea, 2020. Available online: https://s-space.snu.ac.kr/handle/10371/166997?mode=full (accessed on 31 October 2021).
  32. Kim, E.B. An Educational Study on the Failure Process of Re-employment of University Graduates with Resignation Experience. Korean Hum. Resour. Dev. Strategy 2018, 13, 77–107. [Google Scholar] [CrossRef]
Figure 1. Research Model.
Sustainability 14 00434 g001
Figure 2. Decision Tree Structure.
Sustainability 14 00434 g002
Figure 3. Process for conducting research.
Sustainability 14 00434 g003
Figure 4. Accurate rate depending on K-parameters with various training data.
Sustainability 14 00434 g004
Table 1. Research Trends on the Causes of Early Retirement [29].
ResearchersResearch Results
1. Um Dong-wook [7]Working conditions, including promotion, remuneration, working hours, and prospects caused them to leave the first company.
2. Lee Seok-yeol, Park Cheol-woo, Lee Mi-ra [26]Men were 10 percent more likely to maintain their first job than women, and the cause of their first year’s separation was shown as a result of salary, major mismatch, and wage welfare factors.
3. Lee Young-min, Lim Jeong-yeon [19]The reason for preparing for the separation was not feeling rewarded for work and dissatisfaction with wages and working conditions. Additionally, job satisfaction, salary, major, etc. were the factors that affected the job.
4. Lee Cheol-sun [27]Psychological factors such as low assessment of oneself and possibility of self-improvement appear to be the main reasons for the separation of jobs.
5. Korea Chamber of Commerce and Industry [28]Problems such as discordance of major and aptitude, dissatisfaction with rewards, dissatisfaction with working conditions, failure in adjusting to organizational culture, problems of promotion and career development, and conflicts in human relations at work appear as reasons for early separations.
6. The Korea Employer’s Federation [30]Failure to adapt to the organization and duties, dissatisfaction with salary and benefits, dissatisfaction with working area and working environment, and preparation for employment at public officials and public corporations were the reasons for early separations.
Table 2. Status of personnel information for company A for 10 years.
TotalCurrent EmployeeRetired Person *Early Retirement Person **
648290358128
* retired person: All retirees for personal reasons, turnover, transfer of jobs, expiration of contract period, dismissal, academic affairs, appointment of executive officers, start-ups, and dismissal. ** early retirement person: The number of employees who left within three years of joining the company. (No reason for retirement is considered.).
Table 3. Personnel Information Item.
NoPersonnel Information ItemNoPersonnel Information Item
1Gender10Career at other companies
2Age11Single or married
3Age when he or she resigns12With or without children
4Reason for Resignation *13Distance between residence and company
5Position14Work period after promoted
6Final salary15Union membership status
7Highest level of education attained16Length of service
8Whether having professional engineer license or not17Series of class
9Whether having foreign language certificate or not18Whether having engineer license or not
* Reason for resignation: It is the reason for resignation stated by the retirement himself as specified in Table 3 and is distinguished from the reason for resignation due to internal causes that this study intends to find out.
Table 4. Normalized personnel information items (coded).
NoPersonnel DataNormalizationRemark
1GenderMale = 0, Female = 1Convert the number data of the item into a relative number between 0.0~1.0
2AgeAge number between 0~100
3Retirement ageRetirement age number between 0~100
4Reason for retirementReason for retirement is used as a tagging data to distinguish early retirees, setting early retirees to 0, and others to 1
5PositionSet by rank (Set as value between 0~3 for Contractor, Specialist, General employee, Executive)
6Final salary classSalary class number between 0~100
7Final educational degreeSet by rank (Set as value for middle school graduate ~ Ph. D graduate. Middle school graduate as 0.4, high school graduate as 1, undergraduate as 2, graduate as 3, Ph. D as 3)
8Technical licensesSet status of licensing as 0, 1
9Foreign language abilitySet foreign language ability as 0, 1
10Experience in other
companies
Set as the number of companies worked for prior to current employment
11MarriageSet marriage status as 0, 1
12ChildrenSet as number of children as 0, 1
13Residence and distance to companySet as the linear distance from the residence indicated in the personnel data to current employment
14Workdays after promotionSet as number of days after promotion
15Registry in labor unionSet status of registration as 0 or 1
16Total years workedSet as total number of years worked
17Job groupSet technical job groups as 0, administrative job groups as 1
18Engineering licensesSet status of licensing as 0, 1
Table 5. A Truth table for measuring the accuracy of K-Nearest Neighbor (K-NN) analytical model.
RemarkT
(Predicting as Non-Early Retirement)
F
(Predicting as Early Retirement)
T
(Real Non-early retirement)
T-T → Accurate
(Predicting non-resigner
as non-early- retirement)
T-F → Error
(Predicting early-resigner
as non-early- retirement)
F
(Real early retirement)
T-F → Error
(Predicting non-resigner
as early- retirement)
F-F → Accurate
(Predicting early-resigner
as early- retirement)
Table 6. Data set overview for K-Nearest Neighbor (K-NN) analysis.
ClassificationNumber of Content
Full Data648
Personnel Information18
Employees520
Early Retirees128
Training Data299, 399, 469, 499
Test Data349, 249, 179, 149
K-Value2, 3, 4, 5, 8, 10, 21
Table 7. K-Nearest Neighbor (K-NN) analysis results with various training data and K-parameter values.
Training DataTest DataKT-TT-FF-TF-FError RateAccurate Rate
49914921450130.7%99.3%
31451030.7%99.3%
41450040.0%100.0%
51450040.0%100.0%
81450040.0%100.0%
101450040.0%100.0%
211450040.0%100.0%
469179215552173.9%96.1%
315642173.4%96.6%
415641182.8%97.2%
515731182.2%97.8%
815821181.7%98.3%
1015821181.7%98.3%
2115821181.7%98.3%
3992492197114376.0%94.0%
319996356.0%94.0%
420266354.8%95.2%
520265364.4%95.6%
820265364.4%95.6%
1020265364.4%95.6%
2120355364.0%96.0%
2993492269169557.2%92.8%
32701510547.2%92.8%
42741112526.6%93.4%
5272139556.3%93.7%
8273129556.0%94.0%
10276911535.7%94.3%
21275109555.4%94.6%
Table 8. Decision tree methodology on personnel data for the level of contribution to early retirement of person.
RemarkTraining Data 400,
Test Data 248
AR = 95.1%
Training Data 555,
Test Data 93
AR = 95.7%
Training Data 647,
Test Data 1
AR = 100.0%
Relevance Factor
(Relevance index)
1. Working years (100.0%)1. Working years (100.0%)1. Working years (100.0%)
2. Period after Promotion (54.75%)2. Certificate of Tech Master (53.51%)2. Certificate of Tech Master (53.63%)
3. Certificate of Tech Master (51.50%)3. Period after promotion (53.51%)3. Period after promotion (53.63%)
4. Position (45.50%)4. Distance (42.34%)4. Distance (42.81%)
5. Working day (44.25%)5. Position (38.38%)5. Union (40.96%)
6. Distance (15.75%)6. Sex (15.14%)6. Position (40.03%)
7. Salary Class (14.25%)7. Salary class (14.05%)7. Salary class (28.13%)
8. Sex (13.25%)8. Career experience (6.49%)8. Education degree (14.84%)
9. Education degree (4.50%)9. Certificate of Tech (5.95%)9. Age (12.36)
10. Certificate of Tech (3.25)10. Age (3.96%)10. Sex (10.82%)
Publisher’s Note: MDPI stays neutral with regard to jurisdictional claims in published maps and institutional affiliations.

