
Implications of COVID-19 Mitigation Policies for National Well-Being: A Systems Perspective

 ,
, 
Abstract
1. Introduction
2. A Brief Overview of the Notion of Well-Being
3. A Systems Approach to Well-Being
4. Impacts of COVID-19 Mitigation Policies on National Well-Being
4.1. Causal Loop Diagram of the National Well-Being System
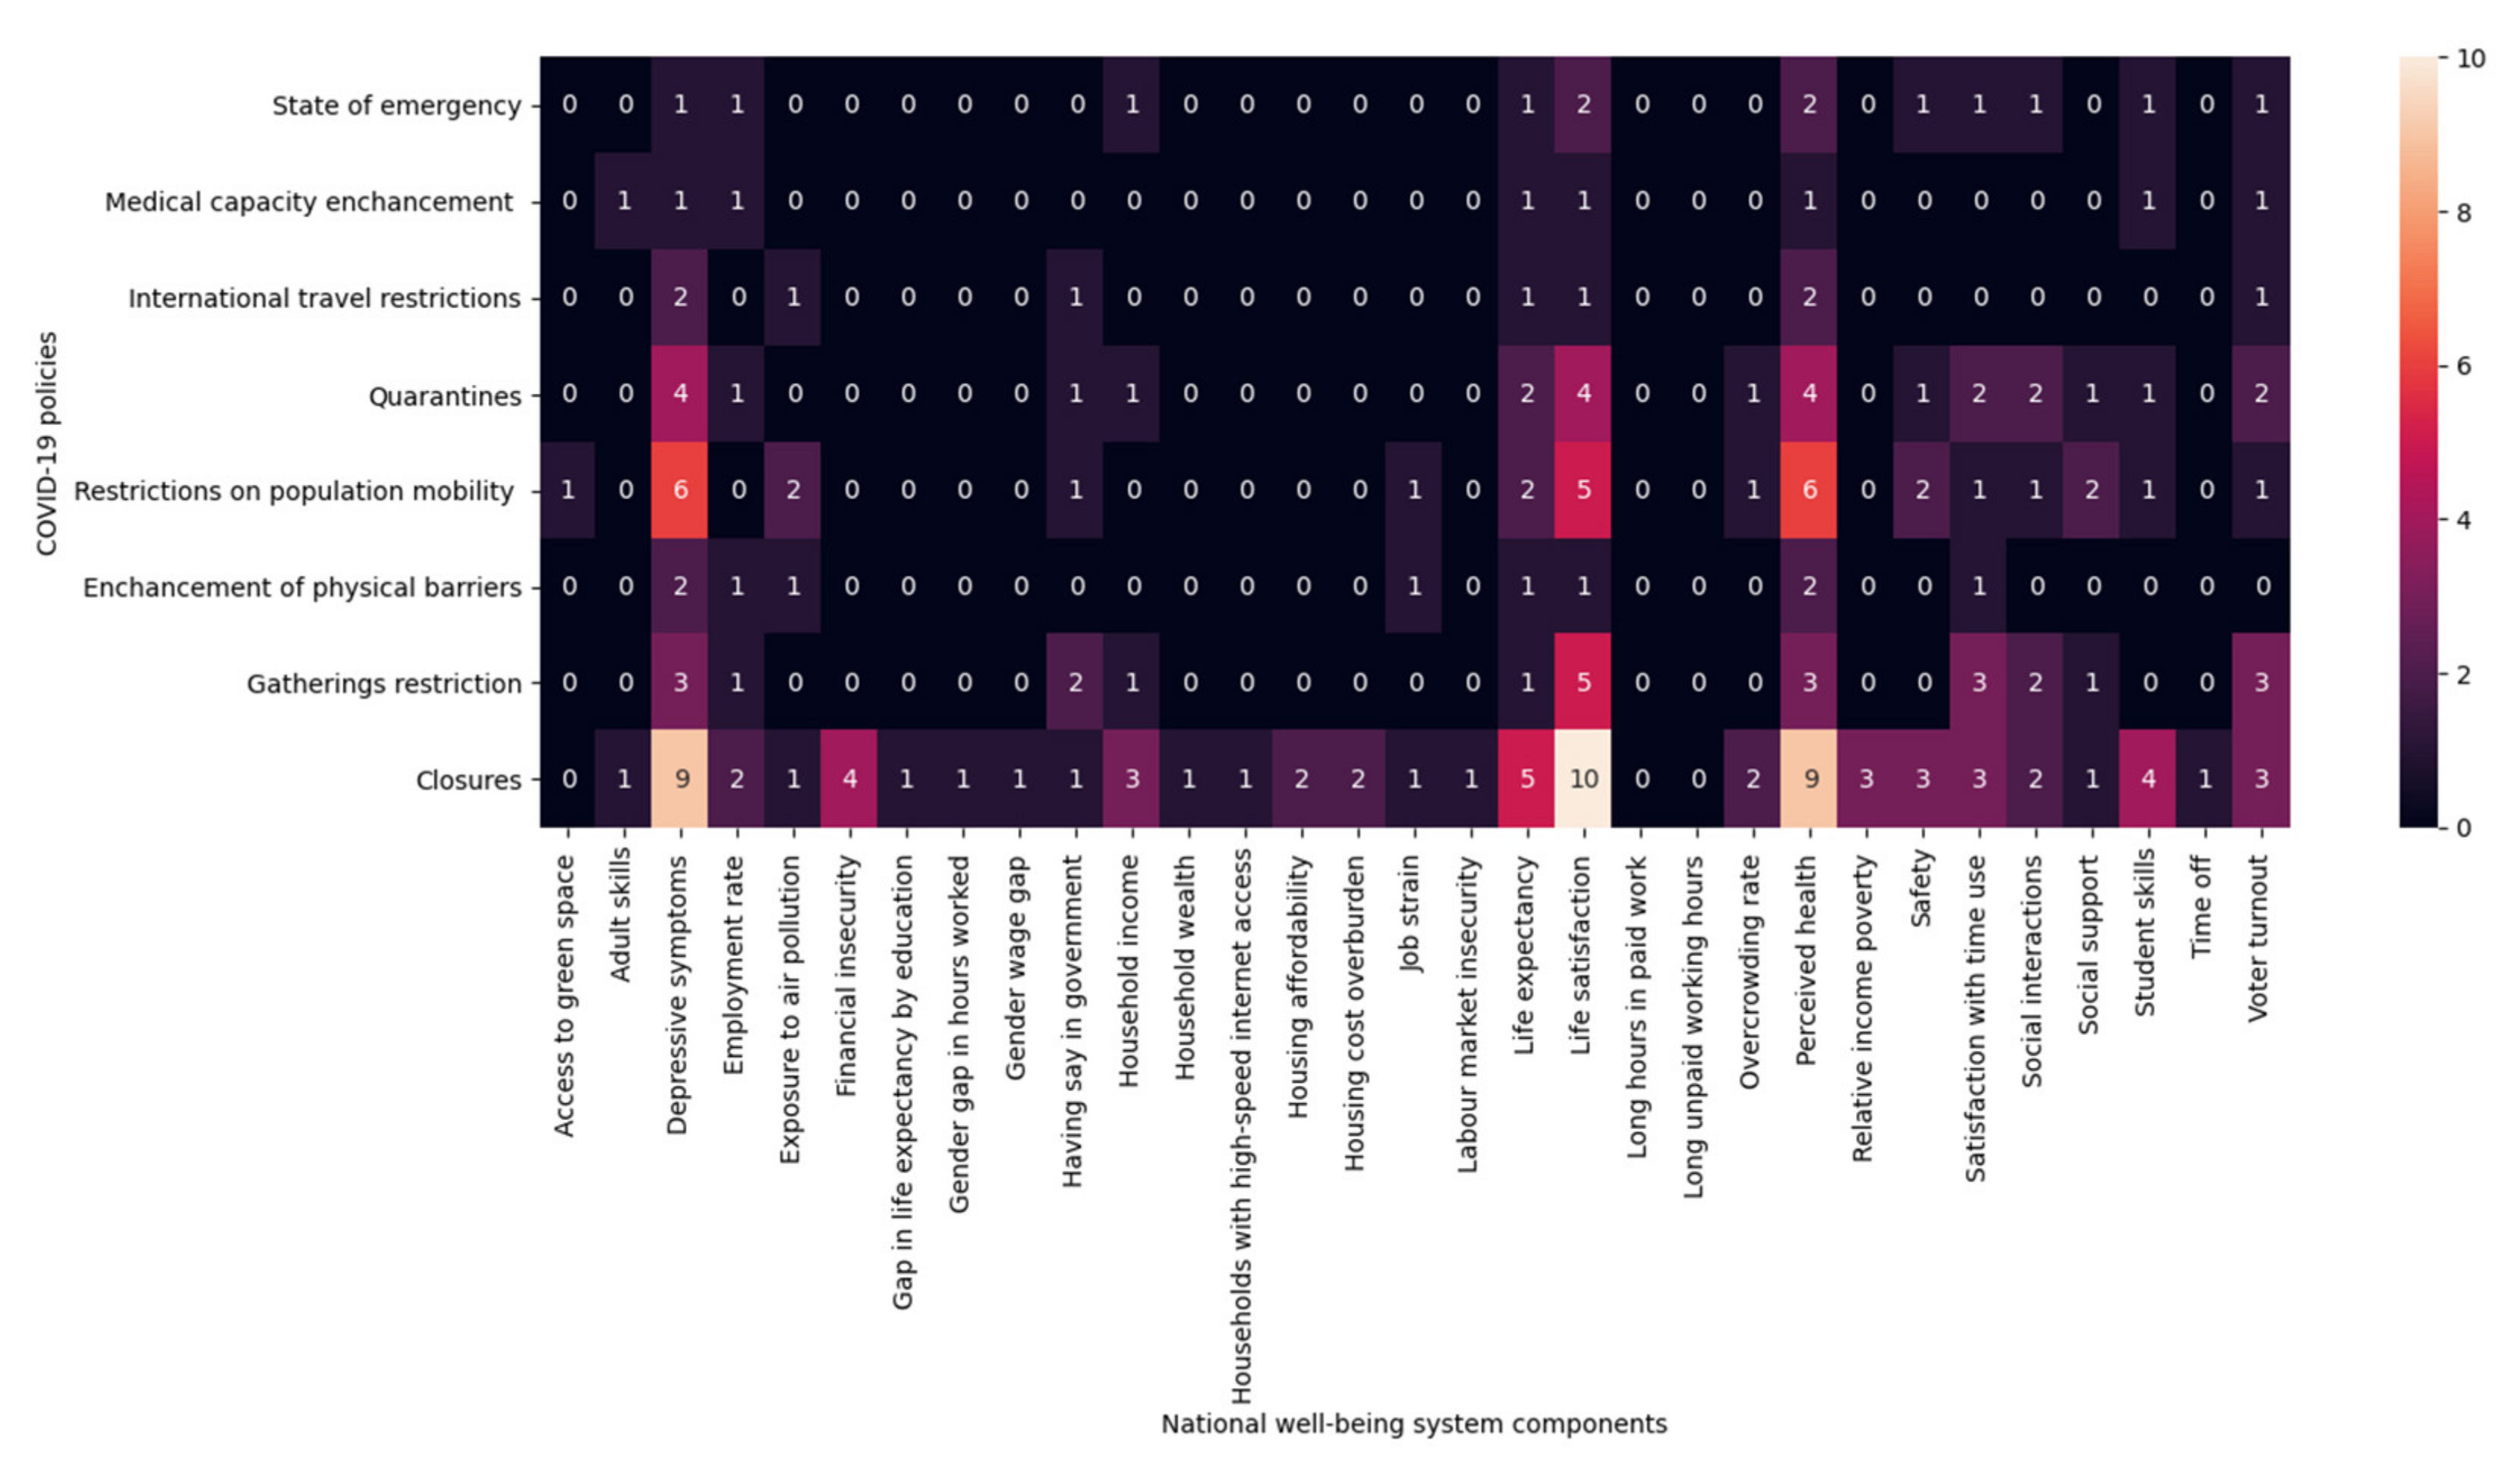
4.2. Identifying the Impact of COVID-19 Mitigation Policies on the National Well-Being System
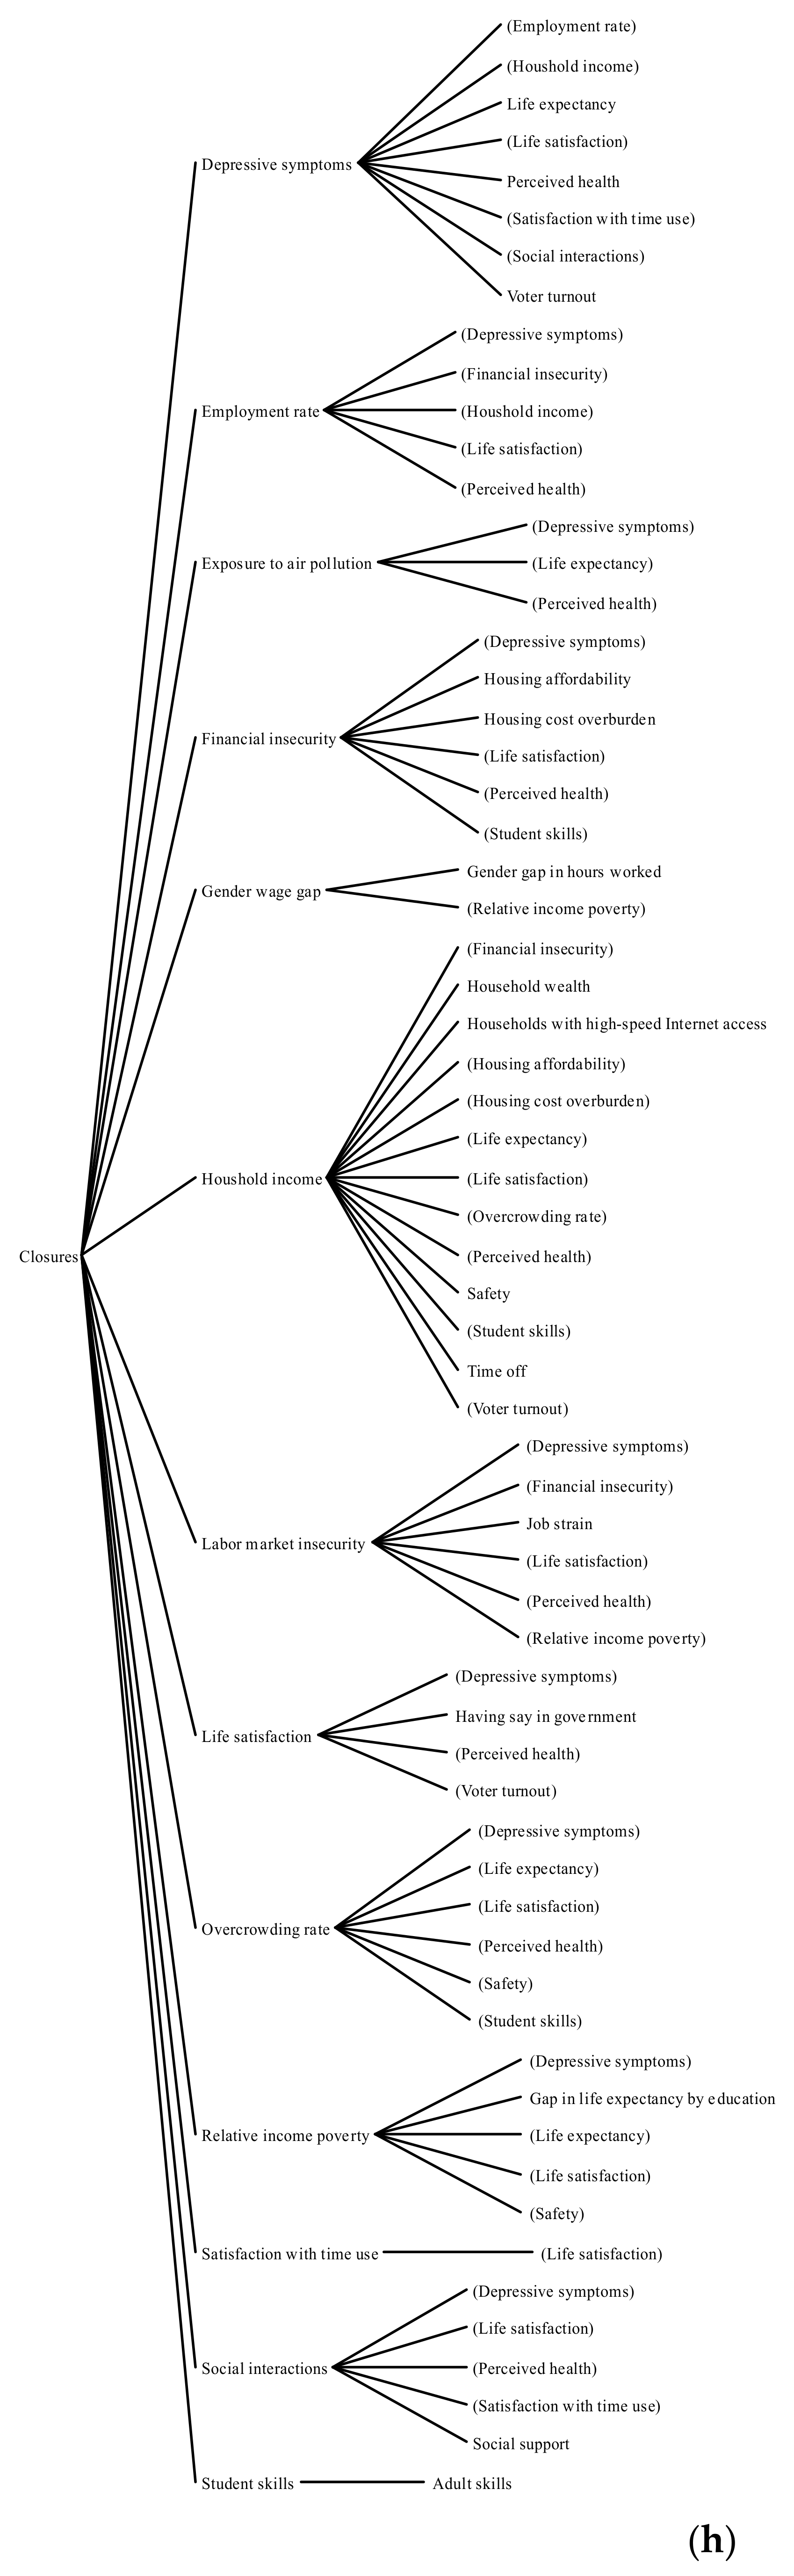
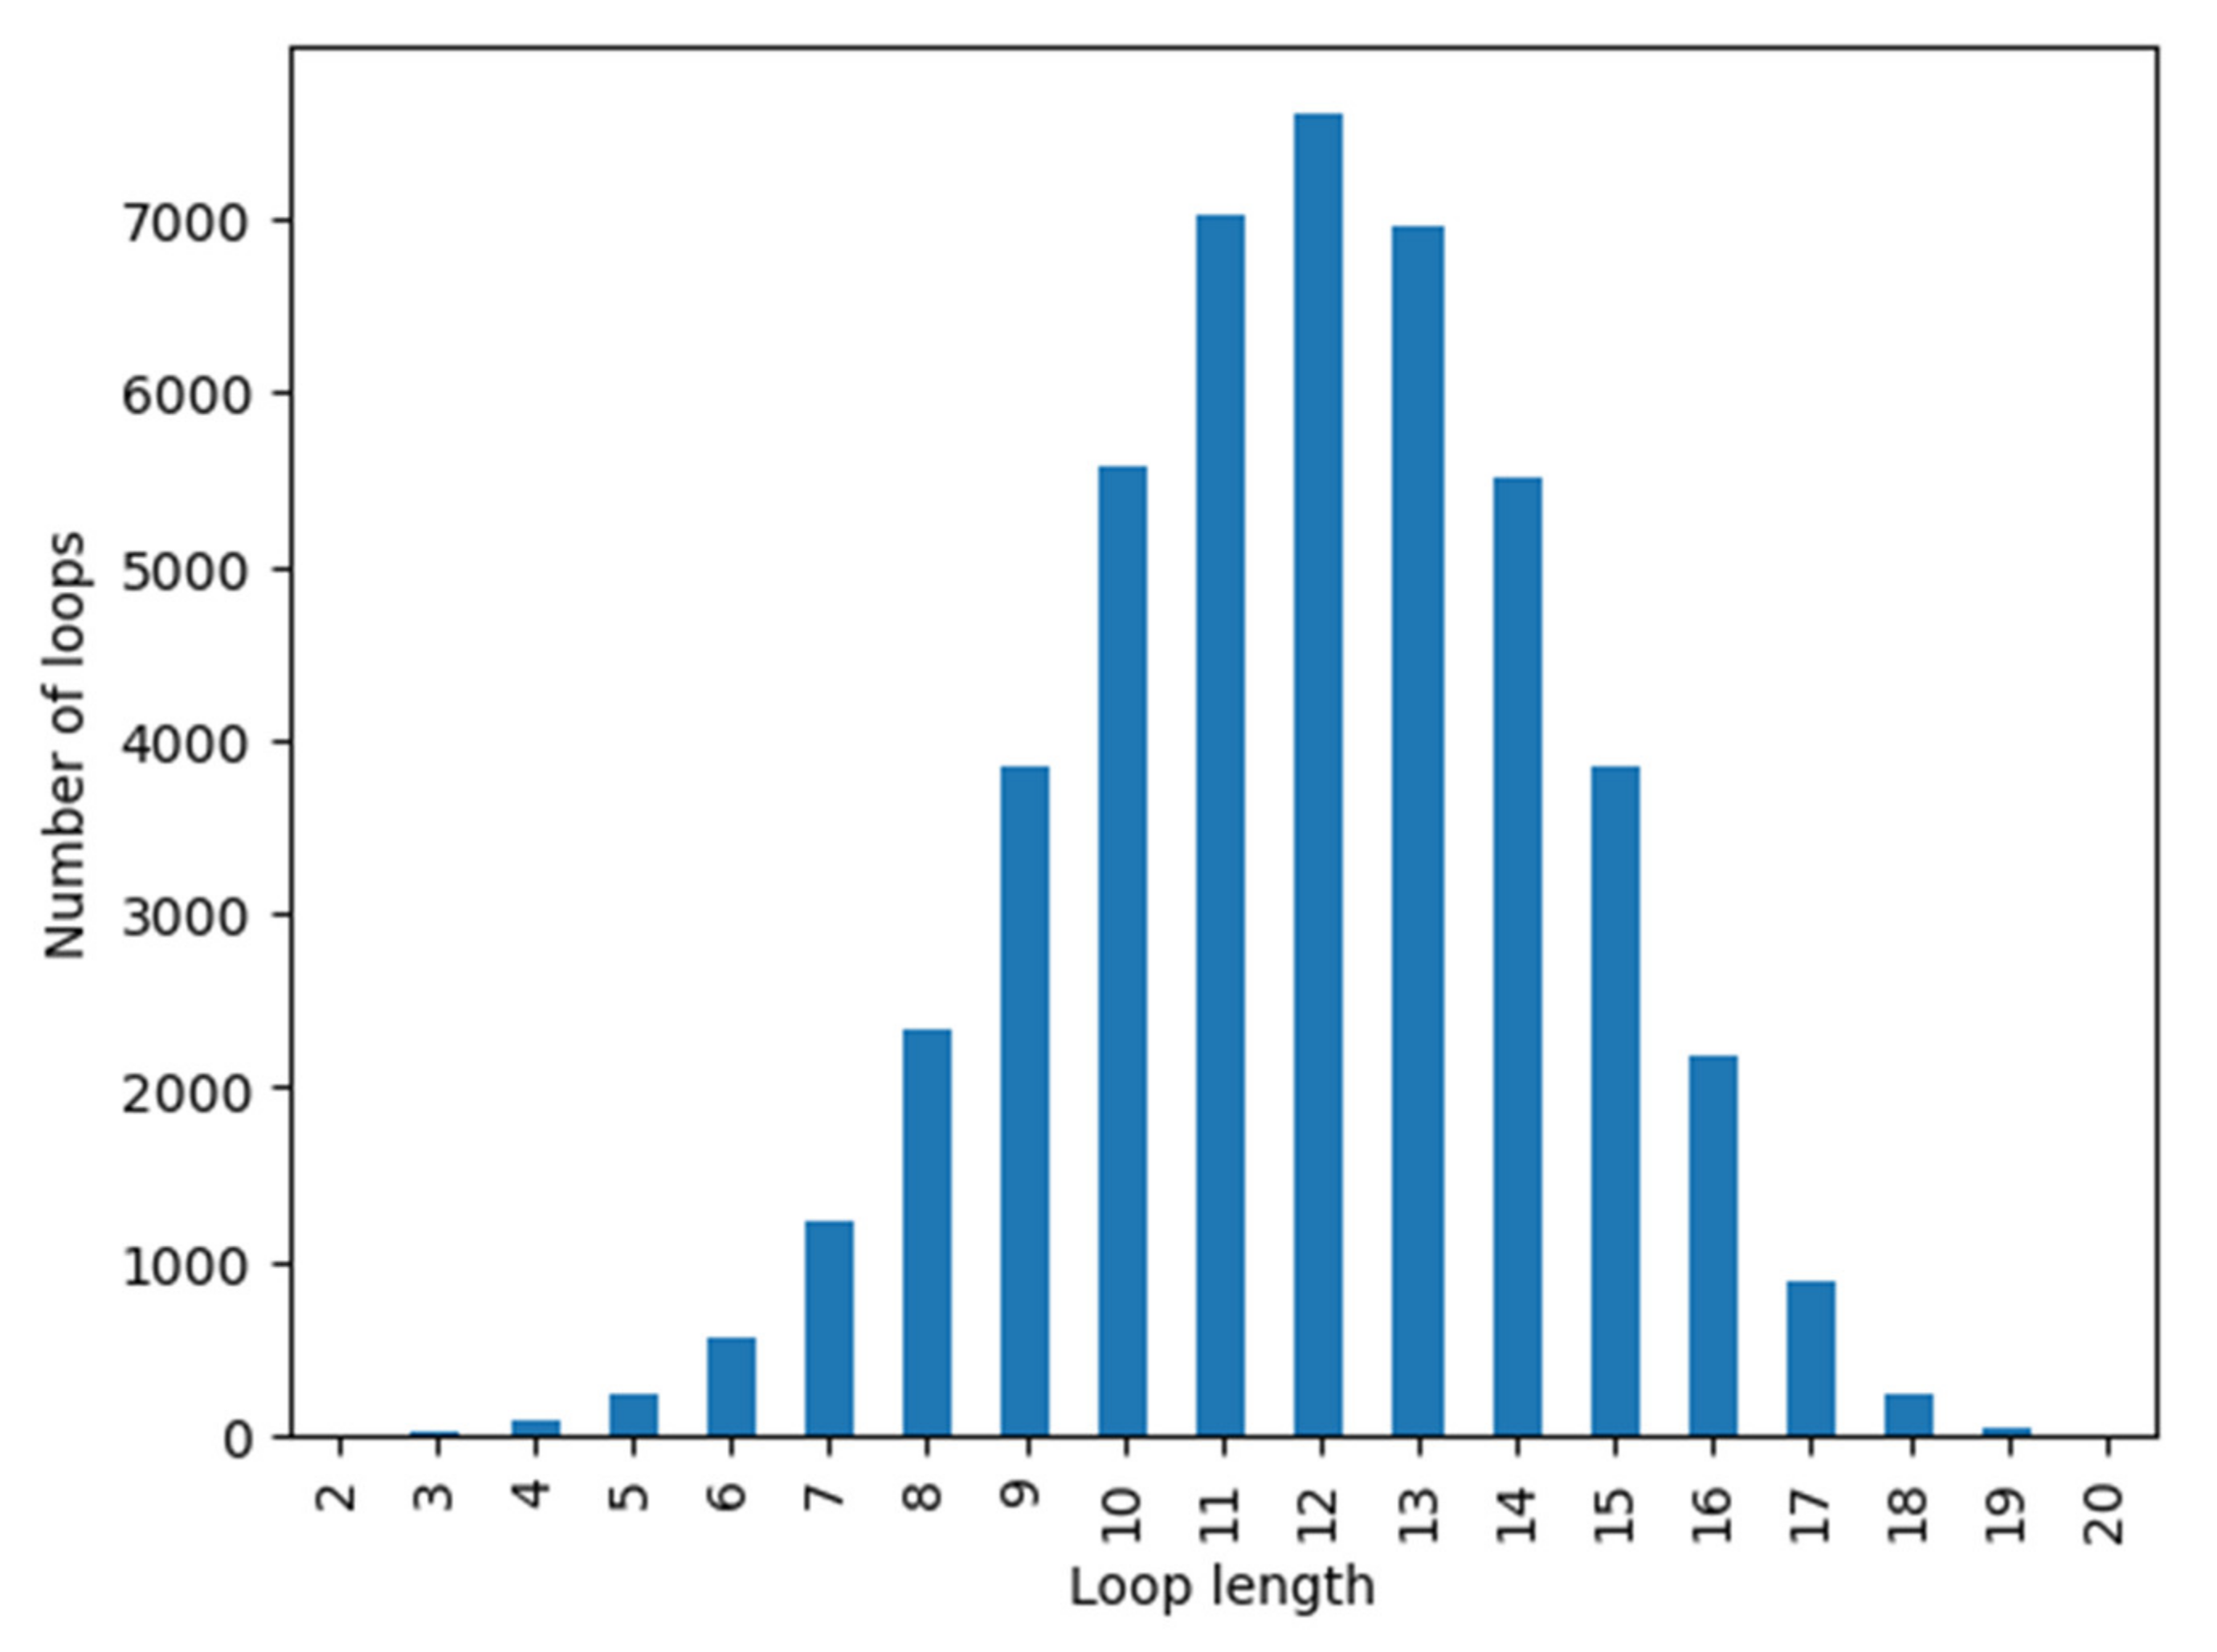
4.3. Feedback Loops
5. The Equity Effects of COVID-19 on Well-Being
5.1. The Process of Analysis
5.1.1. Group 1: Income and Employment Unaffected
5.1.2. Groups 2: Loss of Job Security and Possibly Some Income
5.1.3. Groups 3: Loss of Jobs
5.2. Summary of Effects by Group and Timescale
5.2.1. Group 1: Employment and Income Unaffected
5.2.2. Group 2: Loss of Job Security and Possibly Some Income
5.2.3. Group 3: Loss of Employment (Unemployed or on Extended Unpaid Leave)
6. Discussion and Conclusions
Supplementary Materials
Author Contributions
Funding
Institutional Review Board Statement
Informed Consent Statement
Data Availability Statement
Conflicts of Interest
Appendix A


| Link ID | From | To | Value | Justification | Reference |
|---|---|---|---|---|---|
| 1 | Access to green space | Perceived health | 1 | Greenspace exposure is associated with numerous health benefits in intervention and observational studies. These results are indicative of a beneficial influence of greenspace on a wide range of health outcomes. | [109] |
| 2 | Access to green space | Depressive symptoms | −1 | Higher residential greenness was associated with a reduced likelihood of depressive symptoms. Associations may be stronger for more disadvantaged groups and for those who are already physically active. Improving green space is a promising intervention to reduce risk of depression in disadvantaged groups. | [110] |
| 3 | Access to green space | Exposure to air pollution | −1 | Forests and green spaces help improve air quality in urban and rural areas. They extract a wide range of air pollutants from the air such as particles and carbon oxides, emitted, for example, by traffic and industry. | [111] |
| 4 | Access to green space | Life satisfaction | 1 | An unspoiled environment is a source of satisfaction, improves mental well-being, allows people to recover from the stress of everyday life and to perform physical activity. | [65] |
| 5 | Adult skills | Household income | 1 | Good education greatly improves the likelihood of earning enough money to satisfy needs. | [65] |
| 6 | Adult skills | Relative income poverty | −1 | Policies to improve UK skills levels particularly those that meet or exceed the projected improvement in skills levels by 2020 could improve the absolute quality of life of large groups of people currently in poverty. | [112] |
| 7 | Adult skills | Employment rate | 1 | The skills needed in the labor market are becoming more knowledge-based. This shift in demand has made an upper secondary degree, or high-school degree, the minimum credential for finding a job in almost all OECD countries. | [113] |
| 8 | Adult skills | Gender wage gap | −1 | The gender wage gap narrows as women move into high-skill jobs and acquire more education. | [114] |
| 9 | Adult skills | Job strain | −1 | People working in lower-skilled occupations had generally higher levels of job strain and effort–reward imbalance, as well as they tend to have a steeper increase in job strain than people working in higher-skilled occupations. | [115] |
| 10 | Depressive symptoms | Household income | −1 | People suffering from mental health problems such as depression and panic attacks earn up to 42% less than their peers. | [116] |
| 11 | Depressive symptoms | Employment rate | −1 | We also find that severe depressive symptoms, in turn, lead to economic inactivity. Individuals are less likely to be labor force participants or employed if they experience severe depressive symptoms. | [117] |
| 12 | Depressive symptoms | Life expectancy | −1 | The impact of serious mental illness on life expectancy is marked and generally higher than similarly calculated impacts of well-recognized adverse exposures such as smoking, diabetes and obesity. | [118] |
| 13 | Depressive symptoms | Perceived health | −1 | Depressed people are substantially more likely to have cardiovascular problems such as heart disease and strokes. | [119] |
| 14 | Depressive symptoms | Life satisfaction | −1 | Depression has a negative impact on life satisfaction. | [120] |
| 15 | Depressive symptoms | Satisfaction with time use | −1 | Depressive symptoms represent a serious and distinct threat to independent functioning in older adults. Whether experienced alone, or in combination with chronic diseases, depressive symptoms shorten ALE substantially. Timely diagnosis and treatment of depressive symptoms in older adults may delay the onset of disability and improve the quality of life. | [121] |
| 16 | Depressive symptoms | Social interactions | −1 | Our results indicate that depressive symptoms are associated with spending less time in social interaction. | [122] |
| 17 | Depressive symptoms | Voter turnout | −1 | Reporting increased depressive symptoms was associated with a lower probability of voting across electoral contexts for all respondents, and few factors mitigated this negative effect. | [123] |
| 18 | Employment rate | Household income | 1 | Jobs and the type of jobs people do (or do not do) are the main determinant of income level and distribution of income. Jobs provide people with incomes to enable them to meet their basic needs and to contribute to their material comfort. | [65] |
| 19 | Employment rate | Financial insecurity | −1 | The work and job quality of the individuals within a household contributes directly to household income and economic security. | [124] |
| 20 | Employment rate | Perceived health | 1 | Research shows that losing your job has the next highest impact on health after divorce and death. | [65] |
| 21 | Employment rate | Depressive symptoms | −1 | We find that severe depressive symptoms are partially a consequence of economic inactivity. The incidence of depressive symptoms is higher if individuals have been out of a job for an extended period. | [117] |
| 22 | Employment rate | Life satisfaction | 1 | Evidence from the literature shows that unemployment has a strong negative effect on life satisfaction, after controlling for other factors associated with employment. The impact of unemployment on life satisfaction is one of the strongest findings from the literature. | [65] |
| 23 | Exposure to air pollution | Life expectancy | −1 | Globally the health impacts of urban air pollution continue to worsen, with air pollution set to become the top environmental cause of premature mortality by 2050. | [125] |
| 24 | Exposure to air pollution | Perceived health | −1 | Globally the health impacts of urban air pollution continue to worsen, with air pollution set to become the top environmental cause of premature mortality by 2050. | [125] |
| 25 | Exposure to air pollution | Depressive symptoms | 1 | Short-term exposure to NO2 was associated with increased odds of depression. | [126] |
| 26 | Financial insecurity | Housing affordability | −1 | Housing is both a contributor to wealth (as an asset or as outstanding debt through a mortgage) and a function of economic security. | [124] |
| 27 | Financial insecurity | Housing cost overburden | 1 | Results showed that housing costs represent a non-negligible burden in all the five European countries. Moreover, home ownership was found to significantly reduce household hardship status. | [127] |
| 28 | Financial insecurity | Perceived health | −1 | Results across our studies provided support for the direct effects of financial insecurity on WFC and stress. In addition, appraisals of WFC and stress serve as significant mediators of the relationship between financial insecurity and health outcomes, including a significant overall lagged effect across time. | [128] |
| 29 | Financial insecurity | Depressive symptoms | 1 | Our preferred estimates indicate that a standard deviation shock to economic insecurity lowers an individual’s mental health score by about 1.4 percentage points. If applied uniformly across the Australian population such a shock would increase the morbidity rate of mental disorders by about 1.7%. | [129] |
| 30 | Financial insecurity | Student skills | −1 | We show that being brought up in a family whose mother has at least one major financial problem has negative consequences on both cognitive and non-cognitive achievements in adolescence even after controlling for income and a set of standard variables. | [130] |
| 31 | Financial insecurity | Life satisfaction | −1 | Evidence suggests that experiencing financial insecurity lowers well-being and increases problematic financial behaviors. | [131] |
| 32 | Gender gap in hours worked | Gender wage gap | 1 | Our results suggest that high returns to overwork, coupled with the persistent gap in the propensity to work overtime across genders, is an important factor that limits the convergence in gender pay gaps in many highly-skilled occupations. | [132] |
| 33 | Gender wage gap | Relative income poverty | 1 | Equal Pay Would Reduce Poverty by Half for Families with a Working Woman. | [133] |
| 34 | Gender wage gap | Gender gap in hours worked | 1 | Women often choose to move to part-time employment or to step out of a career promotion pathway in order to have more time for motherhood and childcare when their children are young. If they return to work full-time, they are often forced to accept a lower wage compared to the wage they would have earned had they stayed in their original job. | [134] |
| 35 | Having say in government | Life satisfaction | 1 | Analyses reveal that policy outcomes, especially microlevel ones, significantly influence life satisfaction. | [135] |
| 36 | Having say in government | Voter turnout | 1 | Our analysis confirms that trust in parliament has a positive impact on turnout, and also satisfaction with democracy increases it. These effects are especially high when aggregated at a country level and when hard data on turnout are used. At the individual level, in particular trust in parliament increases the likelihood of voting. | [136] |
| 37 | Household income | Household wealth | 1 | Earning a higher income makes saving easier, and saving is necessary to build wealth. | [137] |
| 38 | Household income | Financial insecurity | −1 | Results showed that a household’s liquidity constraint and asset inadequacy were linked with increased risk of food insecurity at all income levels; although, the association was strongest among poor households and those with incomes slightly above the federal food assistance eligibility threshold. | [138] |
| 39 | Household income | Overcrowding rate | −1 | People in lower income households are more likely to be in overcrowded accommodation than those in higher income households. | [139] |
| 40 | Household income | Housing affordability | 1 | Income determines the quality, location, and size of housing that is affordable. Higher income increases house affordability. | [65] |
| 41 | Household income | Housing cost overburden | −1 | Low-income households are particularly vulnerable when a high share of their income is devoted to housing costs, since this limits spending on other basic essentials, such as food, health care, and education. | [32] |
| 42 | Household income | Households with high-speed internet access | 1 | There is a strong relationship between median income and internet adoption. | [140] |
| 43 | Household income | Life expectancy | 1 | Life expectancy increases continuously with income. | [141] |
| 44 | Household income | Perceived health | 1 | Both individual income (material circumstances) and income inequality (relative income) make a difference to health. Therefore, there is a ‘social gradient’ in health, which means that every step up the socio-economic ladder leads to an increase in health. | [65] |
| 45 | Household income | Student skills | 1 | Family income levels impact on the achievement level of students. Higher socio-economic groups provide more financial support for schools, pay school fees, etc. Students’ socioeconomic background tends to have an impact on their education. People who are successful as a result of their education are role models for others. They are also more likely to encourage and financially support their children to achieve high levels of education. | [65] |
| 46 | Household income | Life satisfaction | 1 | Adequacy of income has an impact on life satisfaction. Wealthier people are happier than those on lower incomes; however, life satisfaction does not increase proportionally as income increases. | [65] |
| 47 | Household income | Safety | 1 | People with higher incomes can afford to live in safer areas and afford more security (e.g., burglar alarms). | [65] |
| 48 | Household income | Time off | 1 | Higher incomes allow people to increase their work–life balance by working less hours. | [65] |
| 49 | Household income | Voter turnout | 1 | Voter turnout generally increases with individual income. | [65] |
| 50 | Household wealth | Financial insecurity | −1 | Wealth allows households to weather a financial emergency such as a layoff or a family member’s illness. | [142] |
| 51 | Household wealth | Housing affordability | 1 | Housing assets, which accounted for over 70 percent, were the largest component of household wealth. | [143] |
| 52 | Household wealth | Households with high-speed internet access | 1 | Wealth is an important driver of access to digital technology at home. | [144] |
| 53 | Household wealth | Perceived health | 1 | Furthermore, in all countries the positive association between wealth and health holds even after controlling for socio-demographic attributes and household income. | [145] |
| 54 | Household wealth | Satisfaction with time use | 1 | We find that both permanent income and wealth are better predictors of life satisfaction than current income and wealth. | [146] |
| 55 | Households with high-speed internet access | Student skills | 1 | We find that students who do not have access to the Internet from home or are dependent on a cell phone only for access, perform lower on a range of metrics, including digital skills, homework completion, and grades. Students lacking home Internet, and those dependent on a cell phone, are also less likely to consider post-secondary education. A deficit in digital skills compounds inequalities in access, contributing to lower standardized test scores and less interest in STEM careers. Consequently, lack of broadband access not only impacts school performance, but also has broader repercussions for career choice, life income, and the ability to adapt to emerging demands of the workforce. We believe the findings are generalizable to rural America. | [147] |
| 56 | Households with high-speed internet access | Life satisfaction | 1 | The empirical evidence suggests that people with access to the Internet enjoy a higher life satisfaction than people without access to the Internet, even when controlling for income and education. | [148] |
| 57 | Households with high-speed internet access | Satisfaction with time use | 1 | Evidence from the American Time Use Survey shows that reductions in the time spent commuting and in home production due to Internet increase labor force participation, in particular among married women. | [148] |
| 58 | Housing affordability | Financial insecurity | −1 | In recent decades, housing affordability has been increasingly linked to household financial outcomes where high housing costs relative to income are perceived to negatively affect financial well-being. | [149] |
| 59 | Housing affordability | Overcrowding rate | −1 | The combination of high rents and low incomes drives households into overcrowding. Overcrowding is more prevalent in locations of housing affordability stress (households on low incomes that face higher housing costs) and tight housing markets (low rates of rental vacancy). | [150] |
| 60 | Housing affordability | Housing cost overburden | −1 | The immediately visible consequences of worsening affordability are to be found in the high level of indebtedness over housing mortgages in a number of countries as well as an increase in the number of households reporting arrears on rents and mortgage payments, as well as on utilities bills. | [151] |
| 61 | Housing affordability | Life expectancy | 1 | Surveys of hospital admissions demonstrate a strong association between poor housing and poor health, especially for children. | [65] |
| 62 | Housing affordability | Depressive symptoms | −1 | Housing affordability was the most frequently referenced issue by those who saw housing pressures having had a negative impact upon their mental health. | [152] |
| 63 | Housing affordability | Life satisfaction | 1 | Having adequate housing improves life satisfaction. | [65] |
| 64 | Housing affordability | Safety | 1 | The location of a person’s home can impact their feelings of security and the likelihood of crime. | [124] |
| 65 | Housing cost overburden | Household wealth | −1 | Housing is both a contributor to wealth (as an asset or as outstanding debt through a mortgage) and a function of economic security. | [124] |
| 66 | Housing cost overburden | Financial insecurity | 1 | In recent decades, housing affordability has been increasingly linked to household financial outcomes where high housing costs relative to income are perceived to negatively affect financial well-being. | [149] |
| 67 | Housing cost overburden | Overcrowding rate | 1 | Similarly, many studies demonstrate that low-income households that had to rent in the private market, compared to similar households residing in public housing or receiving housing vouchers, were more likely to suffer from overcrowding and financial stress and their children were more likely to be held back a year in school. | [153] |
| 68 | Housing cost overburden | Depressive symptoms | 1 | Homeowners in default or foreclosure exhibited poorer mental health and more physical symptoms than renters, homeowners with moderate strain, and homeowners with no strain following a gradient that was consistent across multiple health indicators. | [154] |
| 69 | Housing cost overburden | Life satisfaction | −1 | The housing dimension is one of the major issues affecting the quality of life. The housing indicators reflecting the quality of life can be assessed by applying quality of housing, quality of housing environment and housing cost burdens indicators. | [155] |
| 70 | Job strain | Employment rate | −1 | There is consistent support for the proposition that employees with elevated job strain are more likely to voluntarily resign from their organizations than employees with low strain. | [156] |
| 71 | Job strain | Perceived health | −1 | Workers in high-strain jobs, who do not receive adequate support to cope with difficult work demands, are more likely to suffer from job burnout, to develop musculoskeletal disorders, hypertension, and cardiovascular disease. | [65] |
| 72 | Job strain | Depressive symptoms | 1 | While workers with high job strain were more likely to have adverse workplace conditions (competition with coworkers, job dissatisfaction and insecurity), sleeping problems, depressive symptoms, a Type A personality, and be physically inactive, no differences in cardiometabolic risk factors were detected. | [157] |
| 73 | Job strain | Life satisfaction | −1 | Workers in high-strain jobs, who do not receive adequate support to cope with difficult work demands, are more likely to suffer from job burnout. | [65] |
| 74 | Job strain | Satisfaction with time use | −1 | Time use is connected to work and job quality, as access to flexible working and job strain impacts the time available for caring duties and leisure time outside of paid work. | [124] |
| 75 | Labor market insecurity | Relative income poverty | 1 | It seems sensible on the face of it to assume that recurrent poverty could be related to patterns of repeated, low-paid insecure employment (cycles of poverty caused by cycles of worklessness). | [158] |
| 76 | Labor market insecurity | Financial insecurity | 1 | Alongside remuneration, job security and hours worked can also impact economic insecurity, such as access to social protection based on the type of job, contract type or PRSI payments. | [124] |
| 77 | Labor market insecurity | Job strain | 1 | Survey data from four European countries show that the effect of job insecurity on turnover intention is mediated by organizational commitment and job satisfaction. In contrast, it appears that work attitudes partially mediate the effect of job insecurity on mental health complaints. | [159] |
| 78 | Labor market insecurity | Perceived health | −1 | Research has shown that job insecurity affects both mental and physical health, though the effects are lower when employees are easily re-employable. | [160] |
| 79 | Labor market insecurity | Depressive symptoms | 1 | The results indicate the validity of using this concept in order to better understand how insecurity relates to mental well-being by affecting both the manifest and latent functions of work. | [161] |
| 80 | Labor market insecurity | Life satisfaction | −1 | People who feel their employment is insecure are more likely than other employed people to rate their overall life satisfaction poorly. | [162] |
| 81 | Life satisfaction | Perceived health | 1 | Life satisfaction is the strongest predictor of poor perceived health in addition to country of birth, number of symptoms and depression. | [163] |
| 82 | Life satisfaction | Depressive symptoms | −1 | A strong linear association was found between concurrent Life Satisfaction and Beck Depression Inventory scales (r = 0.6). With an LS cut-off point of 11/12, moderate/severe depression (BDI ≥ 19) was detected with 87% sensitivity, 88% specificity, and a 94% area under the ROC curve. Longitudinally, a strongly increased risk of moderate/severe depression in 1990 was observed among the dissatisfied (LS 12–20) compared with the satisfied (LS 4–6) in 1975 (OR = 6.7; 95% CI 4.2–10.9) and in 1981 (OR = 10.4; 6.1–17.6). | [164] |
| 83 | Life satisfaction | Voter turnout | 1 | People satisfied with life are more inclined to be trusting of public service and participate in civil duties such as voting and submission making. | [65] |
| 84 | Life satisfaction | Having say in government | 1 | People satisfied with life are more inclined to be trusting of public service and participate in civil duties such as voting and submission making. Dissatisfaction in life breeds apathy, resulting in poor civic engagement from these individuals. | [65] |
| 85 | Long hours in paid work | Household income | 1 | For most managerial and sales occupations, there is a large difference between weekly earnings of standard and extended-week workers. Workers with a standard workweek appear to pay a large financial “penalty” for their shorter hours, while those with an extended week appear to receive a large “payoff” for their longer hours. In contrast, differences between earnings of standard and extended-week workers are small among engineers, computer scientists, and teachers. Workers in these occupations appear to suffer very little financially from having a standard workweek, but to gain little from an extended week. | [165] |
| 86 | Long hours in paid work | Job strain | 1 | High job strain among shift workers is associated with higher perceived work load, poorer ergonomics in work schedules and low control over shift scheduling. Ergonomics in shift planning and better opportunities to influence working hours and workload should be implemented to reduce work strain. | [166] |
| 87 | Long hours in paid work | Perceived health | 1 | Working shorter hours may be good for your health. Longer working hours seem to lead to higher premature mortality. Stress, for example, can contribute to range of problems like heart disease and depression. | [65] |
| 88 | Long hours in paid work | Time off | −1 | Long workdays make it harder for people to balance work with private life. People are multi-dimensional beings who seek to develop in a range of areas, and to live not only as workers but also as family members, caregivers, and more. Given that time is a limited resource, allocating too much time to work would lead | [167] |
| 89 | Long hours in paid work | Satisfaction with time use | −1 | Working 8 h a week is sufficient to gain the wellbeing benefits of employment. The wellbeing of employees is similar regardless of the length of the working week up to 48. | [168] |
| 90 | Long unpaid working hours | Perceived health | −1 | Longer working hours seem to lead to higher premature mortality. Stress, for example, can contribute to range of problems like heart disease and depression. | [65] |
| 91 | Long unpaid working hours | Depressive symptoms | 1 | This study supported heterogeneous individual patterns of depressive symptoms over time among the Swedish working population. The results also indicate that a higher burden of unpaid work and longer total working hours, which indicate a double burden from paid and unpaid work, may be associated with higher depressive symptom trajectories, especially among women. | [169] |
| 92 | Long unpaid working hours | Life satisfaction | −1 | Results imply that state and organizational policies that reduce the incidence of long hours working are likely to enhance aggregate well-being levels. | [170] |
| 93 | Long unpaid working hours | Gender gap in hours worked | 1 | Although it is mothers who have increased the time they spend working for pay, they also continue to spend more time than fathers caring for children and doing domestic work. | [171] |
| 94 | Long unpaid working hours | Satisfaction with time use | −1 | <…> unpaid work can leave individuals with little time for themselves, their family, and their friends. | [32] |
| 95 | Long unpaid working hours | Social interactions | −1 | If a person does not have time (due to paid or unpaid work), it is more challenging to build and maintain social connections. | [124] |
| 96 | Overcrowding rate | Life expectancy | −1 | The study demonstrates that household crowding at levels that are common in the United States can have a substantial negative impact on mental health physical health and childcare. | [172] |
| 97 | Overcrowding rate | Perceived health | −1 | Surveys of hospital admissions demonstrate a strong association between poor housing and poor health, especially for children. | [65] |
| 98 | Overcrowding rate | Depressive symptoms | 1 | …overcrowded housing which impacts on mental health and social wellbeing. | [65] |
| 99 | Overcrowding rate | Student skills | −1 | The results show that overcrowding has a negative effect that even exceeds the impact of certain maternal education level on a child’s academic performance. | [173] |
| 100 | Overcrowding rate | Life satisfaction | −1 | Surveys of hospital admissions demonstrate a strong association between poor housing and poor health, especially for children. This situation is compounded by overcrowded housing which impacts on mental health and social wellbeing | [65] |
| 101 | Overcrowding rate | Safety | −1 | Overcrowding causes tension and conflict | [65] |
| 102 | Perceived health | Employment rate | 1 | Ability to work is impacted by the health of the population. People with poor health have more sick days from work or are unable to hold down a job. | [65] |
| 103 | Perceived health | Life expectancy | 1 | People who refrain from engaging in risky health behaviors not only have a very long life but that most of these additional years of life are spent in good health | [65] |
| 104 | Perceived health | Depressive symptoms | −1 | The relationship between the number of illnesses and depressive symptoms was mediated by self-perceived health and was moderated by employment. Employment moderated the relationship between the number of illnesses and self-perceived health, such that the relationship was stronger for employees. | [174] |
| 105 | Perceived health | Adult skills | 1 | Health is one of the components of human capital | [175] |
| 106 | Perceived health | Life satisfaction | 1 | The findings indicate that race and quality of perceived health are the most salient predictors of satisfaction | [176] |
| 107 | Perceived health | Student skills | 1 | Good health facilitates the ability to learn and achieve high levels of education. Absence from school due to sickness (especially primary level) for many children is a barrier to learning as once children drop behind, they struggle to catch up. | [65] |
| 108 | Perceived health | Voter turnout | 1 | The results show that poor health decreases voting. Social connectedness partly mediates the impact of health on turnout. | [177] |
| 109 | Relative income poverty | Life expectancy | −1 | The results with regard to women confirm the hypothesis that life expectancy in the developed countries has become more dissociated from average income level and more associated with income inequality. The absence of a relation in men in 1990 may be due to the large impact of premature mortality from AIDS in regions with the highest average total income per household and/or smallest income inequality. | [178] |
| 110 | Relative income poverty | Gap in life expectancy by education | 1 | When categories of educational level were kept fixed, implying a decreasing proportion of persons with a short education, the educational inequality in life expectancy increased. Thus, the difference in life expectancy at age 30 between men with primary or lower secondary education and men with tertiary education increased from 4.8 years in 1987 to 6.4 years in 2011. | [179] |
| 111 | Relative income poverty | Depressive symptoms | 1 | Across a wide range of populations and study designs, positive economic shocks to individuals are shown to improve mental health, whereas negative economic shocks undermine mental health. This robust evidence, on the effects of changes in economic circumstances, indicates that poverty does cause mental illness. | [180] |
| 112 | Relative income poverty | Life satisfaction | −1 | Abundant evidence now suggests that living in relative poverty and exposure to relative income inequality, especially in childhood, may have a detrimental influence on health and well-being during childhood and across the life course. | [181] |
| 113 | Relative income poverty | Safety | −1 | People living in environments characterized by high levels of economic and social inequality tend to be more exposed to violence and victimization than those living elsewhere. | [182] |
| 114 | Safety | Perceived health | 1 | Being able to safely exercise and commute (by walking or cycling) contributes to health. In this respect urban design is important. Safety is fundamental to health: violence and avoidable injuries, at their most extreme, threaten life itself and corrode quality of life in many ways. | [65] |
| 115 | Safety | Student skills | 1 | Objective assessments of neighborhood environment and students’ self-reported school and neighborhood safety were both strongly associated with academic performance. | [183] |
| 116 | Safety | Life satisfaction | 1 | Individuals in high-crime areas are relatively less satisfied with life than those who live in low-crime counties—even after controlling for other county amenities such as population density, home ownership, and pollution. Perceived neighborhood safety is relatively more important than county-level crime rates. | [184] |
| 117 | Satisfaction with time use | Life satisfaction | 1 | By being able to engage in recreational and cultural activities, and spending time on one’s own areas of interest, a balanced and satisfactory use of time is expected to contribute to an individual’s overall life satisfaction. | [185] |
| 118 | Social interactions | Perceived health | 1 | There is two-way feedback between social connections and health. If a person does not feel well, it is difficult to maintain social connections. Furthermore, a lack of social connections can be detrimental to one’s mental health. | [124] |
| 119 | Social interactions | Depressive symptoms | −1 | The ability to build and maintain quality social connections has an essential impact on mental health. | [124] |
| 120 | Social interactions | Life satisfaction | 1 | Loneliness appears to be a major correlate of life satisfaction for both men and women: those respondents who report feeling lonely have consistently lower life satisfaction mean scores than those who do not. As expected then, all dimensions of loneliness influence people’s life satisfaction. | [186] |
| 121 | Social interactions | Satisfaction with time use | 1 | Focus on negative social interactions but evidence for the link—although negative social interactions related to stressful life events and hassles, negative interactions had incremental validity beyond these in predicting psychological symptoms. | [187] |
| 122 | Social interactions | Social support | 1 | Although both negative social interactions and perceived support were consistent predictors of psychological distress, negative interactions were weakly or unrelated to perceived and enacted support. | [187] |
| 123 | Social support | Job strain | −1 | Social support was found to act as a robust mediator between job control and job strain. This finding underscored the importance of social support in enabling skill utilization and decision making at the job place to reduce job strain. | [188] |
| 124 | Social support | Perceived health | 1 | Good social relationships contribute to mental health. Community activities (involving exercise) improve physical health. | [65] |
| 125 | Social support | Depressive symptoms | −1 | Good social relationships contribute to mental health. | [65] |
| 126 | Social support | Life satisfaction | 1 | Community engagement (your social support network) contributes to your life satisfaction as you have help when needed and are not isolated. | [65] |
| 127 | Social support | Safety | 1 | Our findings show a positive unique group-level effect of perceived tutor support on psychological safety, where an individual’s level of self-consciousness strengthens this positive impact. | [189] |
| 128 | Student skills | Adult skills | 1 | Mean years of schooling increase the knowledge and skills gained through formal education, hence the adult skills. | [66] |
| 129 | Time off | Job strain | −1 | Good control over working times reduces the adverse effect of work stress on sickness absence especially among female employees. | [190] |
| 130 | Time off | Perceived health | 1 | Good work–life balance enables physical activity and healthier food behavior. | [65] |
| 131 | Time off | Depressive symptoms | −1 | Women who do not take vacations are at greater risk for depression. | [119] |
| 132 | Time off | Life satisfaction | 1 | A balance between work and time to devote to family, community, and other interests contributes significantly to Life Satisfaction. | [65] |
| 133 | Time off | Satisfaction with time use | 1 | Many poor Americans often receive no paid vacation and often feel pressure to not take it. This shows that not only do some individuals have less opportunity to physically rest and relax, they also face difficultly finding time for family and friends and pursuing hobbies, which all contribute to subjective wellbeing. | [191] |
| 134 | Time off | Social interactions | 1 | If people work less hours, they are able to connect with people. | [65] |
| Link ID | From | To | Value | Justification | Reference |
|---|---|---|---|---|---|
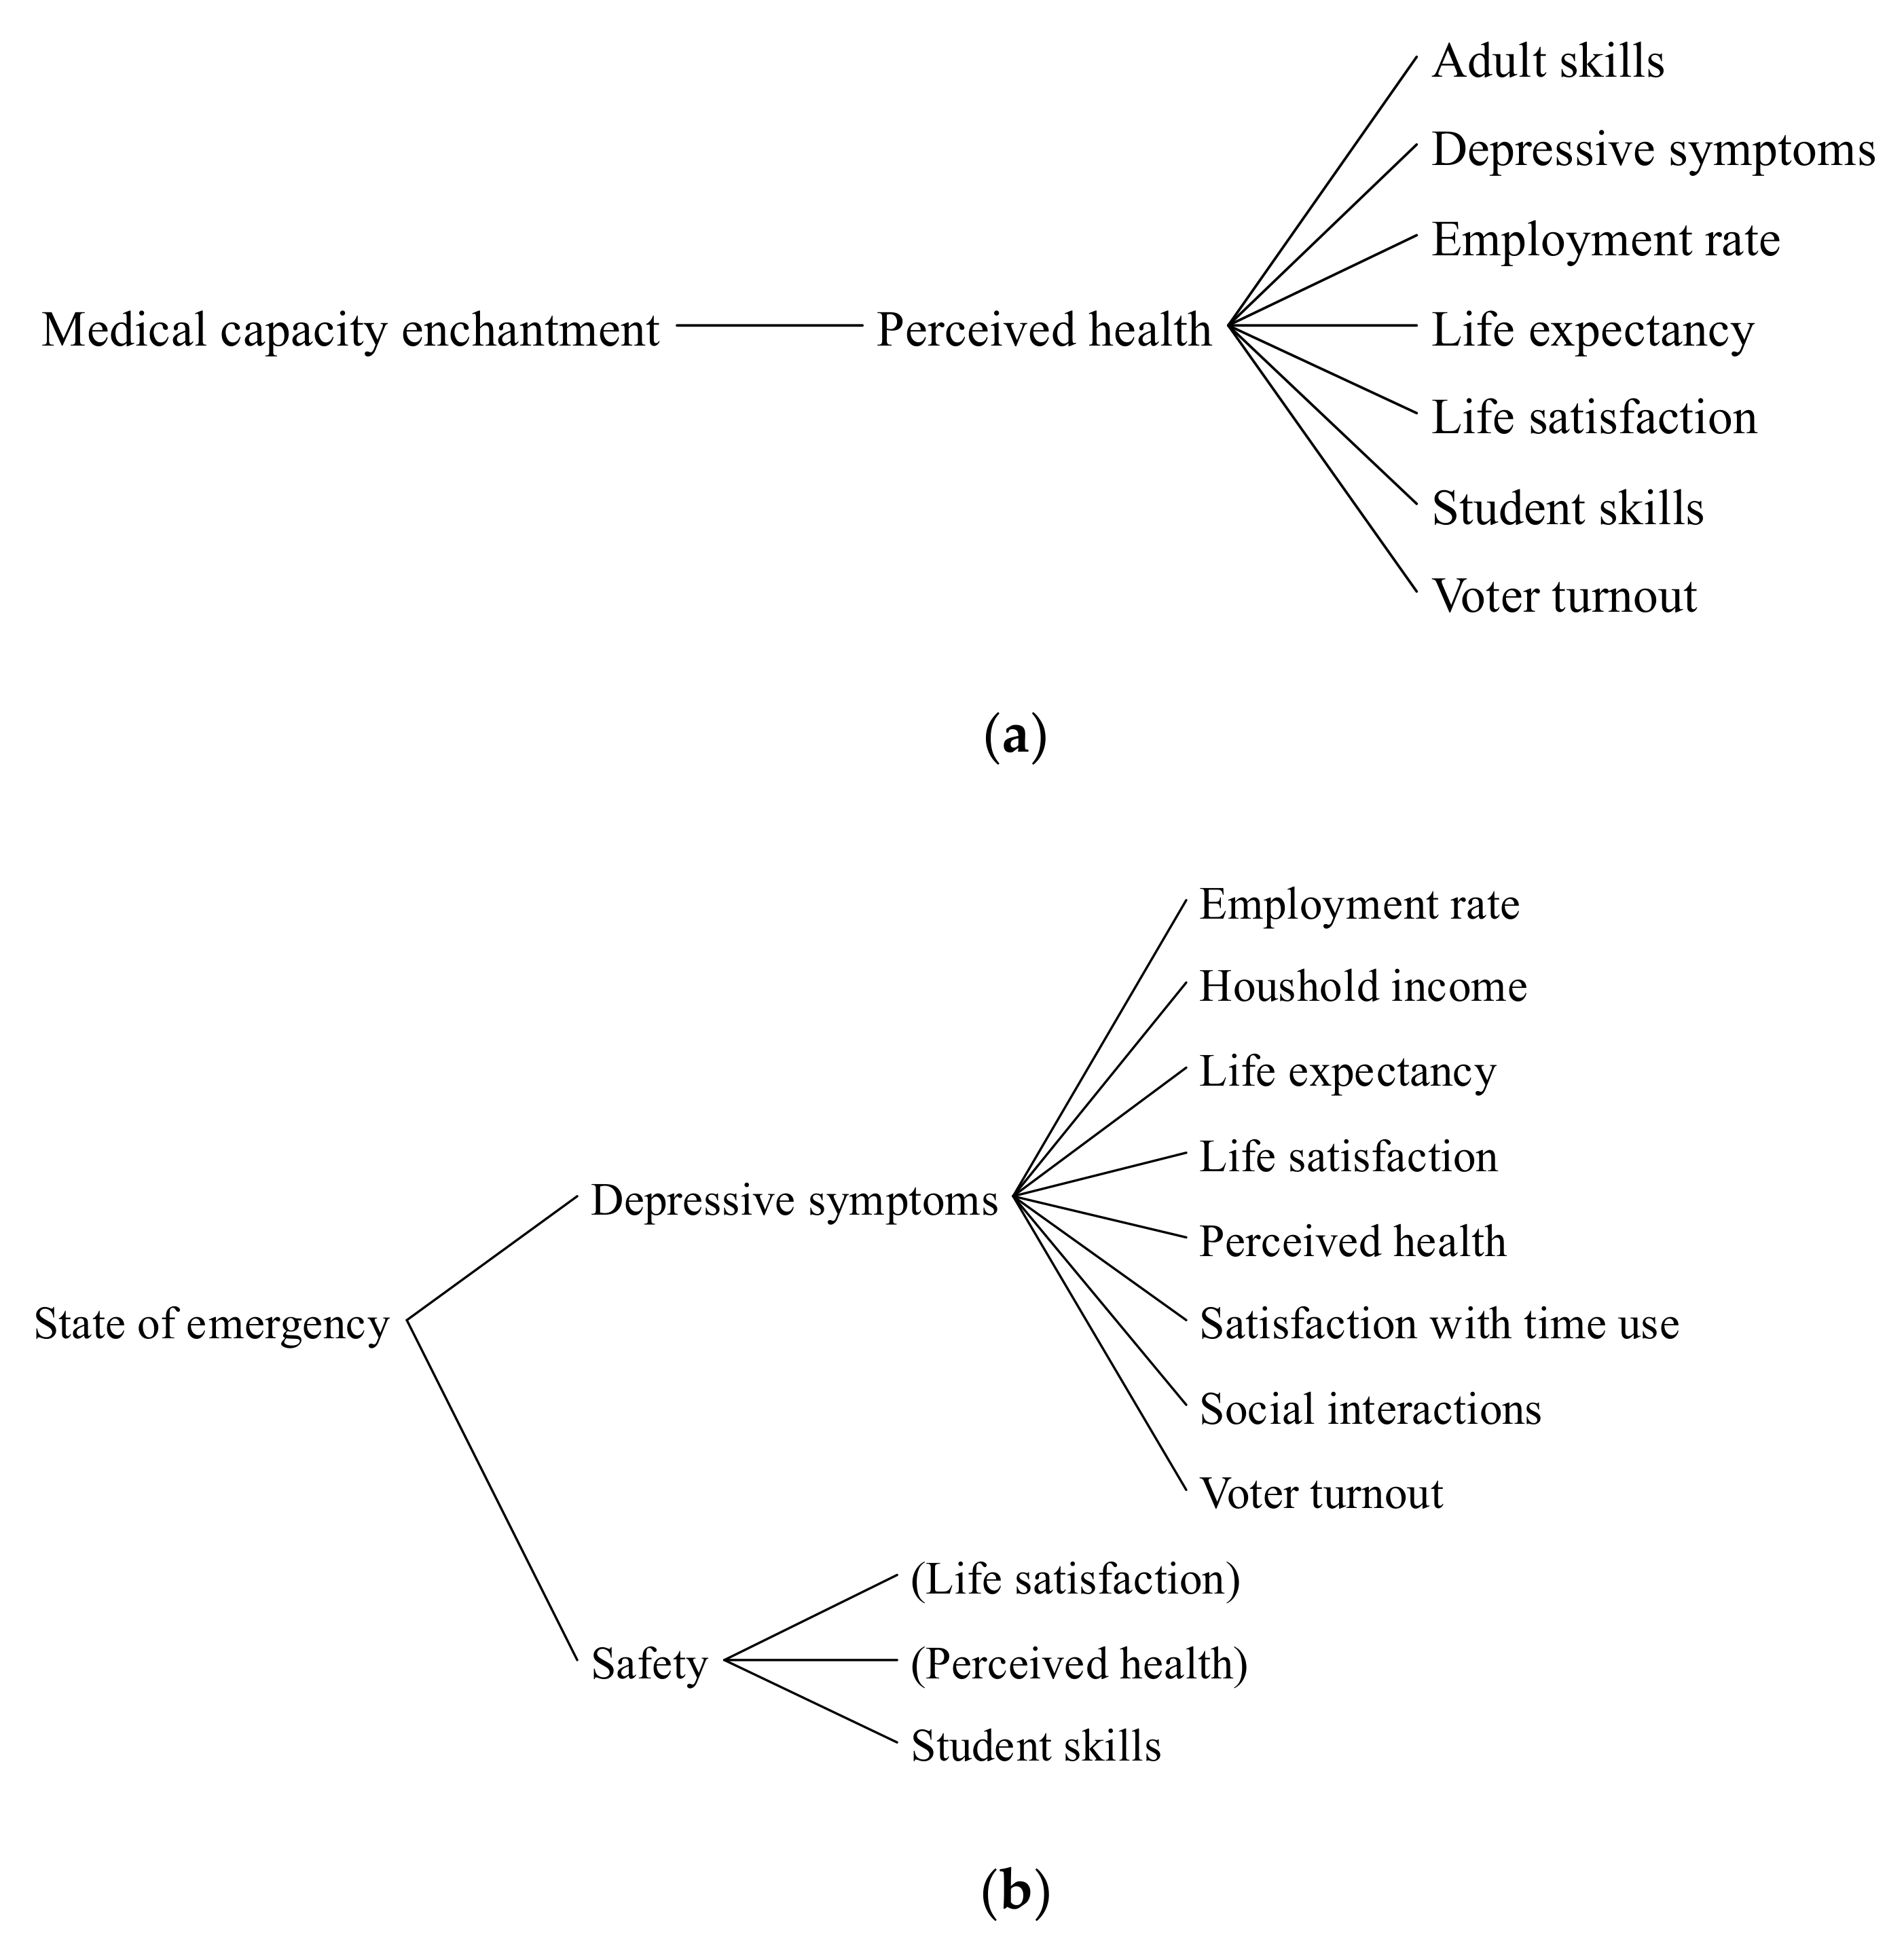
| 1 | State of emergency | Depressive Symptoms | 1 | This study examined the state of emergency during the COVID-19 pandemic on mental health in Latvia and identified several risk and protective factors for self-reported changes in anxiety, depressive thoughts, suicidal thoughts as well as distress and depression. | [192] |
| 2 | State of emergency | Safety | 1 | In all of our tests across different years and different time periods, we find that the implementation of social distancing and quarantine protocols led to significant decreases in crime in the first two weeks. There were declines during the state-of-emergency time period (9–21 March), but they were not statistically significant. | [193] |
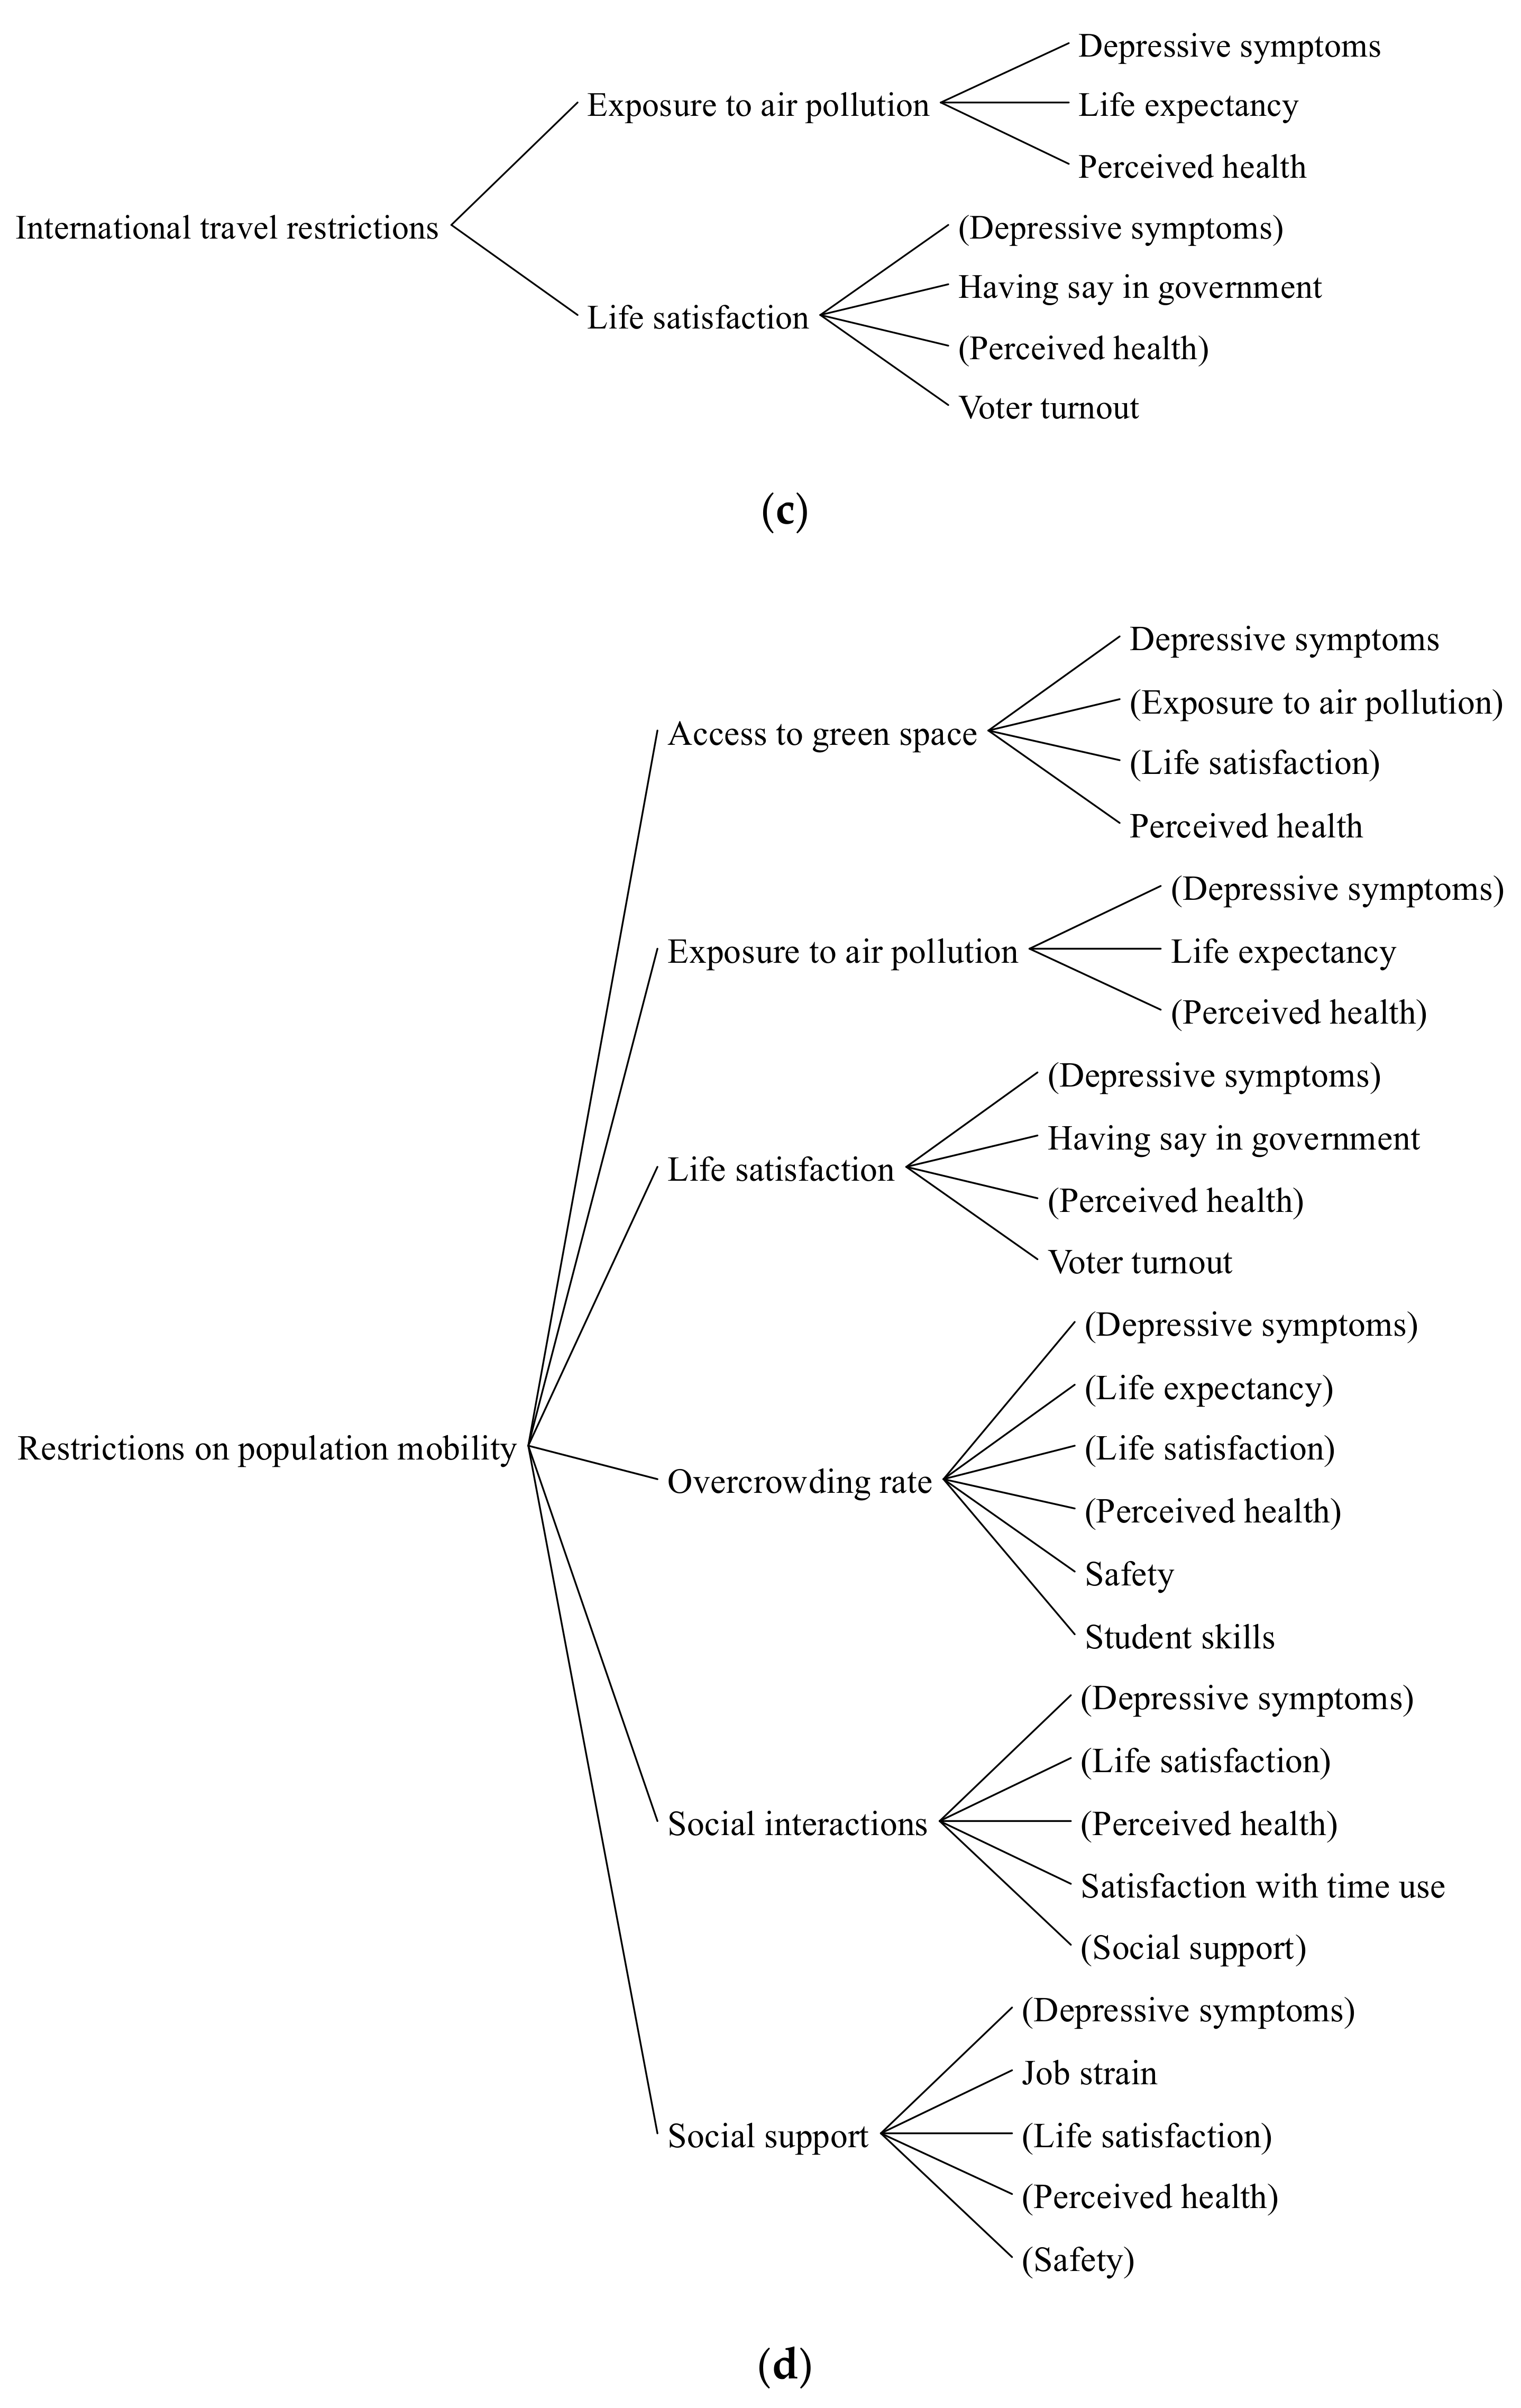
| 3 | Restrictions on population mobility | Overcrowding rate | 1 | Nearly 12% of OECD households, on average, live in crowded conditions. This is likely to add to the psychosocial strains of confinement and social distancing measures, whilst also making it very difficult to isolate symptomatic individuals from other household members. | [28] |
| 4 | Restrictions on population mobility | Exposure to air pollution | −1 | The transportation reduction is responsible for the declines of NO2 and CO, due to the restriction of human mobility (e.g., automobile use decreased in all cities during lockdown) | [194] |
| 5 | Restrictions on population mobility | Access to green space | −1 | <…> many public parks and green spaces were also closed because of concerns about social distancing, and most state and local shelter-in-place orders allow only limited use of parks and green space. | [195] |
| 6 | Restrictions on population mobility | Life satisfaction | −1 | Life satisfaction decreased as the days of home confinement progressed. | [196] |
| 7 | Restrictions on population mobility | Social Support | −1 | Both voluntary social distancing and mandatory confinement policies have obvious implications for people’s ability to maintain social relationships beyond immediate household members—whether for instrumental or emotional support, or simply for companionship. | [28] |
| 8 | Restrictions on population mobility | Social interactions | −1 | We found that most of our participants (92%) were respecting the stay-at-home order which meant that they could not have in-person contact with family and friends outside of household members. | [197] |
| 9 | Quarantines | Overcrowding rate | 1 | Nearly 12% of OECD households, on average, live in crowded conditions. This is likely to add to the psychosocial strains of confinement and social distancing measures, whilst also making it very difficult to isolate symptomatic individuals from other household members. | [28] |
| 10 | Quarantines | Depressive Symptoms | 1 | We conducted a rapid review of the psychological impact of quarantine using three electronic databases. The majority of reviewed studies reported negative psychological effects including post-traumatic stress symptoms, confusion, and anger. | [198] |
| 11 | Quarantines | Life satisfaction | −1 | Perceived social isolation was associated with poor life satisfaction. | [199] |
| 12 | Quarantines | Social interactions | −1 | Using both survey data and diary records, we found some major differences across stages of home quarantine and between groups. Not only did the extent of daily contacts shrink during and after quarantine, but the proportion of face-to-face contacts also decreased. | [200] |
| 13 | Medical capacity enhancement | Perceived health | 1 | This shift to telehealth has simultaneously decreased exposure for patients and providers and has kept medical staff who are serving on the front lines less exposed and thus available for in person care when needed. Furthermore, telehealth has allowed providers who are COVID-19 positive with mild symptoms and providers who are in the “high risk” population for COVID-19 to remain at home while still contributing to the care of patients. This dual benefit of flattening the curve and maintaining capacity in the healthcare system during the COVID-19 crisis cannot be overstated. | [201] |
| 14 | International travel restrictions | Exposure to air pollution | −1 | Of course, the decrease in the number of commercial flights concomitantly has led to a decrease in aviation emissions from flight operations, and even to a halt in a number of months of 2020. International commercial flights in Turkey in particular, came to a halt in April, May, June, and July 2020, and the emissions amounts presented by the COVID-19 period show an approximate 99% reduction compared to the previous year. | [202] |
| 15 | International travel restrictions | Life satisfaction | −1 | <…> countless travel plans have been disrupted globally. The loss of these travel experiences, however, may cause a negative psychological impact (e.g., anxiety, frustration, or stress). Depending on an individual’s ability to cope with adversity, these negative emotional responses can cause abnormal compensating behavior. | [203] |
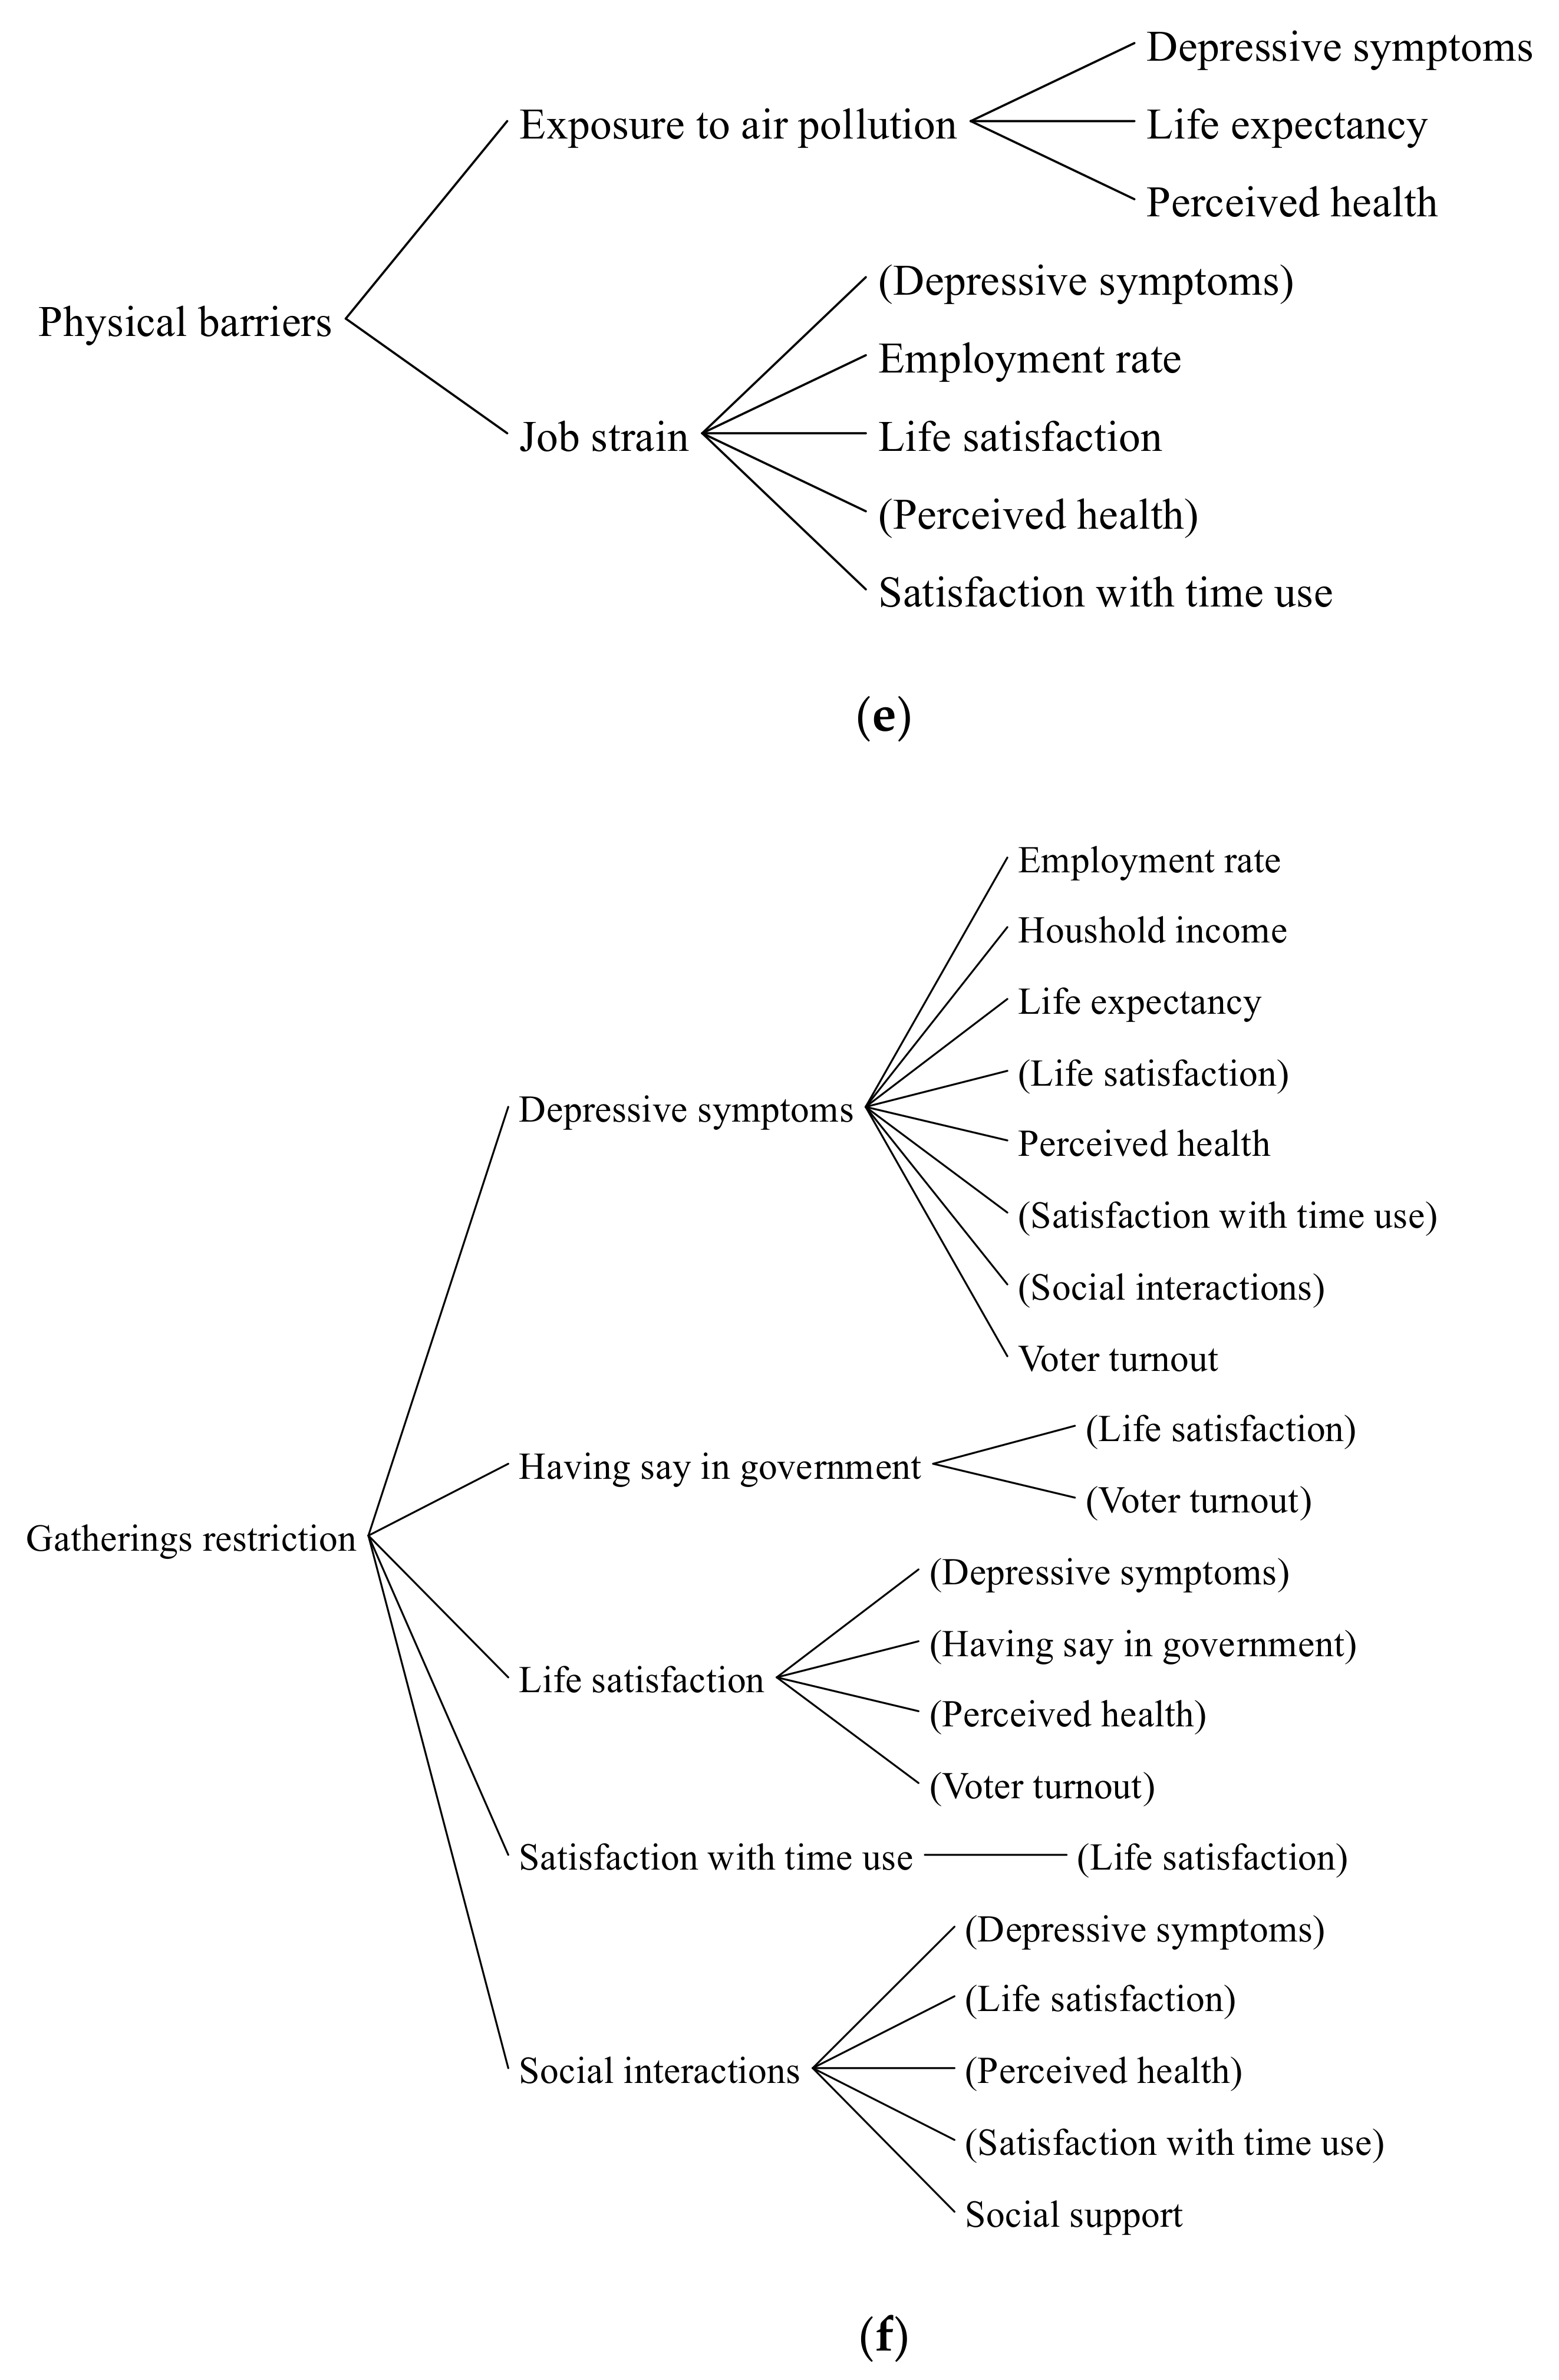
| 16 | Gatherings restriction | Depressive Symptoms | 1 | In within-person comparisons we find that interaction and co-studying networks had become sparser, and more students were studying alone. Furthermore, students’ levels of stress, anxiety, loneliness, and depressive symptoms became worse, compared to measures before the crisis. Stressors shifted from fears of missing out on social life to worries about health, family, friends, and their future. | [204] |
| 17 | Gatherings restriction | Life satisfaction | −1 | The lockdown measures discouraged group gatherings, which might have affected boys’ life satisfaction more than girls’ life satisfaction. | [205] |
| 18 | Gatherings restriction | Satisfaction with time use | −1 | We also found clear evidence that the quality of time use decreased during both lockdowns, with increases in leisure time spent alone and a larger proportion of individuals working unusual hours and conducting housework during working hours. | [206] |
| 19 | Gatherings restriction | Having a say in government | −1 | There is a risk that governments may use the current need to restrict public gatherings as a pretext to crack down on the wave of antigovernment protests that have roiled global politics over the past several years. <…> The pandemic threatens to upend electoral processes around the world. Putting off elections means that citizens are (at least temporarily) deprived of their right to choose their leaders, at a time when leadership choices are of paramount importance. | [207] |
| 20 | Gatherings restriction | Social interactions | −1 | Large social gatherings—for example, weddings, school assemblies, sporting events—also present key opportunities for affirming and assimilating interactional norms, building cohesion and shared identity, and facilitating cooperation across social groups. Online ‘equivalents’ do not easily support ‘social-bonding’ activities such as singing and dancing, and rarely enable chance/spontaneous one-on-one conversations with peripheral/weaker network ties (see the Social networks section) which can help strengthen bonds across a larger network. | [208] |
| 21 | Enhancement of physical barriers | Job strain | 1 | Wearing a mask and gloves and also using a face shield for several hours are very difficult because it cannot be tolerated for an hour, but you have to endure it in six hours, and you cannot even meet your basic needs. | [209] |
| 22 | Enhancement of physical barriers | Exposure to air pollution | −1 | Prior to the COVID-19 epidemic, there has been a vigorous debate about the efficacy of PPEs, including N95 respirators and masks, in protecting the public against air pollution risk (which is for the most part cardiovascular) and ‘flattening’ the shape of the air pollution exposure response curve. <…> The lessons learnt from COVID-19 could be leveraged to reduce air pollution-related cardiovascular mortality and morbidity once this current impasse from the virus lifts, the inevitable resumption of anthropogenic activity and related fossil fuel consumption at least in the short term. | [210] |
| 23 | Closures | Household Income | −1 | The total employment income at EU level decreases by −4.8%, with the largest decreases due to absences and reduced hours. | [211] |
| 24 | Closures | Relative income poverty | 1 | Our analysis reveals substantial and uneven potential wage losses across the distribution all around Europe and we consistently find that both poverty and wage inequality rise in all European countries. Under four different scenarios (2 months of lockdown and 2 months of lockdown plus 6 months of partial functioning of closed occupations at 80%, 70% and 60% of full capacity) we estimate for 29 European countries an average increase in the headcount poverty index that goes from 4.9 to 9.4 percentage points and a mean loss rate for poor workers between 10% and 16.2% | [212] |
| 25 | Closures | Financial insecurity | 1 | Three fourths of Indian population are working in unorganized sectors and lockdown may result in financial insecurity for them. | [213] |
| 26 | Closures | Overcrowding rate | 1 | In the living space dimension, we do not only capture whether the household is overcrowded or not—clearly related to its composition and number of household members—but also the degree of overcrowding. This last aspect is even more relevant given that in a lockdown situation the level of occupancy of the dwelling—in terms of the number of members that reside there and the time they spend in that dwelling—has changed. | [214] |
| 27 | Closures | Employment rate | −1 | The initial impact of the COVID-19 crisis on OECD labor markets where data are available has been ten times larger than that observed in the first months of the 2008 global financial crisis: taking into account both the drop in employment and the reduction in hours worked among those who remained in work. | [215] |
| 28 | Closures | Labor market insecurity | 1 | The COVID-19 pandemic has generated a deep economic crisis, exacerbating worldwide feelings of uncertainty and precarity. Individuals with insecure jobs have (and will) probably suffered the most from this situation. | [216] |
| 29 | Closures | Gender wage gap | 1 | Thus, it seems that the COVID-19 pandemic affects women more heavily than men at the physical level of work (e.g., women are reducing more paid work hours than men). In addition, the pandemic seems to boost existing differences at the cognitive level of work further (e.g., women are more worried about childcare work while men about paid work). Both processes may lead to a widening of the gender wage gap during the recovery process. | [217] |
| 30 | Closures | Depressive Symptoms | 1 | Our findings suggest that small business closures and reduced mobility during COVID-19 pandemic were negatively associated with the two mental health outcomes in the USA, despite their important roles in preventing the infection. | [218] |
| 31 | Closures | Student Skills | −1 | Despite favorable conditions, we find that students made little or no progress while learning from home. Learning loss was most pronounced among students from disadvantaged homes. | [219] |
| 32 | Closures | Exposure to air pollution | −1 | We find that, after accounting for meteorological variations, lockdown events have reduced the population-weighted concentration of nitrogen dioxide and particulate matter levels by about 60% and 31% in 34 countries, with mixed effects on ozone. | [220] |
| 33 | Closures | Life satisfaction | −1 | Controlling for the evolution of the pandemic itself (via the 4-week average number of daily deaths), our panel analysis reveals that more-stringent policies significantly reduce life satisfaction. | [221] |
| 34 | Closures | Satisfaction with time use | −1 | The main finding of this paper is the negative and statistically significant association found between the closures of bars and restaurants and people’s life satisfaction. | [222] |
| 35 | Closures | Social interactions | −1 | Perceived levels of loneliness under strict lockdown measures due to COVID-19 were relatively stable in the UK, but for many people these levels were high with no signs of improvement. | [223] |
References
- Kosfeld, R.; Mitze, T.; Rode, J.; Wälde, K. The Covid-19 Containment Effects of Public Health Measures: A Spatial Difference-in-differences Approach. J. Reg. Sci. 2021, 61, 799–825. [Google Scholar] [CrossRef]
- Vindegaard, N.; Benros, M.E. COVID-19 Pandemic and Mental Health Consequences: Systematic Review of the Current Evidence. Brain Behav. Immun. 2020, 89, 531–542. [Google Scholar] [CrossRef]
- Guerriero, C.; Haines, A.; Pagano, M. Health and Sustainability in Post-Pandemic Economic Policies. Nat. Sustain. 2020, 3, 494–496. [Google Scholar] [CrossRef]
- Saikia, U.; Dodd, M.M.; Chalmers, J.; Dasvarma, G.; Schech, S. COVID-19, Individual Wellbeing and Multi-Dimensional Poverty in the State of South Australia. PLoS ONE 2021, 16, e0252898. [Google Scholar] [CrossRef]
- VanderWeele, T.J.; Fulks, J.; Plake, J.F.; Lee, M.T. National Well-Being Measures Before and during the COVID-19 Pandemic in Online Samples. J. Gen. Int. Med. 2021, 36, 248–250. [Google Scholar] [CrossRef] [PubMed]
- Ashford, N.A.; Hall, R.P.; Arango-Quiroga, J.; Metaxas, K.A.; Showalter, A.L. Addressing Inequality: The First Step Beyond COVID-19 and Towards Sustainability. Sustainability 2020, 12, 5404. [Google Scholar] [CrossRef]
- Ahmed, F.; Ahmed, N.; Pissarides, C.; Stiglitz, J. Why Inequality Could Spread COVID-19. Lancet Public Health 2020, 5, e240. [Google Scholar] [CrossRef]
- Hynes, W.; Trump, B.; Love, P.; Linkov, I. Bouncing Forward: A Resilience Approach to Dealing with COVID-19 and Future Systemic Shocks. Environ. Syst. Decis. 2020, 40, 174–184. [Google Scholar] [CrossRef] [PubMed]
- Chen, D.T.-H.; Wang, Y.-J. Inequality-Related Health and Social Factors and Their Impact on Well-Being during the COVID-19 Pandemic: Findings from a National Survey in the UK. Int. J. Environ. Res. Public Health 2021, 18, 1014. [Google Scholar] [CrossRef]
- Howard-Jones, A.R.; Bowen, A.C.; Danchin, M.; Koirala, A.; Sharma, K.; Yeoh, D.K.; Burgner, D.P.; Crawford, N.W.; Goeman, E.; Gray, P.E.; et al. COVID-19 in Children: I. Epidemiology, Prevention and Indirect Impacts. J. Paediatr. Child Health 2021. [Google Scholar] [CrossRef]
- Brenner, M.H.; Bhugra, D. Acceleration of Anxiety, Depression, and Suicide: Secondary Effects of Economic Disruption Related to COVID-19. Front. Psychiatry 2020, 11, 1442. [Google Scholar] [CrossRef] [PubMed]
- Ilmola-Sheppard, L.; Strelkovskii, N.; Rovenskaya, E.; Abramzon, S.; Bar, R. A Systems Description of the National Well-Being System, Version 1.0; WP-20-003: Laxenburg, Austria, 2020. [Google Scholar]
- Bradley, D.T.; Mansouri, M.A.; Kee, F.; Garcia, L.M.T. A Systems Approach to Preventing and Responding to COVID-19. EClinicalMedicine 2020, 21, 100325. [Google Scholar] [CrossRef] [PubMed]
- Hassan, I.; Obaid, F.; Ahmed, R.; Abdelrahman, L.; Adam, S.; Adam, O.; Yousif, M.A.; Mohammed, K.; Kashif, T. A Systems Thinking Approach for Responding to the COVID-19 Pandemic. East. Mediterr. Health J. 2020, 26, 872–876. [Google Scholar] [CrossRef]
- Klement, R.J. Systems Thinking About SARS-CoV-2. Front. Public Health 2020, 8, 1–6. [Google Scholar] [CrossRef] [PubMed]
- Kontogiannis, T. A Qualitative Model of Patterns of Resilience and Vulnerability in Responding to a Pandemic Outbreak with System Dynamics. Saf. Sci. 2021, 134, 105077. [Google Scholar] [CrossRef]
- Sahin, O.; Salim, H.; Suprun, E.; Richards, R.; MacAskill, S.; Heilgeist, S.; Rutherford, S.; Stewart, R.A.; Beal, C.D. Developing a Preliminary Causal Loop Diagram for Understanding the Wicked Complexity of the COVID-19 Pandemic. Systems 2020, 8, 20. [Google Scholar] [CrossRef]
- Zięba, K. How Can Systems Thinking Help Us in the COVID-19 Crisis? Knowl. Process Manag. 2021, 1–10. [Google Scholar] [CrossRef]
- Dickerson, D. Seven Tips to Manage Your Mental Health and Well-Being during the COVID-19 Outbreak. Nature 2020. [Google Scholar] [CrossRef]
- Prime, H.; Wade, M.; Browne, D.T. Risk and Resilience in Family Well-Being during the COVID-19 Pandemic. Am. Psychol. 2020, 75, 631–643. [Google Scholar] [CrossRef]
- Rajkumar, R.P. COVID-19 and Mental Health: A Review of the Existing Literature. Asian J. Psychiatry 2020, 52, 102066. [Google Scholar] [CrossRef]
- Shigemura, J.; Ursano, R.J.; Morganstein, J.C.; Kurosawa, M.; Benedek, D.M. Public Responses to the Novel 2019 Coronavirus (2019-nCoV) in Japan: Mental Health Consequences and Target Populations. Psychiatry Clin. Neurosci. 2020, 74, 281–282. [Google Scholar] [CrossRef] [PubMed]
- Morrison, P.S.; Rossouw, S.; Greyling, T. The Impact of Exogenous Shocks on National Wellbeing. New Zealanders’ Reaction to COVID-19. Appl. Res. Qual. Life 2021. [Google Scholar] [CrossRef]
- Greyling, T.; Rossouw, S.; Adhikari, T. A Tale of Three Countries: What Is the Relationship between COVID-19, Lockdown and Happiness? S. Afr. J. Econ. 2021, 89, 25–43. [Google Scholar] [CrossRef]
- Greyling, T.; Rossouw, S.; Adhikari, T. The Good, the Bad and the Ugly of Lockdowns during Covid-19. PLoS ONE 2021, 16, e0245546. [Google Scholar] [CrossRef]
- Rossouw, S.; Greyling, T.; Adhikari, T. Happiness Lost: Was the Decision to Implement Lockdown the Correct One? S. Afr. J. Econ. Manag. Sci. 2021, 24, a3795. [Google Scholar] [CrossRef]
- Greyling, T.; Rossouw, S. AFSTEREO Gross National Happiness Index. Available online: https://gnh.today/ (accessed on 10 November 2021).
- OECD. COVID-19: Protecting People and Societies. In Tackling Coronavirus (COVID-19)—Contributing to the Global Effort; OECD Publishing: Paris, France, 2020. [Google Scholar]
- Hale, T.; Angrist, N.; Goldszmidt, R.; Kira, B.; Petherick, A.; Phillips, T.; Webster, S.; Cameron-Blake, E.; Hallas, L.; Majumdar, S.; et al. A Global Panel Database of Pandemic Policies (Oxford COVID-19 Government Response Tracker). Nat. Hum. Behav. 2021, 5, 529–538. [Google Scholar] [CrossRef] [PubMed]
- Brauner, J.M.; Mindermann, S.; Sharma, M.; Johnston, D.; Salvatier, J.; Gavenčiak, T.; Stephenson, A.B.; Leech, G.; Altman, G.; Mikulik, V.; et al. Inferring the Effectiveness of Government Interventions against COVID-19. Science 2021, 371. [Google Scholar] [CrossRef]
- Haug, N.; Geyrhofer, L.; Londei, A.; Dervic, E.; Desvars-Larrive, A.; Loreto, V.; Pinior, B.; Thurner, S.; Klimek, P. Ranking the Effectiveness of Worldwide COVID-19 Government Interventions. Nat. Hum. Behav. 2020, 4, 1303–1312. [Google Scholar] [CrossRef]
- OECD. How’s Life? 2020: Measuring Well-Being; How’s Life? OECD Publishing: Paris, France, 2020; ISBN 9789264111615. [Google Scholar]
- Bartmann, R.; Strelkovskii, N.; Rovenskaya, E. A Systems Description of the National Well-Being System. Version 2.0: Attaching Data Sources and Identifying Leverage Points and Responsible Institutions; WP-20-018; International Institute for Applied Systems Analysis: Laxenburg, Austria, 2020. [Google Scholar]
- Gurría, A. Launch of the OECD WISE Centre, 25 November 2020. Opening Remarks by Angel Gurría, Secretary-General, OECD. Available online: https://www.oecd.org/about/secretary-general/oecd-sg-remarks-to-launch-oecd-wise-centre-november-2020.htm (accessed on 18 December 2020).
- Unleashing Science: International Science Council. Delivering Missions for Sustainability; International Science Council: Paris, France, 2021. [Google Scholar]
- Bache, I.; Reardon, L. The Politics and Policy of Wellbeing; Edward Elgar Publishing: Cheltenham, UK, 2016; ISBN 9781783479337. [Google Scholar]
- Epstein, J.M. Why Model? J. Artif. Soc. Soc. Simul. 2008, 11, 12. [Google Scholar]
- Martin, M.; Lawson, M.; Abdo, N.; Waddock, D.; Walker, J. Fighting Inequality in the Time of COVID-19: The Commitment to Reducing Inequality Index 2020; Oxfam GB: Oxford, UK, 2020. [Google Scholar] [CrossRef]
- The Economist Covid-19 Leaves a Legacy of Increased Inequality. Available online: https://www.economist.com/the-world-ahead/2020/11/17/covid-19-leaves-a-legacy-of-increased-inequality (accessed on 27 September 2021).
- Lepenies, P. The Power of a Single Number; Columbia University Press: New York, NY, USA, 2016; ISBN 978-3-319-93193-7. [Google Scholar]
- Dalziel, P.; Saunders, C.; Saunders, J. Wellbeing Economics. The Capabilities Approach to Prosperity; Springer International Publishing: Cham, Switzerland, 2018; ISBN 978-3-319-93193-7. [Google Scholar]
- Lucas, R.E. On the Mechanics of Economic Development. J. Monet. Econ. 1988, 22, 3–42. [Google Scholar] [CrossRef]
- Easterlin, R.A. Paradox Lost? Rev. Behav. Econ. 2017, 4, 311–339. [Google Scholar] [CrossRef]
- Layard, R. Happiness and Public Policy: A Challenge to the Profession. Econ. J. 2006, 116, C24–C33. [Google Scholar] [CrossRef]
- Maslow, A.H. A Theory of Human Motivation. Psychol. Rev. 1943, 50, 370–396. [Google Scholar] [CrossRef]
- OECD. OECD Guidelines on Measuring Subjective Well-Being; OECD Publishing: Paris, France, 2013; ISBN 9789264191648. [Google Scholar]
- Stiglitz, J.; Sen, A.; Fitoussi, J.-P. Report by the Commission on the Measurement of Economic Performance and Social Progress; The Commission on the Measurement of Economic Performance and Social Progress: Paris, France, 2009. [Google Scholar]
- Merriam-Webster Merriam-Webster Dictionary. Available online: https://www.merriam-webster.com/dictionary/well-being (accessed on 7 August 2019).
- Easterlin, R.A. Building a Better Theory of Well-Being; IZA Discussion Papers No. 742; Oxford University Press: Oxford, UK; Institute for the Study of Labor (IZA): Bonn, Germany, 2003; Available online: https://www.econstor.eu/bitstream/10419/20411/1/dp742.pdf (accessed on 7 August 2019).
- Fayers, P.M.; Machin, D. Introduction. In Quality of Life: Assessment, Analysis and Interpretation; Wiley: New York, NY, USA, 2000; pp. 1–27. ISBN 9780470846285. [Google Scholar]
- Michaelson, J.; Mahoney, S.; Schifferes, J. Measuring Well-Being: A Guide for Practitioners; New Economics Foundation: London, UK, 2012. [Google Scholar]
- Ryff, C.D. Psychological Well-Being in Adult Life. Curr. Dir. Psychol. Sci. 1995, 4, 99–104. [Google Scholar] [CrossRef]
- Nussbaum, M. Creating Capabilities; Harvard University Press: Cambridge, MA, USA; London, UK, 2011; ISBN 9780674061200. [Google Scholar]
- Sen, A. Well-Being, Agency and Freedom: The Dewey Lectures 1984. J. Philos. 1985, 82, 169–221. [Google Scholar] [CrossRef]
- Sen, A. Capability and Well-Being. In The Quality of Life; Nussbaum, M., Sen, A., Eds.; Clarendon Press: Oxford, UK, 1993. [Google Scholar]
- Durand, M.; Balestra, C.; Exton, C.; Marguerit, D.; Mira D’ercole, M.; Monje-Jelfs, J.; Scrivens, K.; Shinwell, M.; Tosetto, E.; Hey, N.; et al. Countries’ Experiences with Well-Being and Happiness Metrics. In Global Happiness Policy Report 2018; Sustainable Development Solutions Network: New York, NY, USA, 2018. [Google Scholar]
- Allin, P.; Hand, D.J. The Wellbeing of Nations. Meaning, Motive and Measurement; John Wiley & Sons, Ltd.: Chichester, UK, 2014; ISBN 9781118917046. [Google Scholar]
- UNDP. Human Development Report 1990: Concept and Measurement of Human Development; United Nations Development Programme: New York, NY, USA, 1990. [Google Scholar]
- OECD. Better Life Initiative: Measuring Well-Being and Progress. Available online: http://www.oecd.org/statistics/better-life-initiative.htm (accessed on 17 December 2020).
- Exton, C.; Fleischer, L. The Future of the OECD Well-Being Dashboard; OECD Statistics Working Papers; OECD Publishing: Paris, France, 2020. [Google Scholar]
- Durand, M. The OECD Better Life Initiative: How’s Life? And the Measurement of Well-Being. Rev. Income Wealth 2015, 61, 4–17. [Google Scholar] [CrossRef]
- Exton, C.; Shinwell, M. Policy Use of Well-Being Metrics: Describing Countries’ Experiences; OECD Statistics Working Papers; OECD Publishing: Paris, France, 2018. [Google Scholar]
- The Centre for Bhutan Studies GNH Tools. GNH Policy & Project Screening Tools. Available online: http://www.grossnationalhappiness.com/gnh-policy-and-project-screening-tools/ (accessed on 18 December 2020).
- Csutora, M.; Zsóka, Á. Crisis as a Gateway to Social Innovation? In Beyond Transition? Understanding and Achieving Sustainable Consumption through Social Innovation. SCORAI Europe Workshop Proceedings; Lorek, S., Backhaus, J., Eds.; Sustainable Consumption Research and Action Initiative: Vienna, Austria, 2015. [Google Scholar]
- Forgie, V.E. Tackling Complexity Using Interlinked Thinking: Well-Being as a Case Study: A Dissertation Presented in Partial Fulfilment of the Requirements. Ph.D. Thesis, Massey University, Palmerston North, New Zealand, 2016. [Google Scholar]
- Eker, S.; Ilmola-Sheppard, L. Systems Thinking to Understand National Well-Being from a Human Capital Perspective. Sustainability 2020, 12, 1931. [Google Scholar] [CrossRef]
- OECD. Youth and COVID-19: Response, Recovery and Resilience. In Tackling Coronavirus (COVID-19)—Contributing to the Global Effort; OECD Publishing: Paris, France, 2020. [Google Scholar]
- World Economic Forum. COVID-19 Risks Outlook: A Preliminary Mapping and Its Implications; World Economic Forum: Geneva, Switzerland, 2020. [Google Scholar]
- Sterman, J.D. Business Dynamics: System Thinking and Modeling for a Complex World; Irwin McGraw-Hill: Boston, MA, USA, 2001. [Google Scholar]
- Blair, C.; Gralla, E.; Wetmore, F.; Goentzel, J.; Peters, M. A Systems Framework for International Development: The Data-Layered Causal Loop Diagram. Product. Oper. Manag. 2021. [Google Scholar] [CrossRef]
- Sedlacko, M.; Martinuzzi, A.; Røpke, I.; Videira, N.; Antunes, P. Participatory Systems Mapping for Sustainable Consumption: Discussion of a Method Promoting Systemic Insights. Ecol. Econ. 2014, 106, 33–43. [Google Scholar] [CrossRef]
- Homer, J.; Oliva, R. Maps and Models in System Dynamics: A Response to Coyle. Syst. Dyn. Rev. 2001, 17, 347–355. [Google Scholar] [CrossRef]
- Saleh, M.; Oliva, R.; Kampmann, C.E.; Davidsen, P.I. A Comprehensive Analytical Approach for Policy Analysis of System Dynamics Models. Eur. J. Oper. Res. 2010, 203, 673–683. [Google Scholar] [CrossRef]
- Tonnang, H.; Greenfield, J.; Mazzaferro, G.; Austin, C.C. COVID-19 Emergency Public Health and Economic Measures Causal Loops: A Computable Framework. SSRN Electron. J. 2020. [Google Scholar] [CrossRef]
- Bahri, M. The Nexus Impacts of the COVID-19: A Qualitative Perspective. Preprints 2020, 2020050033. [Google Scholar] [CrossRef]
- Strelkovskii, N.; Rovenskaya, E. Causal Loop Diagramming of Socioeconomic Impacts of COVID-19: State-of-the-Art, Gaps and Good Practices. Systems 2021, 9, 65. [Google Scholar] [CrossRef]
- Desvars-Larrive, A.; Dervic, E.; Haug, N.; Niederkrotenthaler, T.; Chen, J.; di Natale, A.; Lasser, J.; Gliga, D.S.; Roux, A.; Sorger, J.; et al. A Structured Open Dataset of Government Interventions in Response to COVID-19. Sci. Data 2020, 7, 285. [Google Scholar] [CrossRef]
- Fan, H.; Nie, X. Impacts of Layoffs and Government Assistance on Mental Health during COVID-19: An Evidence-Based Study of the United States. Sustainability 2020, 12, 7763. [Google Scholar] [CrossRef]
- Alefari, M.; Almanei, M.; Salonitis, K. A System Dynamics Model of Employees’ Performance. Sustainability 2020, 12, 6511. [Google Scholar] [CrossRef]
- Bureš, V. A Method for Simplification of Complex Group Causal Loop Diagrams Based on Endogenisation, Encapsulation and Order-Oriented Reduction. Systems 2017, 5, 46. [Google Scholar] [CrossRef]
- Vester, F. The Art of Interconnected Thinking; MCB Publishing House: München, Germany, 2007. [Google Scholar]
- Crespo Márquez, A. Dynamic Modelling for Supply Chain Management; Springer: London, UK, 2010; ISBN 978-1-84882-680-9. [Google Scholar]
- Tague, N.R. The Quality Book, 2nd ed.; ASQ Quality Press: Milwaukee, WI, USA, 2005; ISBN 9780072483116. [Google Scholar]
- Borrett, S.R.; Fath, B.D.; Patten, B.C. Functional Integration of Ecological Networks through Pathway Proliferation. J. Theor. Biology 2007, 245, 98–111. [Google Scholar] [CrossRef] [PubMed]
- Achdut, L. The Labor Market In The Coronavirus Crisis. Isr. Econ. Rev. 2020, 18, 59–79. [Google Scholar]
- Zachreson, C.; Chang, S.L.; Cliff, O.M.; Prokopenko, M. How Will Mass-Vaccination Change COVID-19 Lockdown Requirements in Australia? Lancet Reg. Health West. Pac. 2021, 14, 100224. [Google Scholar] [CrossRef] [PubMed]
- Blundell, R.; Costa Dias, M.; Joyce, R.; Xu, X. COVID-19 and Inequalities. Fisc. Stud. 2020, 41, 291–319. [Google Scholar] [CrossRef] [PubMed]
- Lee, S. Subjective Well-Being and Mental Health during the Pandemic Outbreak: Exploring the Role of Institutional Trust. Res. Aging 2020, 44, 016402752097514. [Google Scholar] [CrossRef]
- Bargain, O.; Aminjonov, U. Trust and Compliance to Public Health Policies in Times of COVID-19. J. Public Econ. 2020, 192, 104316. [Google Scholar] [CrossRef] [PubMed]
- Soga, M.; Evans, M.J.; Cox, D.T.C.; Gaston, K.J. Impacts of the COVID-19 Pandemic on Human–Nature Interactions: Pathways, Evidence and Implications. People Nat. 2021, 3, 518–527. [Google Scholar] [CrossRef]
- Christakis, D.A.; van Cleve, W.; Zimmerman, F.J. Estimation of US Children’s Educational Attainment and Years of Life Lost Associated With Primary School Closures During the Coronavirus Disease 2019 Pandemic. JAMA Netw. Open 2020, 3, e2028786. [Google Scholar] [CrossRef]
- Dos Santos, C.F.; Picó-Pérez, M.; Morgado, P. COVID-19 and Mental Health—What Do We Know So Far? Front. Psychiatry 2020, 11, 565698. [Google Scholar] [CrossRef]
- Saltzman, L.Y.; Hansel, T.C.; Bordnick, P.S. Loneliness, Isolation, and Social Support Factors in Post-COVID-19 Mental Health. Psychol. Trauma Theory Res. Pract. Policy 2020, 12, S55–S57. [Google Scholar] [CrossRef]
- Lane, D.C. The Emergence and Use of Diagramming in System Dynamics: A Critical Account. Syst. Res. Behav. Sci. 2008, 25, 3–23. [Google Scholar] [CrossRef]
- Groesser, S.N.; Schaffernicht, M. Mental Models of Dynamic Systems: Taking Stock and Looking Ahead. Syst. Dyn. Rev. 2012, 28, 46–68. [Google Scholar] [CrossRef]
- Sharma, S.; Walton, M.; Manning, S. Social Determinants of Health Influencing the New Zealand COVID-19 Response and Recovery: A Scoping Review and Causal Loop Diagram. Systems 2021, 9, 52. [Google Scholar] [CrossRef]
- Aminpour, P.; Gray, S.A.; Singer, A.; Scyphers, S.B.; Jetter, A.J.; Jordan, R.; Murphy, R.; Grabowski, J.H. The Diversity Bonus in Pooling Local Knowledge about Complex Problems. Proc. Natl. Acad. Sci. USA 2021, 118, e2016887118. [Google Scholar] [CrossRef] [PubMed]
- Bertone, E.; Luna Juncal, M.J.; Prado Umeno, R.K.; Peixoto, D.A.; Nguyen, K.; Sahin, O. Effectiveness of the Early Response to COVID-19: Data Analysis and Modelling. Systems 2020, 8, 21. [Google Scholar] [CrossRef]
- Forgie, V.E.; van den Belt, M.; McDonald, G.W. Extending the Boundaries of Economics to Well-Being: An Interlinked Thinking Approach. In Feedback Economics; Cavana, R.Y., Dangerfield, B.C., Pavlov, O.V., Radzicki, M.J., Wheat, I.D., Eds.; Springer: Cham, Switzerland, 2021; pp. 521–544. [Google Scholar]
- WHO. WHO Director-General’s Opening Remarks at the Media Briefing on COVID-19. Available online: https://www.who.int/director-general/speeches/detail/who-director-general-s-opening-remarks-at-the-media-briefing-on-covid-19---3-august-2020 (accessed on 29 July 2021).
- OECD. OECD COVID-19 Recovery Dashboard. Available online: https://www.oecd.org/coronavirus/en/recovery-dashboard (accessed on 9 November 2021).
- Blasco-Belled, A.; Tejada-Gallardo, C.; Torrelles-Nadal, C.; Alsinet, C. The Costs of the COVID-19 on Subjective Well-Being: An Analysis of the Outbreak in Spain. Sustainability 2020, 12, 6243. [Google Scholar] [CrossRef]
- Bittmann, F. How Trust Makes a Difference: The Impact of the First Wave of the COVID-19 Pandemic on Life Satisfaction in Germany. Appl. Res. Qual. Life 2021, 1–7. [Google Scholar] [CrossRef]
- Metin, A.; Çetinkaya, A.; Erbiçer, E.S. Subjective Well-Being and Resilience During COVID-19 Pandemic in Turkey. Eur. J. Health Psychol. 2021, 28, 152–160. [Google Scholar] [CrossRef]
- OECD. A Systemic Resilience Approach to Dealing with COVID-19 and Future Shocks; OECD Publishing: Paris, France, 2020. [Google Scholar]
- OECD. COVID-19 and Well-Being: Life in the Pandemic; OECD Publishing: Paris, France, 2021; ISBN 9789264871830. [Google Scholar]
- Raimo, N.; Rella, A.; Vitolla, F.; Sánchez-Vicente, M.-I.; García-Sánchez, I.-M. Corporate Social Responsibility in the COVID-19 Pandemic Period: A Traditional Way to Address New Social Issues. Sustainability 2021, 13, 6561. [Google Scholar] [CrossRef]
- Givoni, M.; Macmillen, J.; Banister, D.; Feitelson, E. From Policy Measures to Policy Packages. Transp. Rev. 2013, 33, 1–20. [Google Scholar] [CrossRef]
- Twohig-Bennett, C.; Jones, A. The Health Benefits of the Great Outdoors: A Systematic Review and Meta-Analysis of Greenspace Exposure and Health Outcomes. Environ. Res. 2018, 166, 628–637. [Google Scholar] [CrossRef]
- McEachan, R.R.C.; Prady, S.L.; Smith, G.; Fairley, L.; Cabieses, B.; Gidlow, C.; Wright, J.; Dadvand, P.; van Gent, D.; Nieuwenhuijsen, M.J. The Association between Green Space and Depressive Symptoms in Pregnant Women: Moderating Roles of Socioeconomic Status and Physical Activity. J. Epidemiol. Community Health 2016, 70, 253–259. [Google Scholar] [CrossRef]
- European Environment Agency Forests, Health and Climate Change. Available online: https://www.eea.europa.eu/articles/forests-health-and-climate-change (accessed on 29 September 2021).
- JRF Can Improving UK Skills Levels Reduce Poverty and Income Inequality by 2020? Available online: https://www.jrf.org.uk/report/can-improving-uk-skills-levels-reduce-poverty-and-income-inequality-2020 (accessed on 29 September 2021).
- OECD. OECD Better Life Index. Education. Available online: http://www.oecdbetterlifeindex.org/topics/education/ (accessed on 18 February 2020).
- Pew Research Center Women Gain as Demand for Skilled Workers Rises. Available online: https://www.pewresearch.org/social-trends/2020/01/30/women-make-gains-in-the-workplace-amid-a-rising-demand-for-skilled-workers/ (accessed on 29 September 2021).
- Rigó, M.; Dragano, N.; Wahrendorf, M.; Siegrist, J.; Lunau, T. Work Stress on Rise? Comparative Analysis of Trends in Work Stressors Using the European Working Conditions Survey. Int. Arch. Occu. Environ. Health 2021, 94, 459–474. [Google Scholar] [CrossRef]
- The Guardian UK’s ‘Hidden Disgrace’: Mental Health Problems Can Lead to 42% Pay Gap|Mental Health|The Guardian. Available online: https://www.theguardian.com/society/2016/aug/06/mental-health-pay-gap-depression-panic-attacks (accessed on 29 September 2021).
- Bubonya, M.; Cobb-Clark, D.A.; Ribar, D. The Bilateral Relationship between Depressive Symptoms and Employment Status; IZA Discussion Papers No. 10653; Institute for the Study of Labor (IZA): Bonn, Germany, 2017. [Google Scholar]
- Chang, C.-K.; Hayes, R.D.; Perera, G.; Broadbent, M.T.M.; Fernandes, A.C.; Lee, W.E.; Hotopf, M.; Stewart, R. Life Expectancy at Birth for People with Serious Mental Illness and Other Major Disorders from a Secondary Mental Health Care Case Register in London. PLoS ONE 2011, 6, e19590. [Google Scholar] [CrossRef] [PubMed]
- The Centre for Bhutan Studies and GNH. Happiness. Transforming the Development Landscape; The Centre for Bhutan Studies and GNH: Thimphu, Bhutan, 2017; ISBN 9789993614906. [Google Scholar]
- Potthoff, P.; Eichmann, F.; Kanitscheider, C. Five-Year Impact of Depression on Life-Satisfaction and The Protective Influence of Social Support. Value Health 2015, 18, A122. [Google Scholar] [CrossRef][Green Version]
- Reynolds, S.L.; Haley, W.E.; Kozlenko, N. The Impact of Depressive Symptoms and Chronic Diseases on Active Life Expectancy in Older Americans. Am. Geriatr. Psychiatry 2008, 16, 425–432. [Google Scholar] [CrossRef]
- Elmer, T.; Stadtfeld, C. Depressive Symptoms Are Associated with Social Isolation in Face-to-Face Interaction Networks. Sci. Rep. 2020, 10, 1444. [Google Scholar] [CrossRef] [PubMed]
- Ojeda, C.; Slaughter, C.M. Intersectionality, Depression, and Voter Turnout. J. Health Politics Policy Law 2019, 44, 479–504. [Google Scholar] [CrossRef]
- Department of the Taoiseach. First Report on Well-Being Framework for Ireland; Department of the Taoiseach: Dublin, Ireland, 2017. [Google Scholar]
- OECD. OECD Better Life Index. Environment. Available online: http://www.oecdbetterlifeindex.org/topics/environment/ (accessed on 18 February 2020).
- Fan, S.-J.; Heinrich, J.; Bloom, M.S.; Zhao, T.-Y.; Shi, T.-X.; Feng, W.-R.; Sun, Y.; Shen, J.-C.; Yang, Z.-C.; Yang, B.-Y.; et al. Ambient Air Pollution and Depression: A Systematic Review with Meta-Analysis up to 2019. Sci. Total Environ. 2020, 701, 134721. [Google Scholar] [CrossRef]
- Deidda, M. Economic Hardship, Housing Cost Burden and Tenure Status: Evidence from EU-SILC. J. Fam. Econ. Issues 2014, 36, 531–556. [Google Scholar] [CrossRef]
- Odle-Dusseau, H.N.; Matthews, R.A.; Wayne, J.H. Employees’ Financial Insecurity and Health: The Underlying Role of Stress and Work–Family Conflict Appraisals. J. Occup. Organ. Psychol. 2018, 91, 546–568. [Google Scholar] [CrossRef]
- Rohde, N.; Tang, K.K.; Osberg, L.; Rao, P. The Effect of Economic Insecurity on Mental Health: Recent Evidence from Australian Panel Data. Soc. Sci. Med. 2016, 151, 250–258. [Google Scholar] [CrossRef]
- Barazzetta, M.; Clark, A.E.; Ambrosio, C.D. Childhood Circumstances and Adulthood Outcomes: The Effects of Mothers’ Financial Problems; Paris School of Economics: Paris, France, 2017. [Google Scholar]
- Weinstein, N.; Stone, D.N. Need Depriving Effects of Financial Insecurity: Implications for Well-Being and Financial Behaviors. J. Exp. Psychol. Gen. 2018, 147, 1503–1520. [Google Scholar] [CrossRef] [PubMed]
- Cortés, P.; Pan, J. When Time Binds: Returns to Working Long Hours and the Gender Wage Gap among the Highly Skilled; IZA Discussion Papers No. 9846; Institute for the Study of Labor (IZA): Bonn, Germany, 2016. [Google Scholar]
- Milli, J.; Huang, Y.; Hartmann, H.; Hayes, J. The Impact of Equal Pay on Poverty and the Economy; Institute for Women’s Policy Research Briefing Paper: Washington DC, USA, 2017. [Google Scholar]
- World Economic Forum An Economist Explains Why Women Are Paid Less. Available online: https://www.weforum.org/agenda/2019/03/an-economist-explains-why-women-get-paid-less/ (accessed on 30 September 2021).
- Whiteley, P.; Clarke, H.D.; Sanders, D.; Stewart, M.C. Government Performance and Life Satisfaction in Contemporary Britain. J. Politics 2010, 72, 733–746. [Google Scholar] [CrossRef]
- Grönlund, K.; Setälä, M. Political Trust, Satisfaction and Voter Turnout. Comp. Eur. Politics 2007, 5, 400–422. [Google Scholar] [CrossRef]
- Wolla, S.A.; Sullivan, J. Education, Income, and Wealth. In PAGE ONE Economics. Fed. Res. Bank St. Louis Res: St. Louis, MO, USA. 2017. Available online: https://files.stlouisfed.org/files/htdocs/publications/page1-econ/2017-01-03/education-income-and-wealth_SE.pdf (accessed on 30 September 2021).
- Chang, Y.; Chatterjee, S.; Kim, J. Household Finance and Food Insecurity. J. Fam. Econ. Issues 2014, 35, 499–515. [Google Scholar] [CrossRef]
- The Health Foundation Overcrowding Is Highest for Those with Low Incomes. Available online: https://www.health.org.uk/news-and-comment/charts-and-infographics/overcrowding-is-highest-for-those-with-low-incomes (accessed on 30 September 2021).
- Carolina Demography Median Household Income Key Predictor of Internet Access. Available online: https://www.ncdemography.org/2018/12/14/median-household-income-key-predictor-of-internet-access/ (accessed on 30 September 2021).
- Chetty, R.; Stepner, M.; Abraham, S.; Lin, S.; Scuderi, B.; Turner, N.; Bergeron, A.; Cutler, D. The Association Between Income and Life Expectancy in the United States, 2001–2014. JAMA 2016, 315, 1750. [Google Scholar] [CrossRef]
- Center for American Progress Eliminating the Black-White Wealth Gap Is a Generational Challenge. Available online: https://www.americanprogress.org/issues/economy/reports/2021/03/19/497377/eliminating-black-white-wealth-gap-generational-challenge/ (accessed on 30 September 2021).
- Xie, Y.; Jin, Y. Household Wealth in China. Chin. Sociol. Rev. 2015, 47, 203–229. [Google Scholar] [CrossRef]
- United Nations Children’s Fund and International Telecommunication Union. How Many Children and Young People Have Internet Access at Home? Estimating Digital Connectivity during the COVID-19 Pandemic; UNICEF: New York, NY, USA, 2020; ISBN 9789280652000. [Google Scholar]
- Semyonov, M.; Lewin-Epstein, N.; Maskileyson, D. Where Wealth Matters More for Health: The Wealth–Health Gradient in 16 Countries. Soc. Sci. Med. 2013, 81, 10–17. [Google Scholar] [CrossRef]
- D’Ambrosio, C.; Jäntti, M.; Lepinteur, A. Money and Happiness: Income, Wealth and Subjective Well-Being. Soc. Indic. Res. 2020, 148, 47–66. [Google Scholar] [CrossRef]
- Hampton, K.; Fernandez, L.; Robertson, C.; Bauer, J.M. Repercussions of Poor Broadband Connectivity for Students in Rural and Small Town Michigan. SSRN Electron. J. 2020. [Google Scholar] [CrossRef]
- OECD. How’s Life in the Digital Age? OECD Publishing: Paris, France, 2019; ISBN 9789264311794. [Google Scholar]
- Rowley, S.; Ong, R.; Haffner, M. Bridging the Gap between Housing Stress and Financial Stress: The Case of Australia. Hous. Stud. 2015, 30, 473–490. [Google Scholar] [CrossRef]
- Brackertz, N.; Davison, J.; Borrowman, L.; Roggenbuck, C. Overcrowding Andsevere Overcrowding: An Analysis of Literature, Data, Policies and Programs; AHURI Professional Services for NSW Department of Communities and Justice, Australian Housing and Urban Research Institute Limited: Melbourne, Australia, 2019. [Google Scholar]
- Pittini, A. Housing Affordability in the EU. Current Situation and Recent Trends; CECODHAS Housing Europe’s Observatory Research Briefing: Brussels, Belgium, 2012. [Google Scholar]
- McPhillips, M. The Impact of Housing Problems on Mental Health; Shelter: London, UK, 2017. [Google Scholar]
- Galster, G.; Lee, K.O. Housing Affordability: A Framing, Synthesis of Research and Policy, and Future Directions. Int. J. Urban Sci. 2020, 25, 7–58. [Google Scholar] [CrossRef]
- Cannuscio, C.C.; Alley, D.E.; Pagán, J.A.; Soldo, B.; Krasny, S.; Shardell, M.; Asch, D.A.; Lipman, T.H. Housing Strain, Mortgage Foreclosure, and Health. Nurs. Outlook 2012, 60, 134–142.e1. [Google Scholar] [CrossRef]
- Streimikiene, D. Quality of Life and Housing. Int. J. Inf. Educ. Technol. 2015, 5, 140–145. [Google Scholar] [CrossRef]
- Cartwright, S.; Cooper, C.L. The Oxford Handbook of Organizational Well Being; Cartwright, S., Cooper, C.L., Eds.; Oxford University Press: Oxford, UK, 2008; ISBN 9780199211913. [Google Scholar]
- Emeny, R.; Lacruz, M.E.; Baumert, J.; Zierer, A.; von Eisenhart Rothe, A.; Autenrieth, C.; Herder, C.; Koenig, W.; Thorand, B.; Ladwig, K.H. Job Strain Associated CRP Is Mediated by Leisure Time Physical Activity: Results from the MONICA/KORA Study. Brain Behav. Immun. 2012, 26, 1077–1084. [Google Scholar] [CrossRef]
- Goulden, C. Cycles of Poverty, Unemployment and Low Pay; Joseph Rowntree Foundation: York, UK, 2010. [Google Scholar]
- Chirumbolo, A.; Hellgren, J. Individual and Organizational Consequences of Job Insecurity: A European Study. Econ. Industrial Democr. 2003, 24, 217–240. [Google Scholar] [CrossRef]
- Green, F. Health Effects of Job Insecurity. IZA World Labor 2015, 212. [Google Scholar] [CrossRef]
- Vulkan, P. Labour Market Insecurity: The Effects of Job, Employment and Income Insecurity on the Mental Well-Being of Employees. Rev. Int. Organ. Int. J. Organ. 2012, 9, 169–188. [Google Scholar] [CrossRef]
- Stats NZ Lower Job Security Linked to Lower Life Satisfaction. Available online: https://www.stats.govt.nz/news/lower-job-security-linked-to-lower-life-satisfaction (accessed on 30 September 2021).
- Al-Windi, A. The Relations between Symptoms, Somatic and Psychiatric Conditions, Life Satisfaction and Perceived Health. A Primary Care Based Study. Health Qual. Life Outcomes 2005, 3, 28. [Google Scholar] [CrossRef]
- Koivumaa-Honkanen, H.; Kaprio, J.; Honkanen, R.; Viinamäki, H.; Koskenvuo, M. Life Satisfaction and Depression in a 15-Year Follow-up of Healthy Adults. Soc. Psychiatry Psychiatr. Epidemiol. 2004, 39, 994–999. [Google Scholar] [CrossRef] [PubMed]
- Hecker, D. How Hours of Work Affect Occupational Earnings. Mon. Labor Rev. 1998, 121, 8. [Google Scholar]
- Karhula, K.; Härmä, M.; Sallinen, M.; Hublin, C.; Virkkala, J.; Kivimäki, M.; Vahtera, J.; Puttonen, S. Association of Job Strain with Working Hours, Shift-Dependent Perceived Workload, Sleepiness and Recovery. Ergonomics 2013, 56, 1640–1651. [Google Scholar] [CrossRef]
- Ono, H. Why Do the Japanese Work Long Hours? Sociological Perspectives on Long Working Hours in Japan. Jpn. Labor Issues 2018, 2, 35–49. [Google Scholar]
- Kamerāde, D.; Wang, S.; Burchell, B.; Balderson, S.U.; Coutts, A. A Shorter Working Week for Everyone: How Much Paid Work Is Needed for Mental Health and Well-Being? Soc. Sci. Med. 2019, 241, 112353. [Google Scholar] [CrossRef] [PubMed]
- Peristera, P.; Westerlund, H.; Magnusson Hanson, L.L. Paid and Unpaid Working Hours among Swedish Men and Women in Relation to Depressive Symptom Trajectories: Results from Four Waves of the Swedish Longitudinal Occupational Survey of Health. BMJ Open 2018, 8, e017525. [Google Scholar] [CrossRef]
- Angrave, D.; Charlwood, A. What Is the Relationship between Long Working Hours, over-Employment, under-Employment and the Subjective Well-Being of Workers? Longitudinal Evidence from the UK. Hum. Relat. 2015, 68, 1491–1515. [Google Scholar] [CrossRef]
- Hilbrecht, M.J. Parents, Employment, Gender and Well-Being: A Time Use Study. Ph.D. Thesis, University of Waterloo, Waterloo, ON, Canada, 2009. [Google Scholar]
- Gove, W.R.; Hughes, M. Overcrowding in the Household: An Analysis of Determinants and Effects; Academic Press: Cambridge, MA, USA, 1983. [Google Scholar]
- Contreras, D.; Delgadillo, J.; Riveros, G. Is Home Overcrowding a Significant Factor in Children’s Academic Performance? Evidence from Latin America. Int. J. Educ. Dev. 2019, 67, 1–17. [Google Scholar] [CrossRef]
- Segel-Karpas, D. Number of Illnesses, Self-Perceived Health, and Depressive Symptoms: The Moderating Role of Employment in Older Adulthood and Old Age. Work Aging Retire. 2015, 1, 382–392. [Google Scholar] [CrossRef]
- Becker, G.S. Human Capital: A Theoretical and Empirical Analysis with Special Reference to Education, 3rd ed.; The University of Chicago Press: Chicago, IL, USA, 1994; ISBN 0226041190. [Google Scholar]
- Clemente, F.; Sauer, W.J. Life Satisfaction in the United States. Soc. Forces 1976, 54, 621–631. [Google Scholar] [CrossRef]
- Mattila, M.; Söderlund, P.; Wass, H.; Rapeli, L. Healthy Voting: The Effect of Self-Reported Health on Turnout in 30 Countries. Elect. Stud. 2013, 32, 886–891. [Google Scholar] [CrossRef]
- Regidor, E.; Calle, M.E.; Navarro, P.; Domínguez, V. Trends in the Association between Average Income, Poverty and Income Inequality and Life Expectancy in Spain. Soc. Sci. Med. 2003, 56, 961–971. [Google Scholar] [CrossRef]
- Brønnum-Hansen, H.; Baadsgaard, M. Widening Social Inequality in Life Expectancy in Denmark. A Register-Based Study on Social Composition and Mortality Trends for the Danish Population. BMC Public Health 2012, 12, 994. [Google Scholar] [CrossRef]
- Ridley, M.; Rao, G.; Schilbach, F.; Patel, V. Poverty, Depression, and Anxiety: Causal Evidence and Mechanisms. Science 2020, 370. [Google Scholar] [CrossRef]
- Emerson, E. Relative Child Poverty, Income Inequality, Wealth, and Health. JAMA 2009, 301, 425. [Google Scholar] [CrossRef]
- Muggah, R.; Wahba, S. How Reducing Inequality Will Make Our Cities Safer. Available online: https://blogs.worldbank.org/sustainablecities/how-reducing-inequality-will-make-our-cities-safer (accessed on 30 September 2021).
- Milam, A.J.; Furr-Holden, C.D.M.; Leaf, P.J. Perceived School and Neighborhood Safety, Neighborhood Violence and Academic Achievement in Urban School Children. Urban Rev. 2010, 42, 458–467. [Google Scholar] [CrossRef] [PubMed]
- Cohen, M.A. The Effect of Crime on Life Satisfaction. J. Leg. Stud. 2008, 37, S325–S353. [Google Scholar] [CrossRef]
- Eurostat. Quality of Life. Facts and Views; Publications Office of the European Union: Luxembourg, 2015; ISBN 978-92-79-43616-1. [Google Scholar]
- Demakakos, P.; Nunn, S.; Nazroo, J. Loneliness, Relative Deprivation and Life Satisfaction. In Retirement, Health and Relationships of the Older Population in England; Banks, J., Breeze, E., Lessof, C., Nazroo, J., Eds.; Institute for Fiscal Studies: London, UK, 2006; pp. 297–337. ISBN 9781903274460. [Google Scholar]
- Lakey, B.; Tardiff, T.A.; Drew, J.B. Negative Social Interactions: Assessment and Relations to Social Support, Cognition, and Psychological Distress. J. Soc. Clin. Psychol. 1994, 13, 42–62. [Google Scholar] [CrossRef]
- Blanch, A. Social Support as a Mediator between Job Control and Psychological Strain. Soc. Sci. Med. 2016, 157, 148–155. [Google Scholar] [CrossRef] [PubMed]
- Schepers, J.; de Jong, A.; Wetzels, M.; de Ruyter, K. Psychological Safety and Social Support in Groupware Adoption: A Multi-Level Assessment in Education. Comput. Educ. 2008, 51, 757–775. [Google Scholar] [CrossRef]
- Ala-Mursula, L.; Vahtera, J.; Linna, A.; Pentti, J.; Kivimäki, M. Employee Worktime Control Moderates the Effects of Job Strain and Effort-Reward Imbalance on Sickness Absence: The 10-Town Study. J. Epidemiol. Commun. Health 2005, 59, 851–857. [Google Scholar] [CrossRef]
- Jackel, M.; Wollscheid, S. Time Is Money and Money Needs Time? A Secondary Analysis of Time-Budget Data in Germany. J. Leis. Res. Copyr. 2007, 39, 86–108. [Google Scholar] [CrossRef]
- Vrublevska, J.; Sibalova, A.; Aleskere, I.; Rezgale, B.; Smirnova, D.; Fountoulakis, K.N.; Rancans, E. Factors Related to Depression, Distress, and Self-Reported Changes in Anxiety, Depression, and Suicidal Thoughts during the COVID-19 State of Emergency in Latvia. Nord. J. Psychiatry 2021, 75, 614–623. [Google Scholar] [CrossRef] [PubMed]
- Scott, S.M.; Gross, L.J. COVID-19 and Crime: Analysis of Crime Dynamics amidst Social Distancing Protocols. PLoS ONE 2021, 16, e0249414. [Google Scholar] [CrossRef]
- Fu, F.; Purvis-Roberts, K.L.; Williams, B. Impact of the COVID-19 Pandemic Lockdown on Air Pollution in 20 Major Cities around the World. Atmosphere 2020, 11, 1189. [Google Scholar] [CrossRef]
- Slater, S.J.; Christiana, R.W.; Gustat, J. Recommendations for Keeping Parks and Green Space Accessible for Mental and Physical Health During COVID-19 and Other Pandemics. Prev. Chronic Dis. 2020, 17, 200204. [Google Scholar] [CrossRef] [PubMed]
- Gonzalez-Bernal, J.J.; Rodríguez-Fernández, P.; Santamaría-Peláez, M.; González-Santos, J.; León-del-Barco, B.; Minguez, L.A.; Soto-Cámara, R. Life Satisfaction during Forced Social Distancing and Home Confinement Derived from the COVID-19 Pandemic in Spain. Int. J. Environ. Res. Public Health 2021, 18, 1474. [Google Scholar] [CrossRef]
- Brown, G.; Greenfield, P.M. Staying Connected during Stay-at-home: Communication with Family and Friends and Its Association with Well-being. Hum. Behav. Emerg. Technol. 2021, 3, 147–156. [Google Scholar] [CrossRef]
- Brooks, S.K.; Webster, R.K.; Smith, L.E.; Woodland, L.; Wessely, S.; Greenberg, N.; Rubin, G.J. The Psychological Impact of Quarantine and How to Reduce It: Rapid Review of the Evidence. SSRN Electron. J. 2020. [Google Scholar] [CrossRef]
- Clair, R.; Gordon, M.; Kroon, M.; Reilly, C. The Effects of Social Isolation on Well-Being and Life Satisfaction during Pandemic. Humanit. Soc. Sci. Commun. 2021, 8, 28. [Google Scholar] [CrossRef]
- Fu, Y.; Lee, H.-W. Daily Contacts Under Quarantine amid Limited Spread of COVID-19 in Taiwan. Int. J. Sociol. 2020, 50, 434–444. [Google Scholar] [CrossRef]
- Wijesooriya, N.R.; Mishra, V.; Brand, P.L.P.; Rubin, B.K. COVID-19 and Telehealth, Education, and Research Adaptations. Paediatr. Respir. Rev. 2020, 35, 38–42. [Google Scholar] [CrossRef]
- Ekici, S.; Şöhret, Y.; Gürbüz, H. Influence of COVID-19 on Air Pollution Caused by Commercial Flights in Turkey. Energy Sources Part A Recovery Util. Environ. Eff. 2021, 1–13. [Google Scholar] [CrossRef]
- Kim, E.E.K.; Seo, K.; Choi, Y. Compensatory Travel Post COVID-19: Cognitive and Emotional Effects of Risk Perception. J. Travel Res. 2021, 1–15. [Google Scholar] [CrossRef]
- Elmer, T.; Mepham, K.; Stadtfeld, C. Students under Lockdown: Comparisons of Students’ Social Networks and Mental Health before and during the COVID-19 Crisis in Switzerland. PLoS ONE 2020, 15, e0236337. [Google Scholar] [CrossRef]
- Van der Laan, S.E.I.; Finkenauer, C.; Lenters, V.C.; van Harmelen, A.-L.; van der Ent, C.K.; Nijhof, S.L. Gender-Specific Changes in Life Satisfaction After the COVID-19–Related Lockdown in Dutch Adolescents: A Longitudinal Study. J. Adolesc. Health 2021, 69, 737–745. [Google Scholar] [CrossRef]
- Lee, I.; Tipoe, E. Changes in the Quantity and Quality of Time Use during the COVID-19 Lockdowns in the UK: Who Is the Most Affected? PLoS ONE 2021, 16, e0258917. [Google Scholar] [CrossRef] [PubMed]
- Brown, F.; Brechenmacher, S.; Carothers, T. How Will the Coronavirus Reshape Democracy and Governance Globally? Available online: https://carnegieendowment.org/2020/04/06/how-will-coronavirus-reshape-democracy-and-governance-globally-pub-81470 (accessed on 15 November 2021).
- Long, E.; Patterson, S.; Maxwell, K.; Blake, C.; Bosó Pérez, R.; Lewis, R.; McCann, M.; Riddell, J.; Skivington, K.; Wilson-Lowe, R.; et al. COVID-19 Pandemic and Its Impact on Social Relationships and Health. J. Epidemiol. Commun. Health 2021, jech-2021-216690. [Google Scholar] [CrossRef]
- Alizadeh, A.; Khankeh, H.R.; Barati, M.; Ahmadi, Y.; Hadian, A.; Azizi, M. Psychological Distress among Iranian Health-Care Providers Exposed to Coronavirus Disease 2019 (COVID-19): A Qualitative Study. BMC Psychiatry 2020, 20, 494. [Google Scholar] [CrossRef]
- Rajagopalan, S.; Huang, S.; Brook, R.D. Flattening the Curve in COVID-19 Using Personalised Protective Equipment: Lessons from Air Pollution. Heart 2020, 106, 1286–1288. [Google Scholar] [CrossRef]
- Eurostat Impact of COVID-19 on Employment Income---Advanced Estimates. Available online: https://ec.europa.eu/eurostat/statistics-explained/index.php?title=Impact_of_COVID-19_on_employment_income_-_advanced_estimates (accessed on 15 November 2021).
- Palomino, J.C.; Rodríguez, J.G.; Sebastian, R. Wage Inequality and Poverty Effects of Lockdown and Social Distancing in Europe. Eur. Econ. Rev. 2020, 129, 103564. [Google Scholar] [CrossRef] [PubMed]
- Varalakshmi, R.; Swetha, R. Covid-19 Lock down: People Psychology Due to Law Enforcement. Asian J. Psychiatry 2020, 51, 102102. [Google Scholar] [CrossRef] [PubMed]
- Ayala, L.; Bárcena-Martín, E.; Cantó, O.; Navarro, C. Housing Inequalities in COVID-19 Lockdown Across European Countries; EQUALITAS: Vigo, Spain, 2021. [Google Scholar]
- OECD. OECD Employment Outlook 2020: Worker Security and the COVID-19 Crisis; OECD: Paris, France, 2020; ISBN 9789264998285. [Google Scholar]
- Chirumbolo, A.; Callea, A.; Urbini, F. The Effect of Job Insecurity and Life Uncertainty on Everyday Consumptions and Broader Life Projects during COVID-19 Pandemic. Int. J. Environ. Res. Public Health 2021, 18, 5363. [Google Scholar] [CrossRef] [PubMed]
- Czymara, C.S.; Langenkamp, A.; Cano, T. Cause for Concerns: Gender Inequality in Experiencing the COVID-19 Lockdown in Germany. Eur. Soc. 2021, 23, S68–S81. [Google Scholar] [CrossRef]
- Park, J.; Kim, B. Associations of Small Business Closure and Reduced Urban Mobility with Mental Health Problems in COVID-19 Pandemic: A National Representative Sample Study. J. Urban Health 2021, 98, 13–26. [Google Scholar] [CrossRef] [PubMed]
- Engzell, P.; Frey, A.; Verhagen, M.D. Learning Loss Due to School Closures during the COVID-19 Pandemic. Proc. Natl. Acad. Sci. USA 2021, 118, e2022376118. [Google Scholar] [CrossRef] [PubMed]
- Venter, Z.S.; Aunan, K.; Chowdhury, S.; Lelieveld, J. COVID-19 Lockdowns Cause Global Air Pollution Declines. Proc. Natl. Acad. Sci. USA 2020, 117, 18984–18990. [Google Scholar] [CrossRef] [PubMed]
- Clark, A.E.; Lepinteur, A. Pandemic Policy and Life Satisfaction in Europe. Rev. Income Wealth 2021. [Google Scholar] [CrossRef]
- De Pedraza, P.; Vicente, M.R. Are Spaniards Happier When the Bars Are Open? Using Life Satisfaction to Evaluate COVID-19 Non-Pharmaceutical Interventions (NPIs). Int. J. Environ. Res. Public Health 2021, 18, 10056. [Google Scholar] [CrossRef]
- Bu, F.; Steptoe, A.; Fancourt, D. Loneliness during a Strict Lockdown: Trajectories and Predictors during the COVID-19 Pandemic in 38,217 United Kingdom Adults. Soc. Sci. Med. 2020, 265, 113521. [Google Scholar] [CrossRef]


| Policy Groups | Included in Analysis (+) |
|---|---|
| State of emergency | + |
| Medical capacity enhancement | + |
| International travel restrictions | + |
| Quarantines | + |
| Restrictions on population mobility | + |
| Enhancement of physical barriers | + |
| Gatherings restriction | + |
| Closures | + |
| Raising awareness | - |
| Government support | - |
| Mitigation Policy | Direct Effects | Indirect Effects | Total Effects | Indirect/Direct Ratio |
|---|---|---|---|---|
| State of emergency | 2 | 11 | 13 | 5.5 |
| Medical capacity enhancement | 1 | 7 | 8 | 7 |
| International travel restrictions | 2 | 7 | 9 | 3.5 |
| Quarantines | 4 | 23 | 27 | 5.75 |
| Restrictions on population mobility | 6 | 27 | 33 | 4.5 |
| Enhancement of physical barriers | 2 | 8 | 10 | 4 |
| Gatherings restriction | 5 | 20 | 22 | 4 |
| Closures | 13 | 65 | 78 | 5 |
| Closures | Enhancement of Physical Barriers | Gatherings Restriction | International Travel Restrictions | Medical Capacity Enhancement | Quarantines | Restrictions on Population Mobility | State of Emergency | |
|---|---|---|---|---|---|---|---|---|
| Access to green space | 0 | 0 | 0 | 0 | 0 | 0 | −1 | 0 |
| Adult skills | −1 | 0 | 0 | 0 | 1 | 0 | 0 | 0 |
| Depressive symptoms | ? | ? | 1 | ? | −1 | 1 | ? | 1 |
| Employment rate | −1 | −1 | −1 | 0 | 1 | −1 | 0 | −1 |
| Exposure to air pollution | −1 | −1 | 0 | −1 | 0 | 0 | ? | 0 |
| Financial insecurity | 1 | 0 | 0 | 0 | 0 | 0 | 0 | 0 |
| Gap in life expectancy by education | 1 | 0 | 0 | 0 | 0 | 0 | 0 | 0 |
| Gender gap in hours worked | −1 | 0 | 0 | 0 | 0 | 0 | 0 | 0 |
| Gender wage gap | 1 | 0 | 0 | 0 | 0 | 0 | 0 | 0 |
| Having say in government | −1 | 0 | −1 | −1 | 0 | −1 | −1 | 0 |
| Household income | −1 | 0 | −1 | 0 | 0 | −1 | 0 | −1 |
| Household wealth | −1 | 0 | 0 | 0 | 0 | 0 | 0 | 0 |
| Households with high-speed internet access | −1 | 0 | 0 | 0 | 0 | 0 | 0 | 0 |
| Housing affordability | −1 | 0 | 0 | 0 | 0 | 0 | 0 | 0 |
| Housing cost overburden | 1 | 0 | 0 | 0 | 0 | 0 | 0 | 0 |
| Job strain | 1 | 1 | 0 | 0 | 0 | 0 | 1 | 0 |
| Labor market insecurity | 1 | 0 | 0 | 0 | 0 | 0 | 0 | 0 |
| Life expectancy | ? | 1 | −1 | 1 | 1 | −1 | ? | ? |
| Life satisfaction | −1 | −1 | −1 | −1 | 1 | −1 | −1 | ? |
| Long hours in paid work | 0 | 0 | 0 | 0 | 0 | 0 | 0 | 0 |
| Long unpaid working hours | 0 | 0 | 0 | 0 | 0 | 0 | 0 | 0 |
| Overcrowding rate | 1 | 0 | 0 | 0 | 0 | 1 | 1 | 0 |
| Perceived health | ? | ? | −1 | ? | 1 | −1 | ? | −1 |
| Relative income poverty | 1 | 0 | 0 | 0 | 0 | 0 | 0 | 0 |
| Safety | −1 | 0 | 0 | 0 | 0 | −1 | −1 | 1 |
| Satisfaction with time use | −1 | −1 | −1 | 0 | 0 | −1 | −1 | −1 |
| Social interactions | −1 | 0 | −1 | 0 | 0 | −1 | −1 | −1 |
| Social support | −1 | 0 | −1 | 0 | 0 | −1 | −1 | 0 |
| Student skills | −1 | 0 | 0 | 0 | 1 | −1 | −1 | 1 |
| Time off | −1 | 0 | 0 | 0 | 0 | 0 | 0 | 0 |
| Voter turnout | −1 | 0 | −1 | −1 | 1 | −1 | −1 | −1 |
| 1 | Direct positive effect | −1 | Direct negative effect | ? | Ambiguous effects (direct + indirect) | |||
| 1 | Indirect positive effect(s) | −1 | Indirect negative effect(s) | ? | Ambiguous effects (only indirect) | |||
| Loop Code | Description |
|---|---|
| R1 | Social interactions—Social support—Life satisfaction—Depressive symptoms—Social interactions |
| R2 | Social interactions—Depressive symptoms—Social interactions |
| R3 | Social interactions—Social support—Depressive symptoms—Social interactions |
| R4 | Social interactions—Life satisfaction—Depressive symptoms—Social interactions |
| R5 | Life satisfaction—Depressive symptoms—Life satisfaction |
| R6 | Employment—Financial insecurity—Life satisfaction—Depressive symptoms—Employment |
| R7 | Employment—Depressive symptoms—Employment |
| R8 | Employment—Financial insecurity—Depressive symptoms—Employment |
| R9 | Employment—Life satisfaction—Depressive symptoms—Employment |
| R10 | Depressive symptoms—Life satisfaction—Depressive symptoms |
| Well-Being Component | Duration of Effect | Group 1 | Group 2 | Group 3 |
|---|---|---|---|---|
| Access to green space | s/m | − | − | − |
| Adult skills | l | 0 | 0 | (−) *** |
| Depressive symptoms | s/m/l | + | + | + |
| Employment rate | s | 0 | 0 | (−) *** |
| Exposure to air pollution | s/m/l | − | − | − |
| Financial insecurity | m/l | 0 | 0/− | − |
| Gap in life expectancy by education | 0 | 0 | 0 | 0 |
| Gender gap in hours worked | s/m | (+) * | + | + |
| Gender wage gap | s/m | 0 | 0 | + |
| Having say in government | m/l | − | − | − |
| Household income | s | 0 | 0/(−) ** | − |
| Household wealth | m/l | 0 | 0/− | − |
| Households with high−speed internet access | s | 0 **** | 0 | 0 |
| Housing affordability | l | 0 | 0 | − |
| Housing cost overburden | l | 0 | 0 | + |
| Job strain | m/l | 0 | + | + |
| Labor market insecurity | s | 0 | + | + |
| Life expectancy | 0 | 0 | 0 | 0 |
| Life satisfaction | m/l | 0 | − | − |
| Long hours in paid work | 0 | 0 | 0 | 0 |
| Long unpaid working hours | s/m | (+) * | + | + |
| Overcrowding rate | s | + | + | + |
| Perceived health | s/m/l | − | − | − |
| Relative income poverty | s/m/l | 0 | 0 | + |
| Safety | s | 0 | 0 | − |
| Satisfaction with time use | s | − | − | − |
| Social interactions | s | − | − | − |
| Social support | s/m | − | − | − |
| Student skills | m/l | 0 | 0 | (−) *** |
| Time off | 0 | 0 | 0 | 0 |
| Voter turnout | m/l | − | − | − |
Publisher’s Note: MDPI stays neutral with regard to jurisdictional claims in published maps and institutional affiliations. |
© 2021 by the authors. Licensee MDPI, Basel, Switzerland. This article is an open access article distributed under the terms and conditions of the Creative Commons Attribution (CC BY) license (https://creativecommons.org/licenses/by/4.0/).
Share and Cite
Strelkovskii, N.; Rovenskaya, E.; Ilmola-Sheppard, L.; Bartmann, R.; Rein-Sapir, Y.; Feitelson, E. Implications of COVID-19 Mitigation Policies for National Well-Being: A Systems Perspective. Sustainability 2022, 14, 433. https://doi.org/10.3390/su14010433
Strelkovskii N, Rovenskaya E, Ilmola-Sheppard L, Bartmann R, Rein-Sapir Y, Feitelson E. Implications of COVID-19 Mitigation Policies for National Well-Being: A Systems Perspective. Sustainability. 2022; 14(1):433. https://doi.org/10.3390/su14010433
Chicago/Turabian StyleStrelkovskii, Nikita, Elena Rovenskaya, Leena Ilmola-Sheppard, Robin Bartmann, Yonat Rein-Sapir, and Eran Feitelson. 2022. "Implications of COVID-19 Mitigation Policies for National Well-Being: A Systems Perspective" Sustainability 14, no. 1: 433. https://doi.org/10.3390/su14010433
APA StyleStrelkovskii, N., Rovenskaya, E., Ilmola-Sheppard, L., Bartmann, R., Rein-Sapir, Y., & Feitelson, E. (2022). Implications of COVID-19 Mitigation Policies for National Well-Being: A Systems Perspective. Sustainability, 14(1), 433. https://doi.org/10.3390/su14010433