Article

Sustainable Utilization of Sewage Sludge through the Synthesis of Liquid Fertilizer

1
Institute of Environmental Engineering and Management, College of Engineering, National Taipei University of Technology, Taipei 10608, Taiwan
2
School of Bio-Chemical Engineering and Technology, Sirindhorn International Institute of Technology, Thammasat University, Pathum Thani 12120, Thailand
*
Authors to whom correspondence should be addressed.
Sustainability 2022, 14(1), 387; https://doi.org/10.3390/su14010387
Submission received: 17 November 2021 / Revised: 24 December 2021 / Accepted: 29 December 2021 / Published: 30 December 2021

Abstract

:
In a world with a growing human population, resources are becoming increasingly scarce. To ensure food supply, fertilizers are often used to accelerate growth when planting agricultural products. Sewage sludge (SS), containing as high as 10–15 wt% Phosphorus (P), can be synthesized into liquid fertilizer. P species in SS can generally be classified into four types: inorganic phosphorus (IP), organic phosphorus (OP), nonapatite inorganic phosphorus (NAIP), and apatite phosphorus (AP). However, OP is not leached out by wet chemical methods and NAIP is not bioavailable. This study investigated the P-form conversion (OP and NAIP to AP) in SS by adding 8 wt% CaO at 300 °C. SS through pretreatment can easily leach out P when combined with organic acid. The content of heavy metals is in accordance with fertilizer regulations in a leaching solution. The solution was mixed with potassium and ammonia compounds to synthesize a liquid fertilizer. To ensure the safe and efficient use of liquid fertilizer and undertake an analysis of heavy metals, an aquatic organisms (D. magna) toxicity test, and the growth of plants test were both used. The liquid fertilizer can be demonstrated to accelerate the growth of plants while not causing the death of D. magna in short time, as the liquid fertilizer has enough nutrients to help the D. magna to survive.

1. Introduction

In a world with a growing human population, resources are becoming increasingly scarce [1]. In order to ensure food supply, fertilizers are often used to accelerate growth when planting agricultural products.
However, the millions of tons of sewage sludge (SS) generated globally each day is causing waste management problems [2]. The daily SS production in Taiwan is approximately 68,000 tons [3]. P content in SS may be as high as 10–15 wt% [4]. Because of advancements in wastewater treatment technologies, the P content in SS has increased [5]. Current SS treatment methods are 64.4% landfill, 15.7% material reuse, 14.8% incineration, 5.1% storage in the plant (sludge cake), and 0.2% fertilizer. If the P in SS can be effectively utilized, it could become fertilizer [6]. Phosphorus species in SS can generally be classified as four types: inorganic phosphorus (IP), organic phosphorus (OP), nonapatite inorganic phosphorus (NAIP), and apatite phosphorus (AP) [7,8]. AP and OP have the highest bioavailability while NAIP has lower bioavailability. Because of their considerable potential to become agricultural fertilizer, phosphorus recovery products such as struvite (MAP, MgNH4PO4·6H2O), K-struvite (MPP, MgKPO4·6H2O), Na-struvite (MSP, MgNaPO4·7H2O), and vivianite [Fe3(PO4)2·8H2O] are favored by most researchers [9,10,11,12]. The related literature on phosphorus form conversion is summarized in Table 1. Previously researchers have reported that temperature can substantially influence the fractions of P species (OP, AP, and NAIP) in SSA [13], and NAIP conversion to AP in SSA with the addition of CaO [14,15]. AP and NAIP can be leached out by wet chemical, but OP cannot by wet chemical methods. OP is usually removed during biological, thermochemical and incineration treatment [16,17,18]. Thus, most of the past studies have recovered P by wet chemical methods from SSA. Hence, although SS and SSA can be used as an alternative to chemical fertilizer, its potentially toxic metal constituents often limit its application [19,20,21].
Wet chemical methods for P reclamation from SS have been investigated frequently. Leaching agents such as strong acids and alkalis have been used. AP and NAIP can be leached out of SS with approximately 80–90% efficiency by using HNO3, HCl, and H2SO4, whereas NaOH treatment has approximately 60–70% efficiency [22,23,24]. Heavy metals and P are co-leached out of SS by using wet chemical treatments (strong acid or strong alkali), previously researchers have applied selective adsorption, precipitation, and ion exchange for the separation of P and heavy metals, with the separation efficiency of P being 75–99% [23,25,26,27,28] as shown in Table 2. Meanwhile, less studies leached out P from SS by using organic acid. Acetic acid (an organic acid with a dissociation constant of 4.76) leaches out only 50–60% of P [29]. Thus, less studies use acetic acid. However, acetic acid can be useful as a fertilizer for growing plants [30,31]. Citric acid is the most widely used chemical additive because of its highly efficient metal extraction [32,33]. Acetic acid and citric acid are less harmful to the environment than other chemical leaching agents. This study investigated the use of organic acid to leach P from SS.
Most researchers have synthesized struvite as a fertilizer by adding magnesium chloride (MgCl2·6H2O) and magnesium oxide (MgO) as magnesium sources and ammonium chloride (NH4Cl) and ammonium hydroxide (NH4OH) as nitrogen sources [23,28]. Few studies have synthesized liquid fertilizer from SS by adding potassium hydroxide (KOH) as a potassium source and ammonium hydroxide (NH4OH) as a nitrogen source.
As previous research has studied NAIP conversion to AP in SSA by the addition of CaO, this study investigated P-form (NAIP and OP conversion to AP) conversion by adding a CaO dosage at room temperature L/S 40 mL/g to find the optimal CaO dosage. Previous research has mostly studied NAIP conversion to AP in SSA which is generated from SS by incineration treatment (950 °C). However, incineration treatment may easily cause carbon dioxide problems. Thus, the incineration method should be avoided to treat SS. Therefore, this study investigated the optimal CaO dosage to be applied at low heat treatment temperature (150–350 °C) to investigate P-form (NAIP and OP conversion to AP) conversion—comparing crystal phases before and after chemical conversion—as well as the conversion mechanism.
Furthermore, previous research undertaken little study on the leaching out of P by organic acid and has never studied the leaching out of P by combined organic acid from SS. This study investigated the comparative leaching performance of different acids and alkalis (i.e., organic acid, combined organic acid, inorganic acid, and alkali) from pre-conversion and post-conversion SS. The acid and alkali leached liquids were analyzed for heavy metals and P. The content of heavy metals in leaching solution are lower than fertilizer regulation. This leaching solution mixed with potassium hydroxide (KOH; serving as the potassium source) and ammonium hydroxide (NH4OH; serving as the ammonia source) formed the synthesis of liquid fertilizer. Finally, to verify the feasibility and safety of the liquid fertilizer, it was used for hydroponic plant cultivation to evaluate effectiveness while the commonly used Daphnia magna toxicity test was used to evaluate safety.

2. Materials and Methods

2.1. Materials

An SS sample obtained from the Dihua Sewage Treatment Plant in Taipei City, Taiwan, was used in this study. The SS sample had been dewatered by a belt press dehydrator and dried by an indirect heating dryer at 105 °C in the plant’s SS treatment unit for volume reduction. The sample was ground by an agate mortar autogrinder (ANM1000, Nittokagaku Co. Ltd., Nagoya, Japan), passed through a 150-μm sieve, and then stored in a desiccator. The characteristics and composition of the SS sample (Table 3) were determined through inductively coupled plasma-optical emission spectrometry (ICP-OES; Optima 8000, PerkinElmer, MA, USA) and proximate analysis. All sample analysis is triplicate. Analysis indicated that the SS mainly contained Fe, Si, Ca, P, Al, K, and heavy metals (Zn, Cu, and Cr). The content of moisture, residue, and combustibles in SS were 3.7%, 23.4% and 72.9%, respectively. The characteristics of SS including organic carbon (OC), loss at calcinations (LOC), and the higher heating value (HHV) were 35%, 70%, and 3500 MJ/kg, respectively.

2.2. P conversion Methods

The conversion methods divide into two parts. Firstly, the NAIP and OP convert to AP in SS by addition of CaO at room temperature, L/S 40 mL/g to find the optimal CaO dosage. Secondly, for reactions conducted above 100 °C, specific amounts of SS and CaO were placed into a crucible and homogeneously mixed. The crucible was then moved to an electric muffle furnace (YECHANCE/HT-1000N), heated to the reaction temperature (150–350 °C), and left for a specific reaction time (2 h). The crucible was then cooled to room temperature. The solid was collected for subsequent P analysis.

2.3. Analytical Methods

The SMT protocol was used to determine the content of different P types in all SS samples before and after CaO treatment. The details of the SMT protocol have been described by numerous researchers [33,34,35]. Hydrochloric acid (1 and 3.5 M; Fluka), sodium hydroxide (0.25 and 1 M; Fluka), and ethylenediaminetetraacetic acid (0.05 M; Macron) were used as the leaching reagents. The leaching treatment was performed in a water bath oscillator (SHAKER BATH MODEL B603). The solid–liquid separation of the leachate and solid was performed using a centrifuge (Tabletop Centrifuge Model 4000, KUBOTA Corp, Osaka, Japan) at 3500 rpm for 10 min. The P content in all leachates was analyzed through colorimetry with molybdenum blue at 882 nm [35,36,37,38] by using a spectrophotometer (DR-4000, HACH, Loveland, CO, USA). The mineralogical crystal phases in SS before and after CaO addition for conversion were analyzed using an XRD spectrometer (D2 PHASER, Bruker, Billerica, MA, USA). All reagents used in this study were of analytical grade.

2.4. Wet Chemical Methods

Pre-conversion SS, or post-conversion SS (1 g) was mixed with 50 mL of organic acid (CH3COOH; Fluka), inorganic acid (H2SO4; J.T. Baker), alkali (NaOH; Fluka), and combined organic acid (CH3COOH mixed with C6H8O7; Sigma-Aldrich, St. Louis, MO, USA). All leaching experiments were 2 h in duration. The leached liquids were filtered and analyzed for metal content by using ICP-OES. Above all, the experiment methods were conducted triplicate.

2.5. Synthesis Liquid Fertilizer and Plant Availability

Regarding the synthesis of the liquid fertilizer, 50 mL of the leached liquid was mixed with KOH as a potassium source and NH4OH as a nitrogen source to adjust the pH through the N:P:K ratio. The experiment was performed at room temperature. The effectiveness of the liquid fertilizer was determined from its results with hydroponically grown plants.

2.6. Liquid Fertilizer Toxicity Test

Daphnia magna is from the Department of Aquatic Biological Sciences, National Chiayi University. Aerated tap water is used as domestication water, the dissolved oxygen in the water is controlled above 5.0 mg/L with aeration equipment, the temperature is controlled at 25 ± 2 °C, and the light is 16 ± 1 h. The domesticated feed uses commercially available concentrated chlorella as feed. Acute toxicity tests are performed in which D. magna (20 pcs) are exposed to three liquid fertilizers with different pH values and concentrations to test the liquid fertilizer for short time intervals (6–24 h, 48 h) to observe and record survival. The result obtained was the effect of the addition of liquid fertilizer for D. magna. The survival is calculated as follows:
Survival ( % ) = S u r v i v a l   o f   D .   m a g n a T o t a l   o f   D .   m a g n a

3. Results

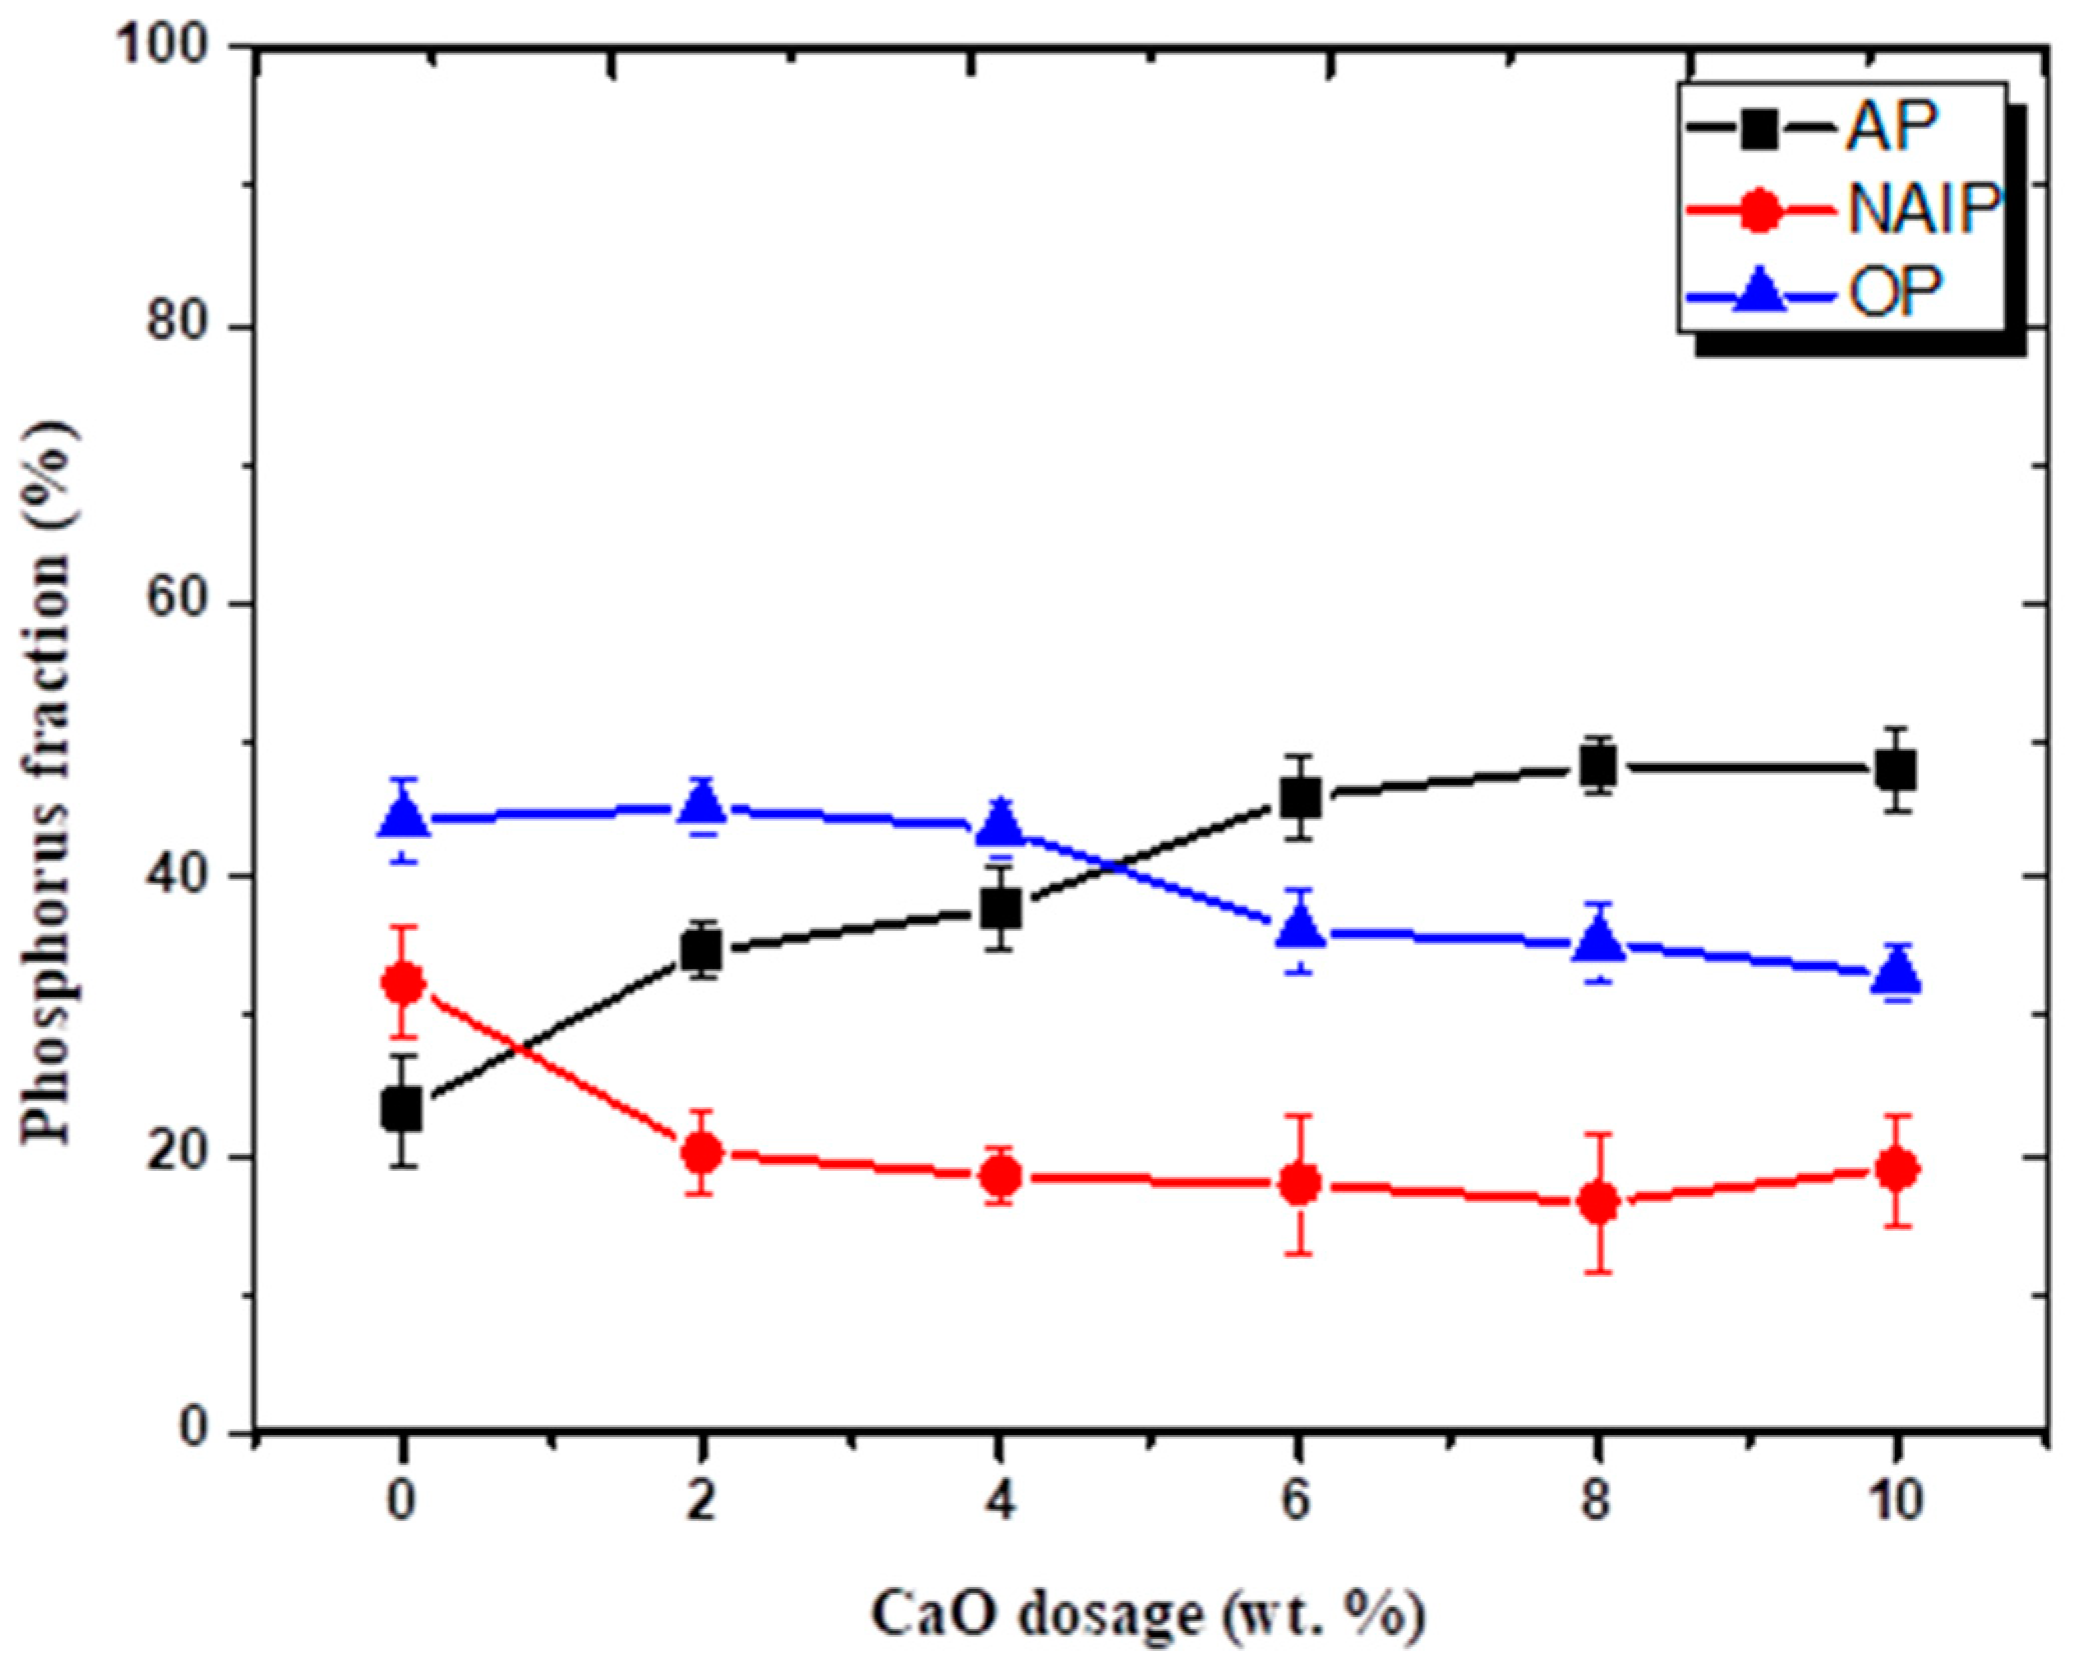
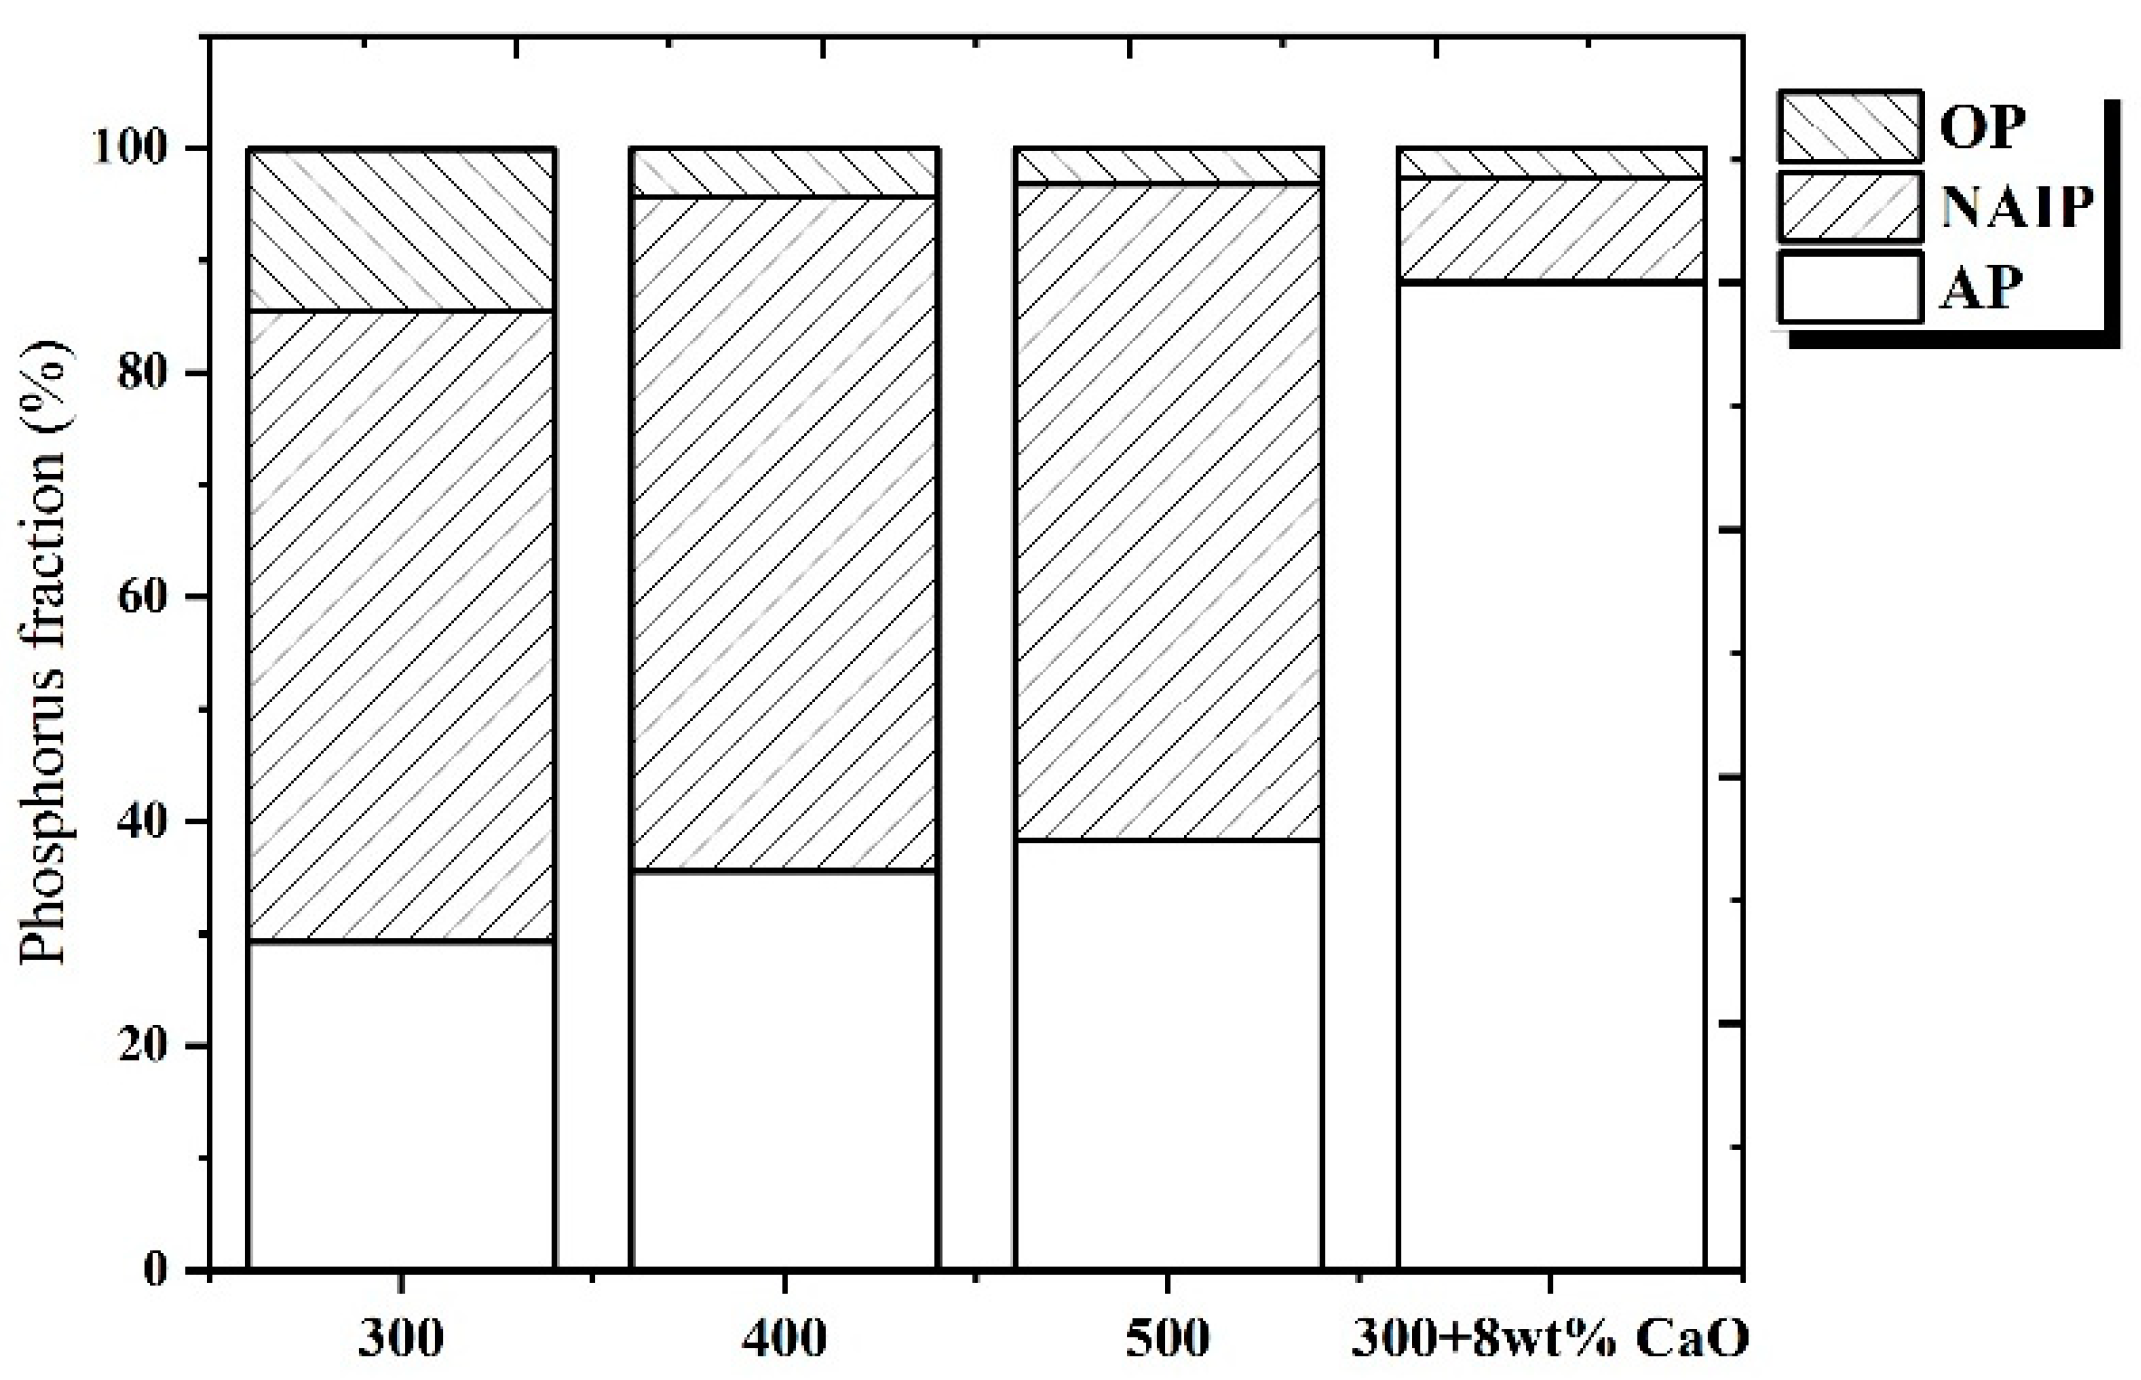
3.1. Effect of CaO Fraction

The contents of TP, OP, IP, NAIP, and AP in the as received SS sample were 259.6%, 114.8%, 144.8%, 84.3%, and 60.5 mg/g, respectively. The fractions of OP, IP, NAIP, and AP calculated on the basis of TP were 44.2%, 55.8%, 32.5%, and 23.3%, respectively.
The effects of different CaO weight fractions (0–10 wt%) on the fraction of each P type in the SS are shown in Figure 1. The experiments were performed at 25 °C for 2 h. The SS solid concentration was 40 mL/g. When 2 wt% CaO was added, the fraction of NAIP decreased from 32.5% to 20.2% and that of AP increased from 23.3% to 34.7%. When 6 wt% CaO was added, the fraction of OP decreased from 44.2% to 36.2% and that of AP increased more. When >8 wt% CaO was added, the fractions of NAIP and OP decreased to 16.5% and 35.3%, respectively, whereas that of AP increased further to approximately 50%. These results suggest that when CaO was added at 25 °C, part of the NAIP and OP was converted to AP. Although, AP and NAIP can be leached out by wet chemical method, but OP cannot by wet chemical methods [22]. OP isn’t completely converted to AP or NAIP. Due to OP usually being removed during biological, thermochemical and incineration treatment [16,17,18], OP converted to AP following the application of a further low temperature heat treatment.

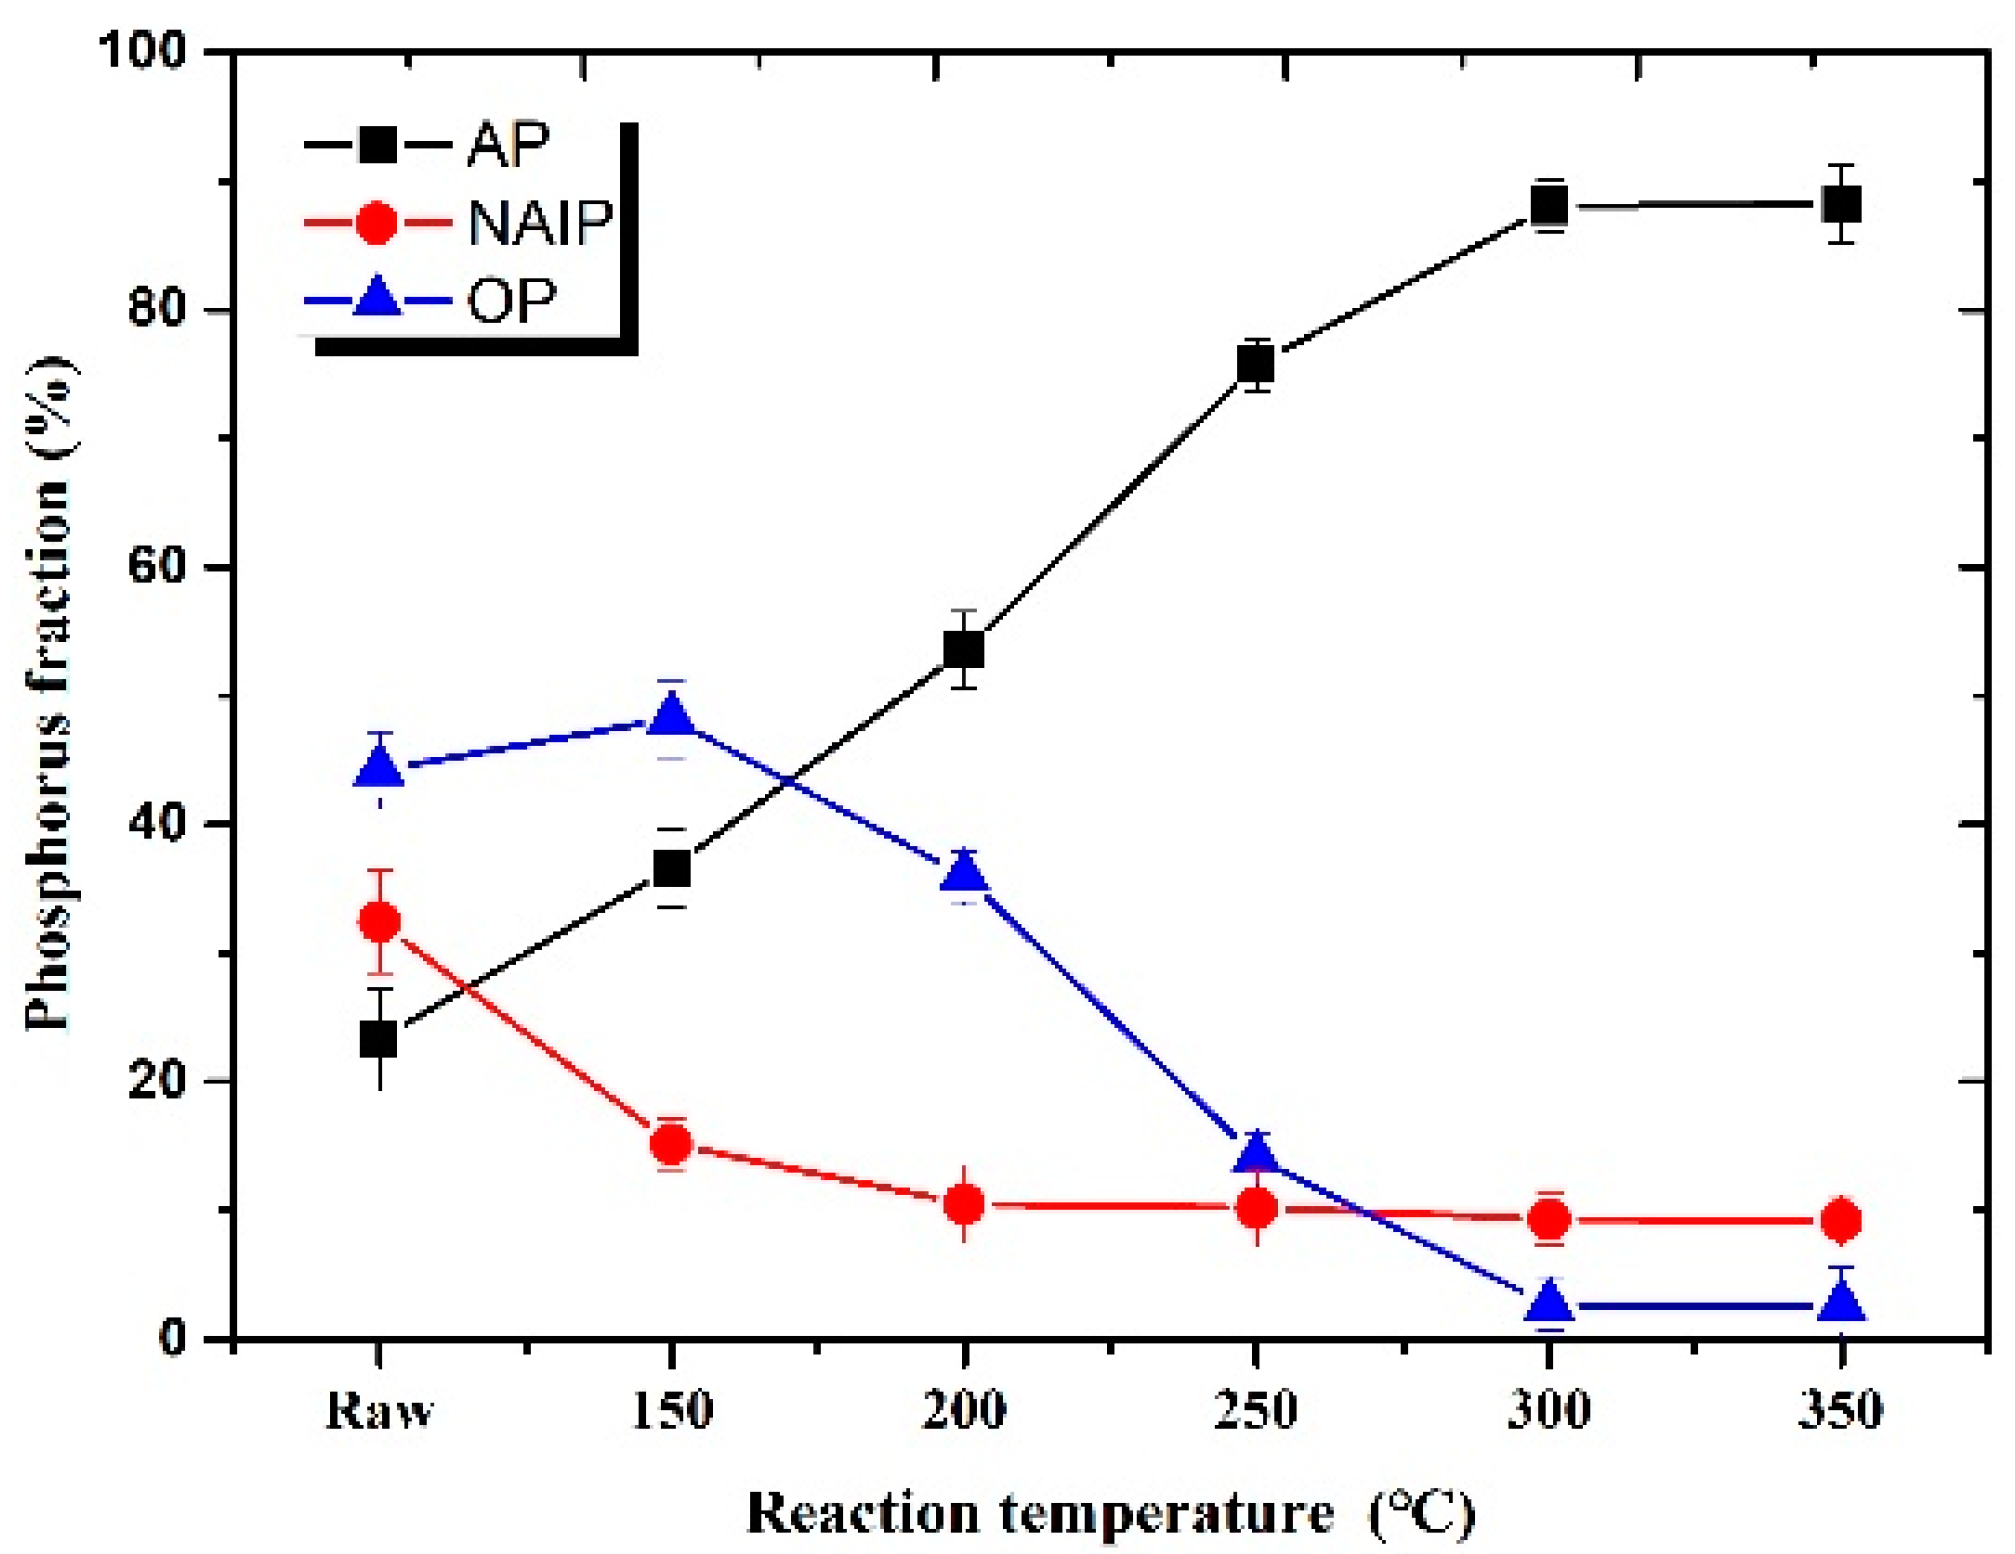
3.2. Effect of Reaction Temperature

The effects of the reaction temperature on the fraction of each P type in the SS when 8 wt% CaO was added at reaction temperatures above 100 °C for 2 h are represented in Figure 2. For experiments conducted above 100 °C, the fraction of NAIP decreased slightly, but it exhibited no significant changes at temperatures above 200 °C. By contrast, the fraction of OP decreased and that of AP increased significantly as the reaction temperature increased. At 300 °C, the fraction of OP decreased to 0%, that of NAIP decreased to 9.4%, and that of AP increased to 90.6%.

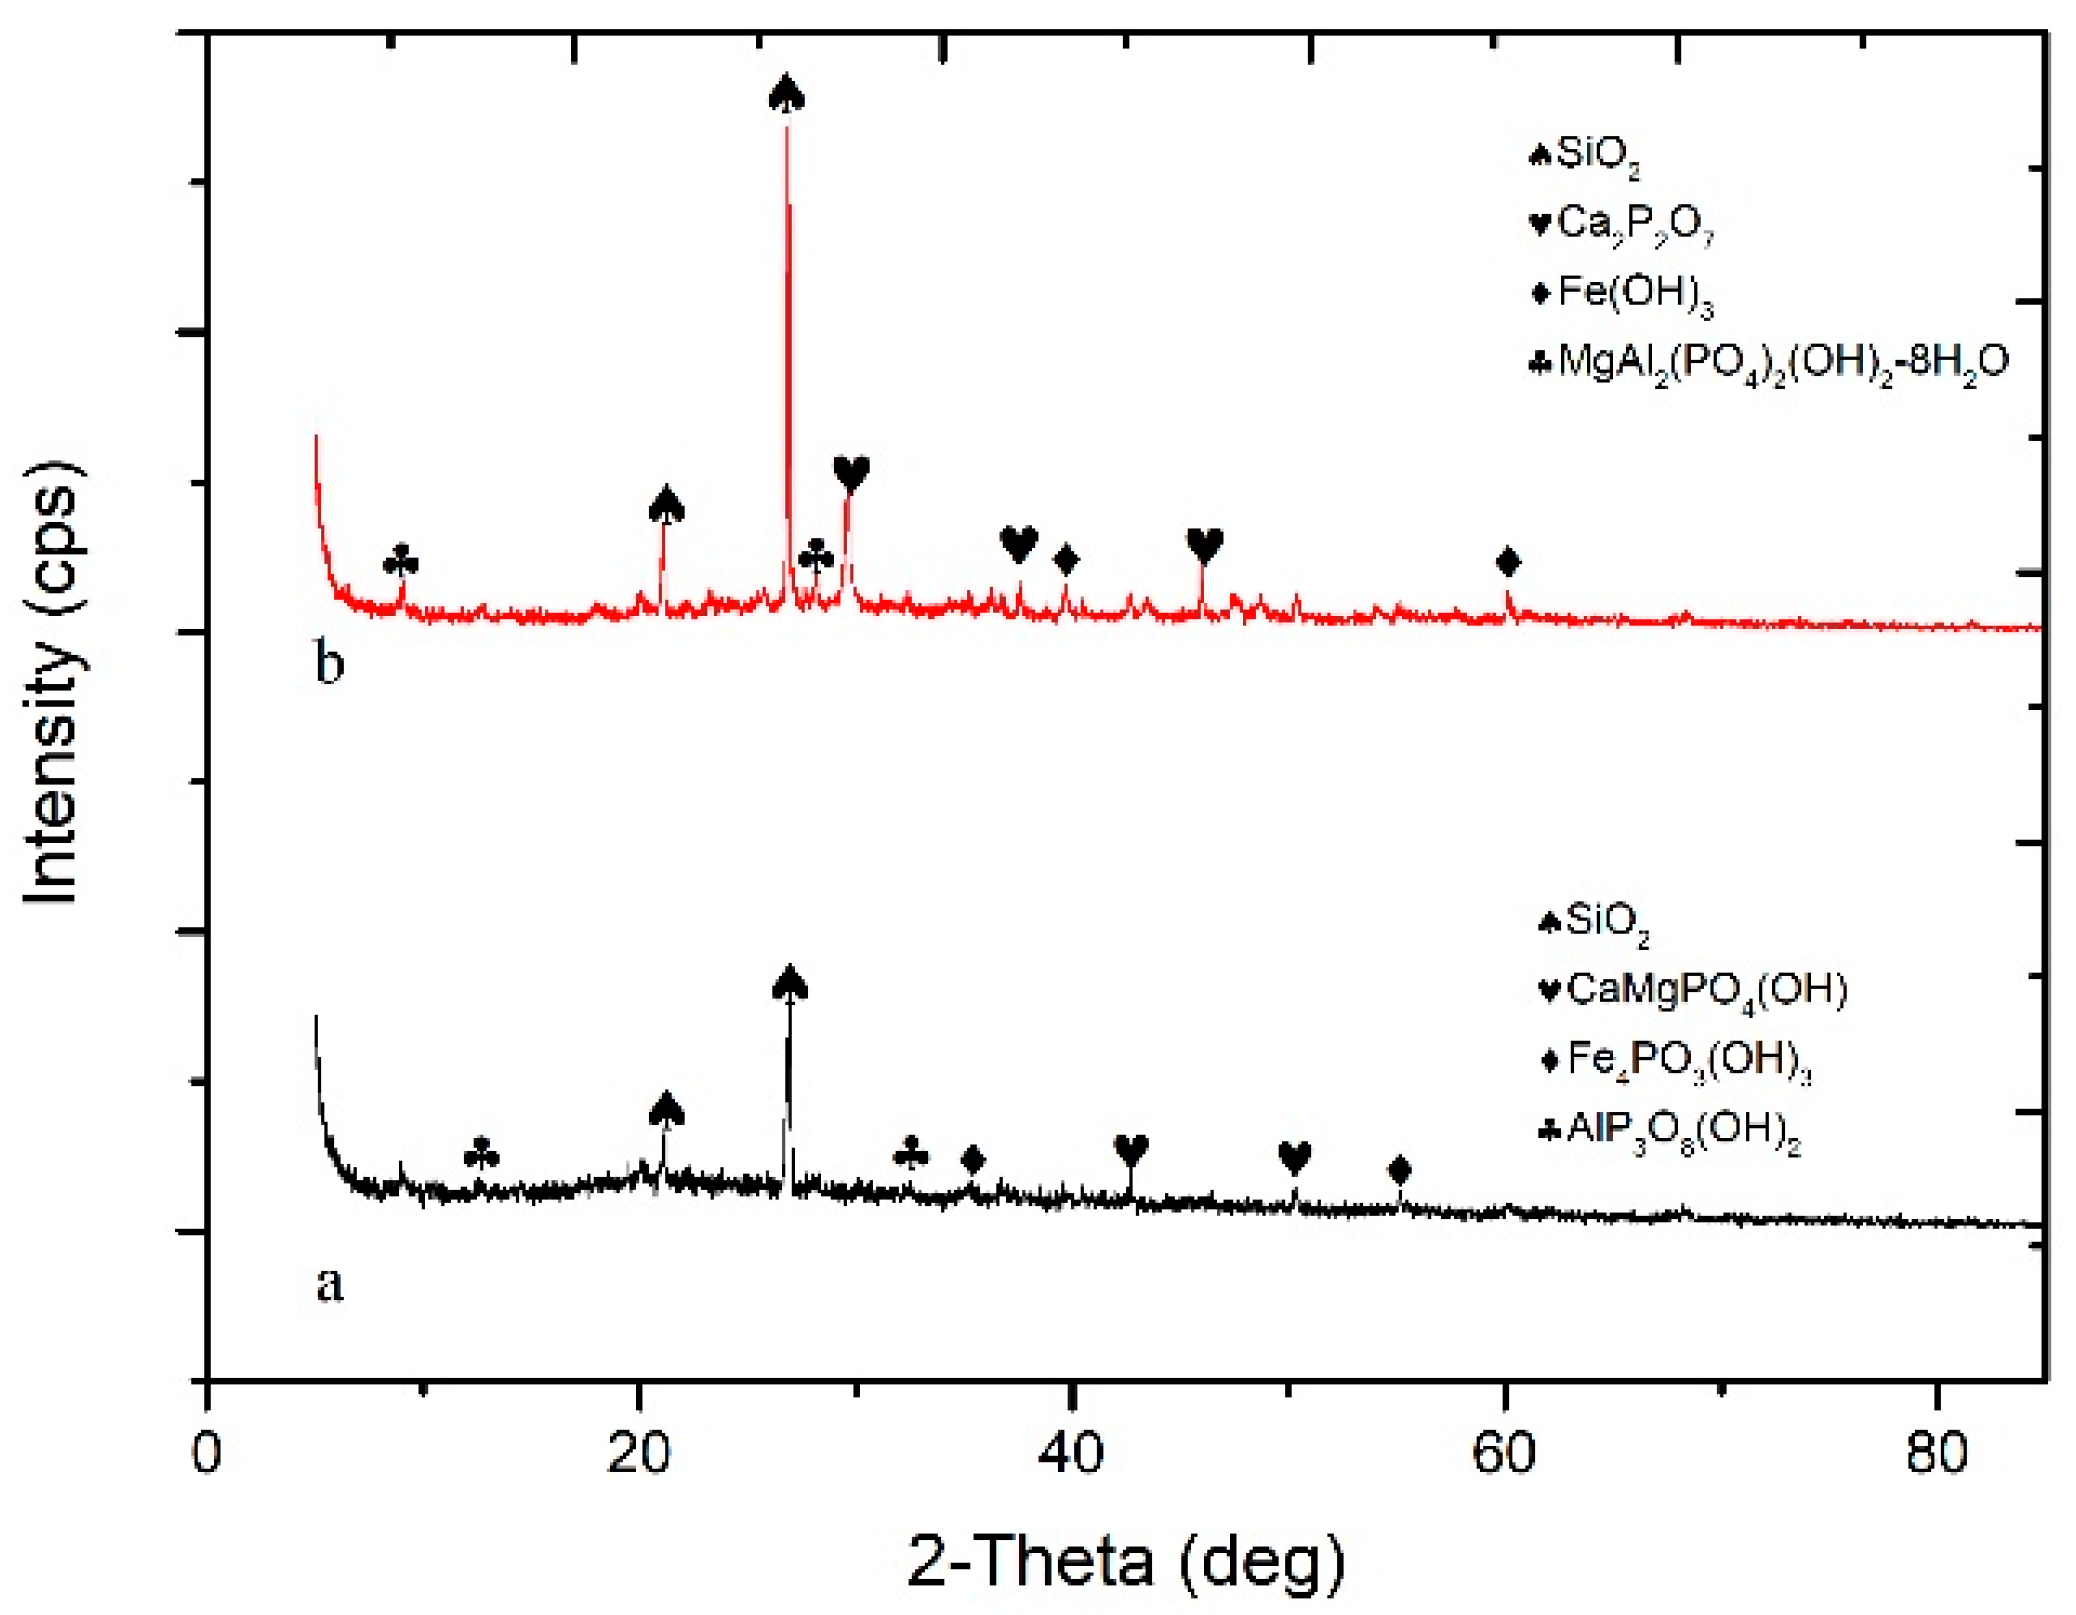
3.3. XRD Analysis of Pre- and Post-Conversion SS

The XRD spectra for the as-received SS sample and SS samples treated at higher than 100 °C are displayed in Figure 3. The main crystal phases in the as-received SS sample were quartz (SiO2), aluminum phosphate hydroxide [AlP3O8(OH)2], iron phosphate hydroxide [Fe4(PO4)3(OH)3], and panasqueiraite [CaMg(PO4)(OH,F)]. After the addition of 8 wt% CaO at a high temperature (300 °C) for 2 h, the main crystal phases detected in the SS sample were gordonite [MgAl2(PO4)2(OH)28H2O], Calcium pyrophosphate [Ca2P2O7], SiO2, and iron hydroxide [Fe(OH)3].

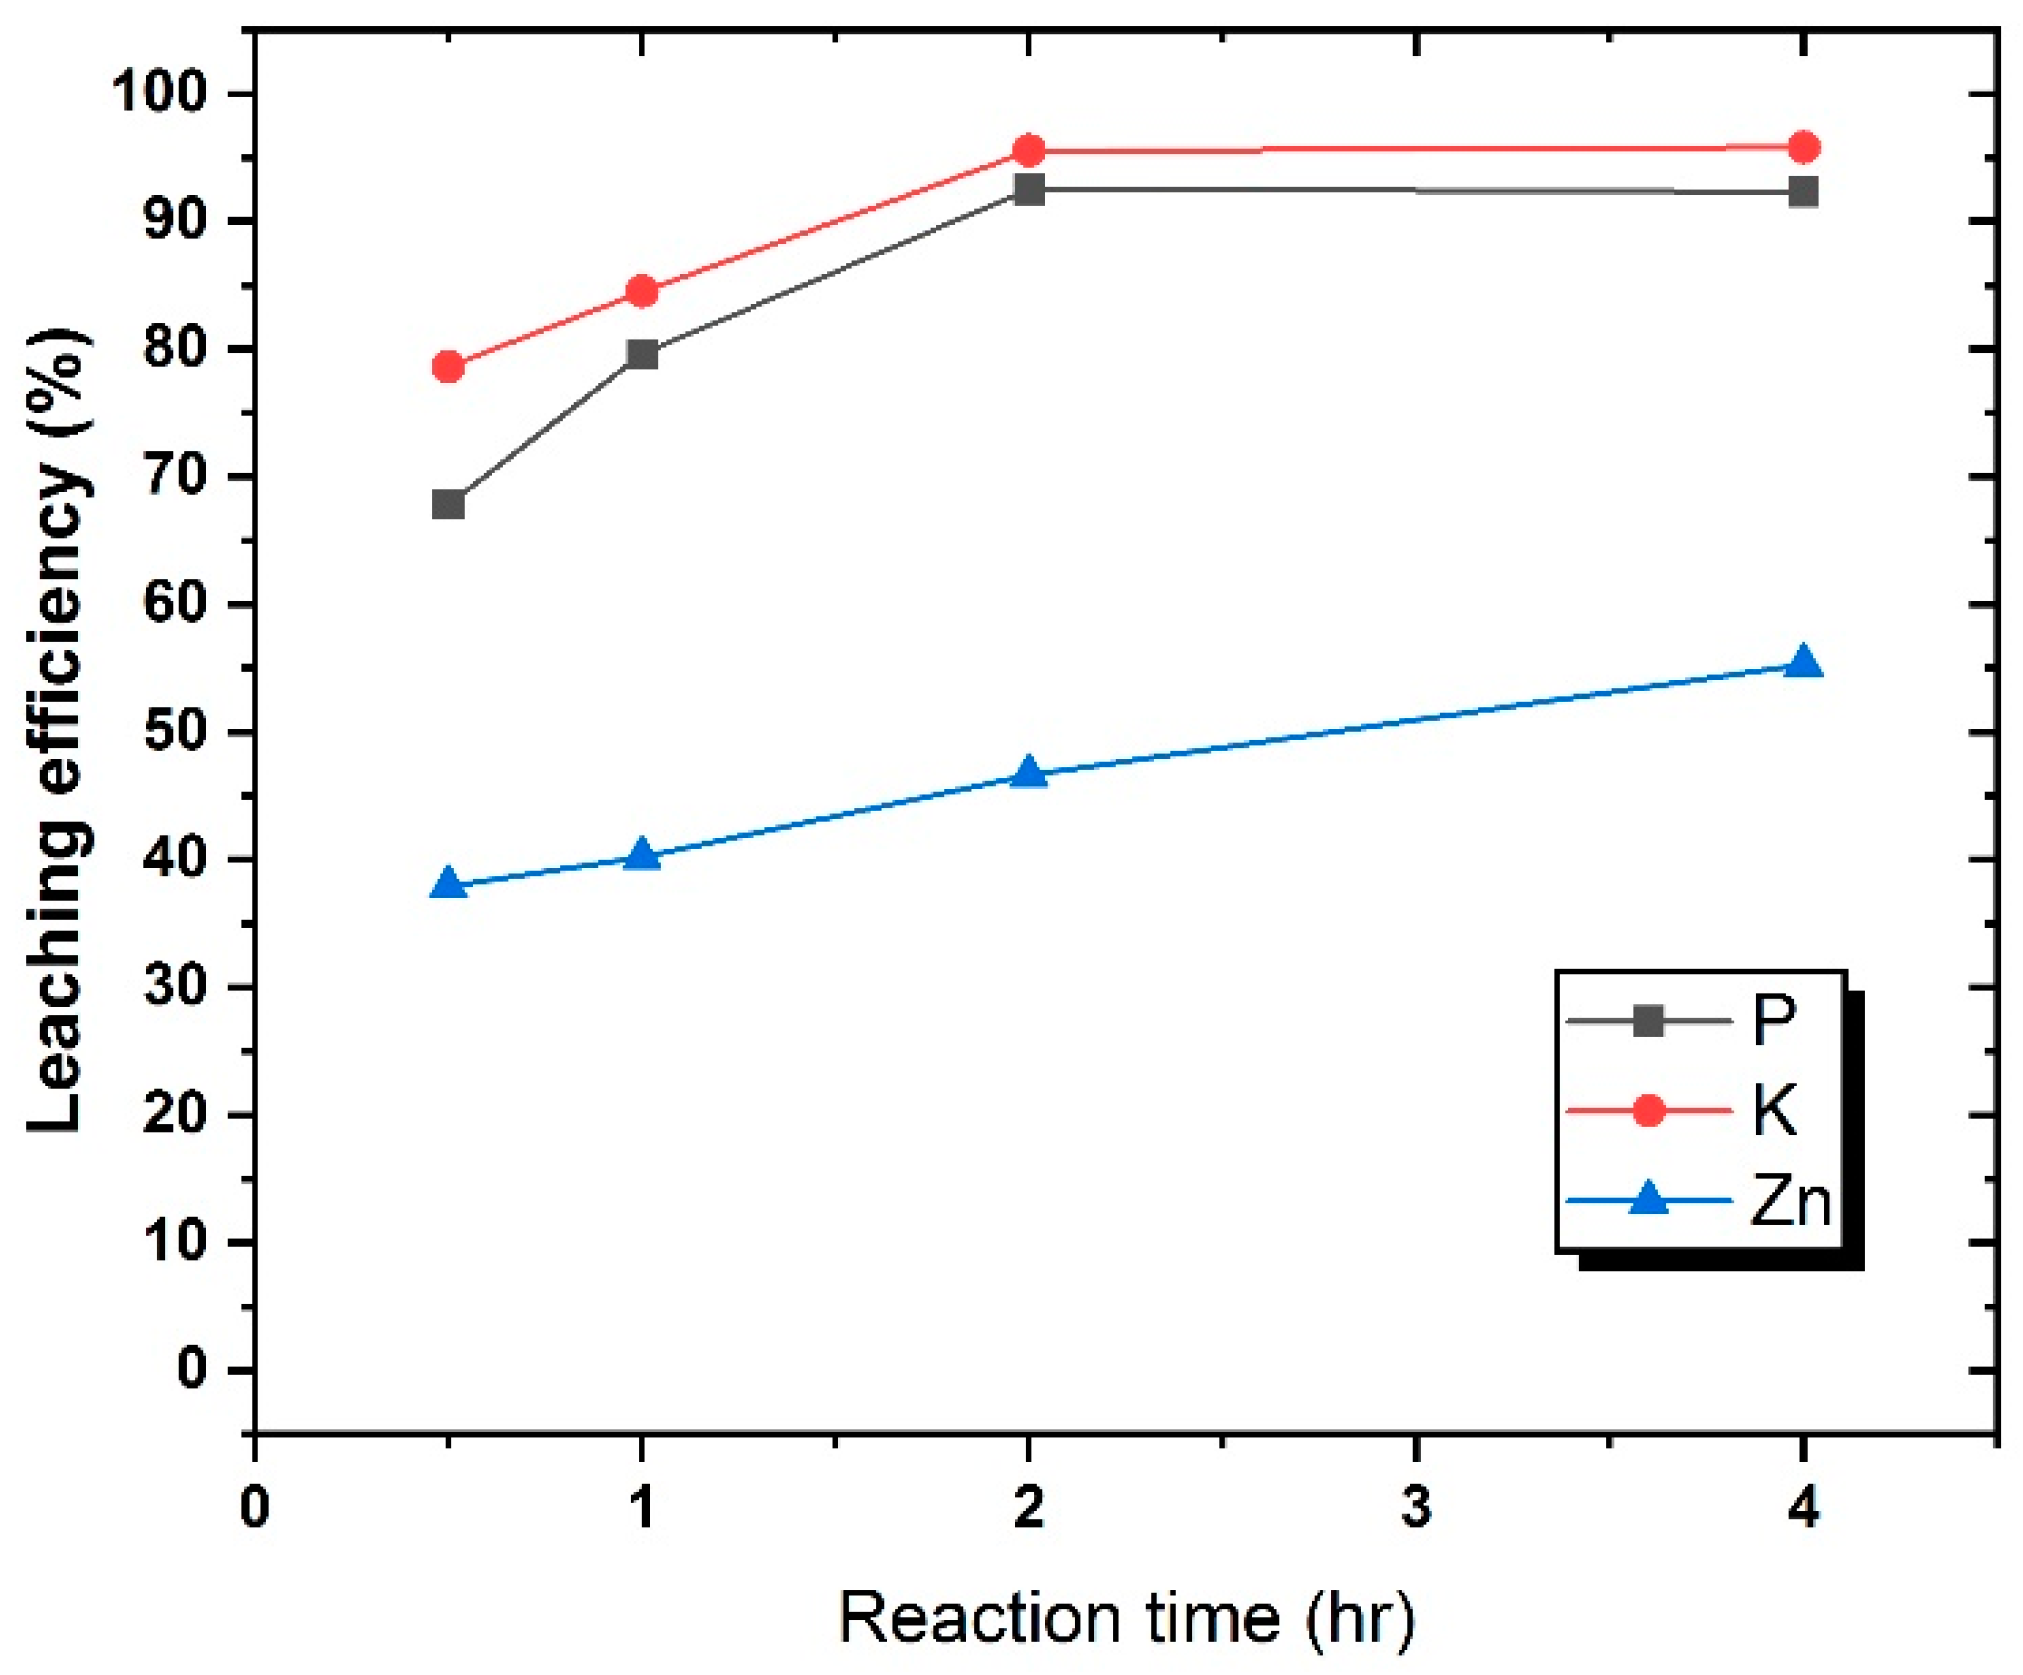
3.4. Leaching of P from Pre- and Post-Conversion SS by Using an Acid and Alkali

Table 4 details the pre- and post-conversion SS analysis results to determine the effect of P form under acid and alkali leaching. The NAIP, OP, and AP leaching efficiencies from unconverted SS, determined using 1 M organic acid (acetic acid) at room temperature, were 75.6%, 74.3%, and 99.9%, respectively. Application of combined organic acid at room temperature for leaching NAIP, OP, and AP demonstrated leaching efficiencies of 90.8%, 73.6%, and 99.9%, respectively. For the strong acid and alkali, we employed previous study conditions. Shiba et al. applied 1 M H2SO4 at 100 °C [17], leaching out NAIP, OP, and AP at efficiencies of 91.2%, 89.2%, and 99.9%, respectively. Wu et al. applied 6 M NaOH at 100 °C [18] to leach out NAIP, OP, and AP at efficiencies of 28.1%, 92.4%, and 90.5%, respectively. In the present study, the content of NAIP, OP, and AP was 9.4%, 0%, 90.6%, respectively, in the post-conversion SS. NAIP and AP were leached out by using 1 M organic acid (acetic acid) at efficiencies of 76.7% and 99.9%, respectively. By contrast, NAIP and AP leaching using combined organic acid exhibited efficiencies of 90.1% and 99.9%, respectively. Discussion of the results is in Section 4.3.

3.5. Leaching of Heavy Metals from Post-Conversion SS by Using an Acid and Alkali

The leaching of P, K, and heavy metals is detailed in Table 5. The efficiencies of P, K, and Zn leaching from SS by using combined organic acid were approximately 78%, 90–95%, and 50% respectively, for a leaching liquid pH of 2.56. The efficiencies of P, K, Cu, Zn, and Cr leaching from SS were all 90–95% when using H2SO4 and a leaching liquid pH of 0.37. The efficiencies of P, K, and Zn leaching from SS by using NaOH were approximately 70%, 65%, and 50% respectively, for a leaching liquid pH of 11.5. Finally, the efficiencies of P and K leaching from the post-conversion SS by using combined organic acid were approximately 90–95%, whereas those of Zn and Cr leaching were 50% and 0.1%, respectively; the leaching liquid pH was 2.56. To further prove that the contents of P and K are high while the contents of Zn are low in combined organic acid, we investigated the effect of reaction time on the leaching of P, K, and heavy metals, results of which are shown in Figure 4. When reaction time is 0.5 h, the leaching efficiency of P, K and Zn is approximately 70%, 80% and 40% respectively. As the reaction time increased, the leaching efficiency is increased so that when the reaction time is 2 h, the leaching efficiency of P, K and Zn is approximately 90%, 90% and 50% respectively. When reaction time is above 2h, the leaching efficiency of Zn is approximately 60%. Accordingly, this result allows us to speculate the priority in which the P and K may be leached out. Thus, the content of P and K is higher than Zn in the combined organic acid solution. The discussion of this result is in Section 4.3.

3.6. Synthesis of Liquid Fertilizer

In accordance with the preceding results, the optimum leaching conditions (1 M acetic acid mixed with 5 wt% citric acid; at room temperature) were used to leach out P and K from post-conversion SS. KOH and NH4OH were added to control the pH and adjust K and N levels. Different P:N:K ratios were studied by observing the results of plants grown hydroponically using these solutions. The growth of plants with or without fertilizer after 21 days is shown in Figure 5. Fertilizers 1–3 had different PO43−: NH4+: K+ ratios (1:1:1, 1:1.5:2, and 1:2:3, respectively) and pH values (5, 7, and 9, respectively). After 21 days of planting, when the plants are not added with fertilizers, the leaves are prone to yellowing and the roots and stems have no obvious growth. On the other hand, when the plants add fertilizer, the leaves did not turn yellow, and the roots and stems grew significantly.

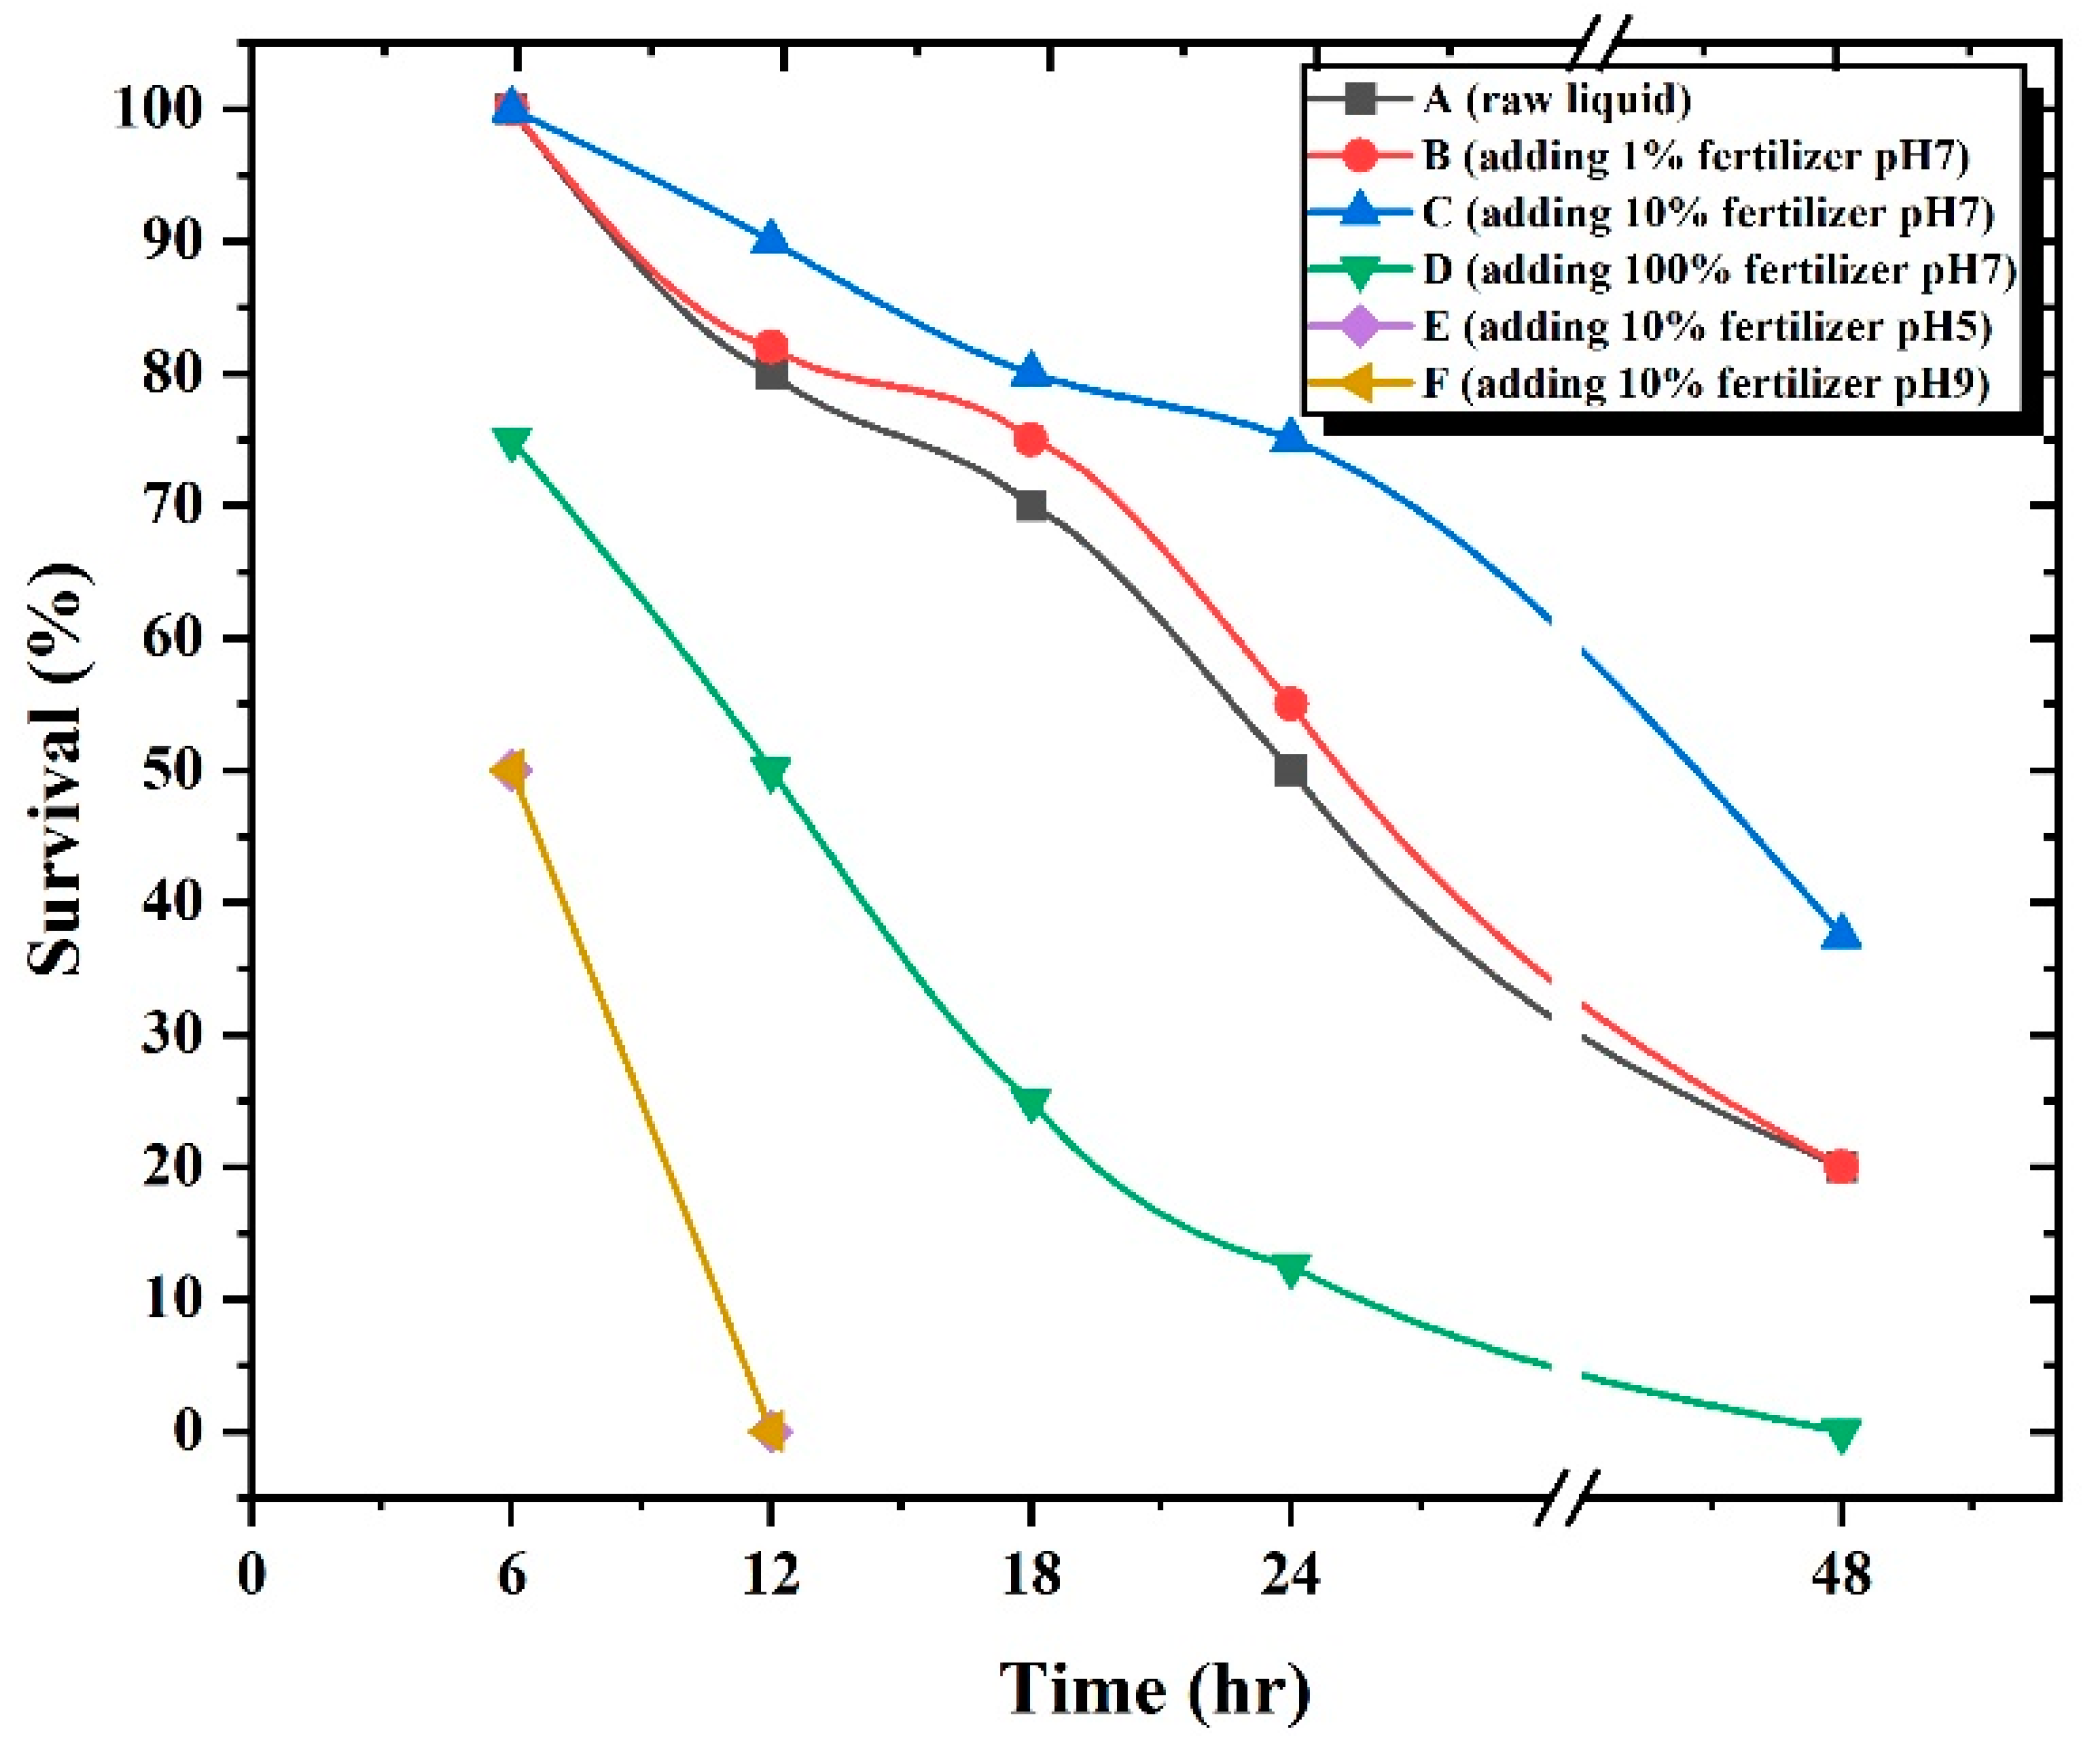
3.7. Liquid Fertilizer Toxicity Test with D. magna

D. magna exposed to three liquid fertilizers with different pH values and concentrations over a short time (6–24 h, 48 h) are shown in Figure 6. For D. magna exposed to three concentrations (A, B, and C) the survival is 100%, but for those exposed to Liquid D the survival rate decreased by 25%, while for those exposed to Liquid E and F the survival decreased by 50% at 6 h. At 12 h exposure time D. magna exposed to Liquids A, B, and C had a survival rate of more than 80%, but for those exposed to Liquid D the survival rate decreased 50%, while for those exposed to Liquids E and F the D. magna all died. At exposure time of 18 h, D. magna exposed to Liquids A, B, and C had a survival rate of more than 70%, while for those exposed to Liquid D the survival decreased 75%. At exposure time of 24 h, D. magna exposed to Liquid C had a survival rate that approached 80%, while those exposed to Liquids A and B the survival rate is more than 50%, but for those exposed to Liquid D the survival rate is 15%. At exposure time of 48 h, D. magna exposed to Liquid C the survival rate approached 40%, while those exposed to Liquids A and B the survival rate is 20%, but D. magna exposed to Liquid D all died. Discussion of these results is in Section 4.5.

4. Discussion

In this section, several parameters involved in the chemical conversion including the CaO dosage, reaction temperature, mechanism of conversion induced by CaO addition, comparison of combined organic acid with an inorganic acid or organic acid, and application of liquid fertilizer are discussed.

4.1. Discussion on Conversion Results

According to experiment result of Section 3.1, the feasibility of CaO addition for the conversion of other P types (NAIP) to AP was confirmed at 25 °C. This result is similar to a previous study in which the NAIP was converted to AP by the addition of CaO during incineration [18].
The preceding results suggest that above 100 °C, increasing the reaction temperature of the CaO–SS mixture substantially increased the conversion of OP types to AP. Higher reaction temperatures may facilitate the decomposition of OP, which is beneficial for reactions between CaO and P, thus increasing the formation of AP. In order to confirm the truth of the OP conversion to AP through addition of CaO at low temperature (300 °C) the effects of different CaO (0 wt%, 8 wt%) weight fractions and different temperatures (300–500 °C) on the fraction of each P type in the SS are shown in Figure 7. At 300 °C, the content of AP, NAIP, and OP is 29.3%, 56.2%, and 14.4%, respectively. When the temperature increases, the content of OP continues to decrease. At 400–500 °C, the content of OP approaches 0%. Zhai et al. have reported that OP is most effectively decomposed and converted into AP or NAIP at 400–600 °C [39]. According to the above results the addition of CaO can stimulate the conversion of OP, NAIP to AP at lower reaction temperatures.

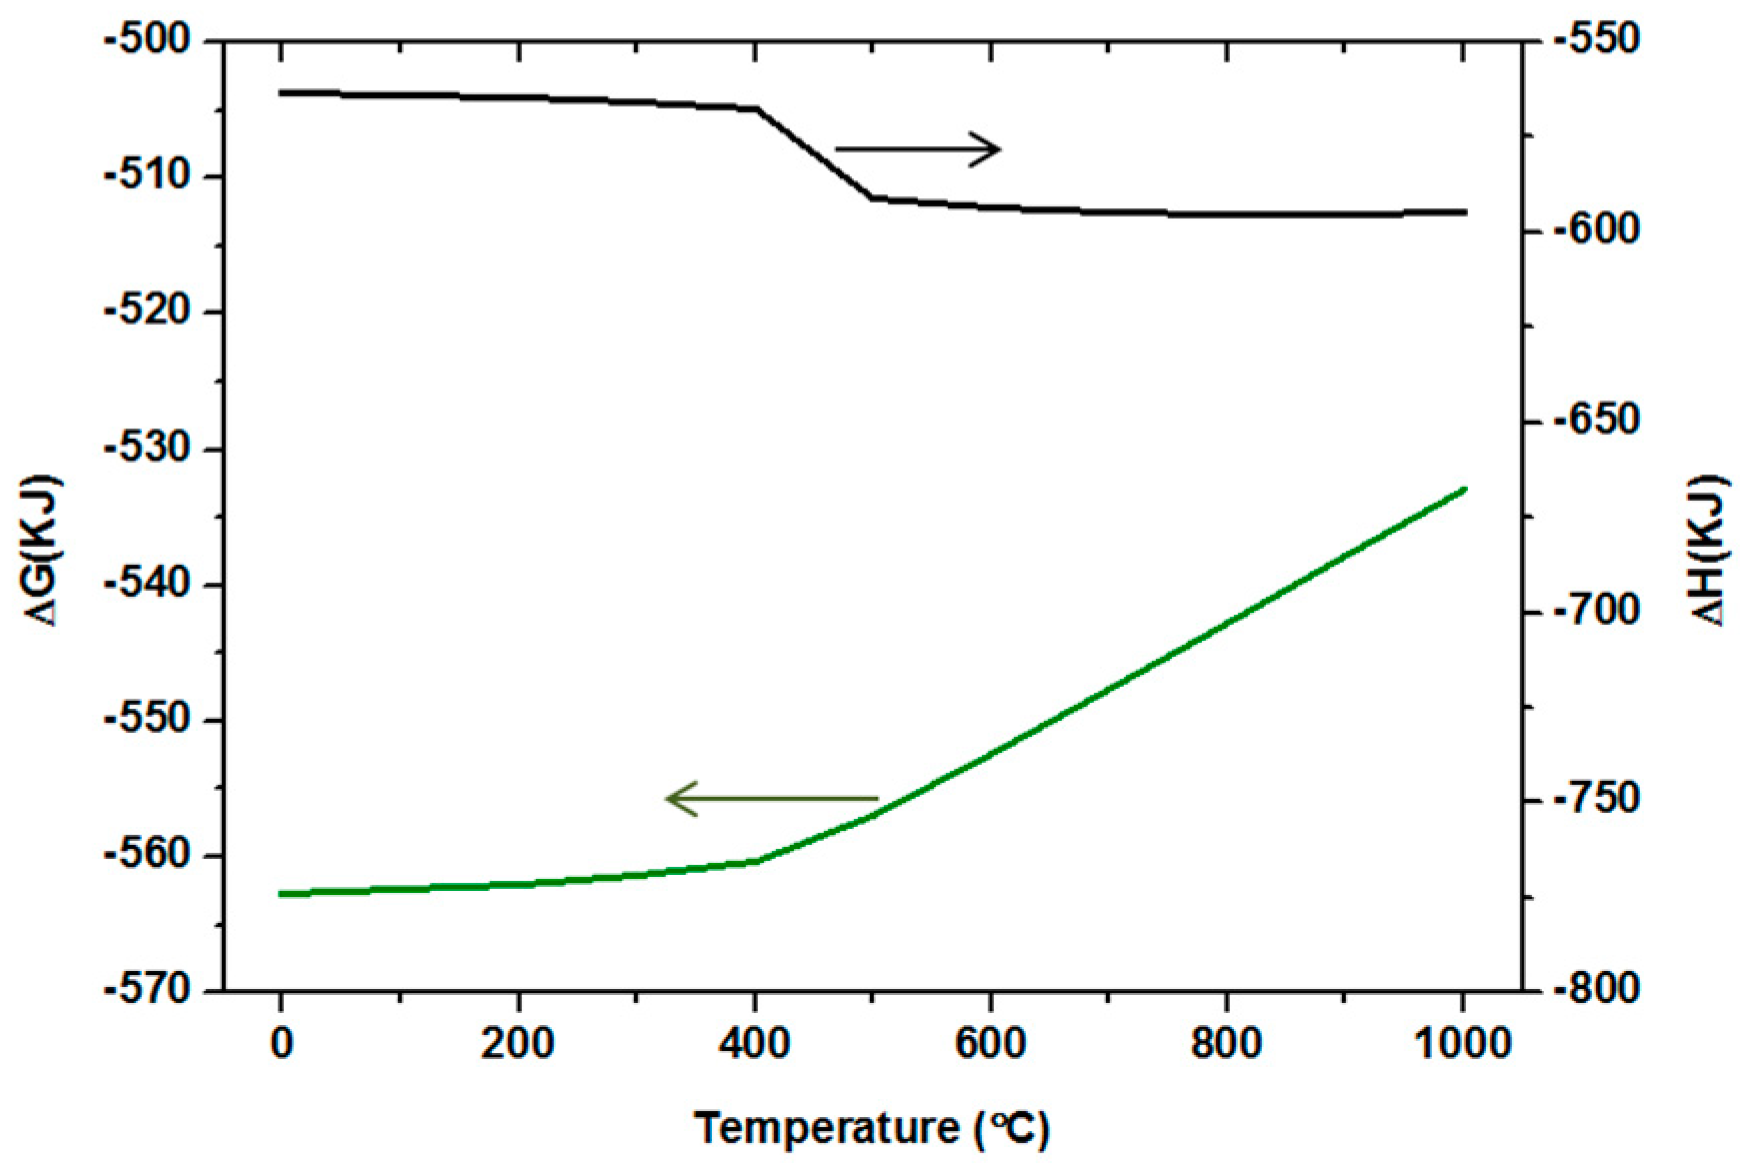
4.2. The Mechanism of Conversion by Addition of CaO

XRD analysis detects the mineralogical crystal phases of inorganic compounds, the results suggest that IP existed as Al, Fe, and Ca compounds in the as-received SS sample. Compounds in which P bonds with Al (such as AlP3O8(OH)2) and Fe (such as Fe4(PO4)3(OH)3) are classified as NAIP, and those in which P bonds with Ca (such as CaMg(PO4)(OH,F)) are classified as AP [14,15,17,40,41]. After the addition of 8 wt% CaO at a high temperature (300 °C) for 2 h, MgAl2(PO4)2(OH)2·8H2O is classified as NAIP. The AP compounds Ca2P2O7 was still detected.
The XRD analysis results confirmed the experimental results obtained in the preceding sections. A comparison of the main crystal phases of the SS sample before and after CaO treatment confirmed that various P types were converted to AP. The converted AP was primarily Ca2P2O7. OP and AP fractions were observed to become 0% and 90%, respectively, after the addition of 8 wt% CaO and treatment for 2 h at 300 °C. These results suggest that the majority of the P compound in SS had been converted to Ca2P2O7.
The preceding experimental results demonstrate that CaO addition facilitates the conversion of P types to AP at moderate temperatures. The mechanism of P conversion to AP through CaO addition is discussed theoretically in this section. The reaction of CaO and P2O5 to form Ca2P2O7 can be expressed as the follows:
2CaO + P2O5 → Ca2P2O7
The Gibbs free energy (ΔG) and heat of reaction (ΔH) for Equation (1) as a function of temperature are displayed in Figure 8. The data were calculated using the thermodynamic calculation software HSC Chemistry (ver. 6.0; Outokumpu Technology, Helsinki, Finland). The ΔG values were calculated to be negative from 0 to 1000 °C, indicating that this reaction is spontaneous. Therefore, CaO possesses high affinity for P-compound. Additionally, the ΔH values were negative from 0 to 1000 °C, indicating that this reaction is exothermic. Hence, the released heat facilitates the decomposition of OP at lower temperatures.
Based on the XRD detected crystal phases observed in SS before and after conversion, the equations of the possible chemical reactions between the added CaO and NAIP species (Fe-P and Al-P) are represented by the following reactions:
6CaO + 2Fe4(PO4)3(OH)3 + 9H2O → 3Ca2P2O7 + 8Fe(OH)3
8CaO + 2CaMgPO4(OH) + 4AlP3O8(OH)2 + 13H2O
→ 5Ca2P2O7 + 2MgAl2(PO4)28H2O
Previous studies point to NAIP species conversion to AP species in SSA by adding CaO [14,15]. These equations suggest that P-Fe (such as Fe4(PO4)3(OH)3), Ca-P (such as CaMgPO4(OH)) and P-Al (such as AlP3O8(OH)2) react with CaO to form Ca-P (such as Ca2P2O7), Al-P (such as MgAl2(PO4)28H2O), and Fe-O (such as Fe(OH)3). According to the result of XRD analysis and SMT protocol NAIP species (Fe-P and Al-P) conversion to AP (Ca-P) in SS by adding CaO is proved.
However, OP in SS has been reported to exist as pyrophosphate (P2O74−), orthophosphate diesters (R2HPO4), and orthophosphate monoesters (RH2PO4) [33]. These OP species decomposed and were converted to orthophosphate monoesters above 105 °C. Because the SS sample used in this study had been dried at 105 °C in the SS treatment unit of the treatment plant, the OP contained in the as-received SS sample existed as orthophosphate monoesters. We speculate that at reaction temperatures above 100 °C, the orthophosphate monoesters were decomposed. The added CaO then reacted with the released P to form AP due to its high P affinity.

4.3. Comprehensive Comparison of Combined Organic Acid, Inorganic Acid, and Alkali for Recovery of P and Leaching of Heavy Metals from Pre- or Postconversion SS

This section will discuss the effect of the fraction of P (OP, AP, and NAIP) and heavy metals by leaching agent (combined organic acid, inorganic acid, and alkali)
Inorganic and combined organic acid are both better than organic acid and inorganic alkali in terms of NAIP and AP leaching efficiency. Inorganic acids are usually strong acids which are very destructive to many compounds [23,26,27,28]. P and heavy metals are co-leached out by inorganic acid. On the other hand, combined organic acid leaching efficiency is better than organic acid. Because part of NAIP and AP can be leached out by acetic acid. While citric acid is highly efficient for leaching of metal [32,33]. When acetic acid is mixed with citric acid this can improve the leaching out of NAIP.
At leaching of OP, alkali is better than inorganic, combined organic acid, and organic acid. Previous studies have pointed out that alkali treatment destroyed the SS structure, facilitating the anaerobic fermentation and accelerate transformation from OP to IP [24]. However, NAIP and AP are difficult to leach out by an alkali. Further destroying the OP is necessary for enhanced leaching of P. The results suggest that when 8 wt% CaO was added at 300 °C for 2 h, the OP was converted to AP, which enhanced recovery of P because the AP was easily leached out by inorganic and organic acid [42].
P and Heavy metals are co-leached out from SS by H2SO4. Previous studies have also reported that P and heavy metals were co-leached out from SS or SSA by inorganic acid [23,26,27,28]. The amount of leached liquid of H2SO4 easily exceeded that permitted by liquid fertilizer regulations. To date, most researchers have applied other methods (adsorption, precipitation, or ion exchange) to remove heavy metals [23,26,27,28]. These heavy metal removal methods easily incur high treatment costs. Although NaOH could leach out approximately 70% of the P content, it’s leaching out of heavy metals and of K was inefficient.
The content of heavy metals in combined organic acid solution is in accordance with liquid fertilizer regulations. Although previous studies usually use citric acid to leach out heavy metals from SS by 0.5M citric acid [43,44], the concentration of citric acid is very low (<0.01 M) in combined organic acid. Thus, heavy metals aren’t leached out by combined organic acid. These results suggest that leaching of P from SS by combined organic acid is the optimal liquid for the synthesis of liquid fertilizer.

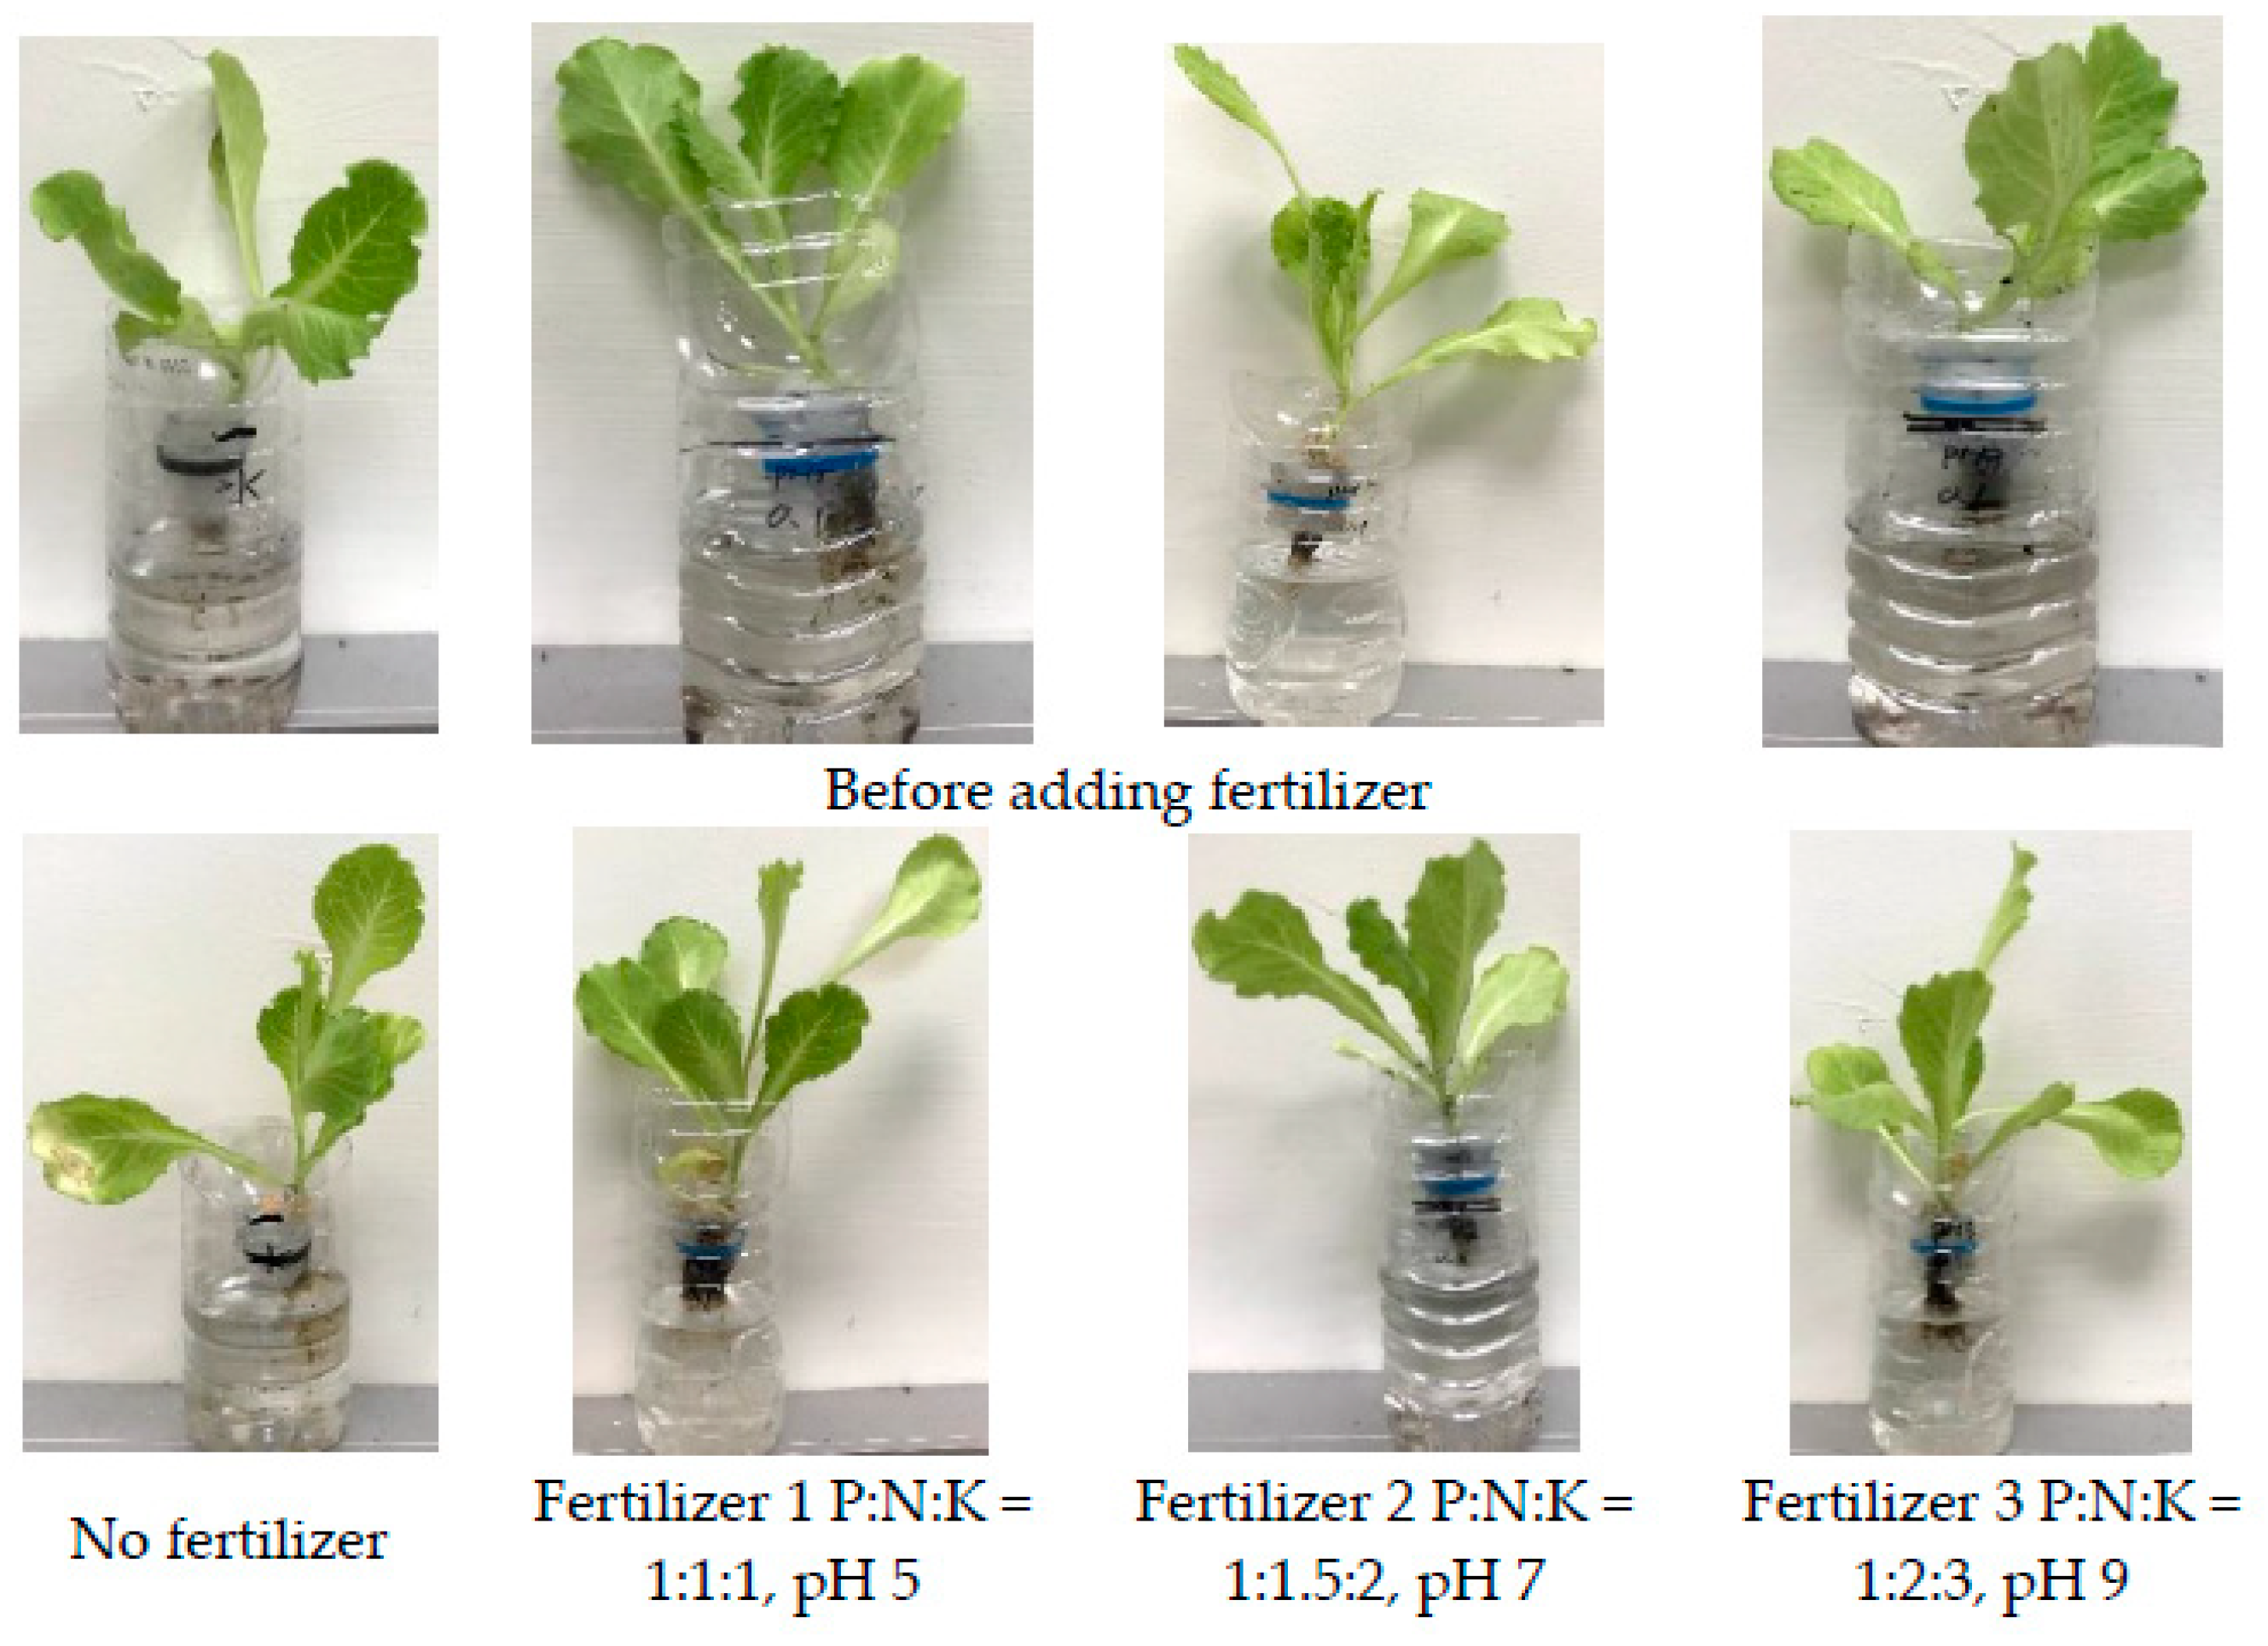
4.4. Application of Synthesis Liquid Fertilizer Grow Plants

The roots, stems, and leaves of the plants were observed to grow more quickly after the addition of fertilizer. The fertilized plants grew 1–2 new leaves, and the leaf length was observed to increase by 3–5 cm. The branches were also observed to exhibit more luxuriantly. Regardless of the added fertilizer, the plants were observed to have superior growth. However, fertilizers 1–3 with various pH values could be used in soils of different acidity or alkalinity levels. The content of heavy metals in plants with liquid fertilizer for 21 days is shown in Table 6. Whatever kind of liquid fertilizer is applied, the content of heavy metal in the plants for 21 days is in accordance with Taiwanese Food Safety regulations and EU No 420-2011 regulations.

4.5. Liquid Fertilizer Toxicity

For D. magna exposed to liquids A, B, and C at 6 h, survival approached 100%. When the exposure time increases, D. magna exposed to liquid C survived better than those exposed to liquids A and B at 24 h and 48 h. The speculated reason is that liquid A (raw) and B (adding 1% fertilizer) do not offer sufficient nutrients to help D. magna survive. Liquid C has sufficient nutrients to help D. magna survive by addition of 10% liquid fertilizer, thus reducing the mortality rate and increasing the survival rate. On the other hand, D. magna exposed to liquids D, E, and F at 6 h, had survival rates of 75%, 50%, and 50%, respectively. When exposure time was at 12 h, D. magna exposed to liquids E and F all die. The speculated reason is the pH of the liquids E and F, because D. magna’s optimal growth pH is between 7 and 8.5 [45]. When the pH is lower than 7 or higher than 8.5, it can cause the death of D. magna. D. magna exposed to liquid D all died at 48 h. The reason speculated is the addition of fertilizer that was highly over-concentrated, causing death. According to the above result, the addition of liquid fertilizer (pH 7) is not the cause of death of D. magna over a short time. Demonstrating that the liquid fertilizer is safe.

5. Conclusions

The results of this research have two major breakthroughs. Firstly, previous studies focus mostly on recovery/leaching out of P from SSA. Because of the fraction of OP converted to the fraction of AP/NAIP in the SSA. However, the incineration method easily causes air pollution and emits a large amount of carbon dioxide. Incineration method must be improved. The fraction of OP and NAIP converted to the fraction of AP by adding CaO at 300 °C for 2 h, the fraction of OP decreased to 0% and the fraction of AP increased to approximately 90% in SS. The technology reduces carbon dioxide emissions which can bring a new option for sewage sludge treatment.
Secondly, the synthesis of liquid fertilizer from SS is feasible technology. Leaching efficiency of both P and K is 90–95% by combined organic acid. The content of heavy metals is in accordance with fertilizer regulations in leaching solution. The leaching solution combine with KOH and NH4OH to P: N: K = 1:1.5:2 to synthesize liquid fertilizer. This liquid fertilizer adds 10 wt% to accelerate plant growth and does not cause the death of D. magna over a short time, as the liquid fertilizer has enough nutrients to help D. magna survive, thus reducing the mortality rate and increasing the survival rate. The liquid fertilizer can help the growth of rice husk, corn, sweet potato crop and so indirectly alleviate food shortage problems. Planting of flower and forest are applied by liquid fertilizer in gardening and forestry industry. In addition, the method of liquid fertilizer from SS can reduce treatment amount of SS and increase cycle resource of P, and act as a new fertilizer option.

Author Contributions

Conceptualization, Y.-J.C.; methodology, Y.-J.C.; investigation, Y.-J.C.; writing—original draft preparation, Y.-J.C. and L.-P.W.; writing—review and editing, L.-P.W. and S.B.; supervision, L.-P.W.; project administration, L.-P.W. and S.B.; funding acquisition, L.-P.W. and S.B. All authors have read and agreed to the published version of the manuscript.

Funding

This work was financially supported by the R.O.C. Ministry of Science and Technology under Grant Nos. MOST 110-2622-E-027-022-, MOST 106-2221-E-027-014-, MOST 105-2221-E-027-001-, NTUT-TU Joint Research Program under Grant No. NTUT-TU-110-03, and Matching Fund between Thammasat University and the National Taipei University of Technology under Contract No. MF 3/2564.

Institutional Review Board Statement

Not applicable.

Informed Consent Statement

Not applicable.

Data Availability Statement

No data is reported.

Acknowledgments

The authors thank the Dihua sewage treatment plant for providing the sewage sludge sample.

Conflicts of Interest

The authors declare no conflict of interest.

References

  1. Clarke, J.I.; Macbeth, H.; Collinson, P. The growing concentration of world population from 1950 to 2050. In Human Population Dynamics; Pew Research Center: Washington, DC, USA, 2014; pp. 41–64. [Google Scholar]
  2. Hall, J.E. Alternative Uses for Sewage Sludge. Waste Manag. 1992, 12, 100. [Google Scholar]
  3. Hus, C.W.; Chen, C.T. Strength development of cement pastes with alkali-activated dehydrated sewage sludge. Constr. Build. Mater. 2020, 255, 119243. [Google Scholar]
  4. Hoffmann, G.; Schingnitz, D.; Bilitewski, B. Comparing different methods of analysing sewage sludge, dewatered sewage sludge and sewage sludge ash. Desalination 2010, 250, 399–403. [Google Scholar] [CrossRef]
  5. Moreira, M.J.; Andrea, A.; Feijoo, G. Life Cycle Assessment of Municipal Wastewater and Sewage Sludge Treatment Book; CRC Press: Boca Raton, FL, USA, 2018; pp. 33–48. [Google Scholar]
  6. Rudolfs, W. Sewage Sludge as Fertilizer. Can. J. Soil Sci. 1972, 52, 270–273. [Google Scholar] [CrossRef]
  7. Wang, S.; Jin, X.; Zhao, H.; Wu, F. Phosphorus fractions and its release in the sediments from the shallow lakes in the middle and lower reaches of Yangtze River area in China. Colloids Surf. A Physicochem. Eng. Asp. 2006, 273, 109–116. [Google Scholar] [CrossRef]
  8. Zhang, B.; Fang, F.; Guo, J.; Chen, Y.; Li, Z.; Guo, S. Phosphorus fractions and phosphate sorption-release characteristics relevant to the soil composition of water-level-fluctuating zone of three gorges reservoir. Ecol. Eng. 2012, 40, 153–159. [Google Scholar] [CrossRef]
  9. Barbosa, S.G.; Peixoto, L.; Meulman, B.; Alves, M.M.; Pereira, M.A. A design of experiments to assess phosphorous removal and crystal properties in struvite precipitation of source separated urine using different Mg sources. Chem. Eng. J. 2016, 298, 146–153. [Google Scholar] [CrossRef] [Green Version]
  10. Shashvatt, U.; Benoit, J.; Aris, H.; Blaney, L. CO2-assisted phosphorus extraction from poultry litter and selective recovery of struvite and potassium struvite. Water Res. 2018, 143, 19–27. [Google Scholar] [CrossRef] [PubMed]
  11. Wang, S.; An, J.; Wan, Y.; Du, Q.; Wang, X.; Cheng, X.; Li, N. Phosphorus competition in bioinduced vivianite recovery from wastewater. Environ. Sci. Technol. 2018, 52, 13863–13870. [Google Scholar] [CrossRef] [PubMed]
  12. Huang, H.; Li, J.; Li, B.; Zhang, D.; Zhao, N.; Tang, S. Comparison of different K-struvite crystallization processes for simultaneous potassium and phosphate recovery from source-separated urine. Sci. Total Environ. 2019, 651, 787–795. [Google Scholar] [CrossRef] [PubMed]
  13. Qian, T.T.; Jiang, H. Migration of phosphorus in sewage sludge during different thermal treatment processes. ACS Sust. Chem. Eng. 2014, 2, 1411–1419. [Google Scholar] [CrossRef]
  14. Li, R.; Zhang, Z.; Li, Y.; Teng, W.; Wang, W.; Yang, T. Transformation of apatite phosphorus and non-apatite inorganic phosphorus during incineration of sewage sludge. Chemosphere 2015, 141, 57–61. [Google Scholar] [CrossRef]
  15. Li, R.; Teng, W.; Li, Y.; Wang, W.; Cui, R.; Yang, T. Potential recovery of phosphorus during the fluidized bed incineration of sewage sludge. J. Clean. Prod. 2017, 140, 964–970. [Google Scholar] [CrossRef]
  16. Yu, B.; Luo, J.; Xie, H.; Yang, H.; Chen, S.; Liu, J.; Zhang, R.; Li, Y.Y. Species, fractions, and characterization of phosphorus in sewage sludge: A critical review from the perspective of recovery. Sci. Total Environ. 2021, 786, 147437. [Google Scholar] [CrossRef]
  17. Adam, C.; Peplinski, B.; Michaelis, M.; Kley, G.; Simon, F.G. Thermochemical treatment of sewage sludge ashes for phosphorus recovery. Waste Manag. 2009, 29, 1122–1128. [Google Scholar] [CrossRef]
  18. Li, R.; Yin, J.; Wang, W.; Li, Y.; Zhang, Z. Transformation of phosphorus during drying and roasting of sewage sludge. Waste Manag. 2014, 34, 1211–1216. [Google Scholar] [CrossRef]
  19. Singhal, A.; Tewari, V.K.; Prakash, S. Utilization of treated spent liquor sludge with fly ash in cement and concrete Build. Build Environ. 2008, 43, 991–998. [Google Scholar] [CrossRef]
  20. Su, Y.; Zhu, W.; Gong, M.; Zhou, H.; Fan, Y.; Amuzu-Sefordzi, B. Interaction between sewage sludge components lignin (phenol) and proteins (alanine) in supercritical water gasification. Int. J. Hydrog. Energy 2015, 40, 9125–9136. [Google Scholar] [CrossRef]
  21. Chen, F.Y. The Characterization of Hong Kong Sewage Sludge for Its Ash Utilization in Cement Production; HKUST: Hong Kong, China, 2009. [Google Scholar]
  22. Xu, Y.; Hu, H.; Liu, J.; Luo, J.; Qian, G.; Wang, A. pH dependent phosphorus release from waste activated sludge: Contributions of phosphorus speciation. Chem. Eng. J. 2015, 267, 260–265. [Google Scholar] [CrossRef]
  23. Shiba, N.C.; Ntuli, F. Extraction and precipitation of phosphorus from sewage sludge. Waste Manag. 2017, 60, 191–200. [Google Scholar] [CrossRef] [PubMed]
  24. Wu, L.; Zhang, C.; Hu, H.; Liu, J.; Duan, T.; Luo, J. Phosphorus and short-chain fatty acids recovery from waste activated sludge by anaerobic fermentation: Effect of acid or alkali pretreatment. Bioresour. Technol. 2017, 240, 192–196. [Google Scholar] [CrossRef]
  25. Biswas, B.K.; Inoue, K.; Harada, H.; Ohto, K.; Kawakita, H. Leaching of phosphorus from incinerated sewage sludge ash by means of acid extraction followed by adsorption on orange waste gel. J. Environ. Sci. 2009, 21, 1753–1760. [Google Scholar] [CrossRef]
  26. Franz, M. Phosphate fertilizer from sewage sludge ash (SSA). Waste Manag. 2008, 28, 1809–1818. [Google Scholar] [CrossRef] [PubMed]
  27. Donatello, S.; Tong, D.; Cheeseman, C.R. Production of technical grade phosphoric acid from incinerator sewage sludge ash (ISSA). Waste Manag. 2010, 30, 1634–1642. [Google Scholar] [CrossRef] [Green Version]
  28. Xu, H.; He, P.; Gu, W.; Wang, G.; Shao, L. Recovery of phosphorus as struvite from sewage sludge ash. J. Environ. Sci. 2012, 24, 1533–1538. [Google Scholar] [CrossRef]
  29. Levlin, E. Phosphorus Recovery from Sewage Sludge—Two-Step Leaching Process With Acid and Base. In Proceedings of the Polish-Swedish SIOUSS, Cracow, Poland, 17–18 March 2005; pp. 51–60. [Google Scholar]
  30. Matsushita, K.; Toyama, H.; Tonouchi, N.; Okamoto-Kainuma, A. Acetic Acid Bacteria: Ecology and Physiology, Book; Springer: Berlin, Germany, 2016. [Google Scholar]
  31. Rahman, M.M.; Mostofa, M.G.; Rahman, M.A.; Islam, M.R.; Keya, S.S.; Das, A.K.; Miah, M.G.; Kawser, A.Q.M.R.; Ahsan, S.M.; Hashem, A.; et al. Acetic acid: A cost-effective agent for mitigation of seawater-induced salt toxicity in mung bean. Sci. Rep. 2019, 9, 15186. [Google Scholar] [CrossRef] [PubMed] [Green Version]
  32. DiPalma, L.; Ferrantelli, P. Copper leaching from a sandy soil: Mechanism and parameters affecting EDTA extraction. J. Hazard. Mater. 2005, 122, 85–90. [Google Scholar] [CrossRef]
  33. Liu, C.C.; Lin, Y.C. Reclamation of copper-contaminated soil using EDTA or citric acid coupled with dissolved organic matter solution extracted from distillery sludge. Environ. Pollut. 2013, 178, 97–101. [Google Scholar] [CrossRef]
  34. Barbara, C.M.; Preston, C.M. A comparison of soil extraction procedures for 31P NMR spectroscopy. Soil Sci. 1996, 161, 770–785. [Google Scholar]
  35. Pardo, P.; Lopez-Sanchez, J.F.; Rauret, G. Relationships between phosphorus fractionation and major components in sediments using the SMT harmonized extraction procedure. Anal. Bioanal. Chem. 2003, 376, 248–254. [Google Scholar] [CrossRef]
  36. Xie, C.S.; Zhao, J.; Tang, J.; Xu, J.; Lin, X.Y.; Xua, X.H. The phosphorus fractions and alkaline phosphatase activities in sludge. Bioresour. Technol. 2011, 102, 2455–2461. [Google Scholar] [CrossRef] [PubMed]
  37. Garcia-Albacete, M.; Martin, A.; Cartagena, M.C. Fractionation of phosphorus biowastes: Characterisation and environmental risk. Waste Manag. 2012, 32, 1061–1068. [Google Scholar] [CrossRef] [PubMed]
  38. Kidd, P.S.; Domínguez-Rodríguez, M.J.; Díez, J.; Monterroso, C. Bioavailability and plant accumulation of heavy metals and phosphorus in agricultural soils amended by long-term application of sewage sludge. Chemosphere 2007, 66, 1458–1467. [Google Scholar] [CrossRef] [PubMed]
  39. Zhai, Y.; Chen, H.; Xu, B.; Xiang, B.; Chen, Z.; Li, C.; Zeng, G. Influence of sewage sludge-based activated carbon and temperature on the liquefaction of sewage sludge: Yield and composition of bio-oil, immobilization and risk assessment of heavy metals. Bioresour. Technol. 2014, 159, 72–79. [Google Scholar] [CrossRef] [PubMed]
  40. Aljerf, L.; Choukaife, A.E. Hydroxyapatite and Fluoroapatite Behavior with pH Change. Int. Med. J. 2017, 24, 407–410. [Google Scholar]
  41. Aljerf, L.; Choukaife, A.E. A Descriptive Study—In Vitro: New Validated Method for Checking HAp and FAp Behaviours. Int. Med. J. 2017, 24, 407–410. [Google Scholar]
  42. Steckenmesser, D.; Vogel, C.; Adam, C.; Steffens, D. Effect of various types of thermochemical processing of sewage sludges on phosphorus speciation, solubility, and fertilization performance. Waste Manag. 2017, 62, 194–203. [Google Scholar] [CrossRef]
  43. Karwowska, B. Optimalization of metals ions extraction from industrial wastewater sludge with chelating agents. Arch. Environ. Prot. 2012, 38, 15–21. [Google Scholar] [CrossRef]
  44. Wang, X.J.; Chen, J.; Yan, X.B.; Wang, X.; Zhang, J.; Huang, J.Y.; Zhao, J.F. Heavy metal chemical extraction from industrial and municipal mixed sludge by ultrasound-assisted citric acid. J. Ind. Eng. Chem. 2015, 27, 368–372. [Google Scholar] [CrossRef]
  45. Ebert, D. Ecology, Epidemiology, and Evolution of Parasitism in Daphnia, Book; National Center for Biotechnology Information: Bethesda, MD, USA, 2005. [Google Scholar]
Figure 1. Effects of CaO mass fraction on the fraction of each P type in SS at 25 °C for 2 h with SS solid concentration of 40 mL/g.
Sustainability 14 00387 g001
Figure 2. Effects of reaction temperatures above 100 °C on the fraction of each P type in SS with 8 wt% CaO after heating for 2 h.
Sustainability 14 00387 g002
Figure 3. XRD spectra for (a) as-received sample, (b) SS sample converted after treatment at above 100 °C.
Sustainability 14 00387 g003
Figure 4. The effect of reaction time on leaching of P, K, and Zn.
Sustainability 14 00387 g004
Figure 5. Plants hydroponically grown for 21 days by using various fertilizers.
Sustainability 14 00387 g005
Figure 6. D. magna exposed to three fertilizers with different pH values and fertilizer concentrations over short time (6–24 h, 48 h).
Sustainability 14 00387 g006
Figure 7. The effects of different CaO (0 wt%, 8 wt%) weight fractions and different temperatures (300–500 °C) on the fraction of each P type in the SS.
Sustainability 14 00387 g007
Figure 8. Gibbs free energy (ΔG) and heat of reaction (ΔH) of the reaction 2CaO + P2O5 → Ca2P2O7 as a function of temperature.
Sustainability 14 00387 g008
Table 1. SS or SSA phosphorus form conversion technology.
Processing TechnologyCaO AdditionTemperatureAPNAIPOPReferences
Incineration0%900 °C40%60%0%[14]
10%90%10%0%
Fluidized bed0%900 °C4060%0%[15]
10%90%10%0%
Thermal0%250 °C40%50%10%[17]
Table 2. Separation technology of heavy metals from P-rich solution.
Leaching SolutionLeaching Efficiency of P (%)Separation Methods of P and Heavy MetalsRemoval of Heavy Metals from P-Rich Solution (%)Reference
1 M H2SO490precipitation13[23]
ion exchange74
3 M H2SO499ion exchange + sulfide precipitation99[26]
0.38 M H2SO485ion exchange99[27]
0.8 M HCl95ion exchange99[28]
Table 3. Characteristics and composition of SS sample.
ContentSD
Moisture (%)3.72.1
Residue (%)23.41.6
Combustible (%)72.91.1
OC (%)355
LOC (%)7010
HHV (MJ/kg)3500
Fe (g/kg-SS)36.32.4
Si (g/kg-SS)32.61.4
Ca (g/kg-SS)10.60.58
P (g/kg-SS)7.640.7
Al (g/kg-SS)6.980.2
K (g/kg-SS)3.910.15
Mg (g/kg-SS)2.110.44
Zn (g/kg-SS)0.01530.08
Cu (g/kg-SS)0.00480.008
Cr (g/kg-SS)0.00150.005
N (g/kg-SS)5.910.15
Table 4. P leaching from pre- and post-conversion SS by using an organic acid, combined organic acid, inorganic acid, and alkali.
SampleExperimental ConditionsLeaching Efficiency (%)
NAIPOPAP
Raw SS1M acetic acid, at room temperature75.674.399.9
1 M acetic acid mix with 5 wt% citric acid, at room temperature90.873.699.9
1 M Sulfuric acid, at 100 °C [22]91.289.299.9
6 M Sodium hydroxide, at 100 °C [23]28.192.490.5
Conversion SS1 M acetic acid, at room temperature76.7-99.9
1 M acetic acid mix with 5 wt% citric acid, at room temperature90.1-99.9
Table 5. Comprehensive comparison of optimum leaching conditions.
SampleExperimental ConditionsPKCuZnCrpH
Content (mg/kg)
Raw SS1M acetic acid mix with 5 wt% citric acid260.5 ± 1.936.63 ± 1.1ND7.65 ± 2.1ND2.56
1M Sulfuric acid [22]324.4 ± 1.137.24 ± 0.54.56 ± 1.114.5 ± 1.11.43 ± 2.60.37
6M Sodium hydroxide [23]233.2 ± 2.220.94 ± 5.9ND7.89 ± 5.10.36 ± 0.0511.5
Conversion SS1M acetic acid mix with 5 wt% citric acid315.5 ± 1.536.93 ± 0.8ND7.66 ± 2.1ND2.56
Taiwanese regulations--2016030-
EU ECNo 2003/2003--10N/AN/A-
Table 6. The content of heavy metals in plants.
CuZnCrPbCd
mg/kg
Fertilizer 10.180.2120.003NDND
Fertilizer 2ND0.046NDNDND
Fertilizer 3NDNDNDNDND
Taiwanese regulations---0.30.2
EU No 420-2011 0.10.2
Fertilizer 1: P:N:K = 1:1:1, pH 5, Fertilizer 2: P:N:K = 1:1.5:2, pH 7, Fertilizer 3: P:N:K = 1:2:3, pH 9.
Publisher’s Note: MDPI stays neutral with regard to jurisdictional claims in published maps and institutional affiliations.

