
Climate Change Risk of Urban Growth and Land Use/Land Cover Conversion: An In-Depth Review of the Recent Research in Iran


 and
and
Abstract
:1. Introduction
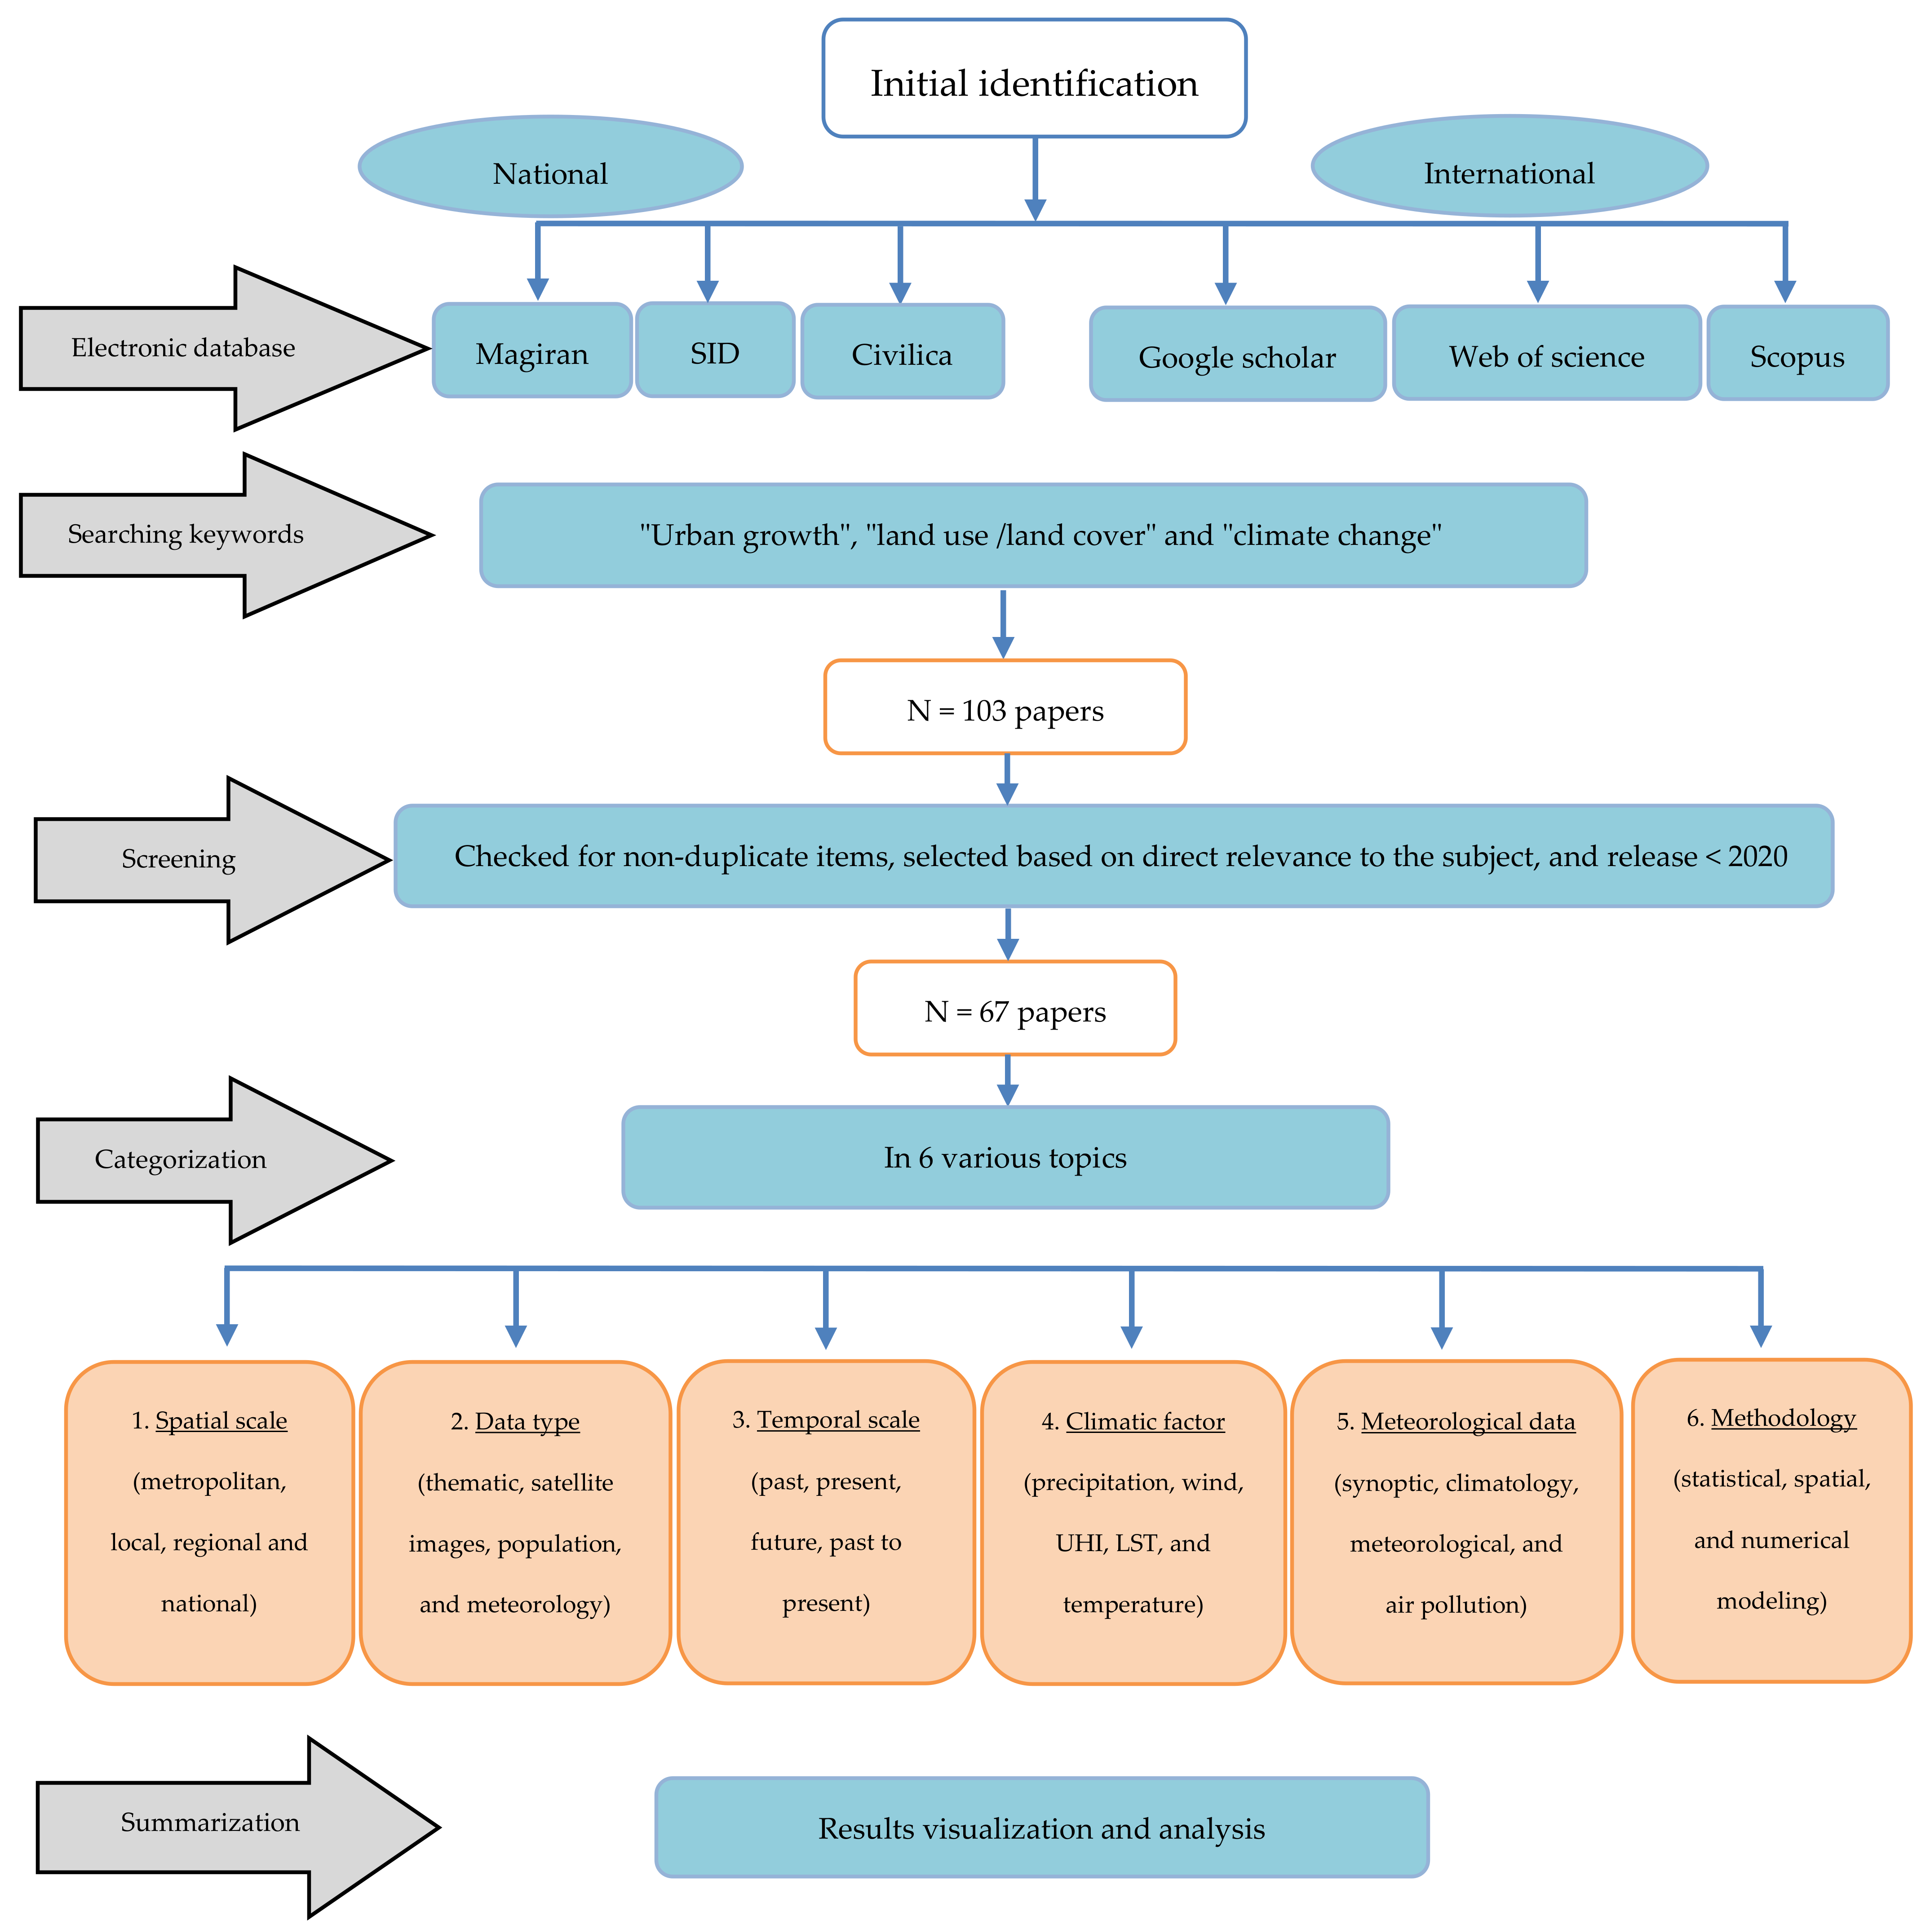
2. Materials and Methods
3. Results
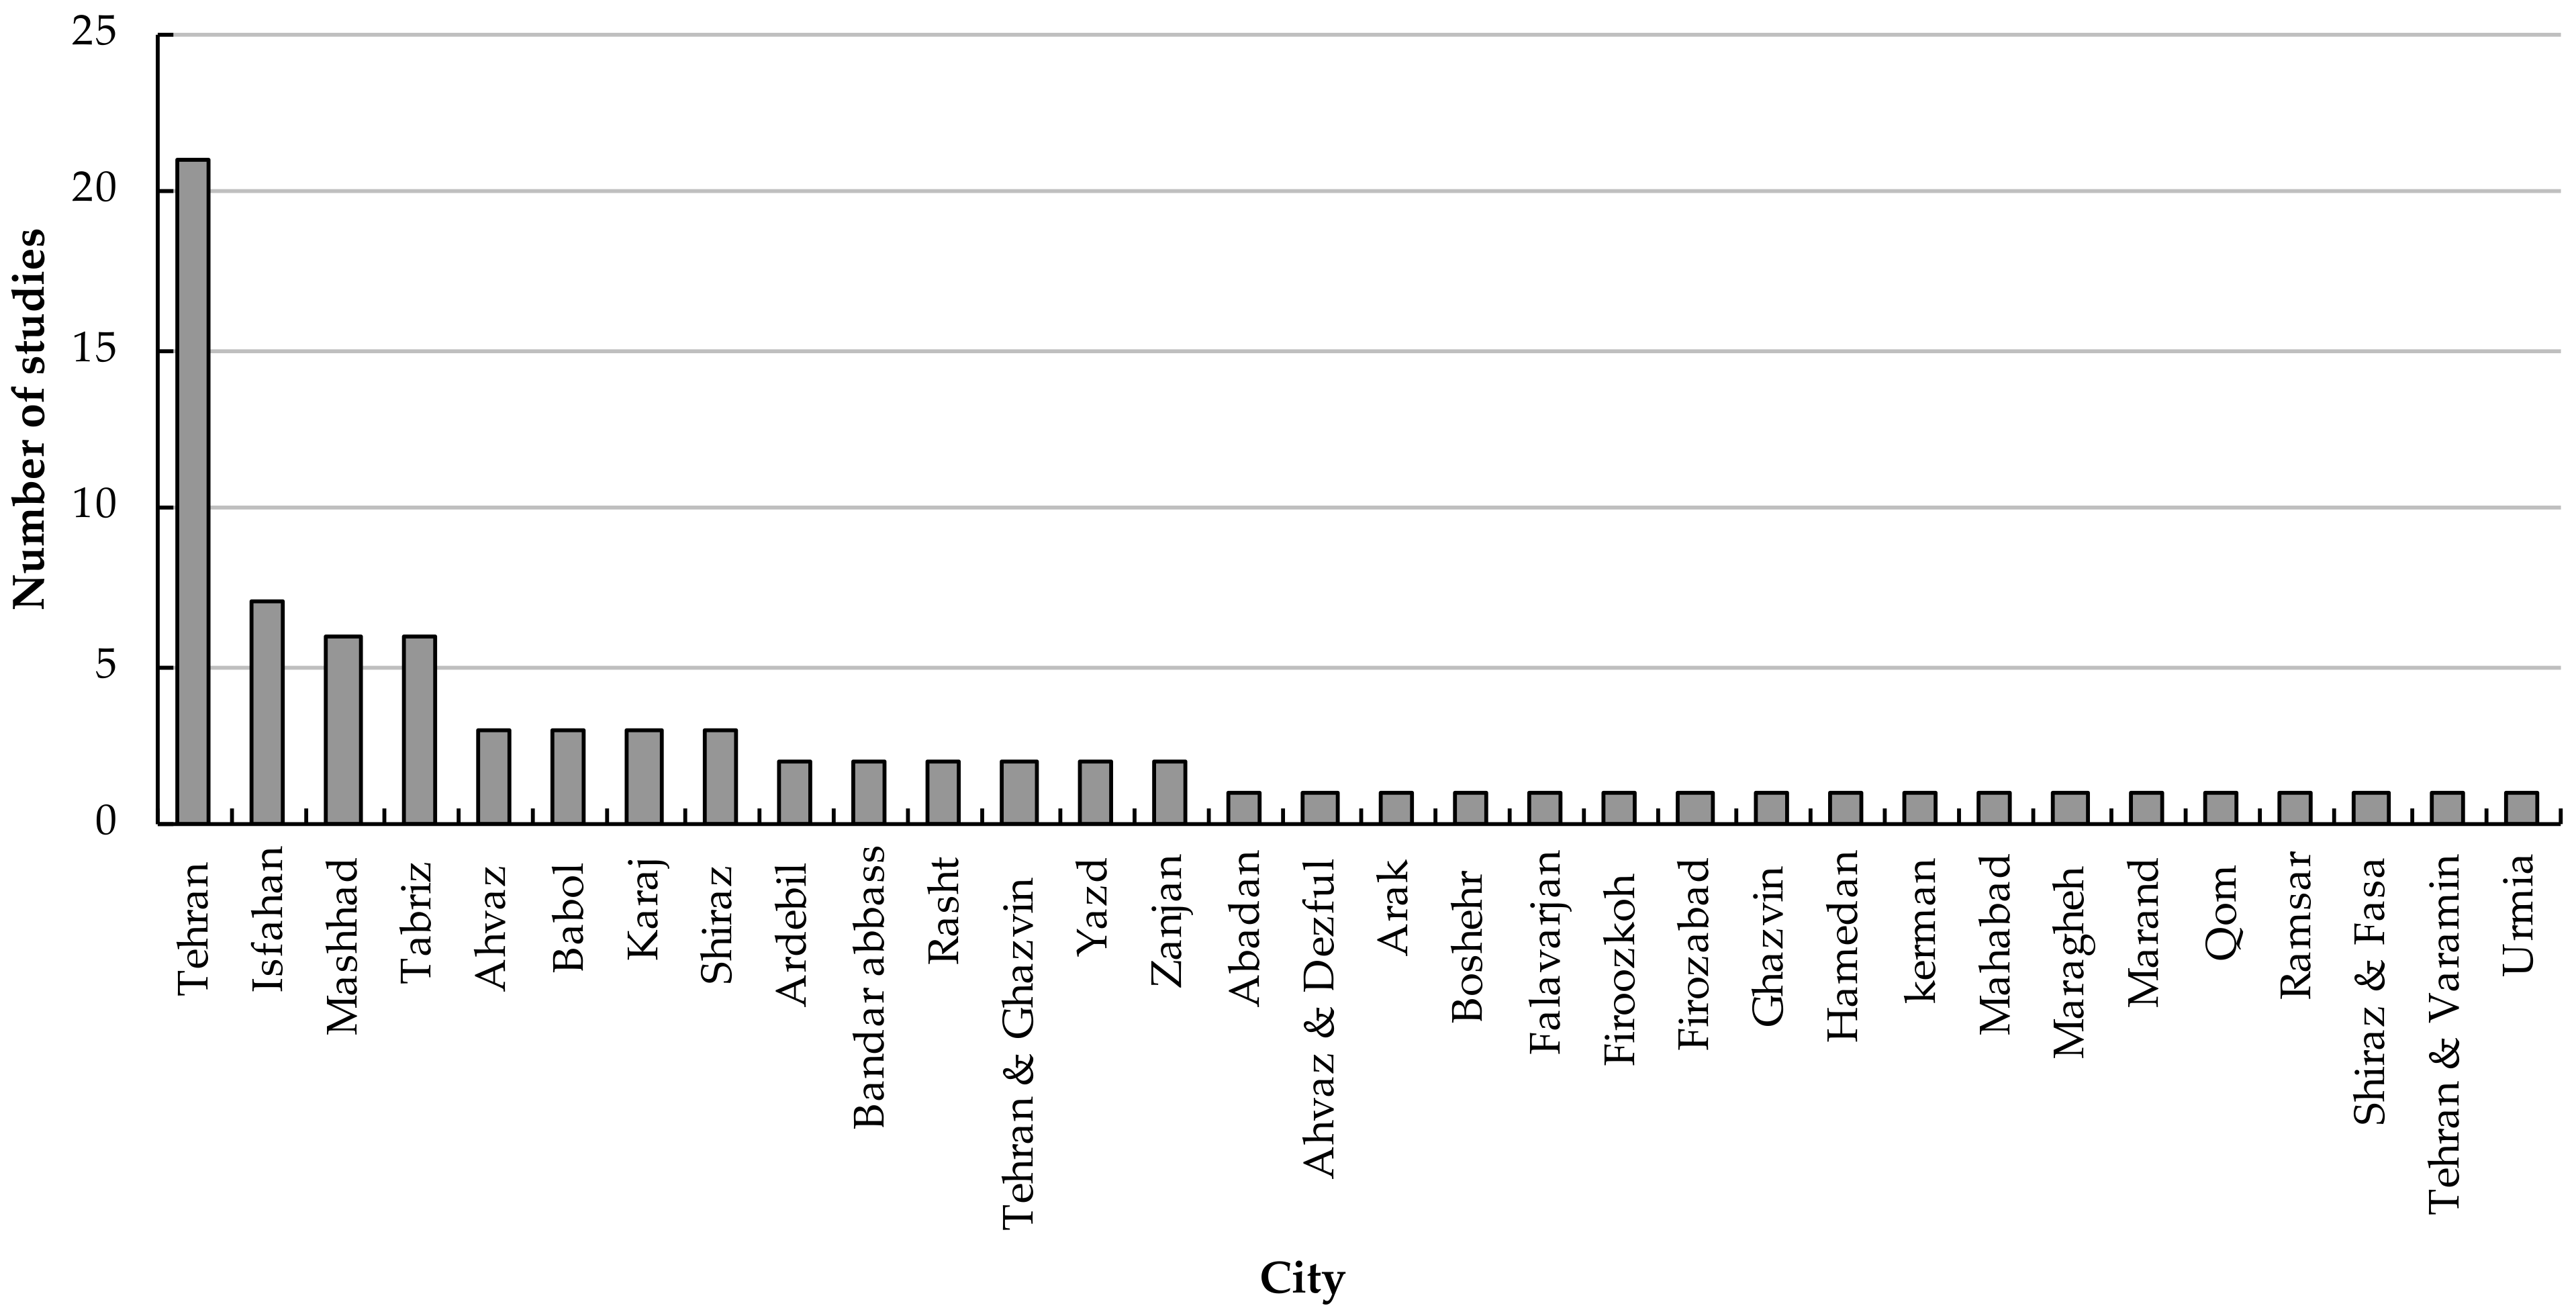
3.1. Spatial Scale
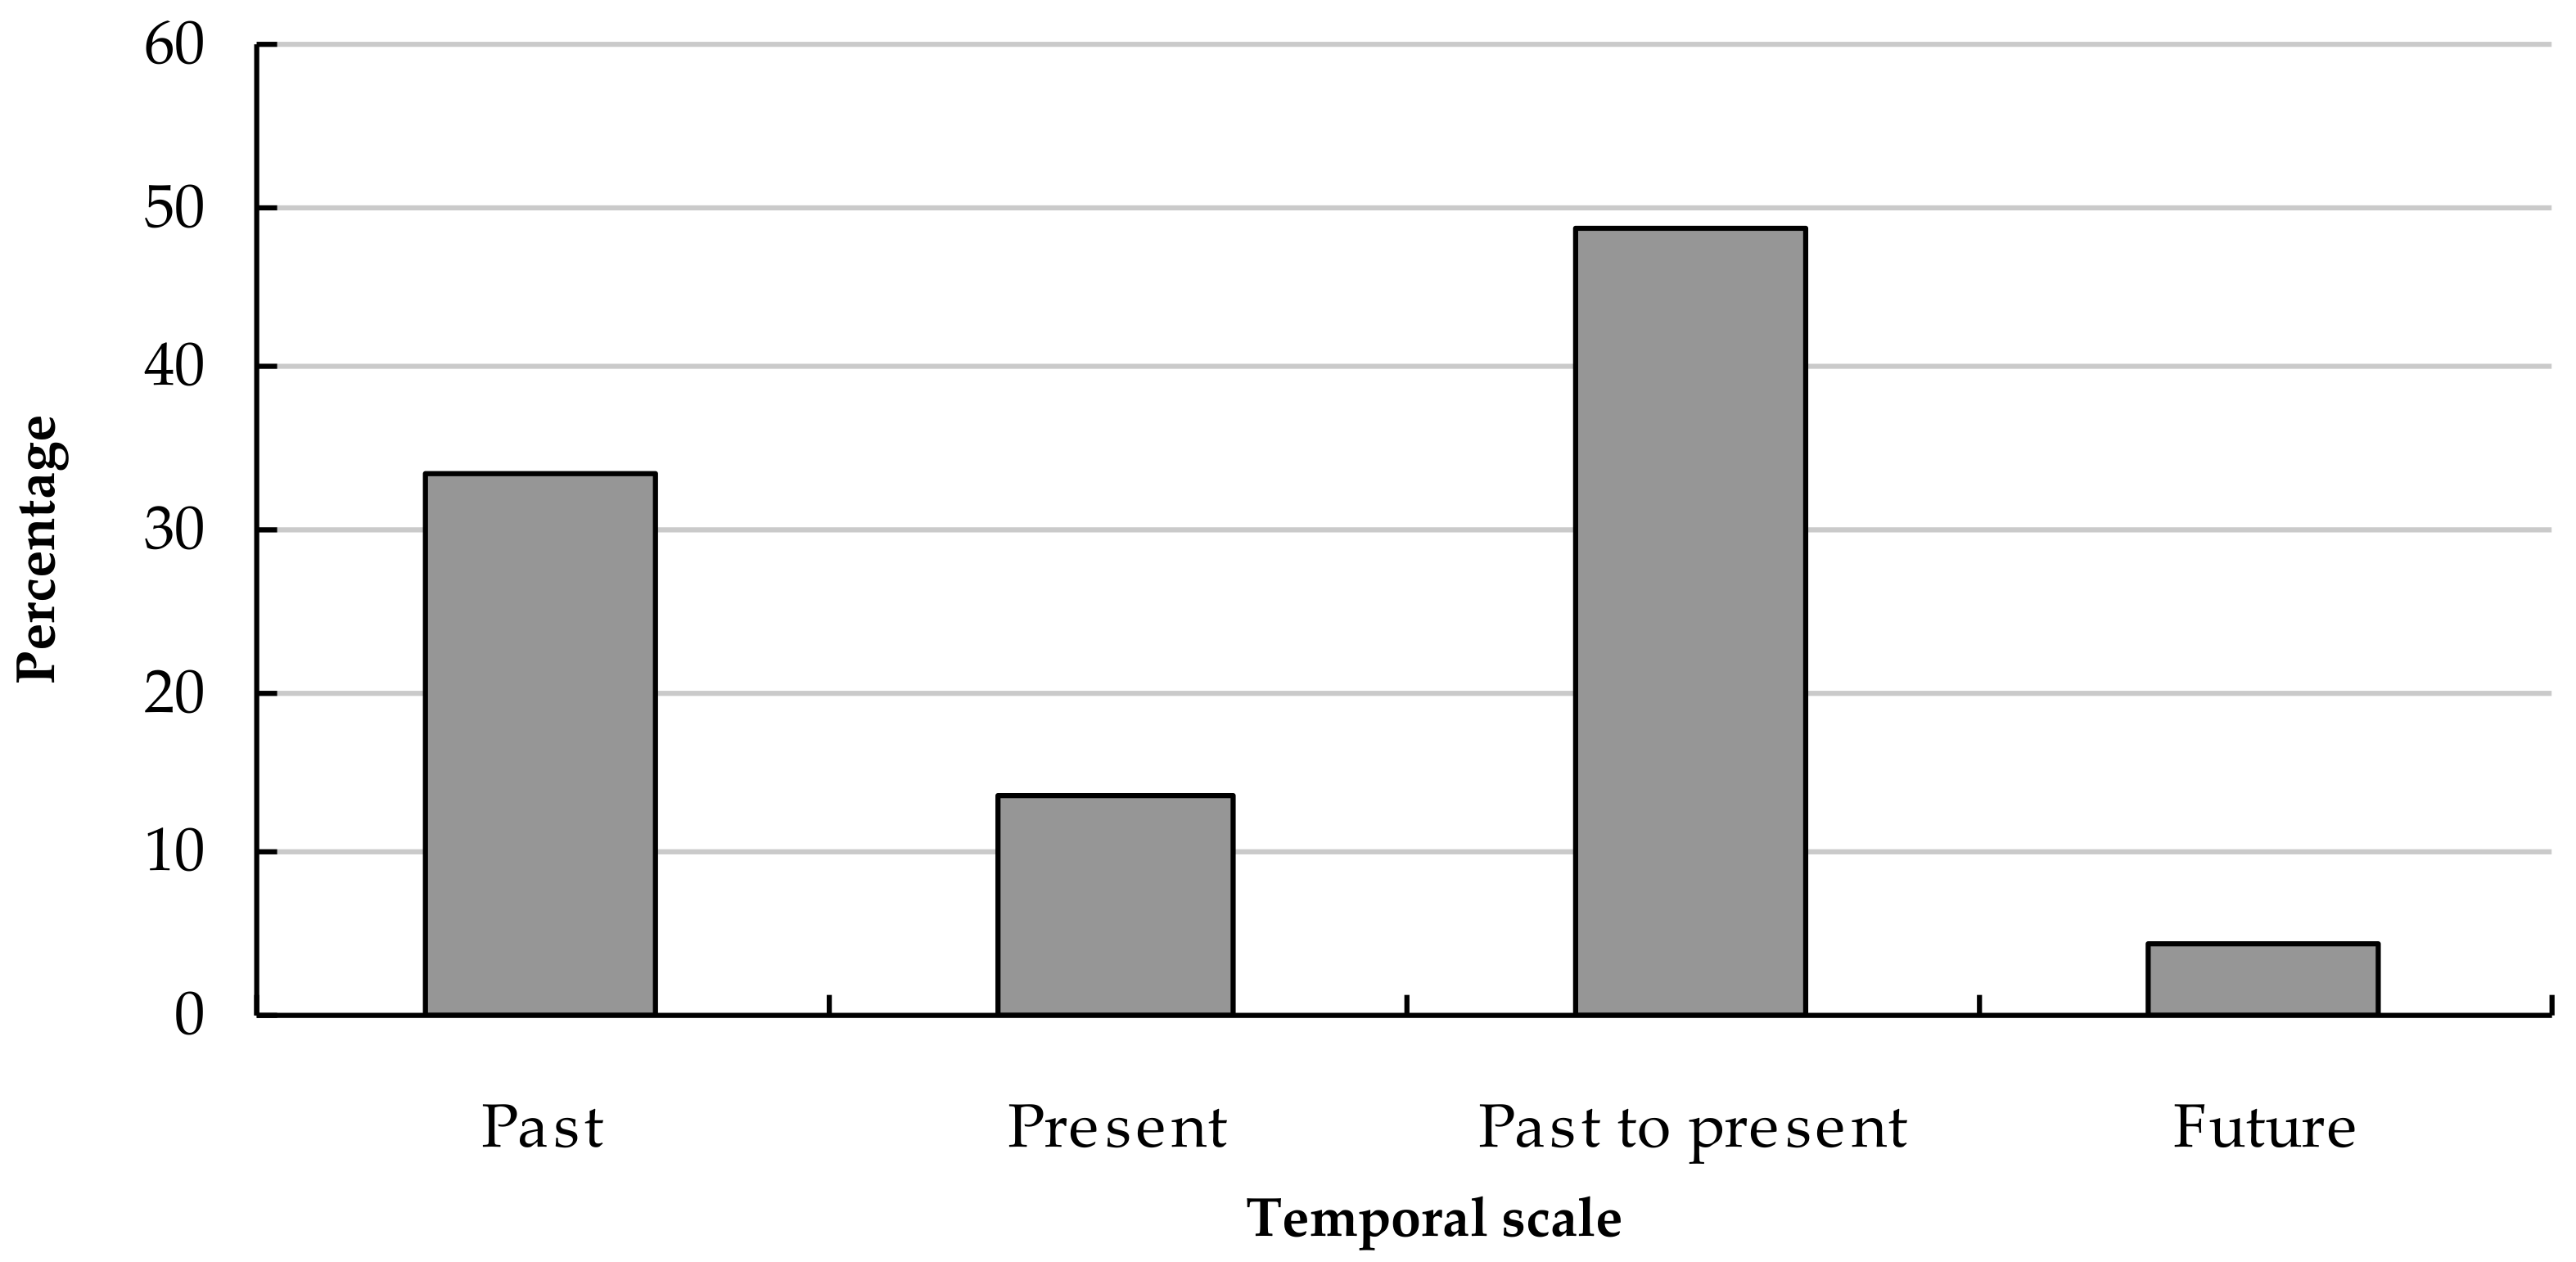
3.2. Temporal Scale
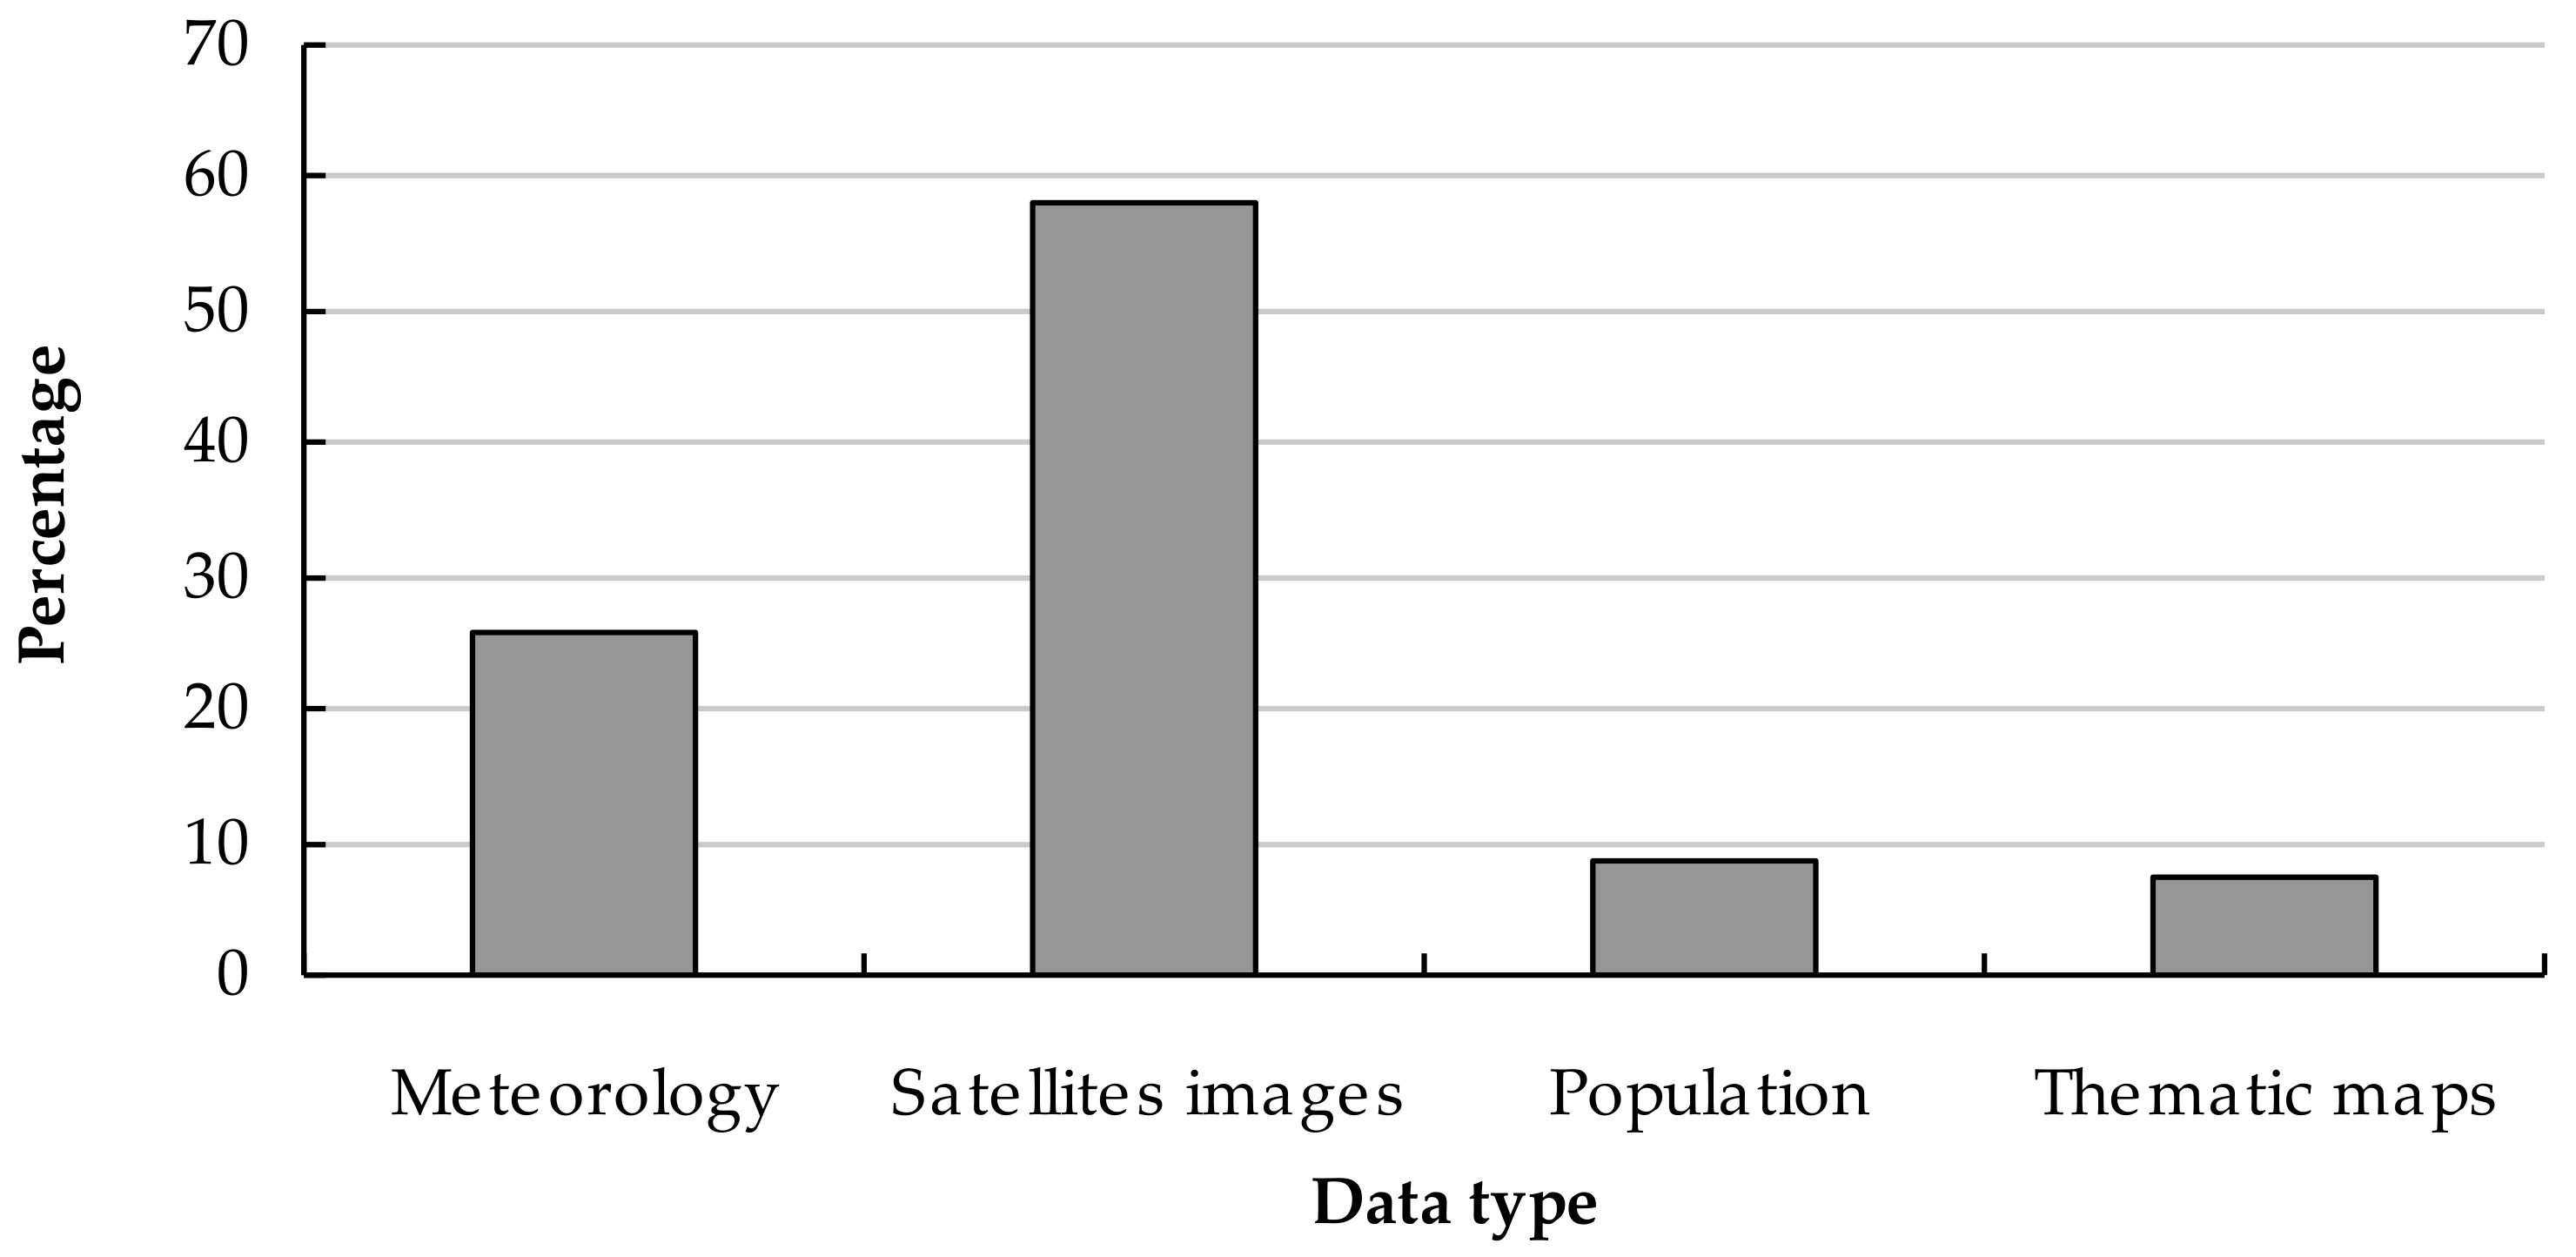
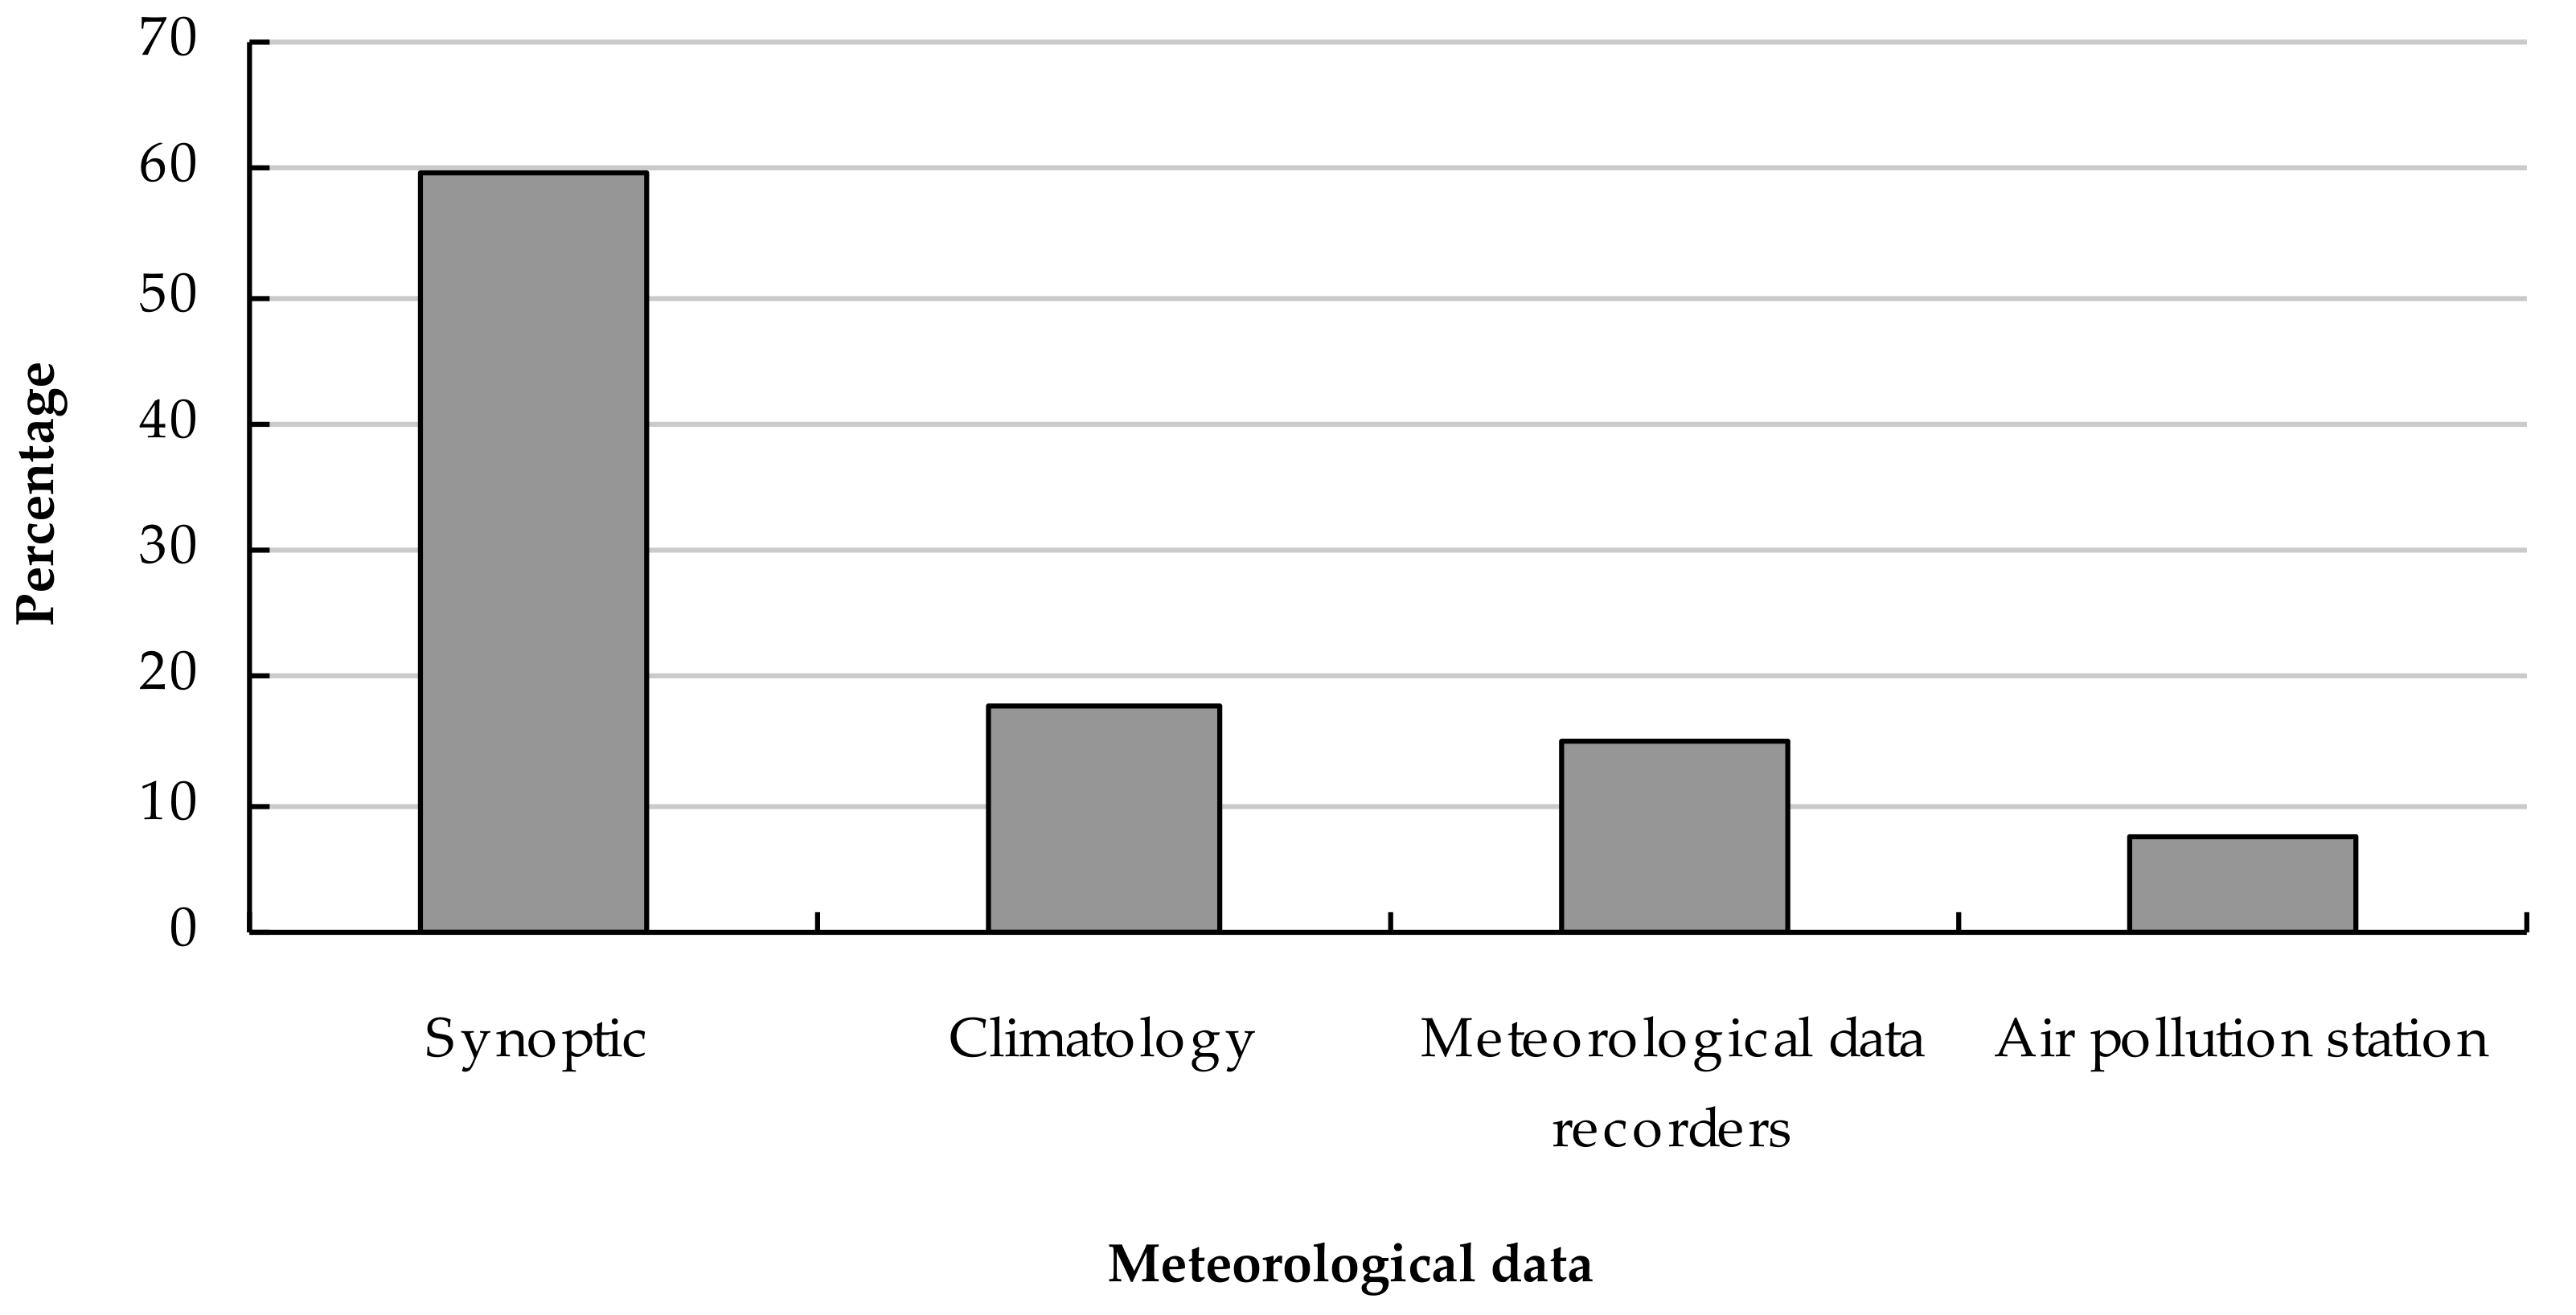
3.3. Data Type
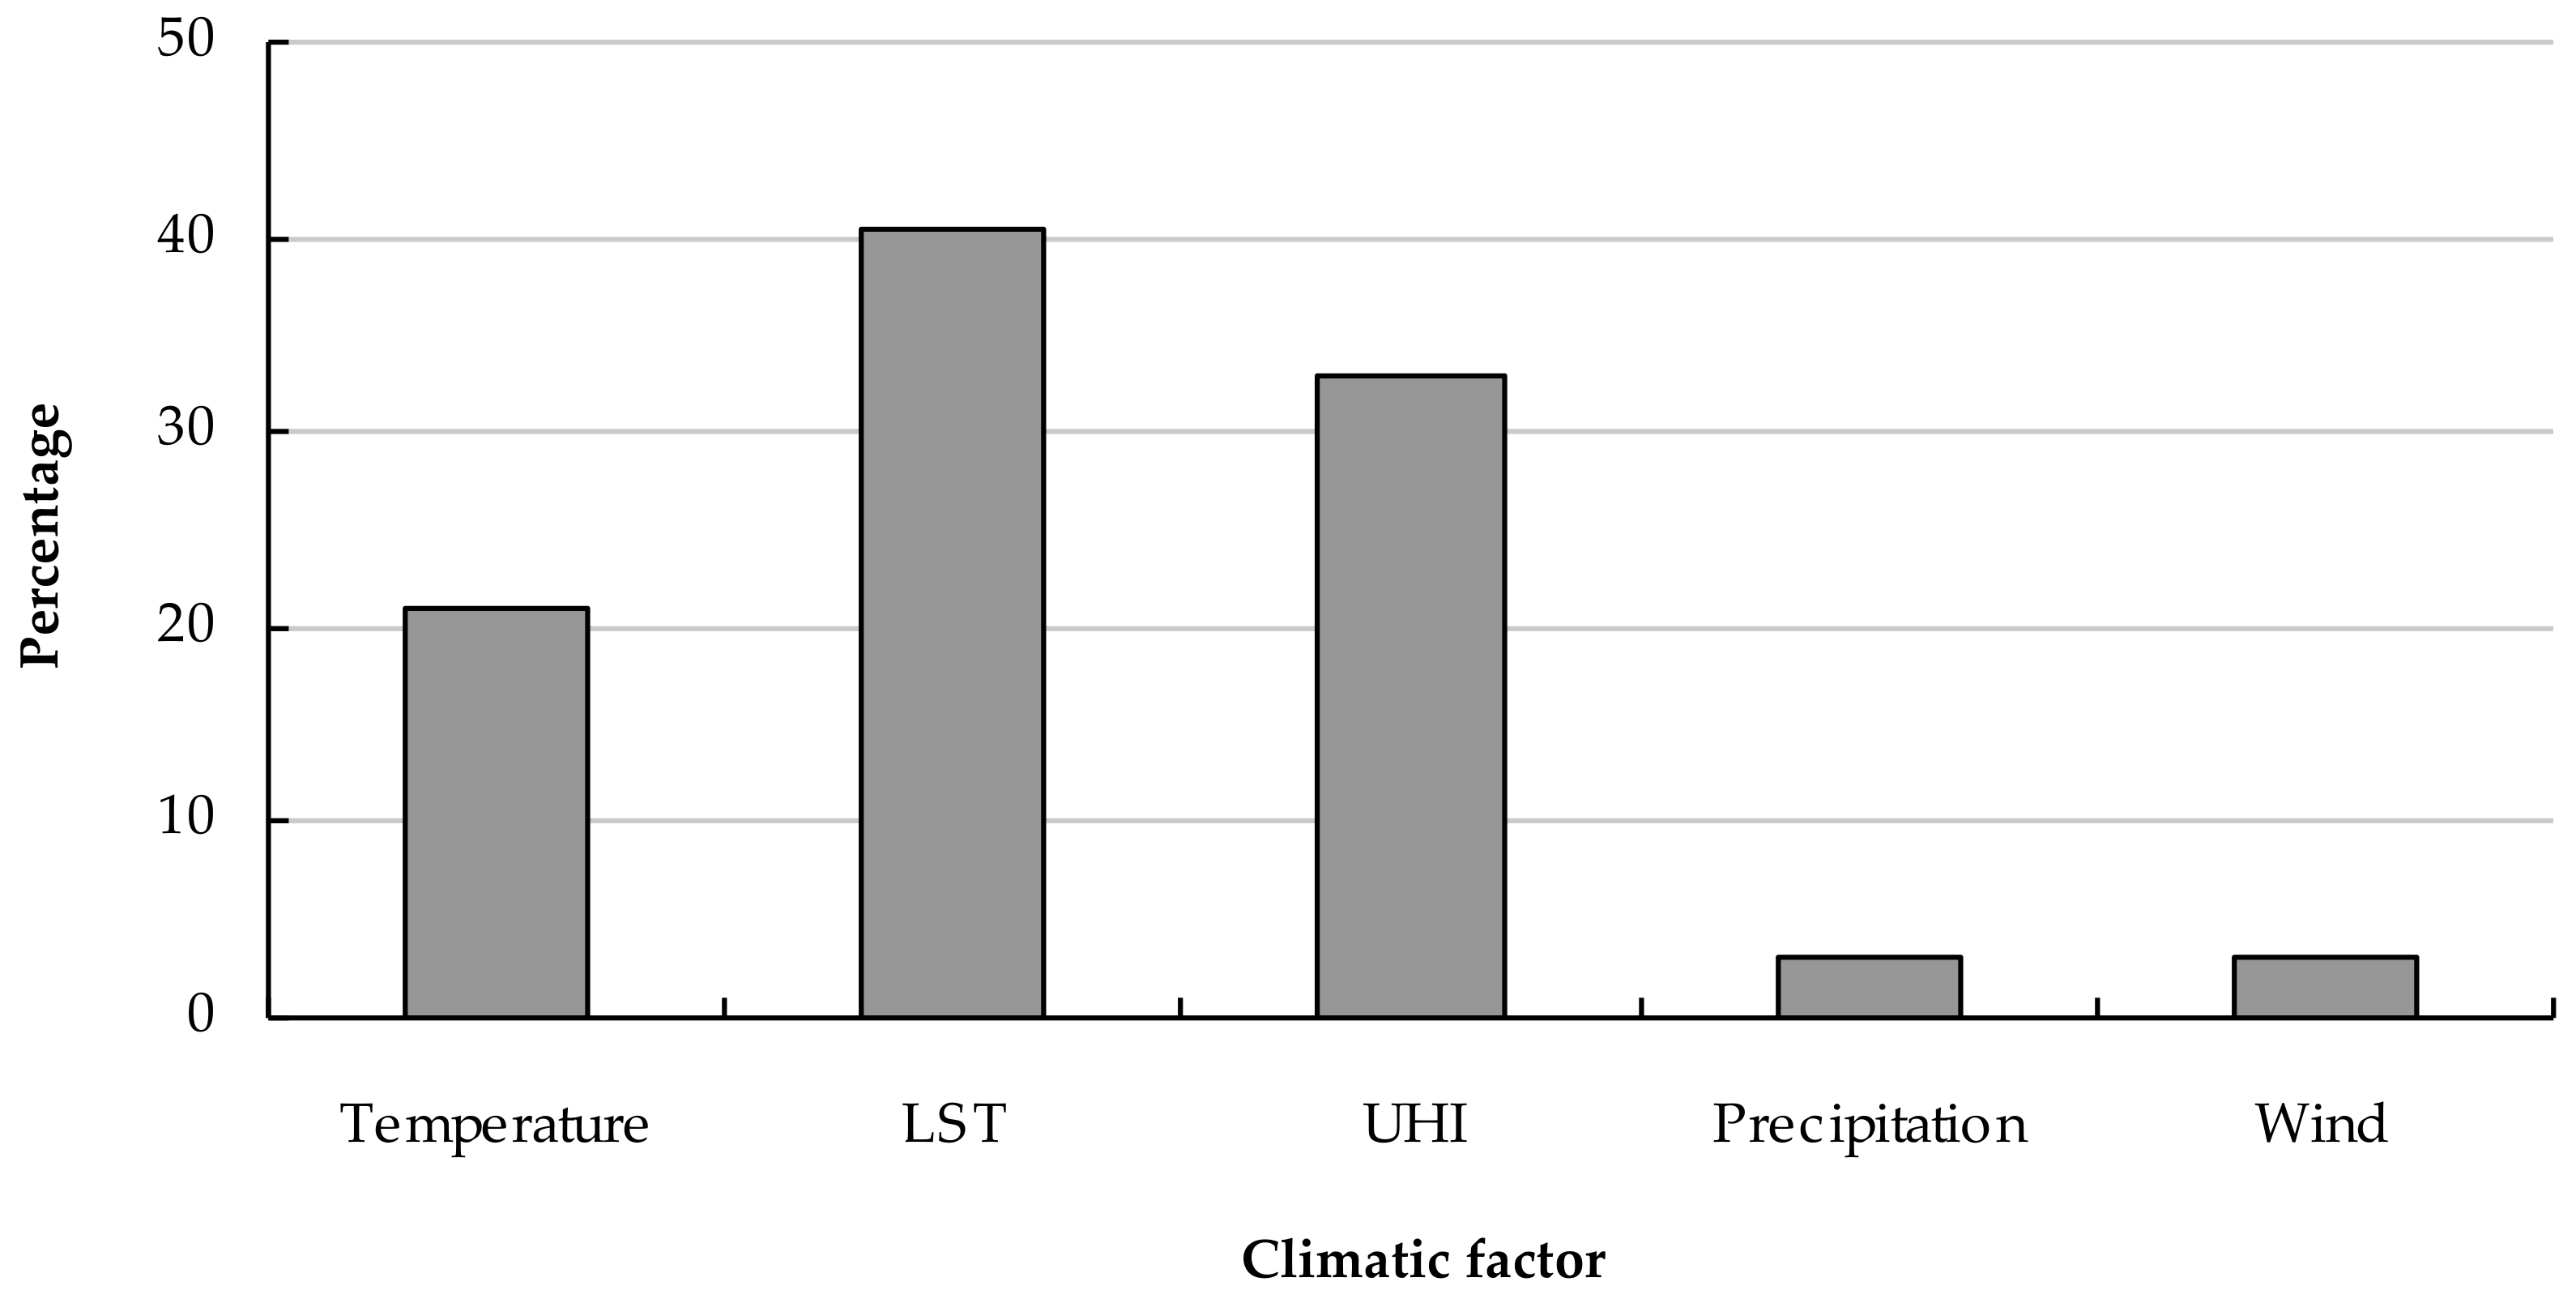
3.4. Climatic Factors
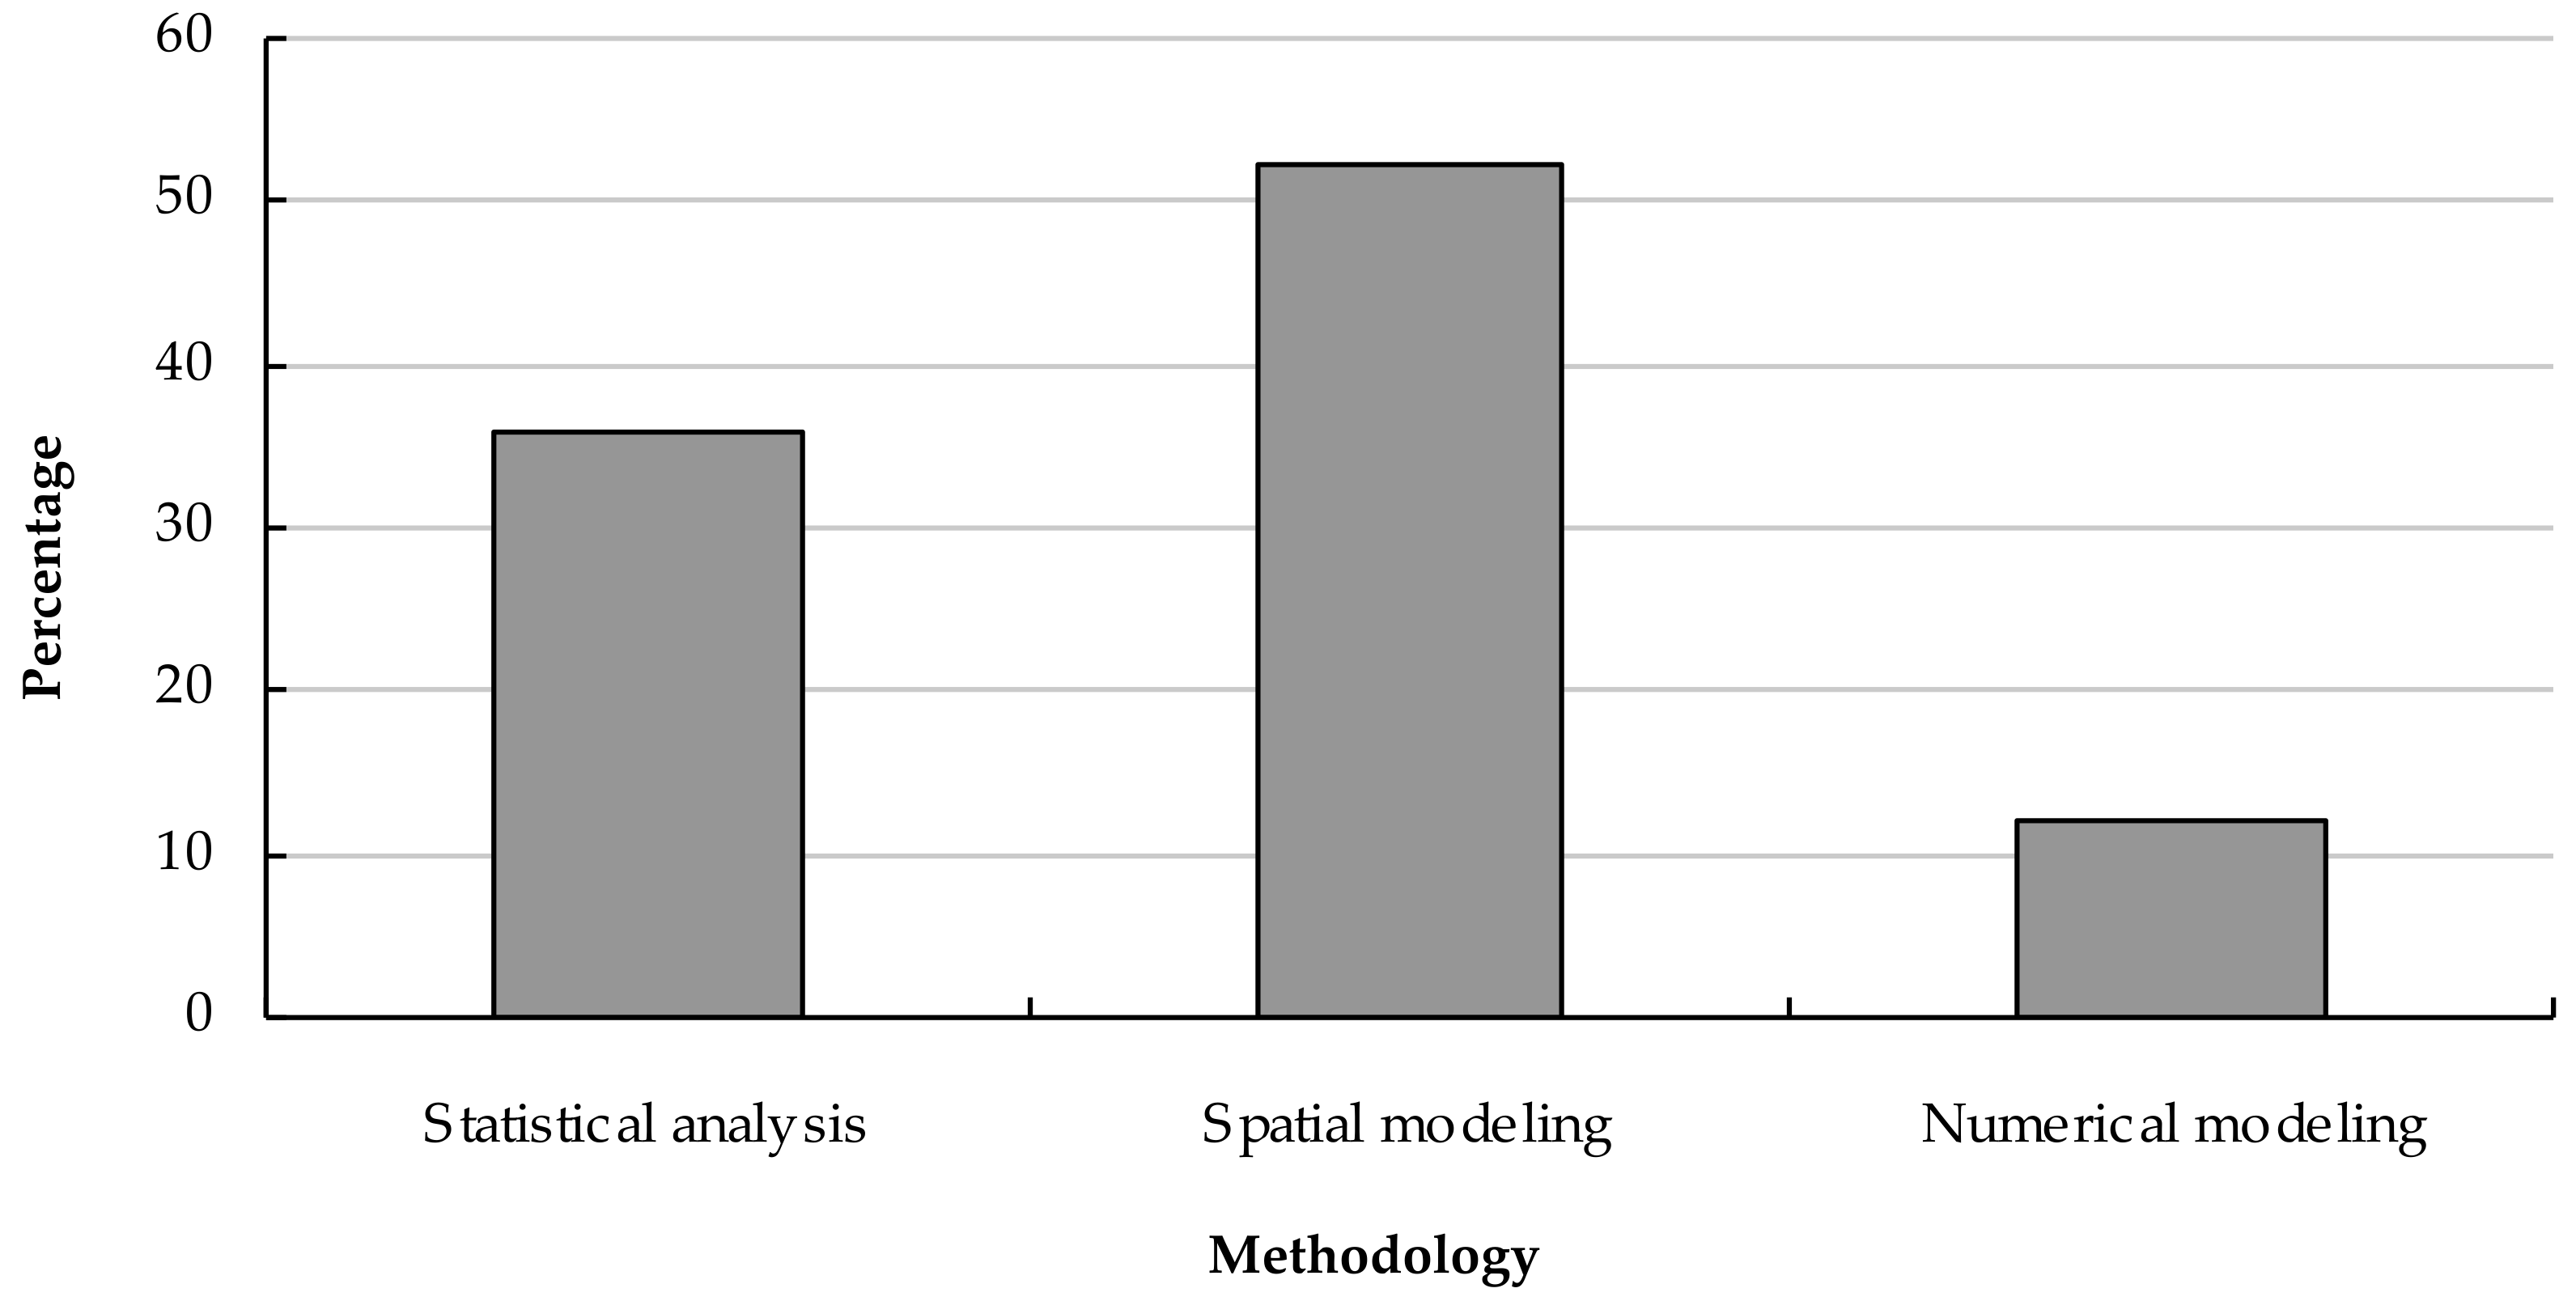
3.5. Methodology
3.5.1. Spatial Modeling
3.5.2. Statistical Analysis
3.5.3. Numerical Modeling
4. Discussion
Research Gap and Future Directions
5. Conclusions
Supplementary Materials
Author Contributions
Funding
Institutional Review Board Statement
Informed Consent Statement
Data Availability Statement
Acknowledgments
Conflicts of Interest
References
- United Nations. 2017. Available online: https://www.un.org/en/ (accessed on 17 December 2020).
- Chapman, S.; Watson, J.E.; Salazar, A.; Thatcher, M.; McAlpine, C.A. The Impact of Urbanization and Climate Change on Urban Temperatures: A Systematic Review. Landsc. Ecol. 2017, 32, 1921–1935. [Google Scholar] [CrossRef]
- Hidalgo, J.; Masson, V.; Baklanov, A.; Pigeon, G.; Gimeno, L. Advances in Urban Climate Modeling. Ann. N. Y. Acad. Sci. 2008, 1146, 354–374. [Google Scholar] [CrossRef]
- Wang, J.; Yan, Z.W. Urbanization-Related Warming in Local Temperature Records: A Review. Atmos. Ocean. Sci. Lett. 2016, 9, 129–138. [Google Scholar] [CrossRef] [Green Version]
- Baklanov, A.; Molina, L.; Gauss, M. Megacities, Air quality, and Climate. Atmos. Env. 2016, 126, 235–249. [Google Scholar] [CrossRef]
- Oke, T.R. Review of Urban Climatology; World Meteorological Organization: Geneva, Switzerland, 1979. [Google Scholar]
- Changnon, J.S.A. METROMEX: A Review and Summary; Springer: Berlin/Heidelberg, Germany, 2013. [Google Scholar]
- Landsberg, H.E. The Urban Climate; Academic Press: Cambridge, MA, USA, 1981. [Google Scholar]
- Taha, H. Urban Climates and Heat Islands: Albedo, Evapotranspiration, and Anthropogenic Heat. Energy Build. 1997, 25, 99–103. [Google Scholar] [CrossRef] [Green Version]
- Fernando, H.J.S.; Lee, S.M.; Anderson, J.; Princevac, M.; Pardyjak, E.; Grossman-Clarke, S. Urban Fluid Mechanics: Air Circulation and Contaminant Dispersion in Cities. Env. Fluid Mech. 2001, 1, 107–164. [Google Scholar] [CrossRef]
- Arnfield, A. Two Decades of Urban Climate Research: A Review of Turbulence, Exchanges of Energy and Water, and the Urban Heat Island. Int. Climatol. 2003, 23, 1–26. [Google Scholar] [CrossRef]
- Masson, V. Urban Surface Modeling and the Meso-Scale Impact of Cities. Theor. Appl. Climatol. 2006, 84, 35–45. [Google Scholar] [CrossRef]
- Grimmond, C.; Blackett, M.; Best, M.; Barlow, J.; Baik, J.; Belcher, S.E.; Bohnenstengel, S.; Calmet, I.; Dandou, A.; Fortuniak, K.; et al. The International Urban Energy Balance Models Comparison Project: First Results from Phase 1. J. Appl. Meteorol. Climatol. 2010, 49, 1268–1292. [Google Scholar] [CrossRef]
- Kanda, M. Progress in the Scale Modeling of Urban Climate: Review. Theor. Appl. Climatol. 2006, 84, 23–33. [Google Scholar] [CrossRef]
- Kanda, M. Progress in Urban Meteorology: A Review. J. Meteorol. Soc. Jpn. 2007, 85, 363–383. [Google Scholar] [CrossRef]
- Roth, M. Review of Urban Climate Research in (Sub)Tropical Regions. Int. J. Climatol. 2007, 27, 1859–1873. [Google Scholar] [CrossRef]
- Baklanov, A.; Korsholm, U.; Mahura, A.; Petersen, C.; Gross, A. Enviro-HIRLAM: On-Line Coupled Modelling of Urban Meteorology and Air Pollution. Adv. Sci. Res. 2008, 2, 41–46. [Google Scholar] [CrossRef]
- Grimmond, C.; Blackett, M.; Best, M.; Baik, J.; Belcher, S.E.; Beringer, J.; Bohnenstengel, S.; Calmet, I.; Coutts, A.; Dandou, A.; et al. Initial Results from Phase 2 of the International Urban Energy Balance Model Comparison. Int. J. Climatol. 2011, 31, 244–272. [Google Scholar] [CrossRef] [Green Version]
- Garuma, G.F. Review of Urban Surface Parameterizations for Numerical Climate Models. Urban Clim. 2018, 24, 830–851. [Google Scholar] [CrossRef]
- Statistics Center of Iran. 2017. Available online: https://www.amar.org.ir/ (accessed on 12 January 2019).
- Alijani, B. Climate Change and Its Signs in Iran; IRNA: Tehran, Iran, 2020. [Google Scholar]
- Nazari, M.; Chaichi, M.R.; Kamel, H.; Grismer, M.; Sadeghi, S.M.M. Evaluation of Estimation Methods for Monthly Reference Evapotranspiration in Arid Climates. Arid Ecosyst. 2020, 10, 329–336. [Google Scholar] [CrossRef]
- Oke, T. The Energetic Basis of the Urban Heat Island. Q. J. R. Meteorol. Soc. 1982, 108, 1–24. [Google Scholar] [CrossRef]
- Salamanca, F.; Georgescu, M.; Mahalov, A.; Moustaoui, M.; Wang, M.; Svoma, B. Assessing Summertime Urban Air Conditioning Consumption in a Semiarid Environment. Environ. Res. Lett. 2013, 8, 34022. [Google Scholar] [CrossRef] [Green Version]
- Alijani, B.; Toulabinejad, M.; Sayadi, F. Calculation of Heat Island Intensity Based on Urban Geometry (Case Study: District of Kucheh Bagh in Tabriz). J. Spat. Anal. Environ. Hazards 2017, 4, 99–112. [Google Scholar]
- Ismail, M.H.; Jin Aik, D.H.; Alias, M.A.; Muharam, F.M.; Zaki, P.H. Land Use/Land Cover (LULC) Changes in Cameron Highlands, Malaysia: Explore the Impact of the LULC Changes on Land Surface Temperature (LST) Using Remote Sensing. Clim. Impacts Sustain. Nat. Resour. Manag. 2021, 14, 279–301. [Google Scholar]
- Kumar, S.; Jain, K. A Multi-Temporal Landsat Data Analysis for Land-Use/Land-Cover Change in Haridwar Region using Remote Sensing Techniques. Procedia Comput. Sci. 2020, 171, 1184–1193. [Google Scholar] [CrossRef]
- Polydoros, A.; Mavrakou, T.; Cartalis, C. Quantifying the Trends in Land Surface Temperature and Surface Urban Heat Island Intensity in Mediterranean Cities in View of Smart Urbanization. Urban Sci. 2018, 2, 16. [Google Scholar] [CrossRef] [Green Version]
- Ebrahimi Heravi, B.; Rangzan, K.; Riahi Bakhtiari, H.R.; Taghizadeh, A. Determination of Urban Surface Temperature Using Landsat Images (Case Study: Karaj). J. RS GIS Nat. Resour. 2015, 6, 19–32. [Google Scholar]
- Zaidi, S.M.; Akbari, A.; Abu Samah, A.; Kong, N.S.; Gisen, A.; Isabella, J. Landsat-5 Time Series Analysis for Land Use/Land Cover Change Detection Using NDVI and Semi-Supervised Classification Techniques. Pol. J. Environ. Stud. 2017, 26, 2833–2840. [Google Scholar] [CrossRef]
- Mazidi, A.; Narangifard, M. The Effect of Urban Development and Land-Use Change on the Climatic Elements of Shiraz and Fasa. Appl. Res. Geogr. Sci. 2016, 16, 131–154. [Google Scholar]
- Sasanpour, F.; Ziaeian, P.; Bahadori, M. Investigation of Land Use/Land Cover Relationship and Tehran Urban Heat Island. Geography 2014, 39, 256–270. [Google Scholar]
- Aliabadi, K.; Dadashi Roudbari, A. The Role of Geographic Components on the Temperature Dispersion at the Urban Area Using Remote Sensing Techniques Case Study of Mashhad City. Geogr. Plan. Space 2017, 7, 131–142. [Google Scholar]
- Maroofnezhad, A. Effect of Urban Land Use in Creation Heat Islands Case Study: Ahwaz. Environ.-Based Territ. Plan. 2011, 4, 65–90. [Google Scholar]
- Karimi Firozjaei, M.; Kiavarz Moghaddam, M.; Alavipanah, S.K. Monitoring and Predicting Spatial-Temporal Changes Heat Island in Babol City due to Urban Sprawl and Land-Use Changes. Eng. J. Geospat. Inf. Tech. 2017, 5, 123–151. [Google Scholar] [CrossRef] [Green Version]
- Khosravi, Y.; Heidari, M.; Tavakoli, A.; Zamani, A. Analysis of the Relationship between Temporal Changes in Land Surface Temperature and Spatial Pattern of Land-Use Changes (Case Study: Zanjan City). Spat. Plan. 2017, 21, 119–144. [Google Scholar]
- Hashemi, M.; Alavi Panah, K.; Dinarvandi, M. Evaluation of Spatial Distribution of Surface Temperature in Urban Environment Using Thermal Remote Sensing. Environ. Sci. 2013, 39, 81–92. [Google Scholar]
- Feizizadeh, B.; Didehban, K.; Gholamnia, K. Extraction of Land Surface Temperature (LST) Based on Landsat Satellite Images and Split-Window Algorithm Study Area: Mahabad Catchment. Graph. Data. 2016, 25, 171–181. [Google Scholar]
- Valizadeh, K.; Gholamnia, K.; Einali, G.; Mousavi, M. Estimation of Surface Temperature and Extraction of Heat Islands Using Separate Window Algorithm and Multivariate Regression Analysis (Case Study: Zanjan City). Res. Urban Plan. 2018, 8, 35–50. [Google Scholar]
- Samiei, M.; Derakhshan, S.; Rahmani, S.; Hamedi Shahraki, N. Estimation of the Surface Temperature Using Landsat 8 Satellite Images in Firoozabad Urban Area. In Proceedings of the Second National Conference of Hydrology in IRAN, Shahrekord, Iran, 11 July 2017; pp. 1–8. [Google Scholar]
- Ahmadi, M.; Dadashiroudbari, A.; Ahmadi, H. Monitoring of the Night-Time Land Surface Temperature in Iran Based on Output of the MODIS. Geogr. Res. 2018, 33, 174–190. [Google Scholar] [CrossRef] [Green Version]
- Ebrahimi Heravi, B.; Rangzan, K.; Riahi Bakhtiari, H.R.; Taghizadeh, A. Determining the Most Suitable Method for Extracting Surface Temperature Using Landsat 8 Satellite Images in Karaj Metropolis. Iran. J. Remote Sens. GIS 2016, 8, 59–76. [Google Scholar]
- Hashemi Darehbadami, S.; Nouraeisefat, I.; Karami, S.; Nazari, S. Development Trend Analysis of Urban Heat Island Regarding Land Use/Cover Changes Using Time Series of Landsat Images. J. RS GIS Nat. Resour. 2015, 6, 15–28. [Google Scholar]
- Shakiba, A.; Firoozabadi, P.; Ashourloo, D.; Namdari, S. Analysis of Relationship between Land Use/Cover and Urban Heat Island, Using ETM+. Remote Sens. GIS 2009, 1, 39–56. [Google Scholar]
- Malekpour, P.; Taleai, M. Modeling of the Relationship between Land Use/Cover and Land Surface Temperature Using ASTER Datasets. J. Environ. Stud. 2011, 37, 29–42. [Google Scholar]
- Sadeghinia, A.; Alijani, B.; Zeaiean Firouzabadi, P.; Khledi, S. Application of Spatial Autocorrelation Techniques in Analyzing the Heat Island of Tehran. J. Geogr. Sci. 2012, 13, 67–90. [Google Scholar]
- Matkan, A.A.; Nohegar, A.; Mirbagheri, B.; Torkchin, N. Assessment Relations of Land Use in Heat Islands Using Time Series ASTER Sensor Data (Case Study: Bandar Abbas City). J. RS GIS Nat. Resour. 2015, 5, 1–14. [Google Scholar]
- Akhondzadeh, M.; Serajian, M. Application of Terra-Aster Satellite Images in Display of Heat Islands in Urban Areas. In Proceedings of the Second Conference on Dealing with Natural Disasters, Tehran, Iran, 13–14 February 2007; pp. 1–9. [Google Scholar]
- Rangzan, K.; Firoozi, M.; Taghizadeh, A.; Mehdizadeh, R. Investigation and Analysis of Land Use Role in the Formation of Heat Islands Using RS and GIS, Case Study: Ahvaz City. In Proceedings of the First National Seminar in Application of GIS in Economic, Social and Urban Planning, Tehran, Iran, 11 May 2011; pp. 1–12. [Google Scholar]
- Nazarian, A.; Ziaeian Firouzabadi, P.; Jangi, A.A. Studying the Role of Geographical Site Urban Morphology on the Air Pollution of Concentration Tehran Area with GIS and Rs. Geogr. Res. Q. 2008, 39, 17–30. [Google Scholar]
- Feizizadeh, B.; Blaschke, T. Examining Urban Heat Island Relations to Land Use and Air Pollution: Multiple Endmember Spectral Mixture Analysis for Thermal Remote Sensing. IEEE J. Sel. Top. Appl. Earth Observ. Remote Sens. 2013, 6, 1749–1756. [Google Scholar] [CrossRef]
- Amiri, R.; Weng, Q.; Alimohammadi, A.; Alavipanah, S.K. Spatial-Temporal Dynamics of Land Surface Temperature with Fractional Vegetation Cover and Land Use/Cover in the Tabriz Urban Area, Iran. Remote Sens. Environ. 2009, 113, 2606–2617. [Google Scholar] [CrossRef]
- Mousavi Baigi, M.; Ashraf, B.; Farid Hosseini, A.; Miyanaabadi, A. Studying the Heat Island in Mashhad City Using Satellite Images and Fractal Theory. Geogr. Environ. Hazards. 2012, 1, 35–49. [Google Scholar]
- Ahmadi, M.; Ashorlo, D.; Narangifard, M. Temporal-Spatial Variation and Thermal Patterns, Using ETM+ & TM Data for Shiraz city. Remote Sens. GIS 2013, 4, 55–67. [Google Scholar]
- Torkashvand, M.G. Detection of Heat Islands over Arak City based on Spatial Autocorrelation Analysis. Environ.-Based Territ. Plan. 2016, 9, 123–148. [Google Scholar]
- Feizizadeh, B.; Blaschke, T.; Nazmfar, H.; Akbari, E. Monitoring Land Surface Temperature Relationship to Land Use/Land Cover from Satellite Imagery in Maraqeh County, Iran. J. Env. Plan. Manag. 2012, 56, 1290–1305. [Google Scholar] [CrossRef]
- Pirnazar, M.; Roustaei, S.; Feizizadeh, B.; Raeisi Nafchi, F. Calculating the Earth Surface Temperature and Its Relation to Urban Land Cover Classes by Landsat 8 Data (Case Study: Tehran City). Geogr. Plan. Space Q. J. 2018, 29, 227–240. [Google Scholar]
- Amiri, R.; Alimohammadi, A.; Alavipanah, S.K. The Study of Spatiotemporal Variability of Temperature with Land Use/Cover in the Tabriz Urban Area Using Landsat TM and ETM+ Thermal and Reflective Data. J. Environ. Stud. 2007, 33, 107–120. [Google Scholar]
- Hasanloo, M.; Mashroteh, H. Investigation Relation of Land Use/Land Cover and Thermal Islands in Kerman Using Landsat-8 images. In Proceedings of the First Conference on Spatial Information Technology Engineering, Tehran, Iran, 21 December 2015; pp. 1–7. [Google Scholar]
- Khosroshahi, S.; Abdollah Abadi, S.; Omrani, K. Evaluating the spatial distribution of land surface temperatures in an urban environment by using thermal remote sensing (Case Study: Tabriz). In Proceedings of the First National Conference on Geography, Urban Planning, and Sustainable Development, Tehran, Iran, 5 November 2012; pp. 1–9. [Google Scholar]
- Maleki, M.; Mohammadzadeh, K.; Fathi, M. Evaluation of Spatial Distribution of Surface Temperature in Urban Environment Using Thermal Remote Sensing (Case Study: Marand City). In Proceedings of the 2nd International Congress of Earth Sciences and Urban Development, Tabriz, Iran, 12 May 2016; pp. 1–9. [Google Scholar]
- Asghari Saraskanroud, S.; Emami, H. Monitoring the Earth Surface Temperature and Relationship Land Use with Surface Temperature Using of OLI and TIRS Image. J. Geogr. Sci. 2019, 19, 195–215. [Google Scholar]
- Hosseini, Z.; Zarang, N.; Hajiloo, M.; Dadashi, M.; Tayba, A. Investigating the Relationship between Land Surface Temperature (LST) Changes and Vegetation with Landsat Images (Case Study: Isfahan). In Proceedings of the First National Conference on Application Advanced Models of Spatial Analysis, Remote Sensing and GIS in Landscaping, Yazd, Iran, 24 February 2015; pp. 1–13. [Google Scholar]
- Arvin, A. An Investigation of the Relationship between Urban Heat Island and Air Pollution in the City of Isfahan. Geogr. Env. Hazards 2018, 7, 115–129. [Google Scholar]
- Asgarian, A.; Amiri, B.J.; Sakieh, Y. Assessing the Effect of Green Cover Spatial Patterns on Urban Land Surface Temperature using Landscape Metrics Approach. Urban Ecosyst. 2015, 18, 209–222. [Google Scholar] [CrossRef]
- Afrakhteh, R.; Asgarian, A.; Sakieh, Y.; Soffianian, A. Evaluating the Strategy of an Integrated Urban-Rural Planning System and Analyzing Its Effects on Land Surface Temperature in a Rapidly Developing Region. Habitat Int. 2016, 56, 147–156. [Google Scholar] [CrossRef]
- Emadodin, I.; Taravat, A.; Rajaei, M.; Emadodin, I.; Taravat, A.; Rajaei, M. Effects of Urban Sprawl on Local Climate: A Case Study, North-Central Iran. Urban Clim. 2016, 17, 230–247. [Google Scholar] [CrossRef]
- Naserikia, M.; Asadi Shamsabadi, E.; Rafieian, M.; Leal Filho, W. The Urban Heat Island in an Urban Context: A Case Study of Mashhad, Iran. Int. J. Environ. Res. Public Health 2019, 16, 313. [Google Scholar] [CrossRef] [Green Version]
- Shirani-Bidabadi, N.; Nasrabadi, T.; Faryadi, S.; Larijani, A.; Shadman Roodposhti, M. Evaluating the Spatial Distribution and the Intensity of Urban Heat Island using Remote Sensing, Case Study of Isfahan City in Iran. Sustain. Cities Soc. 2019, 45, 686–692. [Google Scholar] [CrossRef]
- Shafizadeh-Moghadam, H.; Weng, Q.; Liu, H.; Valavi, R. Modeling the Spatial Variation of Urban Land Surface Temperature Concerning Environmental and Anthropogenic Factors: A Case Study of Tehran, Iran. GIS Sci. Remote Sens. 2020, 57, 483–496. [Google Scholar] [CrossRef]
- Bokaie, M.; Zarkesh, M.K.; Arasteh, P.D.; Hosseini, A. Assessment of Urban Heat Island based on the Relationship between Land Surface Temperature and Land Use/ Land Cover in Tehran. Sustain. Cities Soc. 2016, 23, 94–104. [Google Scholar] [CrossRef]
- Dashtakian, K.; Dehghani, M.A. Land Surface Temperature Analysis of the Desert Area with Vegetation and Urban Development using RS and GIS, Case Study: Yazd-Ashekezar Area. Pajouhesh Sazandegi 2008, 20, 169–179. [Google Scholar]
- Sodoudi, S.; Shahmohamadi, P.; Vollack, K.; Cubasch, U.; Che-Ani, A.I. Mitigating the Urban Heat Island Effect in Megacity Tehran. Adv. Meteorol. 2014, 2014, 547974. [Google Scholar] [CrossRef]
- Nikokar, M. Statistics and Its Application in Management (1). In Expansion of Basic Sciences; Gostaresh Olum Payeh Press: Tehran, Iran, 2019. [Google Scholar]
- Rahimi, J.; Bazrafshan, J.; Rahimi, A. Study of the Variations of Precipitation Days under Urban Microclimate in the City of Tehran. Phys. Geogr. Res. Q. 2011, 77, 93–108. [Google Scholar]
- Maleki, S.; Shojaeian, A.; Farahmand, G. Assessment of Temporal-Spatial Variability of Heat Islands in Relation to Urban Uses-Case Study: Urmia City. Q. J. Geogr. Inf. 2018, 27, 183–197. [Google Scholar]
- Ranjbar Saadatabadi, A.; Ali Akbari Beydokhti, A.A.; Sadeghi Hosseini, S.A. Effects of Urban Heat Island and Urbanization on Weather and Local Climate of Tehran Greater Area (Based on Mehrabad and Varamin Observations). J. Environ. Stud. 2006, 32, 59–68. [Google Scholar]
- Ramezani, B.; Dokhat Mohammad, S.M. The Recognition of Urban Heat Island in Rasht City. Res. Urban Plan. 2010, 1, 49–64. [Google Scholar]
- Yousefi, Y.; Kardel, F.; Rodeh, H.; Mohtasbi Khalatbari, M. Investigation of Heat Island Phenomenon and Its Effect on Day-to-Day Variability of Summer Temperature in Babol City. Nat. Geogr. Res. 2017, 49, 345–354. [Google Scholar]
- Akbari Beidakhti, A.; Ranjbar Saadatabadi, A. Studying the Climatic Impact of the Heat Islands in Tehran. In Proceedings of the Third Regional and the First National Conference on Climate Change, Isfahan, Iran, 17–21 April 2003; pp. 1–12. [Google Scholar]
- Mousavi-Baygi, M.; Ashraf, B.; Mianabadi, A. The Investigation of Tehran’s Heat Island by using the Surface Ozone and Temperature Data. Int. J. Appl. Environ. Sci. 2010, 5, 189–200. [Google Scholar]
- Karami, M.; Dadashi Roudbari, A.; Asadi, M. Investigating the Spatial Variation of Heat Islands of Tehran. Int. J. Sci. Res. Publ. 2016, 6, 2250–3153. [Google Scholar]
- Alijani, B.; Moayedfar, S.; Sabaeimehr, M. Investigation of Climatic Changes of Yazd City in Relation to Urban and Regional Development. Res. Urban Plan. 2011, 1, 41–58. [Google Scholar]
- Roshan, R.; Zanganeh, S.; Saurí, D.; Borna, R. Urban Sprawl and Climatic Changes in Tehran. Iran. J. Environ. Health Sci. Eng. 2010, 1, 7–15. [Google Scholar]
- Sarvari, H. A Survey of the Relationship between Urbanization and Climate Change for Major Cities in Iran. Arab. J. Geosci. 2019, 12, 131. [Google Scholar] [CrossRef]
- Fanni, Z.; Hosayni, Z.; Afsharmanesh, H.; Nezammahalleh, M.; Rastegar, A. The Effects of Urban Environment on Climate Changes, Case study: Tehran, Iran. Q. J. Tethys 2013, 1, 138–147. [Google Scholar]
- Bidokhti, A.; Shariepour, Z.; Sehatkashai, S. Some Resilient Aspects of Urban Areas to Air Pollution and Climate Change, Case Study: Tehran, Iran. Sci. Iran. 2016, 23, 1994–2004. [Google Scholar]
- Shokri Koochak, S.; Behnia, A.K. The Effect of the Heat Island Phenomenon on the Local Climate Change in Ahwaz Metropolis. J. Irrig. Sci. Eng. 2011, 34, 35–43. [Google Scholar]
- Talebi Kenari, H.; Nikpour, A.; Yousefi, Y. The Impact of Urban Growth on Temperature Variability in Babolsar. Res. Earth Sci. 2018, 9, 21–34. [Google Scholar]
- Ataei, H.; Fanaie, R. The Survey of Series Temperature Changes Trend at the City of Shiraz with Urban Development Planning. Res. Urban Plan. 2014, 4, 57–76. [Google Scholar]
- Moura, A.D.; Hastenrath, S. Climate Prediction for Brazil’s Nordeste: Performance of Empirical and Numerical Modeling Methods. J. Clim. 2004, 17, 2667–2672. [Google Scholar] [CrossRef]
- Ching, J.K.S. A Perspective on Urban Canopy Layer Modeling for the Weather, Climate, and Air Quality Applications. Urban Clim. 2013, 3, 13–39. [Google Scholar] [CrossRef]
- Barlow, J.F. Progress in Observing and Modeling the Urban Boundary Layer. Urban Clim. 2014, 10, 216–240. [Google Scholar] [CrossRef] [Green Version]
- Le Treut, H.; Somerville, R.; Cubasch, U.; Ding, Y.; Mauritzen, C.; Mokssit, A.; Peterson, T.; Prather, M. Historical Overview of climate change [chapter 1]. In Climate Change 2007: The Physical Science Basis; Solomon, S., Qin, D., Manning, M., Chen, Z., Marquis, M., Averyt, K.B., Tignor, M., Miller, H.L., Eds.; Contribution of Working Group I to the Fourth Assessment Report of the Intergovernmental Panel on Climate Change; Cambridge University Press: Cambridge, UK; New York, NY, USA, 2007; pp. 95–127. [Google Scholar]
- Roshan, G.; Oji, R.; Attia, S. Projecting the Impact of Climate Change on Design Recommendations for Residential Buildings in Iran. Build. Environ. 2019, 155, 283–297. [Google Scholar] [CrossRef] [Green Version]
- Delfanazari, S.; Saligheh, M.; Akbari, M. Changes in Wind Fields Affected by Urban Development, Case Study: Saadat Abad Neighborhood of Tehran. Res. Earth Sci. 2017, 8, 1–14. [Google Scholar]
- Ramyar, R.; Ramyar, A.; Kialashaki, Y.; Bryant, M.; Ramyar, H. Exploring Reconfiguration Scenarios of High-Density Urban Neighborhoods on Urban Temperature–The Case of Tehran (Iran). Urban For. Urban Green. 2019, 44, 126398. [Google Scholar] [CrossRef]
- Mansouri Daneshvar, M.R.; Rabbani, G.; Shirvani, S. Assessment of Urban Sprawl Effects on Regional Climate Change Using a Hybrid Model of Factor Analysis and Analytical Network Process in the Mashhad City, Iran. Environ. Syst. Res. 2019, 8, 23–40. [Google Scholar] [CrossRef]
- Ramyar, R.; Zarghami, E.; Bryant, M. Spatio-Temporal Planning of Urban Neighborhoods in the Context of Global Climate Change: Lessons for Urban form Design in Tehran, Iran. Sustain. Cities Soc. 2019, 51, 101554. [Google Scholar] [CrossRef]
- Oke, T.R. Canyon Geometry and the Nocturnal Urban Heat Island: Comparison of Scale Model and Field Observations. J. Climatol. 1981, 1, 237–254. [Google Scholar] [CrossRef]
- Abd El-Hamid, H.T.; Caiyong, W.; Hafiz, M.A.; Mustafa, E.K. Effects of Land Use/Land Cover and Climatic Change on the Ecosystem of North Ningxia, China. Arab. J. Geosci. 2020, 13, 1099. [Google Scholar] [CrossRef]
- Kafy, A.A.; Faisal, A.A.; Sikdar, S.; Hasan, M.; Rahman, M.; Khan, M.H.; Islam, R. Impact of LULC Changes on LST in Rajshahi District of Bangladesh: A Remote Sensing Approach. J. Geogr. Stud. 2020, 3, 11–23. [Google Scholar] [CrossRef]
- Kafy, A.A.; Naim, M.N.H.; Subramanyam, G.; Ahmed, N.U.; Al Rakib, A.; Kona, M.A.; Sattar, G.S. Cellular Automata Approach in Dynamic Modelling of Land Cover Changes using RapidEye Images in Dhaka, Bangladesh. Environ. Chall. 2021, 4, 100084. [Google Scholar] [CrossRef]
- Adimalla, N.; Chen, J.; Qian, H. Spatial Characteristics of Heavy Metal Contamination and Potential Human Health Risk Assessment of Urban Soils: A Case Study from an Urban Region of South India. Ecotoxicol. Environ. Saf. 2020, 194, 110406. [Google Scholar] [CrossRef]
- Hassan, M.M.; Nazem, M.N.I. Examination of Land Use/Land Cover Changes, Urban Growth Dynamics, and Environmental Sustainability in Chittagong City, Bangladesh. Environ. Dev. Sustain. 2016, 18, 697–716. [Google Scholar] [CrossRef]
- McCarthy, M.P.; Best, M.J.; Betts, R.A. Climate Change in Cities due to Global Warming and Urban Effects. Geophys. Res. Lett. 2010, 37, L09705. [Google Scholar] [CrossRef] [Green Version]
- Marshall, J.D.; McKone, T.E.; Deakin, E.; Nazaroff, W.W. Inhalation of Motor Vehicle Emissions: Effects of Urban Population and Land Area. Atmos. Environ. 2005, 39, 283–295. [Google Scholar] [CrossRef] [Green Version]
- Heshmatol Vaezin, S.M.; Moftakhar Juybari, M.; Daei, A.; Avatefi Hemmat, M.; Shirvany, A.; Tallis, M.J.; Hirabayashi, S.; Moeinaddini, M.; Hamidian, A.H.; Sadeghi, S.M.M.; et al. The Effectiveness of Urban Trees in Reducing Airborne Particulate Matter by Dry Deposition in Tehran, Iran. Environ. Monit. Assess. 2021, 193, 842. [Google Scholar] [CrossRef] [PubMed]
- Esfandeh, S.; Danehkar, A.; Salmanmahiny, A. Simulation and Prediction of Urban Growth Pattern Until 2050 Using SLEUTH-3R Model (Case Study: Coastal Area of Parsian City). Environ. Sci. 2021, 47, 53–72. [Google Scholar]
- Dewan, A.M.; Yamaguchi, Y. Using Remote Sensing and GIS to Detect and Monitor Land Use and Land Cover Change in Dhaka Metropolitan of Bangladesh during 1960–2005. Environ. Monit. Assess. 2009, 150, 237–249. [Google Scholar] [CrossRef] [PubMed]
- Nilufar, F. Urban Morphology of Dhaka City: Spatial Dynamics of Growing City and the Urban Core. In Proceedings of the International Seminar Proceedings on the Celebration of 400 Years of the Capital Dhaka, Asiatic Society, Dhaka, Bangladesh, 17–19 February 2010; pp. 1–8. [Google Scholar]
- Yan, Z.; Wang, J.; Xia, J.; Feng, J. Review of Recent Studies of the Climatic Effects of Urbanization in China. Adv. Clim. Change Res. 2016, 7, 154–168. [Google Scholar] [CrossRef]
- Weng, Q. A Remote Sensing-GIS Evaluation of Urban Expansion and Its Impact on Surface Temperature in the Zhujiang Delta, China. Int. J. Remote Sens. 2001, 22, 1999–2014. [Google Scholar]
- Taubenbock, H.; Wiesner, M.; Felbier, A.; Marconcini, M.; Dech, T.E. New Dimensions of Urban Landscapes: The Spatio-Temporal Evolution from a Polynuclei Area to a Mega-Region based on Remote Sensing Data. Appl. Geogr. 2014, 47, 137–153. [Google Scholar] [CrossRef]
- Bose, A.; Chowdhury, I.R. Monitoring and Modeling of Spatio-Temporal Urban Expansion and Land-Use/Land-Cover Change using Markov Chain Model: A Case Study in Siliguri Metropolitan Area, West Bengal, India. Model. Earth Syst. Environ. 2020, 6, 2235–2249. [Google Scholar] [CrossRef]
- Akbar, T.A.; Hassan, Q.K.; Ishaq, S.; Batool, M.; Butt, H.J.; Jabbar, H. Investigative Spatial Distribution and Modelling of Existing and Future Urban Land Changes and Its Impact on Urbanization and Economy. Remote Sens. 2019, 11, 105. [Google Scholar] [CrossRef] [Green Version]
- Fitria, R.; Kim, D.; Baik, J.; Choi, M. Impact of Biophysical Mechanisms on Urban Heat Island Associated with Climate Variation and Urban Morphology. Sci. Rep. 2019, 9, 19503. [Google Scholar] [CrossRef] [PubMed]
- Wang, R.; Hou, H.; Murayama, Y.; Derdouri, A. Spatiotemporal Analysis of Land Use/Cover Patterns and their Relationship with Land Surface Temperature in Nanjing, China. Remote Sens. 2020, 12, 440. [Google Scholar] [CrossRef] [Green Version]
- Kamran, K.V.; Pirnazar, M.; Bansouleh, V.F. Land Surface Temperature Retrieval from Landsat 8 TIRS: Comparison Between Split Window Algorithm and SEBAL Method. In Proceedings of the Third International Conference on Remote Sensing and Geoinformation of the Environment, Paphos, Cyprus, 16–19 March 2015; pp. 9535–9553. [Google Scholar]
- Karger, D.N.; Conrad, O.; Böhner, J.; Kawohl, T.; Kreft, H.; Soria-Auza, R.W.; Kessler, M. Climatologies at High Resolution for the Earth’s Land Surface Areas. Sci. Data 2017, 4, 120. [Google Scholar] [CrossRef] [PubMed] [Green Version]
- Wang, X.; Kang, Q.; Chen, X.; Fu, Q.; Wang, P. A Temperature-Domain SEBAL Model Based on a Wind Speed-Independent Theoretical Trapezoidal Space between Fractional Vegetation Coverage and Land Surface Temperature. IEEE Geosci. Remote Sens. Lett. 2020, 18, 756–760. [Google Scholar] [CrossRef]
- Sultana, N.; Rahman, H.; Sharifee, M.N.H.; Faisal, B.R.; Ahmed, M.T. Study on the Effects of Landcover Changes on Surface Albedo and Surface Temperature in Bangladesh Using Remote Sensing and GIS. Int. J. Environ. Geoinformatics 2019, 6, 277–287. [Google Scholar] [CrossRef]
- Yagoub, M.M.; Al Bizreh, A.A. Prediction of Land Cover Change using Markov and Cellular Automata Models: Case of Al-Ain, UAE, 1992-2030. J. Indian Soc. Remote Sens. 2014, 42, 665–671. [Google Scholar] [CrossRef]
- Wang, S.W.; Munkhnasan, L.; Lee, W.K. Land Use and Land Cover Change Detection and Prediction in Bhutan’s High Altitude City of Thimphu, Using Cellular Automata and Markov Chain. Environ. Chall. 2021, 2, 100017. [Google Scholar] [CrossRef]
- Munthali, M.G.; Mustak, S.; Adeola, A.; Botai, J.; Singh, S.K.; Davis, N. Modelling Land Use and Land Cover Dynamics of Dedza District of Malawi using Hybrid Cellular Automata and Markov Model. Remote Sens. Applic. Soc. Environ. 2020, 17, 100276. [Google Scholar] [CrossRef]
- Girma, R.; Fürst, C.; Moges, A. Land Use Land Cover Change Modeling by Integrating Artificial-Neural-Network with Cellular Automata-Markov Chain Model in Gidabo River Basin, Main Ethiopian Rift. Environ. Chall. 2021, 6, 100419. [Google Scholar] [CrossRef]
- Guan, D.; Li, H.; Inohae, T.; Su, W.; Nagaie, T.; Hokao, K. Modeling Urban Land Use Change by the Integration of Cellular Automaton and Markov Model. Ecol. Model. 2011, 222, 3761–3772. [Google Scholar] [CrossRef]
- Rendana, M.; Rahim, S.A.; Idris, W.M.R.; Lihan, T.; Rahman, Z.A. CA-Markov for Predicting Land Use Changes in Tropical Catchment Area: A Case Study in Cameron Highland, Malaysia. J. Appl. Sci. 2015, 15, 689–695. [Google Scholar] [CrossRef] [Green Version]
- Mas, J.F.; Kolb, M.; Paegelow, M.; Olmedo, M.T.C.; Houet, T. Inductive Pattern-Based Land Use/Cover Change Models: A Comparison of Four Software Packages. Environ. Model. Softw. 2014, 51, 94–111. [Google Scholar] [CrossRef] [Green Version]
- Najafi, A. Techniques for Classifying Images in Remote Sensing; GIRS: Tehran, Iran, 2016. [Google Scholar]
- Ma, L.; Liu, Y.; Zhang, X.; Ye, Y.; Yin, G.; Johnson, B.A. Deep Learning in Remote Sensing Applications: A Meta-Analysis and Review. ISPRS J. Photogramm. Remote Sens. 2019, 152, 166–177. [Google Scholar] [CrossRef]
- Shih, H.C.; Stow, D.A.; Tsai, Y.H. Guidance on and Comparison of Machine Learning Classifiers for Landsat-based Land Cover and Land Use Mapping. Int. J. Remote Sens. 2019, 40, 1248–1274. [Google Scholar] [CrossRef]
- Talukdar, S.; Singha, P.; Mahato, S.; Pal, S.; Liou, Y.A.; Rahman, A. Land-Use Land-Cover Classification by Machine Learning Classifiers for Satellite Observations—A Review. Remote Sens. 2020, 12, 1135. [Google Scholar] [CrossRef] [Green Version]
- Maxwell, A.E.; Warner, T.A.; Fang, F. Implementation of Machine-Learning Classification in Remote Sensing: An Applied Review. Int. J. Remote Sens. 2018, 39, 2784–2817. [Google Scholar] [CrossRef] [Green Version]
- Somvanshi, S.S.; Bhalla, O.; Kunwar, P.; Singh, M.; Singh, P. Monitoring Spatial LULC Changes and Its Growth Prediction based on Statistical Models and Earth Observation Datasets of Gautam Budh Nagar, Uttar Pradesh, India. Environ. Dev. Sustain. 2020, 22, 1073–1091. [Google Scholar] [CrossRef]
- Mondal, M.S.; Sharma, N.; Garg, P.; Kappas, M. Statistical Independence Test and Validation of CA Markov Land Use Land Cover (LULC) Prediction Results. Egypt. J. Remote Sens. Space Sci. 2016, 19, 259–272. [Google Scholar] [CrossRef] [Green Version]
- Tian, X.; Wenbin, W.; Qingbo, Z.; Wenxia, T.; Verburg, P.; Peng, Y.; Liming, Y. Modeling the Spatio-Temporal Changes in Land Uses and Its Impacts on Ecosystem Services in Northeast China Over 2000–2050. J. Geogr. Sci. 2018, 28, 1611–1625. [Google Scholar]
- Sobhani, P.; Esmaeilzadeh, H.; Barghjelveh, S.; Sadeghi, S.M.M.; Marcu, M.V. Habitat Integrity in Protected Areas Threatened by LULC Changes and Fragmentation: A Case Study in Tehran Province, Iran. Land 2022, 11, 6. [Google Scholar] [CrossRef]

| Validation Methods | Supervised Algorithm Methods | Classification Methods | Sensor Name | Satellite | Purpose | Reference |
|---|---|---|---|---|---|---|
| Error matrix | MLH | Supervised | TM | Landsat | LST, land use | [31] |
| Kappa coefficient, metrological data | MLH | Supervised | ETM+ | Landsat | LST, UHI, land use/land cover | [32] |
| Metrological data | - | - | TIRS, OLI | Landsat 8 | LST | [33] |
| Metrological data, error matrix | MLH | Supervised | ETM+ | Landsat 7 | Land use/land cover, UHI | [34] |
| Topographic maps, land use, metrological data, error matrix | MLH | Supervised | TM, ETM+ | Landsat 5, 7, 8 | LST, UHI, land use | [35] |
| Metrological data | - | - | TM, OLI - TIRS | Landsat 5, 8 | LST | [36] |
| Ground observations | - | - | ETM+ | Landsat 7 | LST | [37] |
| Metrological data | - | - | OLI - TIRS | Landsat 8 | LST | [38] |
| Metrological data | - | - | OLI, ASTER | Landsat 8, Terra | LST, Dem, slope, and aspect maps | [39] |
| Metrological data | - | - | - | Landsat 8 | LST | [40] |
| Metrological data | - | - | MODIS | Terra, Aqua | LST | [41] |
| Metrological data, IKONOS images | - | - | ETM+ | Landsat 7 | LST, UHI | [33] |
| Metrological data | - | - | TM, ETM+ | Landsat 8 | LST | [29] |
| Metrological data | - | - | OLI, TIRS | Landsat 8 | LST | [42] |
| Metrological data | - | - | TM, ETM+, OLI, TIRS | Landsat 8 | LST | [43] |
| Metrological data | - | - | ETM+ | Landsat 7 | LST (UHI) | [44] |
| Metrological data, land use/land cover maps | MLH | Supervised | Aster | Terra | LST, land use/land cover | [45] |
| Metrological data | - | - | TM | Landsat | LST (UHI) | [46] |
| Metrological data, land use/land cover maps | - | - | Aster | Terra | LST(UHI) | [47] |
| Metrological data | - | - | Aster | Terra | LST | [48] |
| Field surveys, metrological data | MLH, K-Mean | Supervised and unsupervised | ETM+ | Landsat | LST (UHI), land use/land cover | [49] |
| Field data | - | - | ETM+ | Landsat 7 | Air pollution map | [50] |
| Metrological data | - | - | Aster | Terra | LST (UHI) | [51] |
| Metrological data | MLH | Supervised | TM, ETM+ | Landsat 4, 5, 7 | LST (UHI), land use/land cover | [52] |
| Metrological data | - | - | TM, ETM+ | Landsat 5, 7 | LST (UHI), land use/land cover | [53] |
| Metrological data | ISODATA, MLH | Supervised and unsupervised | TM, ETM+ | Landsat 7 | LST (UHI), land use/land cover | [54] |
| Metrological data | - | - | OLI, TIRS | Landsat 8 | LST (UHI) | [55] |
| RMSE, RelRMSE, MSE, RD | MLH | Supervised | TM, ETM+ | Landsat 7 | LST (UHI) | [56] |
| Metrological data, error matrix | MLH | Supervised | OLI, TIRS | Landsat 8 | LST(UHI), land use/land cover | [57] |
| Metrological data, error matrix | MLH | Supervised | TM, ETM+ | Landsat 4, 5, 7 | LST (UHI), land use/land cover | [58] |
| Metrological data | - | Object-oriented | TIRS | Landsat 8 | LST (UHI), land use/land cover | [59] |
| - | - | - | OLI, TIRS | Landsat 8 | LST | [60] |
| - | - | - | OLI, TIRS | Landsat 8 | LST | [61] |
| Metrological data, error matrix | - | Object-oriented | OLI, TIRS, ETM+ | Landsat 7, 8 | LST (UHI), land use/land cover | [62] |
| Metrological data, error matrix | MLH | Supervised | TM, OLI, TIRS | Landsat 5, 8 | LST (UHI), land use/land cover | [63] |
| Metrological data | - | - | OLI, TIRS | Landsat 8 | LST (UHI) | [64] |
| Error matrix | MLH | Supervised & unsupervised | ETM+ | Landsat 7 | LST, land cover | [65] |
| Error matrix | - | Supervised | TM, OLI, ETM+ | Landsat 5, 7, 8 | LST (UHI), land use/land cover | [66] |
| Error matrix | MLH | Supervised | TM, OLI, ETM+ | Landsat 5, 7, 8 | LST (UHI), land use/land cover | [67] |
| Error matrix | MLH | Supervised | TM, OLI | Landsat 4, 5, 8 | LST (UHI), land use/land cover | [68] |
| Topographic maps, metrological data, error matrix | - | - | ETM+, TIRS | Landsat 7, 8 | LST (UHI) | [69] |
| Topographic maps, metrological data, error matrix | - | - | OLI | Landsat 8 | LST (UHI) | [70] |
| Topographic maps, metrological data, error matrix | MLH | Supervised | TM | Landsat 4, 5 | LST(UHI), land use/land cover | [71] |
| Metrological data, error matrix | MLH | Supervised | - | Landsat 7 | LST, land use/land cover | [72] |
| Metrological data | - | - | ETM+ | Landsat 7 | LST | [73] |
| Meteorological Station | Models | Purpose | Reference |
|---|---|---|---|
| Synoptic | Mann–Kendall, regression | Time series analysis | [31] |
| Synoptic, rain gauge | Kruskal–Wallis, Kendall’s tau, Mann–Kendall | Time series analysis | [75] |
| Synoptic, dry-temperature sensor | Average, geostatistics | Comparison and analysis of statistical relationships | [76] |
| - | Regression | Comparison and analysis of statistical relationships | [39] |
| - | Local Moran’s I statistic | Comparison and analysis of statistical relationships | [29] |
| - | Local Moran’s I statistic | Comparison and analysis of statistical relationships | [42] |
| - | Mann–Kendall | Trend analysis | [43] |
| Synoptic, climatology | - | Trend analysis, comparison, and analysis of statistical relationships | [77] |
| - | Regression | Comparison and analysis of statistical relationships | [44] |
| - | Correlation coefficient, regression | Comparison and analysis of statistical relationships | [45] |
| - | Spatial autocorrelation (global Moran’s I statistic), local spatial autocorrelation (local Moran’s I statistic) | Comparison and analysis of statistical relationships | [46] |
| - | Kruskal–Wallis, correlation coefficient | Comparison and analysis of statistical relationships | [47] |
| Dry-temperature sensor, synoptic | Average, temperature equivalent maps | Comparison and analysis of statistical relationships | [78] |
| - | Correlation coefficient | Comparison and analysis of statistical relationships | [51] |
| - | Global Moran’s I statistic | Comparison and analysis of statistical relationships | [55] |
| Meteorological data recorder | One-way ANOVA | Comparison and analysis of statistical relationships | [79] |
| Synoptic | Average | Comparison and analysis of statistical relationships | [80] |
| Synoptic | Regression, T-test | Comparison and analysis of statistical relationships | [72] |
| - | Regression | Comparison and analysis of statistical relationships | [58] |
| Synoptic, climatology | Average | Comparison and analysis of statistical relationships | [81] |
| Synoptic | Regression, kriging interpolation, autocorrelation (Moran’s I statistic), statistics | Comparison and analysis of statistical relationships | [82] |
| Synoptic | Mann–Kendall | Time series analysis | [83] |
| Synoptic | Pearson correlation, regression | Comparison and analysis of statistical relationships | [84] |
| - | Regression | Comparison and analysis of statistical relationships | [65] |
| Synoptic | Regression | Comparison and analysis of statistical relationships | [66] |
| Synoptic | Regression | Comparison and analysis of statistical relationships | [85] |
| Synoptic | Mann–Kendall | Comparison and analysis of statistical relationships | [86] |
| Synoptic | Regression | Comparison and analysis of statistical relationships | [67] |
| Synoptic | Regression | Comparison and analysis of statistical relationships | [87] |
| - | Regression | Comparison and analysis of statistical relationships | [68] |
| Air-pollution-monitoring station | Correlation coefficient | Comparison and analysis of statistical relationships | [50] |
| Synoptic | - | Time series analysis | [88] |
| - | Autocorrelation (Moran’s I statistic), statistics | Comparison and analysis of statistical relationships | [36] |
| Air-pollution-monitoring station, synoptic, climatology | Correlation coefficient | Comparison and analysis of statistical relationships | [64] |
| Synoptic, climatology | Mann–Kendall | Comparison and analysis of statistical relationships, trend analysis | [89] |
| Synoptic, climatology | - | Trend analysis | [73] |
| - | Regression, GAM, SVM, BRT, RF | Comparison and analysis of statistical relationships | [70] |
| Synoptic | T test, Von Neumann, autocorrelation | Time series, trend analysis | [90] |
| Meteorological Station | Models | Purpose | Reference |
|---|---|---|---|
| Synoptic | OKE | Investigating the effect of urban geometry on the intensity of UHIs | [88] |
| Synoptic | ENVI-met | Simulating the behavior of wind velocity caused by urban geometry | [96] |
| Synoptic | ENVI-met | Analyzing the effect of urban design on wind speed and temperature variability | [97] |
| NASA/GES, NOAA/NCEP | Hybrid factor analysis (FA) and analytical network process (ANP) | Evaluating the effect of urban growth on regional climate change | [98] |
| Synoptic | ENVI-met | Exploring reconfiguration scenarios of high-density urban neighborhoods on urban temperature | [99] |
| NCEP, IPCC | Givoni’s bioclimatic chart, the second-generation Canadian Earth System Model | Projecting the impact of climate change on design recommendations for residential buildings | [95] |
| Synoptic | ENVI-met | Review and reduce the heat island effect of urban development | [73] |
| - | OKE | Calculating the urban heat island intensity based on urban geometry | [26] |
Publisher’s Note: MDPI stays neutral with regard to jurisdictional claims in published maps and institutional affiliations. |
© 2021 by the authors. Licensee MDPI, Basel, Switzerland. This article is an open access article distributed under the terms and conditions of the Creative Commons Attribution (CC BY) license (https://creativecommons.org/licenses/by/4.0/).
Share and Cite
Esfandeh, S.; Danehkar, A.; Salmanmahiny, A.; Sadeghi, S.M.M.; Marcu, M.V. Climate Change Risk of Urban Growth and Land Use/Land Cover Conversion: An In-Depth Review of the Recent Research in Iran. Sustainability 2022, 14, 338. https://doi.org/10.3390/su14010338
Esfandeh S, Danehkar A, Salmanmahiny A, Sadeghi SMM, Marcu MV. Climate Change Risk of Urban Growth and Land Use/Land Cover Conversion: An In-Depth Review of the Recent Research in Iran. Sustainability. 2022; 14(1):338. https://doi.org/10.3390/su14010338
Chicago/Turabian StyleEsfandeh, Sorour, Afshin Danehkar, Abdolrassoul Salmanmahiny, Seyed Mohammad Moein Sadeghi, and Marina Viorela Marcu. 2022. "Climate Change Risk of Urban Growth and Land Use/Land Cover Conversion: An In-Depth Review of the Recent Research in Iran" Sustainability 14, no. 1: 338. https://doi.org/10.3390/su14010338
APA StyleEsfandeh, S., Danehkar, A., Salmanmahiny, A., Sadeghi, S. M. M., & Marcu, M. V. (2022). Climate Change Risk of Urban Growth and Land Use/Land Cover Conversion: An In-Depth Review of the Recent Research in Iran. Sustainability, 14(1), 338. https://doi.org/10.3390/su14010338