Article

Carbon Footprint Calculator Customized for Rice Products: Concept and Characterization of Rice Value Chains in Southeast Asia

1
International Rice Research Institute, Los Banos 4030, Philippines
2
Karlsruhe Institute of Technology, 82467 Garmisch-Partenkirchen, Germany
3
The Joint Graduate School of Energy and Environment, King Mongkut’s University of Technology Thonburi, Bangkok 10140, Thailand
4
Centre of Excellence on Energy Technology and Environment, Ministry of Higher Education, Science, Research and Innovation, Bangkok 10140, Thailand
*
Author to whom correspondence should be addressed.
Sustainability 2022, 14(1), 315; https://doi.org/10.3390/su14010315
Submission received: 23 November 2021 / Revised: 22 December 2021 / Accepted: 22 December 2021 / Published: 28 December 2021
(This article belongs to the Topic Climate Change and Environmental Sustainability)

Abstract

:
In this study, we developed user-friendly software (CF-Rice) for calculating the carbon footprints (CF) of rice products. The approach follows the principles of Life Cycle Assessment while incorporating more flexibility for activities specific to rice production. The graphical user interface provides empirical emission and conversion factors obtained from the literature and from primary research studies of rice value chains. CF-Rice also allows the entering of new values for specific processes or practices. Data outputs distinguish among the contributions of individual stages of the value chain as well as different greenhouse gases (GHG), namely, CH4, N2O and CO2. The new tool was then applied to a scenario assessment of rice production in the regional context of Southeast Asia. The CF baseline of a typical rice value chain in the region accounted for a value of around 2300 g CO2e/kgProd. The CF can be reduced by about 27.4% through water-saving practices alone and can further be reduced up to 37.3% through interventions that increase product recovery rates and, thus, reduce food losses. In contrast, straw incorporation into the soil increased the CF by 26.0%. The tool is well suited for impact assessments of advanced practices and technologies of rice value chains.

1. Introduction

The agricultural sector accounts for a sizable contribution of the global greenhouse gas (GHG) emissions and thus, to anthropogenic climate change [1]. According to a recent estimate, the food system is responsible for approximately 26% of the total global GHG emissions [2]. Given the growing demand for food, sustainable development pathways to attaining global food security will rely on both dietary changes and agricultural intensification pathways that stabilize or even reduce GHG emissions [3,4]. There is ample evidence that improved practices and technologies can markedly reduce GHG emissions along the food value chain and thus, carbon footprints (CF) of food commodities—for which rice is a good example [5]. Rice is the staple food for more than half of the population on the planet [6] and although rice contributes only 6–8% of the total food systems emissions [7], the potential for mitigation is high (30–65%) relative to other crops and livestock [8].
Over recent decades, several methods have been developed for quantifying GHG emissions from agricultural sources. As a widely applied approach, the Intergovernmental Panel on Climate Change (IPCC) guidelines [9,10] facilitate the quantification of GHG estimates at the national or subnational scale. In the case of rice production, an emission factor—either adopted as a sub-continental default value (Tier 1) or from one’s own empirical field measurements (Tier 2)—is multiplied to the respective rice area and management type (activity data). Irrespective of the IPCC tier the results are given as the amount of CO2 equivalents per area and year in line with the reporting requirements for national communications to the United Nations Framework Convention on Climate Change (UNFCCC).
The concept of carbon footprints, however, assesses GHG emissions as a function of the quantity of rice, e.g., kg CO2e/kgProd—in contrast to kg CO2e/ha/year as required by the UNFCCC. Despite a clear definition in the ISO standard 14067, the term “carbon footprint” is used with diverging connotations in the published literature on rice production (see below).
Low GHG emissions are generally considered as an integral part of sustainable food production. The first globally accepted standard for sustainably produced rice, established by the Sustainable Rice Platform [11], encompasses 12 performance indicators, of which one is low GHG emissions. Farmers can achieve compliance with this criterion through the application of the recommended water-saving practices and organic/inorganic amendments—but an explicit calculation of the product-specific CF is not required under the SRP certification process. The ability to quantify GHG emissions along the entire value chain from farm to shelf for a specific product is the key to enhancing the transparency of the origin of emissions and for reducing emissions. This is especially the case for emissions that are incurred once the paddy rice leaves the farm and enters the phase of processing where emissions from food product losses are often not accounted for and the methods that do exist for quantification are complex and out of reach for non-experts.
The specific objectives of our study are:
  • Providing a user-friendly and easily accessible tool for CF calculation tailored for the rice value chain including a value-adjusted accounting of by-products,
  • Assessing typical baseline of CFs for rice products in the regional context of Southeast Asia,
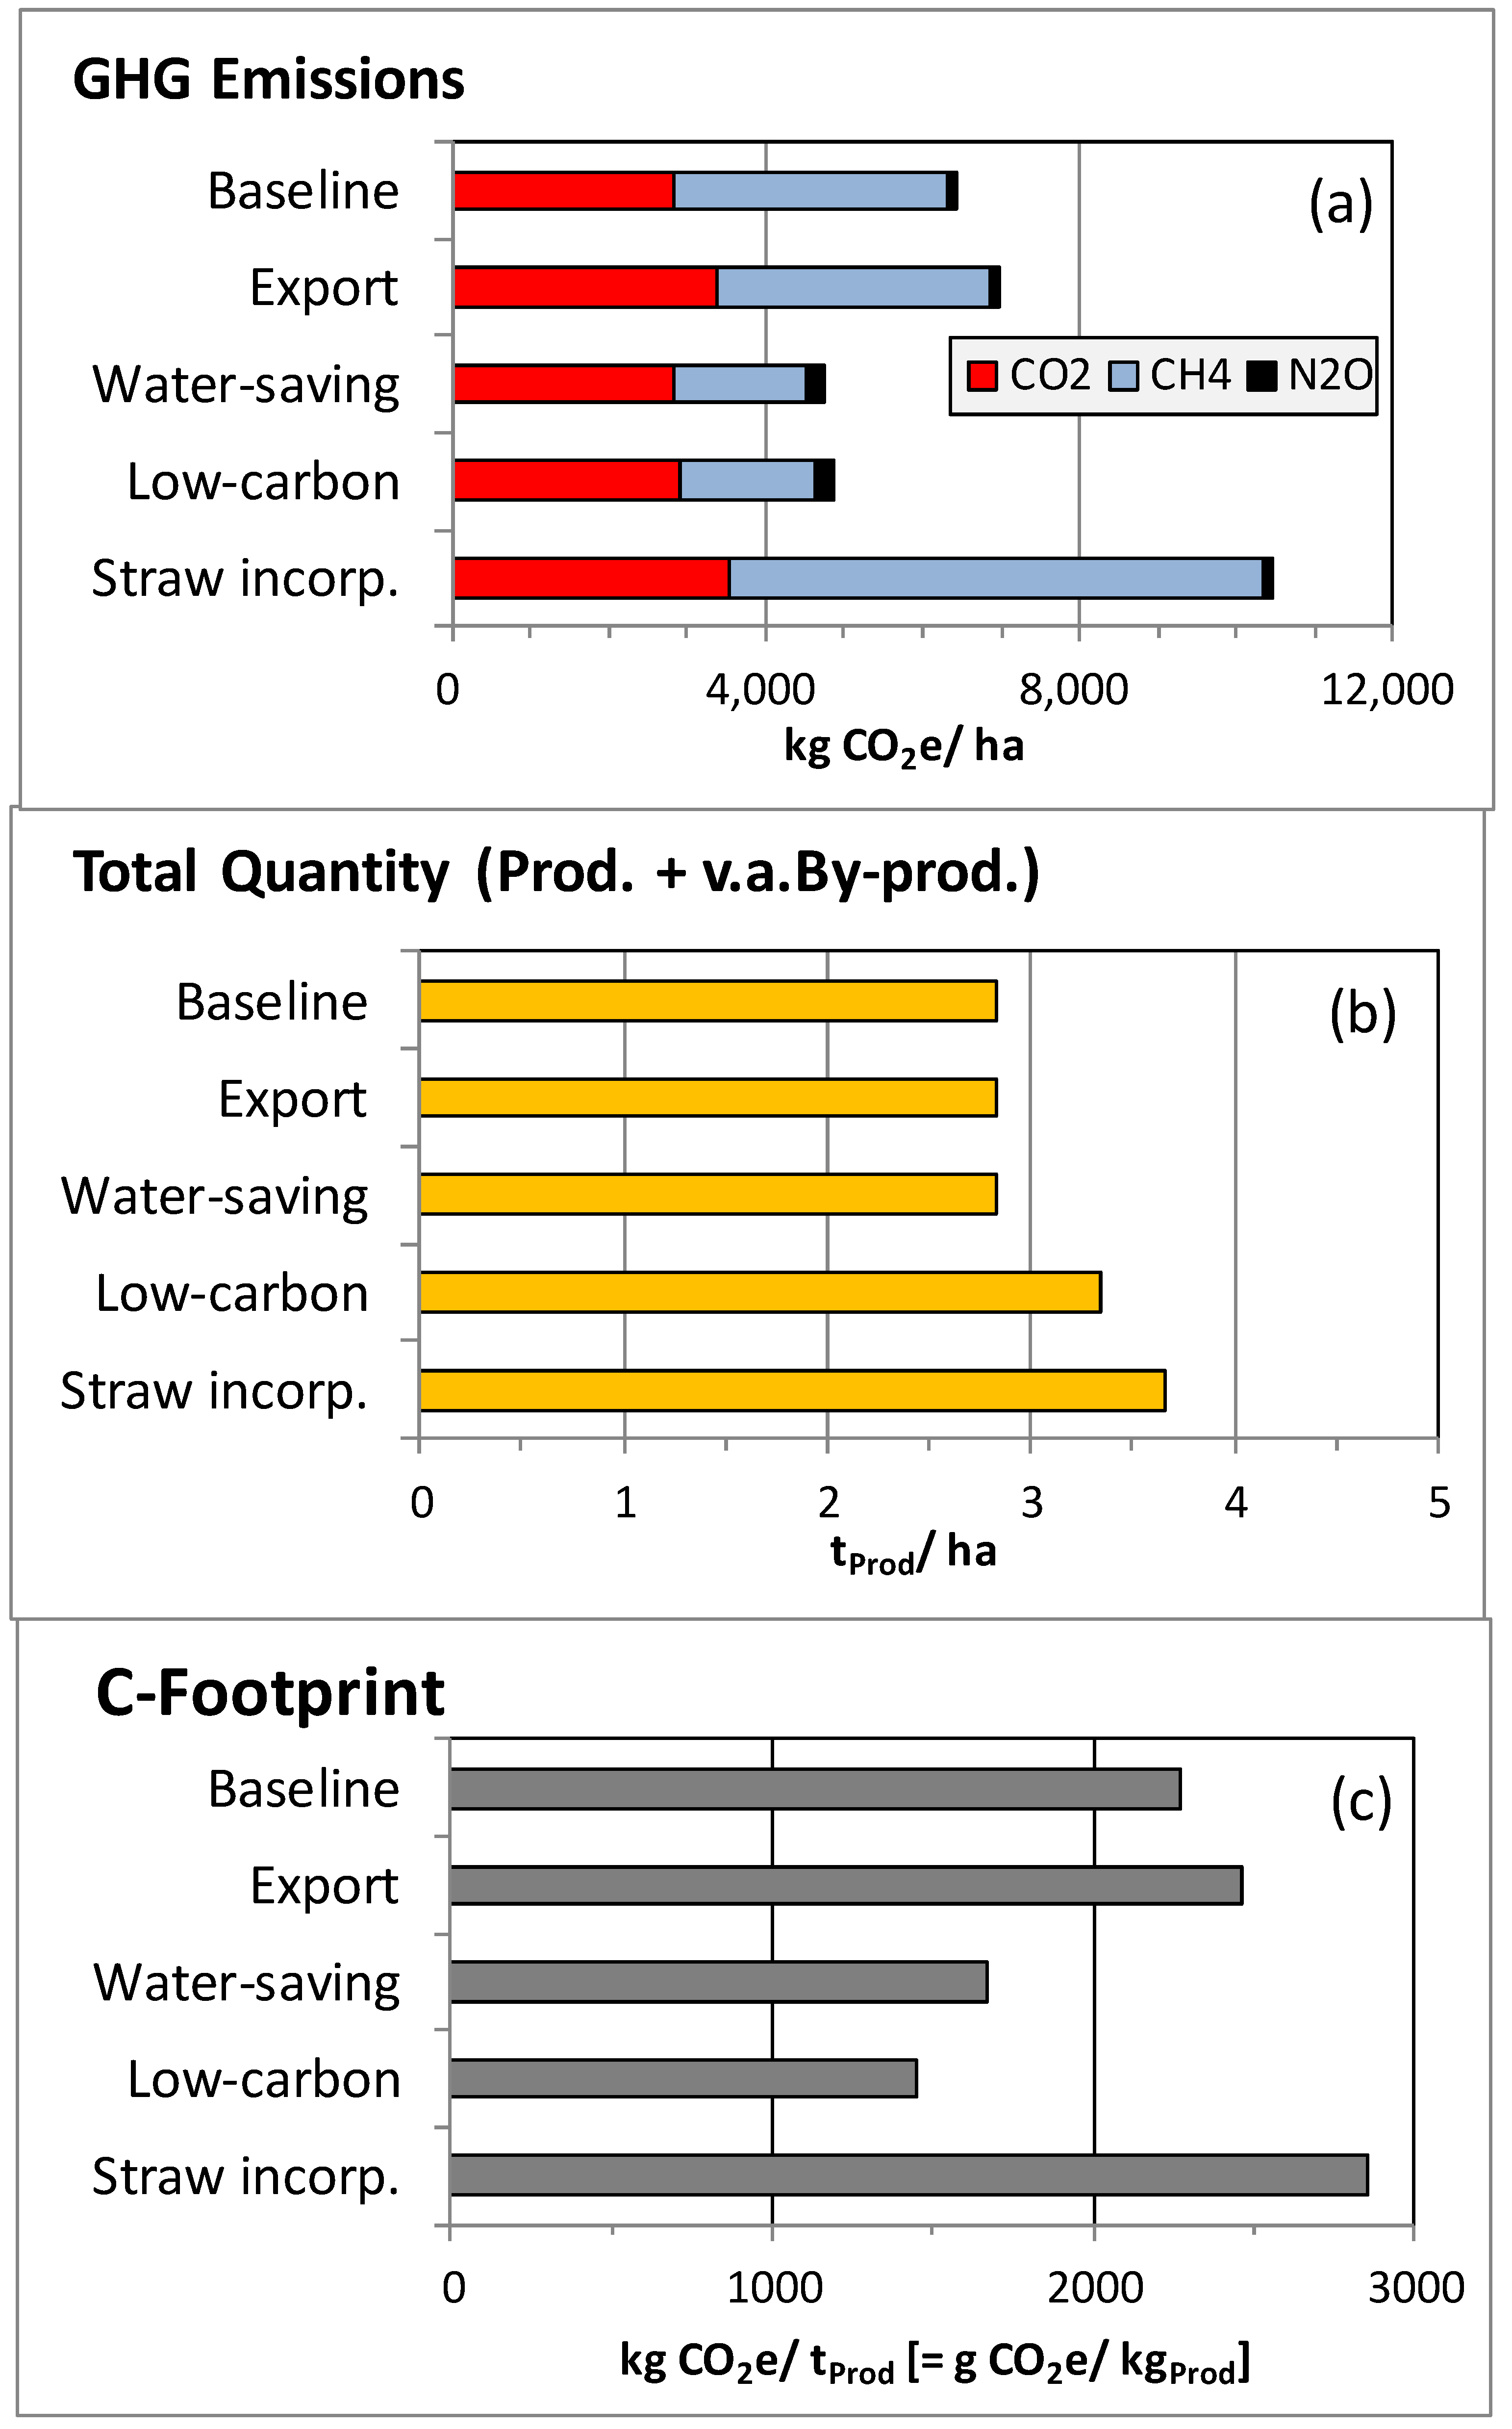
  • Quantifying the contribution of (i) individual stages of the value chain as well as (ii) emissions of different Greenhouse Gases, namely, CH4, N2O and CO2, to the overall CF of the rice product, and
  • Providing a comparative scenario assessment of technological options in rice value chains to show the range of CFs of rice products.

2. Methods

2.1. Principles of Carbon Footprint Calculation

The newly developed CF-Rice software is a calculation tool for rice products downloadable (including User Manual) from https://ghgmitigation.irri.org/knowledge-products/mrv-toolbox/cf-rice (accessed on 19 December 2021). The approach of the CF calculation in CF-Rice follows the general principles of the LCA approach [12] by considering both on-field and off-field processes with the final product quantity (1 kg of white polished rice = 1 kgProd) as the ‘functional unit’ entering the domestic or international market. Figure 1 shows a schematic presentation of the rice value chain as defined in CF-Rice including the system boundaries while the equations can be obtained in their generic forms from Table 1, with detailed equations including their underlying assumptions shown in Table A1 of the Appendix A.
In CF-Rice, the individual stages of the value chain are grouped into two segments, namely, (i) cultivation and (ii) harvest and post-harvest processing. The reference flow from the field to the market is defined as the amount of rice (QBase) available on 1 hectare (ha), so that the quantification of GHG emissions can encompass both area-based emission factors (in CO2e per ha) and quantity-based conversion factors (in CO2e per kg referenced to QBase). The calculation of CFs requires the data inputs of operations related directly to GHG emissions of CO2, CH4 and N2O at all stages of the value chain. In part, this data can be obtained through the IPCC guidelines [9,10] that provide equations and default values for specific crop management practices, but not for harvest and post-harvest operations. Moreover, the CF calculation also has to take into account the product recovery rates for those stages that incur losses, namely, harvesting, drying, storing and milling.
As a means to allow easy operation of the tool, we developed a graphical user interface (GUI) and compiled a library of GHG emission factors and recovery rates tailored for the rice value chain that are derived from our own primary research as well as other sources (Table 1). This data is embedded in the GUI in the form of drop-down menus allowing the user to select either the default value for each stage or technological alternatives (see illustration in the Appendix A/Figure A1). Moreover, CF-Rice allows the user to enter additional data on emissions and yield recovery obtained from literature or users’ empirical studies.
In assessing the mass balance along the reference flow, CF-Rice distinguishes between genuine product losses and the generation of by-products. The latter occurs at the milling stage in the form of husk and bran and possibly also at the stage of straw management if straw is used as a commodity and not burnt or incorporated; however, these by-products have considerably lower economic values per given quantity than rice products which are expressed in the value-adjusted quantities as graphically shown in Figure 2 for the baseline scenario. While CF-Rice provides default values to account for the quantities of losses and by-products including their economic value, the users can also add their own data on those rates if available. Although straw is not traded as a commodity in the scenarios considered in this study, this option can be considered by the user through adding a value-adjustment factor. The CF is finally computed by dividing the total GHG emissions over the product quantity.
After opening the GUI, the user has to enter data on rice yield after harvest and select the respective cultivation as well as harvest and post-harvest technologies. The calculated emission rates and CFs are immediately visible in the input window on a preview panel to allow real-time monitoring during the data input procedures (Appendix A/Figure A1). CF-Rice automatically sums up the individual GHG emissions of each stage and quantifies the final product at the end of the reference flow. Then, the user can save the project settings (e.g., baseline scenario) and get a comprehensive data sheet with all inputs and outputs in alpha-numerical form and graphical presentations. The latter includes a scale of reported literature values of rice CFs (green=low end, red=high end) marked with the calculated value (Appendix A/Figure A2) to allow an initial orientation for interpreting the results.

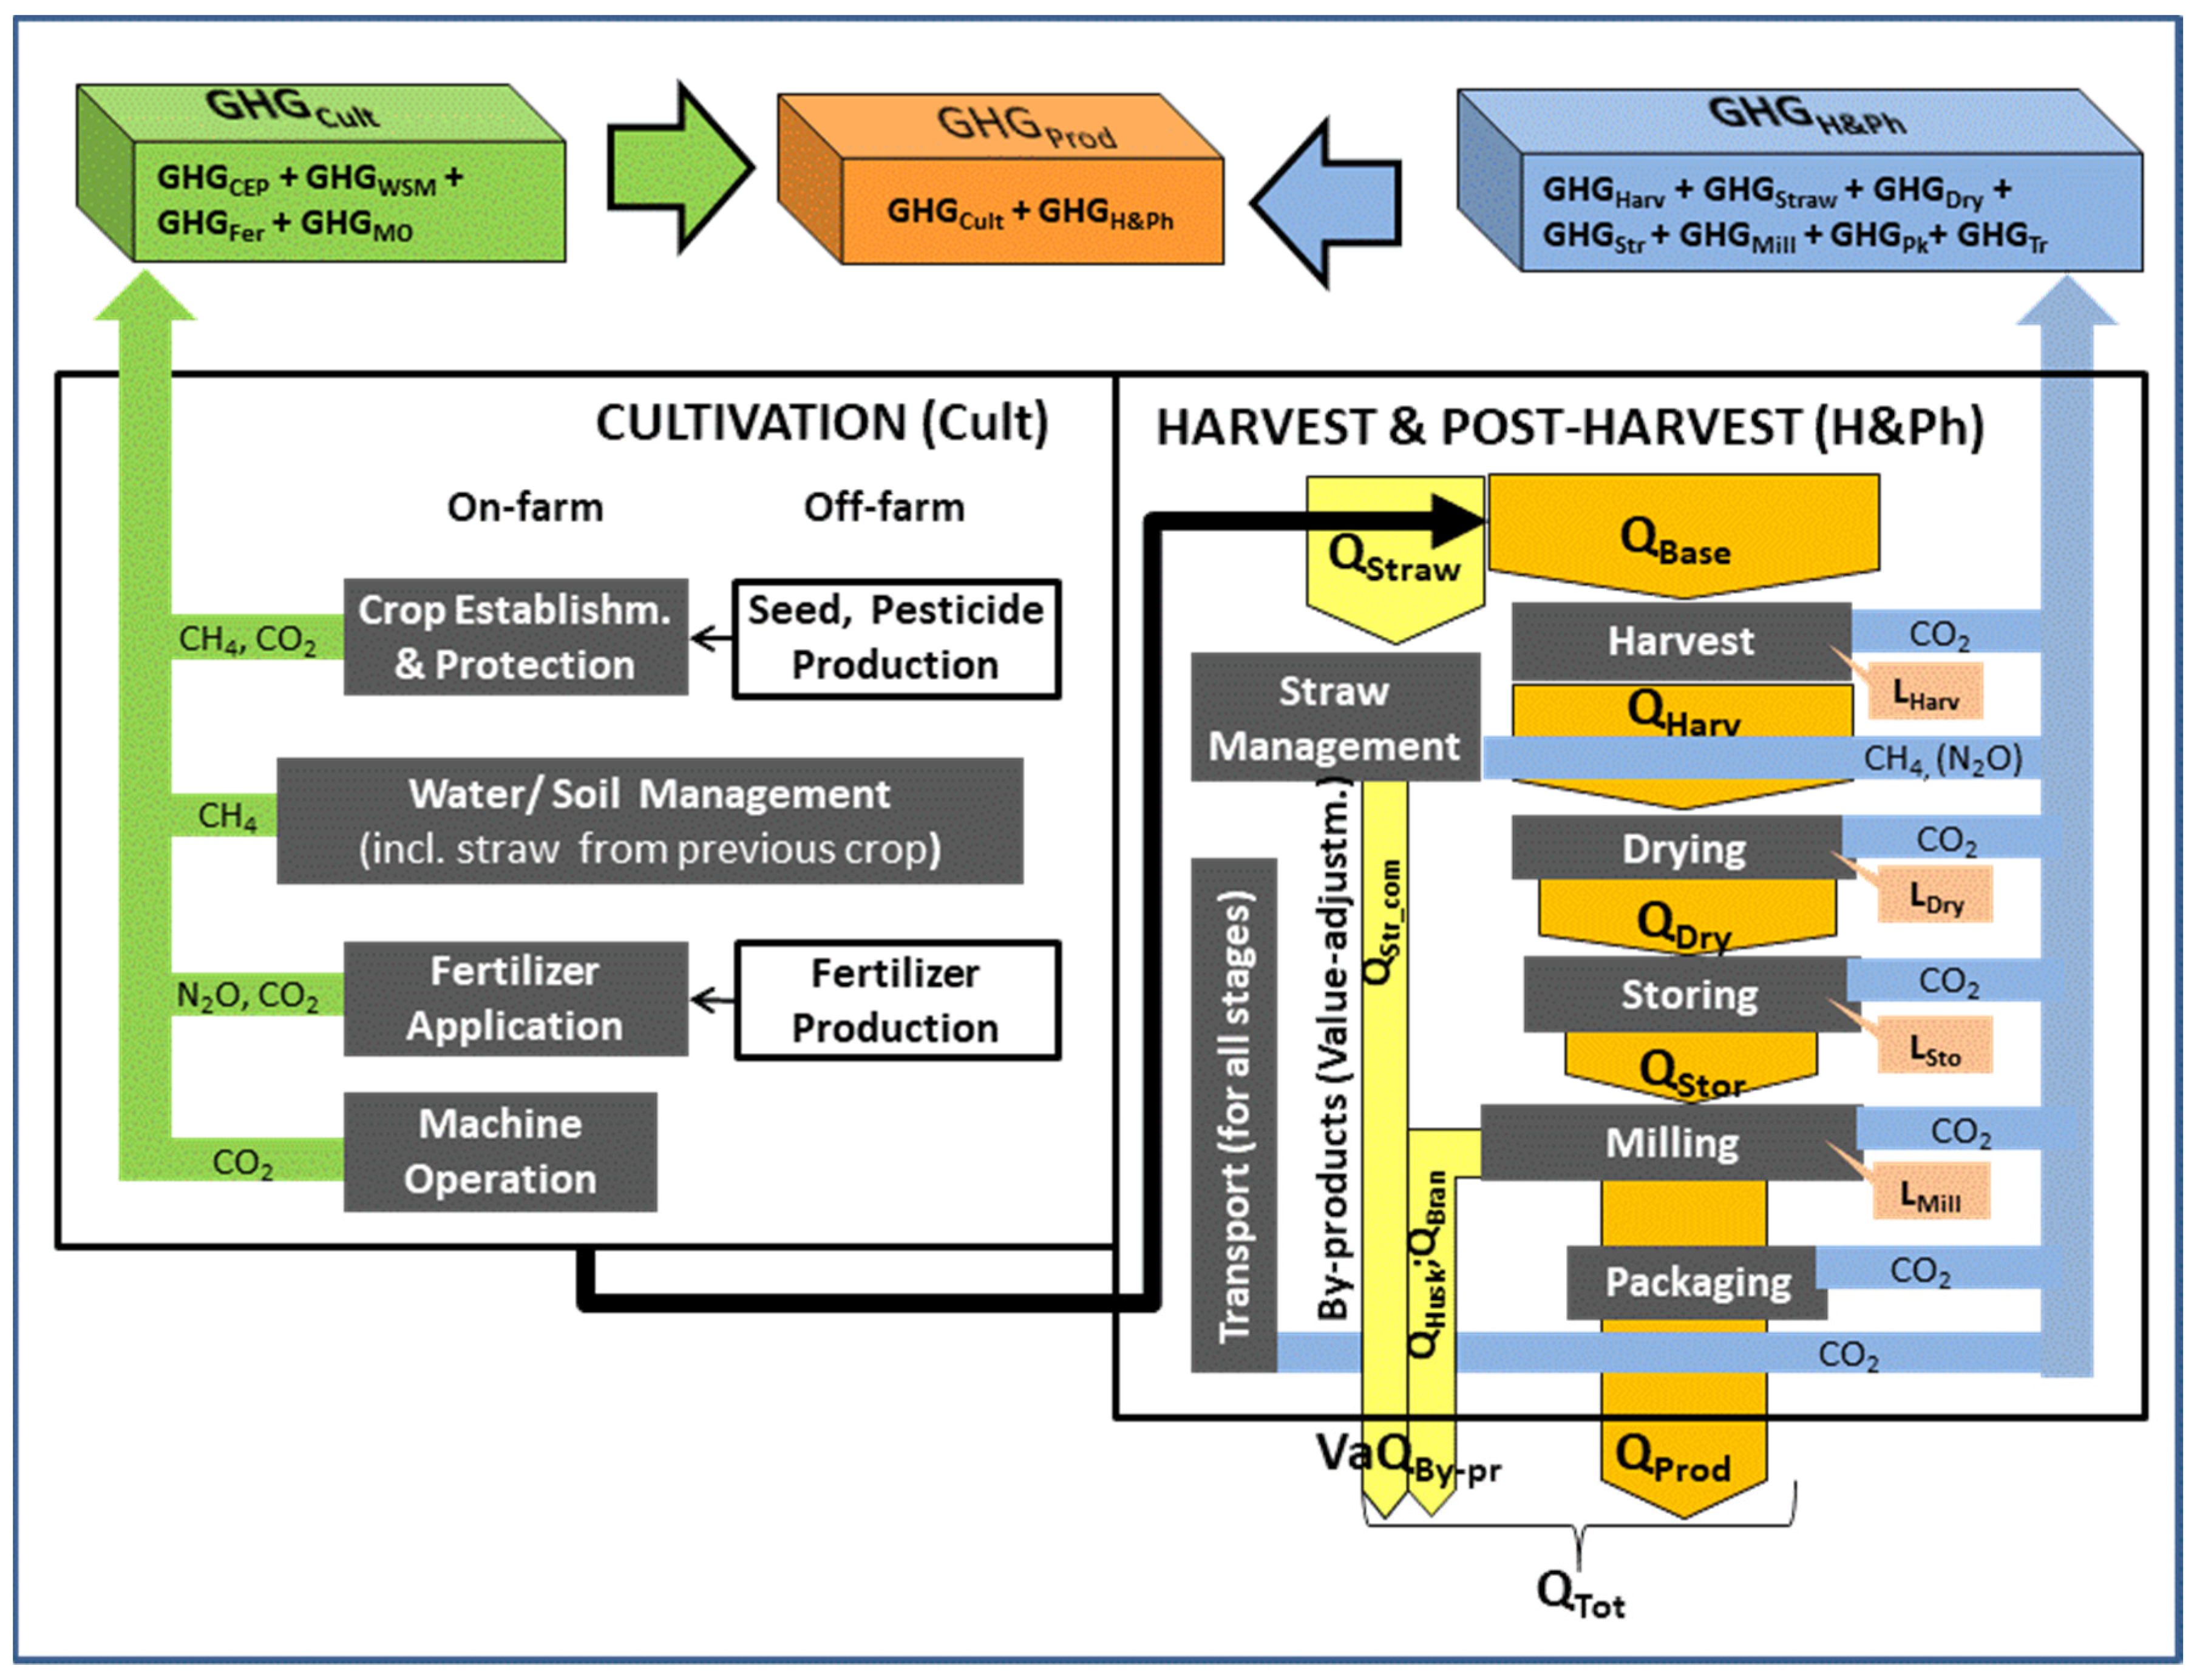
2.2. System Boundaries

The system boundaries of CF-Rice (Figure 1) are given by the rice value chain comprising emissions and grain losses starting from the crop establishment to the transport to the market. In addition to on-site emissions, CF-Rice also considers the off-site emissions from resource inputs, namely, fertilizer and pesticide production. In the case of by-products, however, CF-Rice is limited to their economic values that are included to calculate the amount of product equivalents (Figure 2), but the GHG emissions triggered by their external use. Given the ramified options for the possible use of by-products [21], this holistic approach would have collided with the objective to provide a user-friendly tool.

3. Results and Discussion

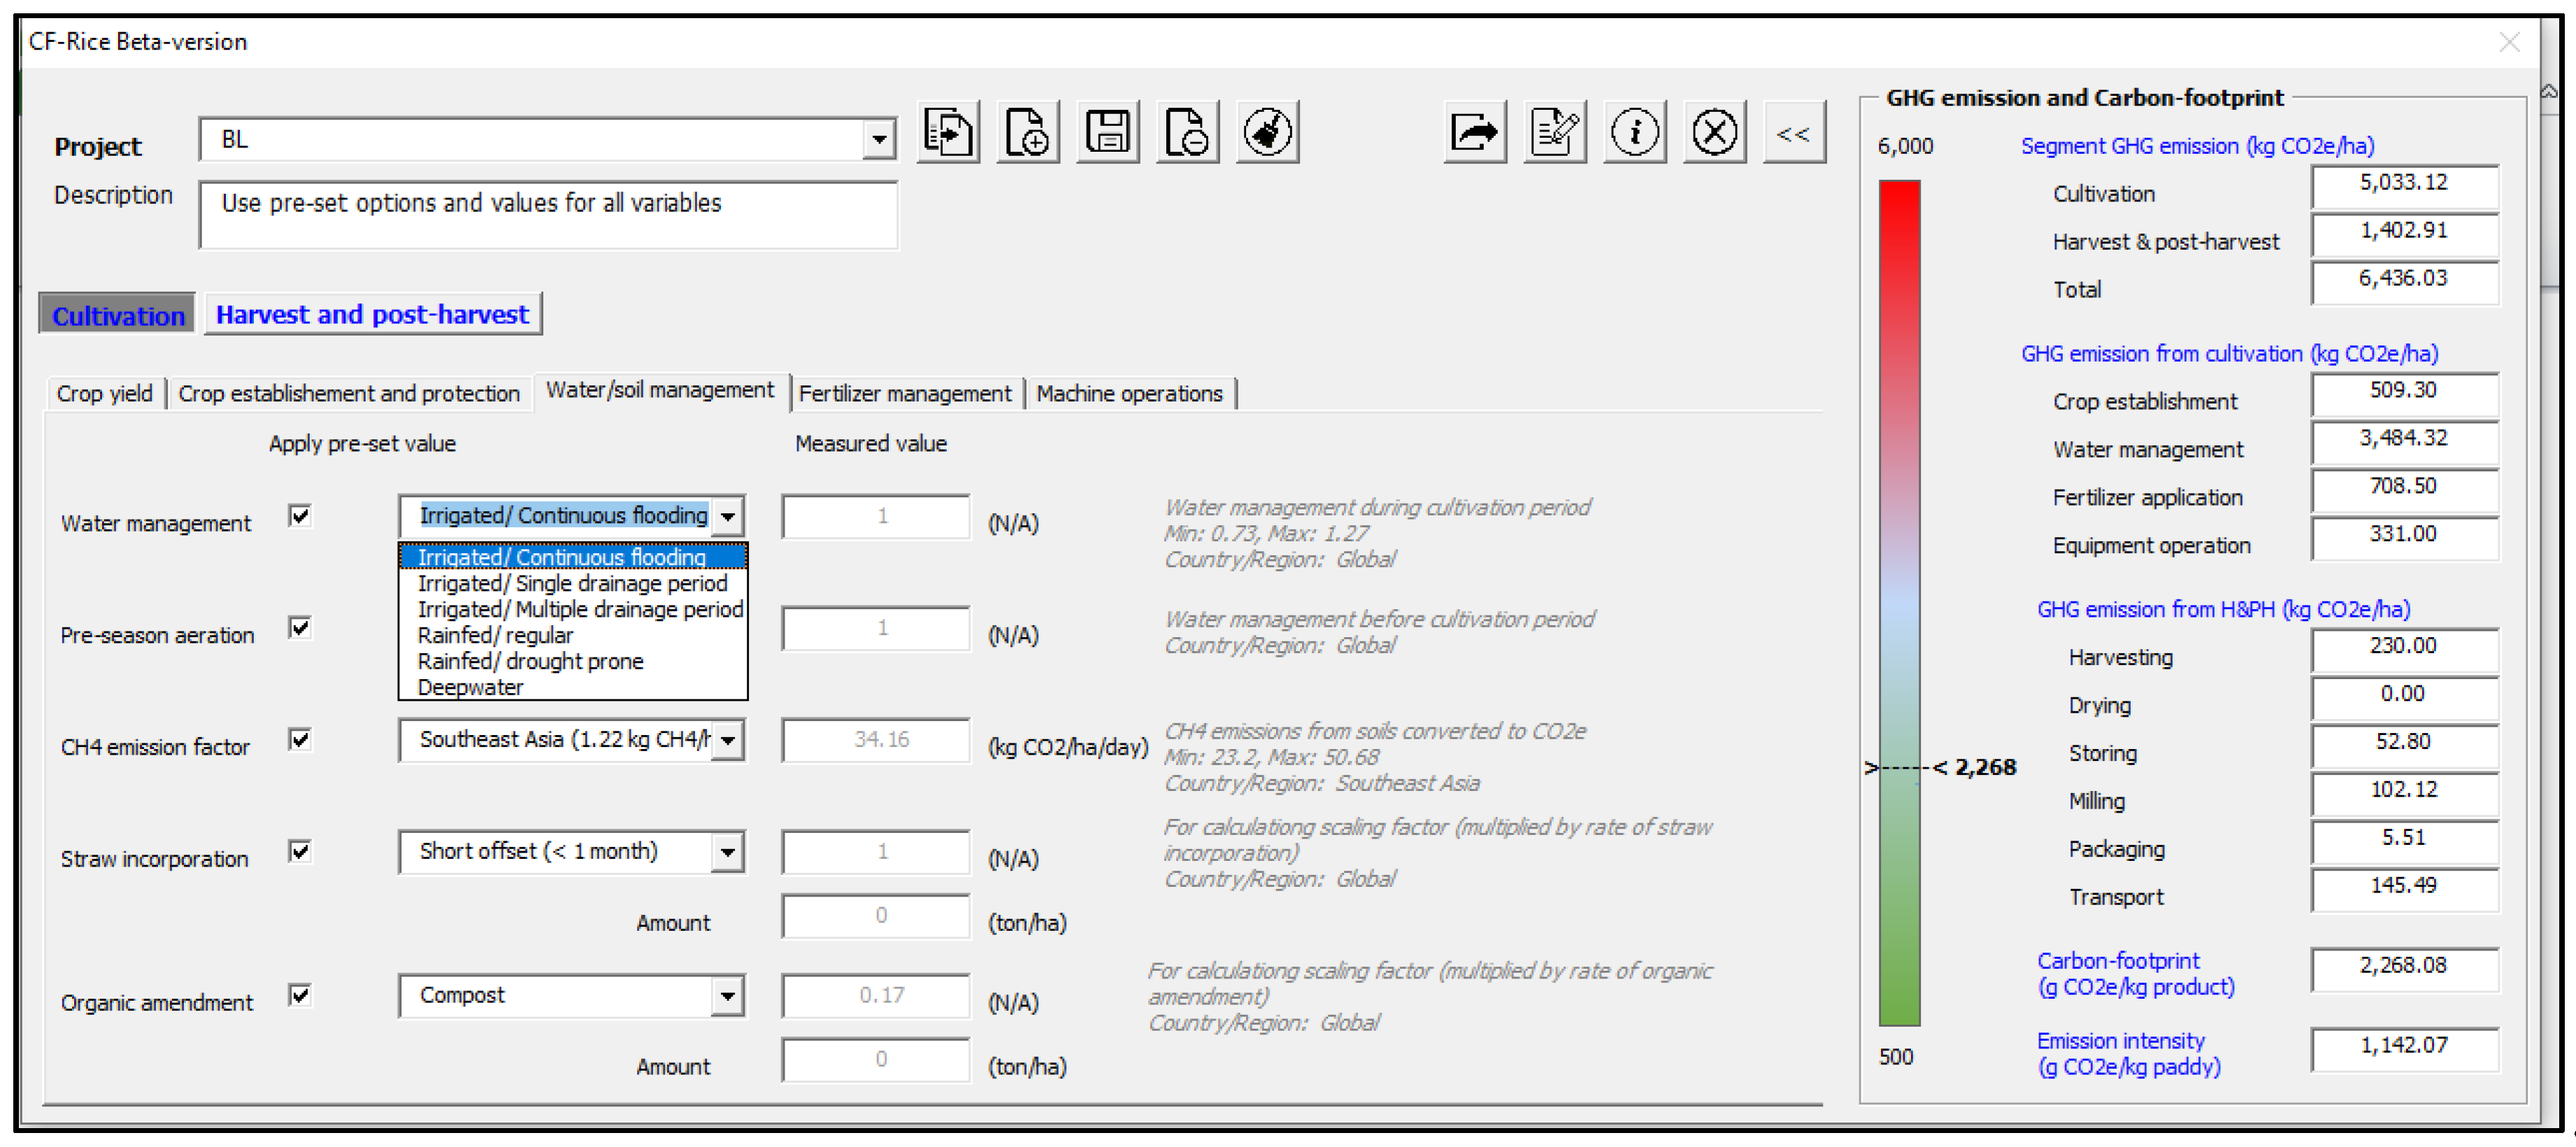
3.1. Application of CF-Rice in the Regional Context of Southeast Asia

While the CF-Rice tool was conceived to calculate product-specific CFs, the outputs from the tool also encompass specific data on GHG emissions per stage and per GHG type. The rationale for these additional features is facilitating scientific assessments of the contributions and highlighting emission hot-spots along the value chain. The potential application of these data sets from CF-Rice is illustrated in the following for the baseline and alternative scenarios of the rice value chains in Southeast Asia.
Although hypothetical in nature, the assumptions of the individual scenarios are derived from broad empirical studies on rice value chains in the region [16,22]. While we recognize the heterogeneity of rice farming in Southeast Asia, this generalization seems justified to provide the bigger picture of the main drivers of the overall emissions and thus, the CF, for one of the major rice-growing regions of the world. Rice production in Southeast Asia accounts for 48 million ha with an annual output of 220 million tons (in 2018) which corresponds to almost 30% of the world rice supply [23,24]. Thailand and Vietnam rank second and third of the rice-exporting countries, so that the region is a net-source of rice in the global rice supply.

3.2. Hypothetical Baseline of the Rice Value Chain

Figure 3 shows stage-specific GHG emissions of a typical setting of the rice value chain in Southeast Asia in which the stages for cultivation collectively account for 78.2% of all GHG emissions. The stage of crop establishment/protection contributes 7.9% of the total GHG emissions. Rice is either transplanted or directly seeded into soil that has been water-logged for several days or even weeks. The soil preparation involves several iterations of heavy flooding and soil tillage in which fields are puddled, harrowed and leveled before rice transplanting [13]. The emissions from seeding derive from the CH4 emissions during seed production in flooded fields while GHG emissions from pesticide comprise the CO2- emissions at the production facility.
The stage “water/soil management”—corresponding to CH4- emissions from flooded fields during cultivation—accounts for 54.1% of the total GHG emissions in the baseline scenario (Figure 3). As this GHG calculation follows the revised IPCC Guidelines [10], we used the default emission factor for Southeast Asia and all scaling factors set to 1 (Table 1), i.e., assuming continuous flooding, short aeration in the pre-season and no organic amendments. Apart from the organic amendments (that are explained below for the scenario with straw amendment), the most important input parameter is the scaling factor of water management that can be altered from continuous flooding to single drainage (SFw = 0.71) or multiple drainage (SFw = 0.55). It should be noted that these terms do not account for the terminal drainage of rice fields starting several days before harvest, which is common practice even if the fields are continuously flooded prior to that. While this terminology on drainage applies to irrigated rice, rainfed rice can also be considered in CF-Rice by using the respective IPCC default value of SFw = 0.54 and setting the emissions from pumping to zero. The calculation of CH4 emissions also considers pre-season treatment and organic amendment. While the latter will be discussed below in detail for the scenario with straw incorporation, the pre-season treatment refers to the incorporation of stubbles, i.e., SFpre = 1 entails the soil incorporation of shallow stubbles.
As for fertilizer application, the results obtained by CF-RICE indicate a contribution of 11.0% to the overall emissions corresponding to the second largest stage-specific value after soil/water management. CF-Rice distinguishes between on-field emissions of N2O (2.2%) from fertilizer application as well as off-farm emissions of CO2 (8.8%) attributed to energy inputs for fertilizer production and transport. N2O emissions have been calculated according to IPCC Guidelines, whereas the emission factor of CO2 emissions from fertilizer production was derived from industry-specific CF inventories (Table 1). According to the IPCC 2019 Guidelines [10], N2O emissions are calculated as a function of N-fertilizer applied to the field, i.e., EFN-N2O is 0.3% under continuous flooding and 0.5% when the field encompasses drainage.
Due to these low emission factors, N2O emissions remain at a low level as long as the fields are not over-fertilized. On the other hand, there have been some field records of higher background levels of N2O emissions, in particular rice systems with unstable water regimes [25]. The generalization of these findings, however, has been challenged [26] which has also been corroborated in a recent meta-analysis that clearly revealed low N2O emissions within the vast majority of studies irrespective of water management [27].
GHG emissions from on-farm machine operations are generally at a low level as compared to those from other sources during cultivation. Field operations and pumping accounts for 5.1% of the total emissions. Emissions from pumping for irrigating the field will vary for different locations and seasons, therefore we used an average from farmer surveys in the lower Mekong River Basin [15] that can be taken as an indicator for the low magnitude of emissions involved.
In the baseline scenario, the individual stages of harvest and postharvest comprise relatively simple technologies that collectively account for 21.8% of the total GHG emissions. More details on the varying technological options and their impacts on GHG emissions are discussed below under the scenarios of low-carbon, and straw incorporation. The amount of GHGs emitted from harvesting (3.6%), is low under conventional manual practices in the baseline, but higher for the use of combine harvesters due to replacing manual activity with one that consumes fossil fuels. As for the straw management (13.5%), the baseline comprises the common practice of straw burning. According to the IPCC Guidelines, these CO2 emissions are not considered as net GHG emissions because this flux only concludes the annual carbon cycle. In turn, the GHG budget of straw burning only comprises emissions due to the incomplete combustion of rice straw, namely, in the form of CH4 and N2O [17], although the latter generates only small amounts that are neglected in the majority of CF-Rice calculations. In comparison to post-harvest stages, milling (1.6% for the basic technology to produce white rice) is the most important GHG source whereas drying (zero emissions for sun drying) and storing (0.8% of total emissions for farmer granaries) and packaging (0.1%) have only very low emissions. However, the stages of harvest, drying, storage and milling, however, entail food losses and thus, alter the product quantity (QProd) and thus, the CF value (see below). Finally, the transport setting of the baseline accounts for 2.3% of all GHG emissions. This figure is based on moderate distances of truck (100 km) and tractor/trailer (50 km) transport whereas the case of exported rice is discussed below.
The quantitative impact of considering by-products for the CF-calculation is relatively low under present settings, i.e., a less than 5% increase of the total quantity and corresponding decrease in CF. As for the future these relationships may change in line with trends towards evolving circular economies. Apart from the by-products generated at the milling stage, this inclusion of by-products in the CF-calculation will be crucial for rice straw which has a great potential to become a traded commodity in the future under mechanized farming.

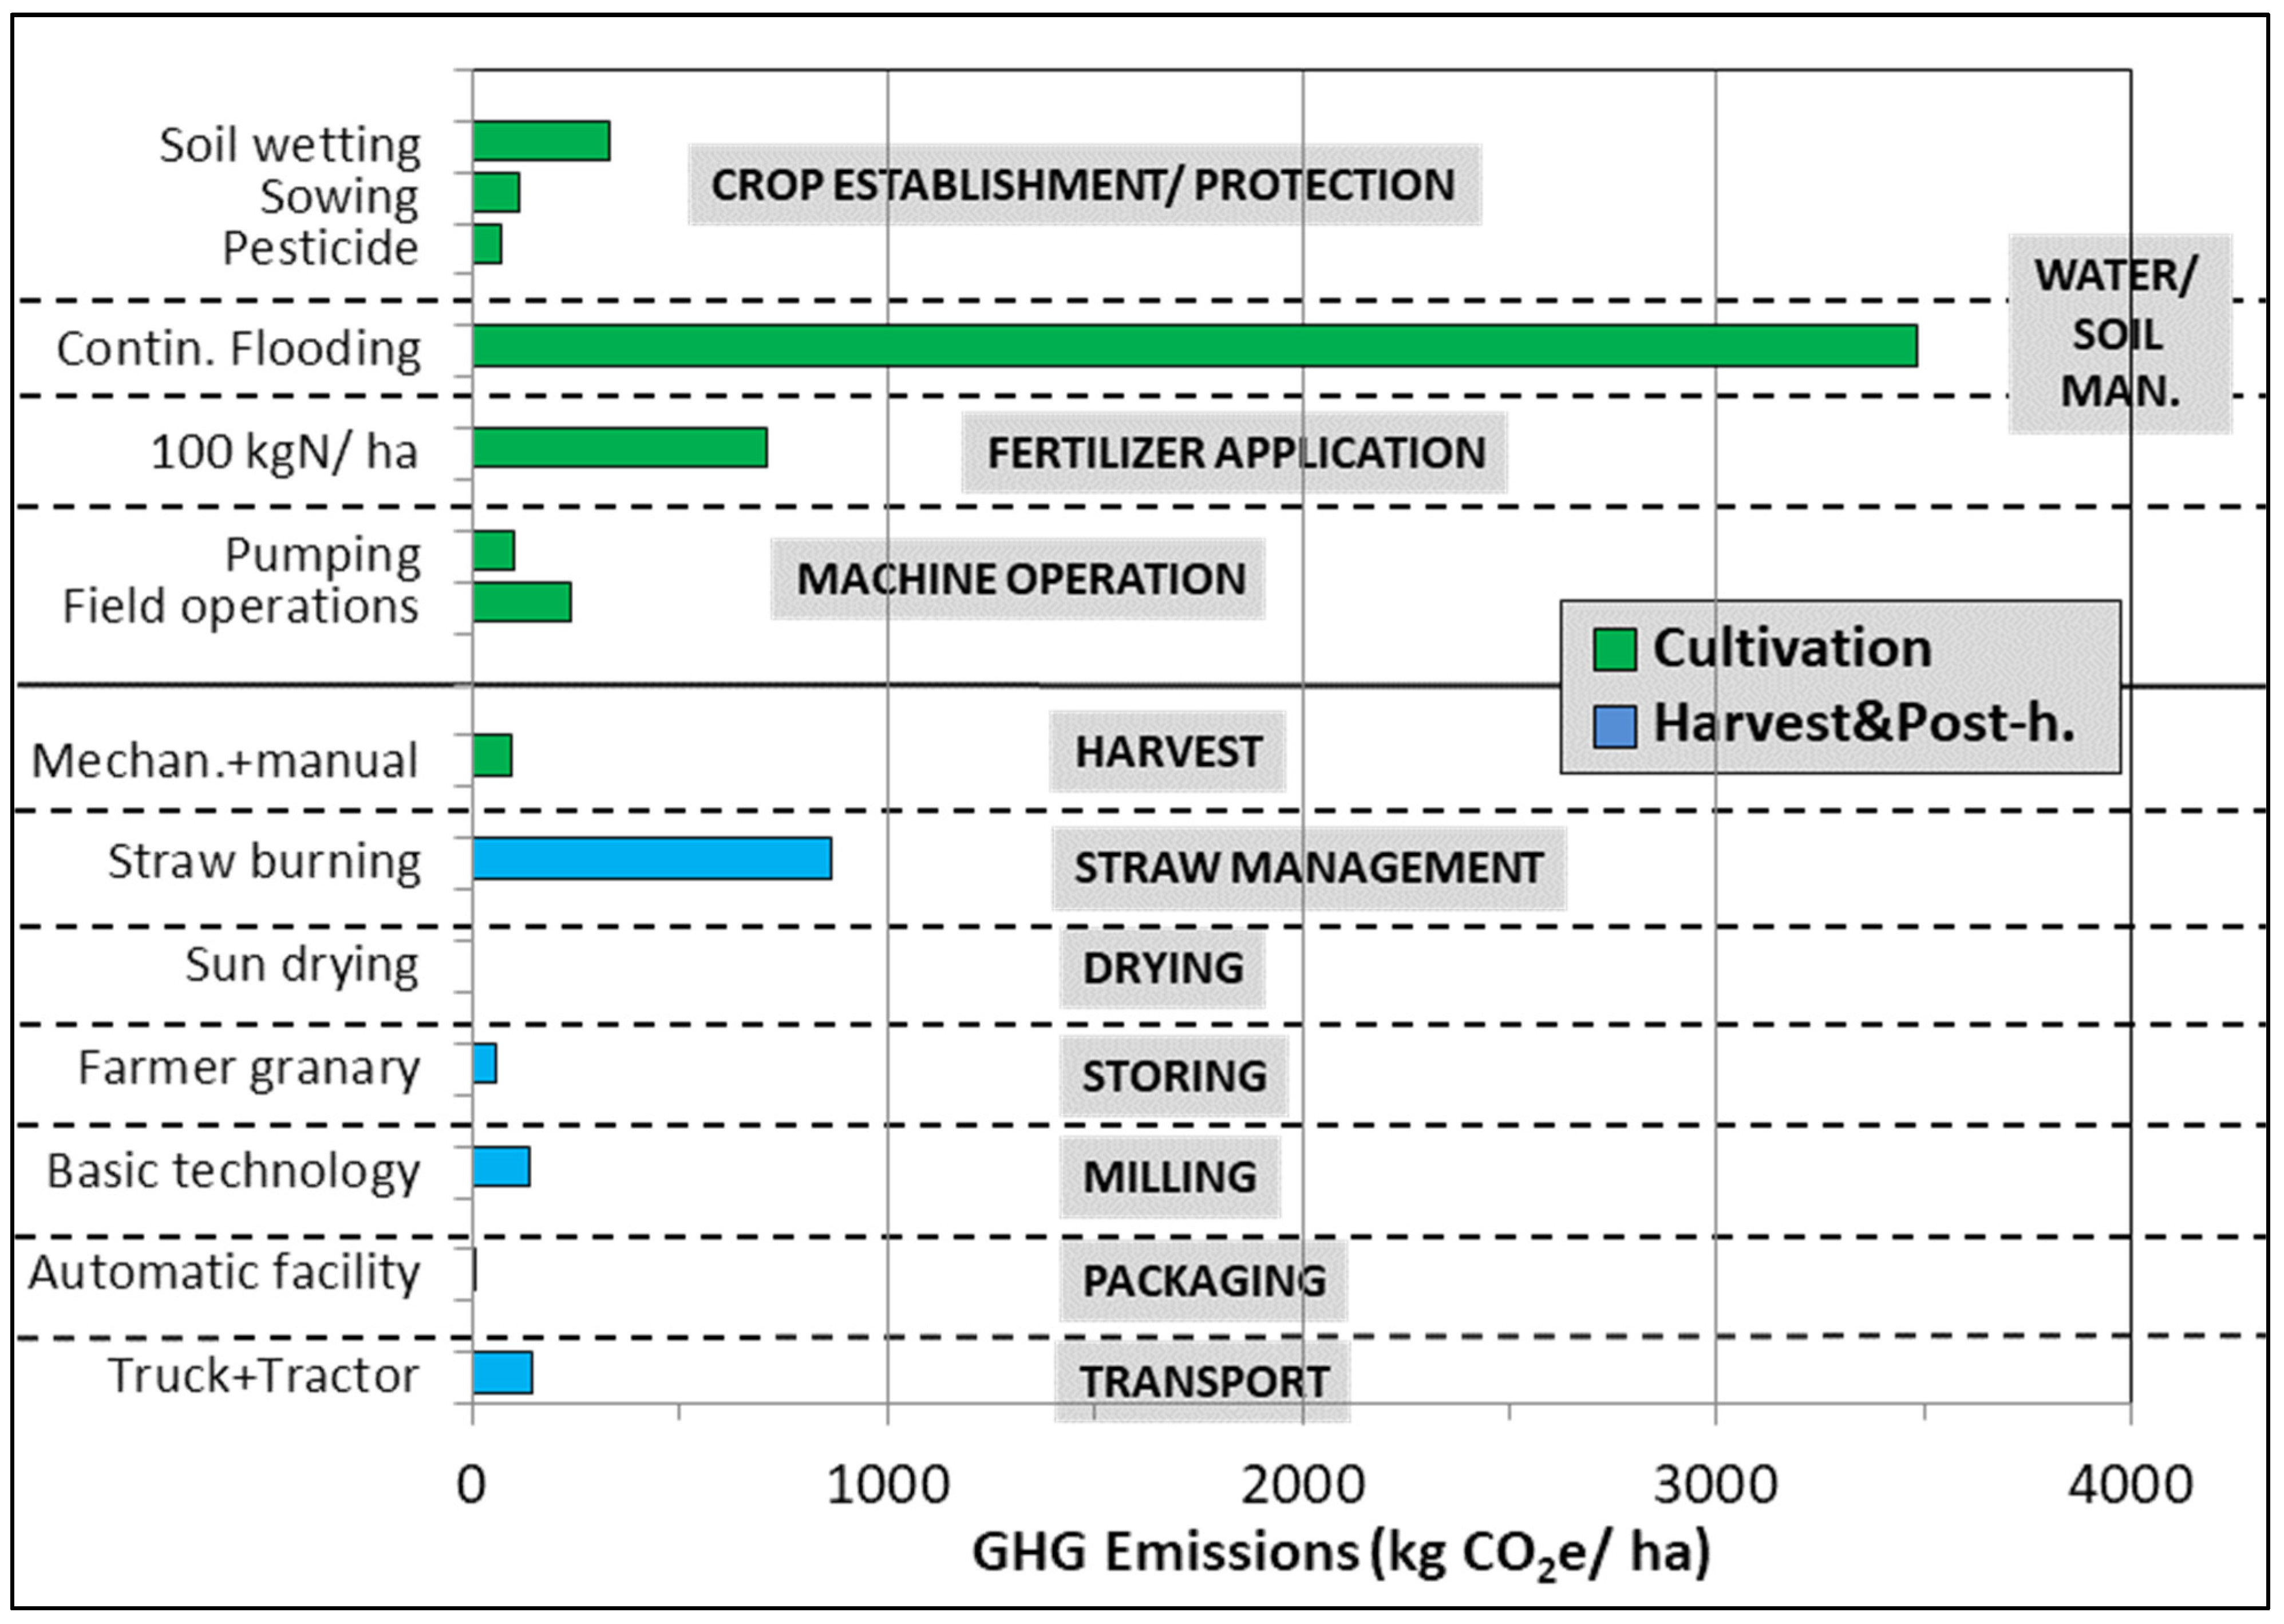
3.3. Scenario Assessment and Contributions by Different GHGs

The technological settings of the scenarios considered in this study are given in Table 2 while Figure 4 shows their product-specific GHG emissions, product quantities and CFs. These settings were selected to reflect the range of CF values under present-day technologies in the regional context of Southeast-Asia. In the baseline scenario, the total CF was 2268 g CO2e/kgProd. While the share of N2O was very small (2.2%) under continuous flooding (Figure 4), the bulk of GHG emissions derives from 54.1% of CH4 and 43.6% of CO2. As a first comparison (Figure 4), we have assessed the increment in CO2- emissions and CF in the case of transcontinental export. Using CF-Rice, the calculated values of an export of rice to Europe (9000 km of ship transport) correspond to an 8.6% increase of both the total GHG emissions and CFs as compared to the baseline scenario for a domestic market.
The water-saving scenario encompasses an irrigation technique termed as “multiple drainage” in the IPCC guidelines [9] and often referred to as “alternate wetting and drying”. This approach has a proven track record to substantially reduce methane emissions [28,29], but with the use of CF-Rice we could also quantify the impact over the entire value chain and thus, highlight a 26.2% reduction of CFs at the product level. N2O emissions from fertilizer application are higher under multiple drainage techniques (in line with the new IPCC Guidelines of 2019) and account for 4.9% of the total, but that does not impair the overall reduction of GHG emissions and CFs through the use of multiple drainage techniques. This mitigation effect can further be enhanced up to 33.9% which is shown in the low-carbon scenario. As can be seen in Figure 4, the cause for lower CFs derives from higher product recovery rates of advanced post-harvest technologies. The low-carbon scenario also assumed site-specific N-fertilizer management which can reduce N-rates by up to 20% without yield losses [30].
We also considered one scenario with the incorporation of straw into the soil that increases the CF value by 28.4% as compared to the baseline. This scenario corresponds to an initial stage of the mechanization trends in Southeast Asia which typically start with the use of heavy tractors and combine harvesters (resulting in 11.3% higher QProd). With this type of machinery, the rice straw is scattered on the soil surface after harvest and often plowed into the soil. Soil amendments of organic carbon such as rice straw inherently enhance the CH4 emissions from flooded fields. In a strict sense, these emissions will occur in the ensuing cultivation period, but for better comparison we considered a continuous straw incorporation over consecutive cultivation periods. Given the low N content of straw (< 1%), straw alone will not suffice to replace fertilizers that achieve high yields and must be accompanied by chemical fertilizers. In this scenario, we assumed soil incorporation of 70% of the available straw pool (2.1 t/ha) alongside a 10% reduction of the chemical N fertilizer (Table 2).
The scenario with the incorporation of fresh straw also encompassed the use of a combine harvester instead of the baseline technology of manual cutting and mechanical threshing. This technology change explains the higher product output (Figure 4b). Derived from the IPCC algorithm, the straw incorporation almost doubled (SFo = 1.95) CH4 emissions:
SFo = (1 + ROA × CFOA)0.59
While ROA and CFOA represent the rate and conversion factor of organic amendments, respectively, we have slightly modified this equation to allow for the parallel assessment of straw incorporation and other organic amendments by separating between ROAStraw and CFOAStraw as well as ROAAdd_Org and CFOAAdd_Org (see Table 1). These types of amendments, however, should not be confused with the incorporation of stubbles into the soil which is considered in the IPCC Guidelines as part of the pre-season management, i.e., SFpre = 1 entails the soil incorporation of shallow stubbles [10]. ROAStraw is given in dry weight (moisture content is approximately 20%) while CFOAStraw depends on the interval between soil incorporation and flooding. The incremental effect of straw on CH4 emissions can be reduced through a one month offset (“mulching”) before soil incorporation, which results in SFo = 1.22 under baseline settings.

3.4. Independent Validation through Other Calculation Tools

One of the main rationales for CF-Rice was the lack of a comprehensive tool to cover the CF of rice throughout all stages of the value chain. Thus, the validation with independent sources had to be derived from several calculation tools as compiled in Table 3 for selected stages. The Cool Farm Tool (CFT) was developed as a GHG calculator at the farm level [31] and has in the meantime been expanded for assessments of water and biodiversity. CFT is available as an online tool and was designed for use by farmers and the companies they supply to quantify their agricultural CF. The EX-ACT tool is an excel-based tool developed by the Food and Agriculture Organization of the United Nations (FAO) for estimating the impacts of agriculture and forestry development projects [32]. While the focus is on land use change, the tool settings can also be adjusted to address GHG emissions from a steady-state cropland, i.e., recurrent rice production in a given cropping season. FAO has also released an expanded EX-ACT tool covering the entire value chain of food production (EX-ACT_VC).
The results for soil/water management and fertilizer application reflect the almost identical input parameters used by CF-Rice, CFT and EX-ACT. Given the significance of this stage, we also compared the emissions under the water-saving scenario computed by CF-Rice and the other tools. Smaller deviations in the calculated results can be attributed to sourcing the data from different versions and chapters of the IPCC guidelines of 2006 [9] and 2019 [10], respectively (see Table 3 for details). In terms of straw burning, CF-Rice uses a higher emission factor than that of CFT which uses a global average for a wide range of crops. This new value was derived from a combustion experiment emulating open field burning of rice straw under typical moisture condition found in a tropical climate [17].
The inter-comparison of post-harvest processes is more intricate than for the cultivation stages, because these activities are addressed in very generic forms under the chapters for energy and industry in the IPCC guidelines [10]. Although GHG emissions of post-harvest processes are generally low, we selected one stage (milling) to compare the results obtained by CF-Rice versus EX-ACT_VC. To this end, the user must enter process-specific data on energy conversion and product loss rates into the EX-ACT_VC software as well as data on the product quantity. As it is not clear if the latter should include by-products, we have calculated this value for all options, i.e., inclusion of by-products, inclusion of value-adjusted byproducts and exclusion of by-products (Table 3). Under baseline settings, milling accounts for 102 kg CO2e/ha according to CF-Rice while entering a conversion rate of 30 kWh per ton of product into EX-ACT_VC resulted in 80 to 118 kg CO2e for the reference flow starting with 5 t of harvested paddy. These comparable ranges in the results can be seen as a confirmation of the coherent calculation in CF-Rice.

3.5. Literature Review of Carbon-Footprints Calculated for Rice Products

We conducted a systematic literature search for the terms “rice” and “carbon footprint” that resulted in 72 hits (as of 2021); however, many of these studies were based on methodologies that substantially deviated from our approach—and in many cases even from the ISO-definition of CF—which impaired a meaningful comparison to our study:
  • Less than 10% of studies considered only GHG emissions of resource inputs resulting in relatively low CFs (e.g., [33,34]).
  • About a third of the published studies considered GHG emissions at the field level but omitted those along the post-harvest activities (e.g., [35,36])
  • More than half of the published studies considered GHG emissions along the full rice value chain (“from farm to shelf”) in line with the ISO definition. Many of these publications, however, show substantial differences as compared to the calculation procedure in our study, e.g., the use of distinctly high emission factors in studies leading to CFs from 3 to 6.4 kg CO2e/kgProd [37,38].
After narrowing down the literature database, we compiled 14 references (Table 4) for an inter-comparison of our CF assessment. While the CF baseline resulted in 2268 g CO2e/kgProd, the CF range was, depending on the scenario, from 1449 to 2838 g CO2e/kgProd. A previous meta-analysis of the published data on rice published until the year 2015 resulted in a mean CF of 2660 gCO2e/kgProd ranging from 660 to 5690 CO2e/kgProd [39].
The variation in the CF values can be attributed to a range of different factors and may warrant a more detailed compilation of a comprehensive meta-analysis in the future. Obviously, emissions will differ according to practices and technologies, the differences in yield levels are likely to act as a major driver of the wide range of CF values (see below). Due to their reciprocal relationship, higher yield levels will translate into lower CFs—unless this trend is superseded by higher resource inputs and their subsequent GHG increments.

4. Conclusions

The distinctive features of CF-Rice as compared to generic LCA tools are as follows:
  • In its current version, CF-Rice exclusively deals with the value chain of rice products which obviously limits the potential user group compared to those with specific interest in this commodity. At the same time, however, this focus on one of the most important cropping systems with high mitigation potential still targets a sizable number of potential users who will be encouraged by an easy selection of data inputs and free access to the tool.
  • Given the focus on rice, we have systematically searched the literature and other open access sources to compile a comprehensive library of available CF data on the different technologies deployed in rice value chains. This technology library is embedded in the tool and encompasses empirical evidence on multiple processing options for harvest and postharvest actions that has recently been published and, thus, constitutes an update on the currently available database on rice.
  • CF-Rice allows a detailed consideration of stage-specific recovery rates. In turn, the important role of yield losses for determining CFs can be assessed in much more detail.
  • The CF-Rice database can be expanded by the user by adding adjusted GHG data and recovery rates from new literature sources or their own measurements. This capability broadens the versatility of using CF-Rice within any given geographical context as well as a being a tool for decision-making support, e.g., on identifying suitable investments to reduce CFs.
The impact of different technologies on CFs is shown in our scenario analysis. In order to produce low-carbon rice, special emphasis has to be given to (i) water-saving techniques and (ii) advanced technologies that reduce food losses. The beneficial effect of water-saving has previously been shown for field emissions, but our study set this into the perspective of the overall emissions from the entire value chain and thus, a 27.4% reduction of the CF of the rice product. Considering further improvements in post-harvest technologies, we arrived at a benchmark of 37.3% reduction for low-carbon rice. It should be noted though that this effect is derived from currently available technologies that are in principle ready for upscaling (e.g., bubble drier, integrated milling facilities, etc.). As for the future, the mitigation effect could further be enhanced if more advanced technologies such as straw baling as well as laser levelling of the soil surface are mainstreamed into the development of rice farming systems.
In terms of the different straw management options, soil incorporation is obviously a preferred practice over field burning due to air pollution and human health factors, but incorporation comes with the caveat of high CH4 emissions in the ensuing cropping season. To some extent, these incremental emissions can be reduced by the mulching of straw and water-saving techniques, but nevertheless this will not lead to a reduction in CFs as compared to the baseline. In turn, the best management option is straw removal from the field which is only economically viable using mechanized baling which is not yet practiced in Southeast Asia.
The computed baseline by CF-Rice represents a moderately high value as compared to the entirety of those published CF values that are based on comparable methodologies (Table 4). In this study, the CF values ranged by a factor of 2 from the lowest to highest scenario which is less than the range reflected in the literature data. However, this result must be viewed against the backdrop that all scenarios considered had an identical yield level. In turn, the actual variations of CFs will be more pronounced due to the inherent differences in agronomic performances of rice production across different scales. In Southeast Asia, even the national rice yield averages range from <4 t/ha (Timor Leste, Cambodia and Myanmar) to >5 t/ha (Indonesia and Vietnam) [53]. Although not part of our study, it might also be interesting in this context that the published CFs of other cereals, namely, maize and wheat, are less than half of the CFs calculated for rice [2,39]. This relatively high background level makes rice products an especially promising target for future technology advances and investments to reduce food-related GHG emissions [54,55].

Author Contributions

Conceptualization, R.W., K.M.N. and B.O.S.; methodology, N.V-H., S.H.G., B.T.Y., M.G. and R.W.; software, B.T.Y.; validation, N.V.-H., B.T.Y. and R.W.; formal analysis, R.W.; investigation, R.W., N.V.-H., B.T.Y. and S.H.G.; resources, B.O.S.; data curation, R.W., N.V.-H. and B.T.Y.; writing—original draft preparation, R.W. and K.M.N.; writing—review and editing, R.W., K.M.N. and B.O.S. All authors have read and agreed to the published version of the manuscript.

Funding

This work was supported by the CGIAR Research Program on Rice (http://ricecrp.org/, accessed on 19 December 2021) and the CGIAR Research Program on Climate Change, Agriculture and Food Security (CCAFS) (https://ccafs.cgiar.org, accessed on 19 December 2021) which is carried out with support from CGIAR Trust Fund Donors and through bilateral funding agreements. For details please visit https://ccafs.cgiar.org/donors, accessed on 19 December 2021. Further support was provided by the Climate and Clean Air Coalition to Reduce Short-lived Climate Pollutants (CCAC) (ccacoalition.org) under project CCAC, DTIE14-EN040. The views expressed in this document cannot be taken to reflect the official opinions of these organizations.

Institutional Review Board Statement

Not applicable.

Informed Consent Statement

Not applicable.

Data Availability Statement

Download of tool and User Manual at https://ghgmitigation.irri.org/knowledge-products/mrv-toolbox/cf-rice accessed on 19 December 2021; data can be obtained from given literature sources.

Acknowledgments

We acknowledge the contributions to the tool development by R. Pasco, a consultant of IRRI.

Conflicts of Interest

The authors declare no conflict of interest.

Appendix A

Table A1. Mathematical equations and underlying assumptions for calculating GHG emissions, products and by-product quantities as well as CFs.
Equation Cluster (I) Calculating the base quantity
Assumptions:
  • Yield data is typically available as the amount of “harvested yield” (in tPaddy/ha) which has to be adjusted to the industrial standard of 14% moisture content.
  • If the actual moisture content at harvest is not available, CF-Rice provides default values for dry and wet weather conditions.
  • The stage-specific product recovery rate (or loss rate) at harvest is used to recalculate the quantity of grain in the field (prior to harvest) which is later needed to account for total losses (Cluster 5).

(Ia) QBase = YHarv × (1 − MC)/(1 − 0.14)/PRRHarv   Insert Equ. Ib
= YHarv × (1 − MC)/(1 − 0.14)/(1-LHarv)
(Ib) PRRHarv = 1 − LHarv
In which,
QBase = quantity of paddy in the field before harvesting (normalized to 14% moisture content),
YHarv = yield of harvested (wet) paddy,
PPRHarv; LHarv = Stage-specific product recovery rate and loss rate at harvest,
MC = moisture content of harvested (wet) paddy
Equations Cluster (II) Selecting stage-specific recovery/loss rates and determining product and grain quantities
Assumptions:
  • The losses along the value chain occur at the stages of harvest, drying, storing and milling. In turn, only these stages have a specific product recovery rate (PRR) whereas all other stages have an assumed PRR of 1 (corresponding to zero losses).
  • The users of CF-Rice will typically be more familiar with loss rates (instead of recovery rates), so those are used as input parameters in the software operation.
  • Milling also generates by-products which are considered separately from losses.
  • As there are effectively no more food losses after milling, there is no need to define QMill which corresponds to QProd.

(IIa) QProd = QBase × PRRHarv × PRRDry × PRRStor × PRRMill   insert Equ. IIb,c,d
= QBase × (1 − LRHarv) × (1 − LDry) × (1 − LSto) × (1 − LMill − CRHusk − CRBran)
(IIb) PRRDry = 1 − LDry   (IIc) PRRStor = 1 − LSto
(IId) PRRMill = 1 − LMill − CRHusk − CRBran
In which,
PRRDry; PRRStor; PRRMill = stage-specific product recovery rates for drying, storing and milling,
LDry; LStor; LMill = stage-specific loss rates for drying, storing and milling,
CRHusk; CRBran = commodity rate of husk and bran at milling,
QProd = product quantity available in the market.
Equations Cluster (III) Calculating quantities of by-products followed by value-adjustment
Assumptions:
  • CF-Rice considers three types of by-products and their respective commodity rate, namely, straw (CRStraw) generated at the stage of straw management as well as husk (CRHusk) and bran (CRBran) generated at milling.
  • If straw is not traded as commodity, then CRStraw = 0.
  • If straw is traded as commodity, then the quantity will be derived from harvest index (default = 0.6).
  • The amounts of by-products are multiplied by value-adjustment factors (VaFStraw, VaFHusk, VaFBran) to account for their economic value as compared to the rice product.
  • The value-adjusted by-products have the unit of product equivalents and are added to the product quantity to account for the total quantity.

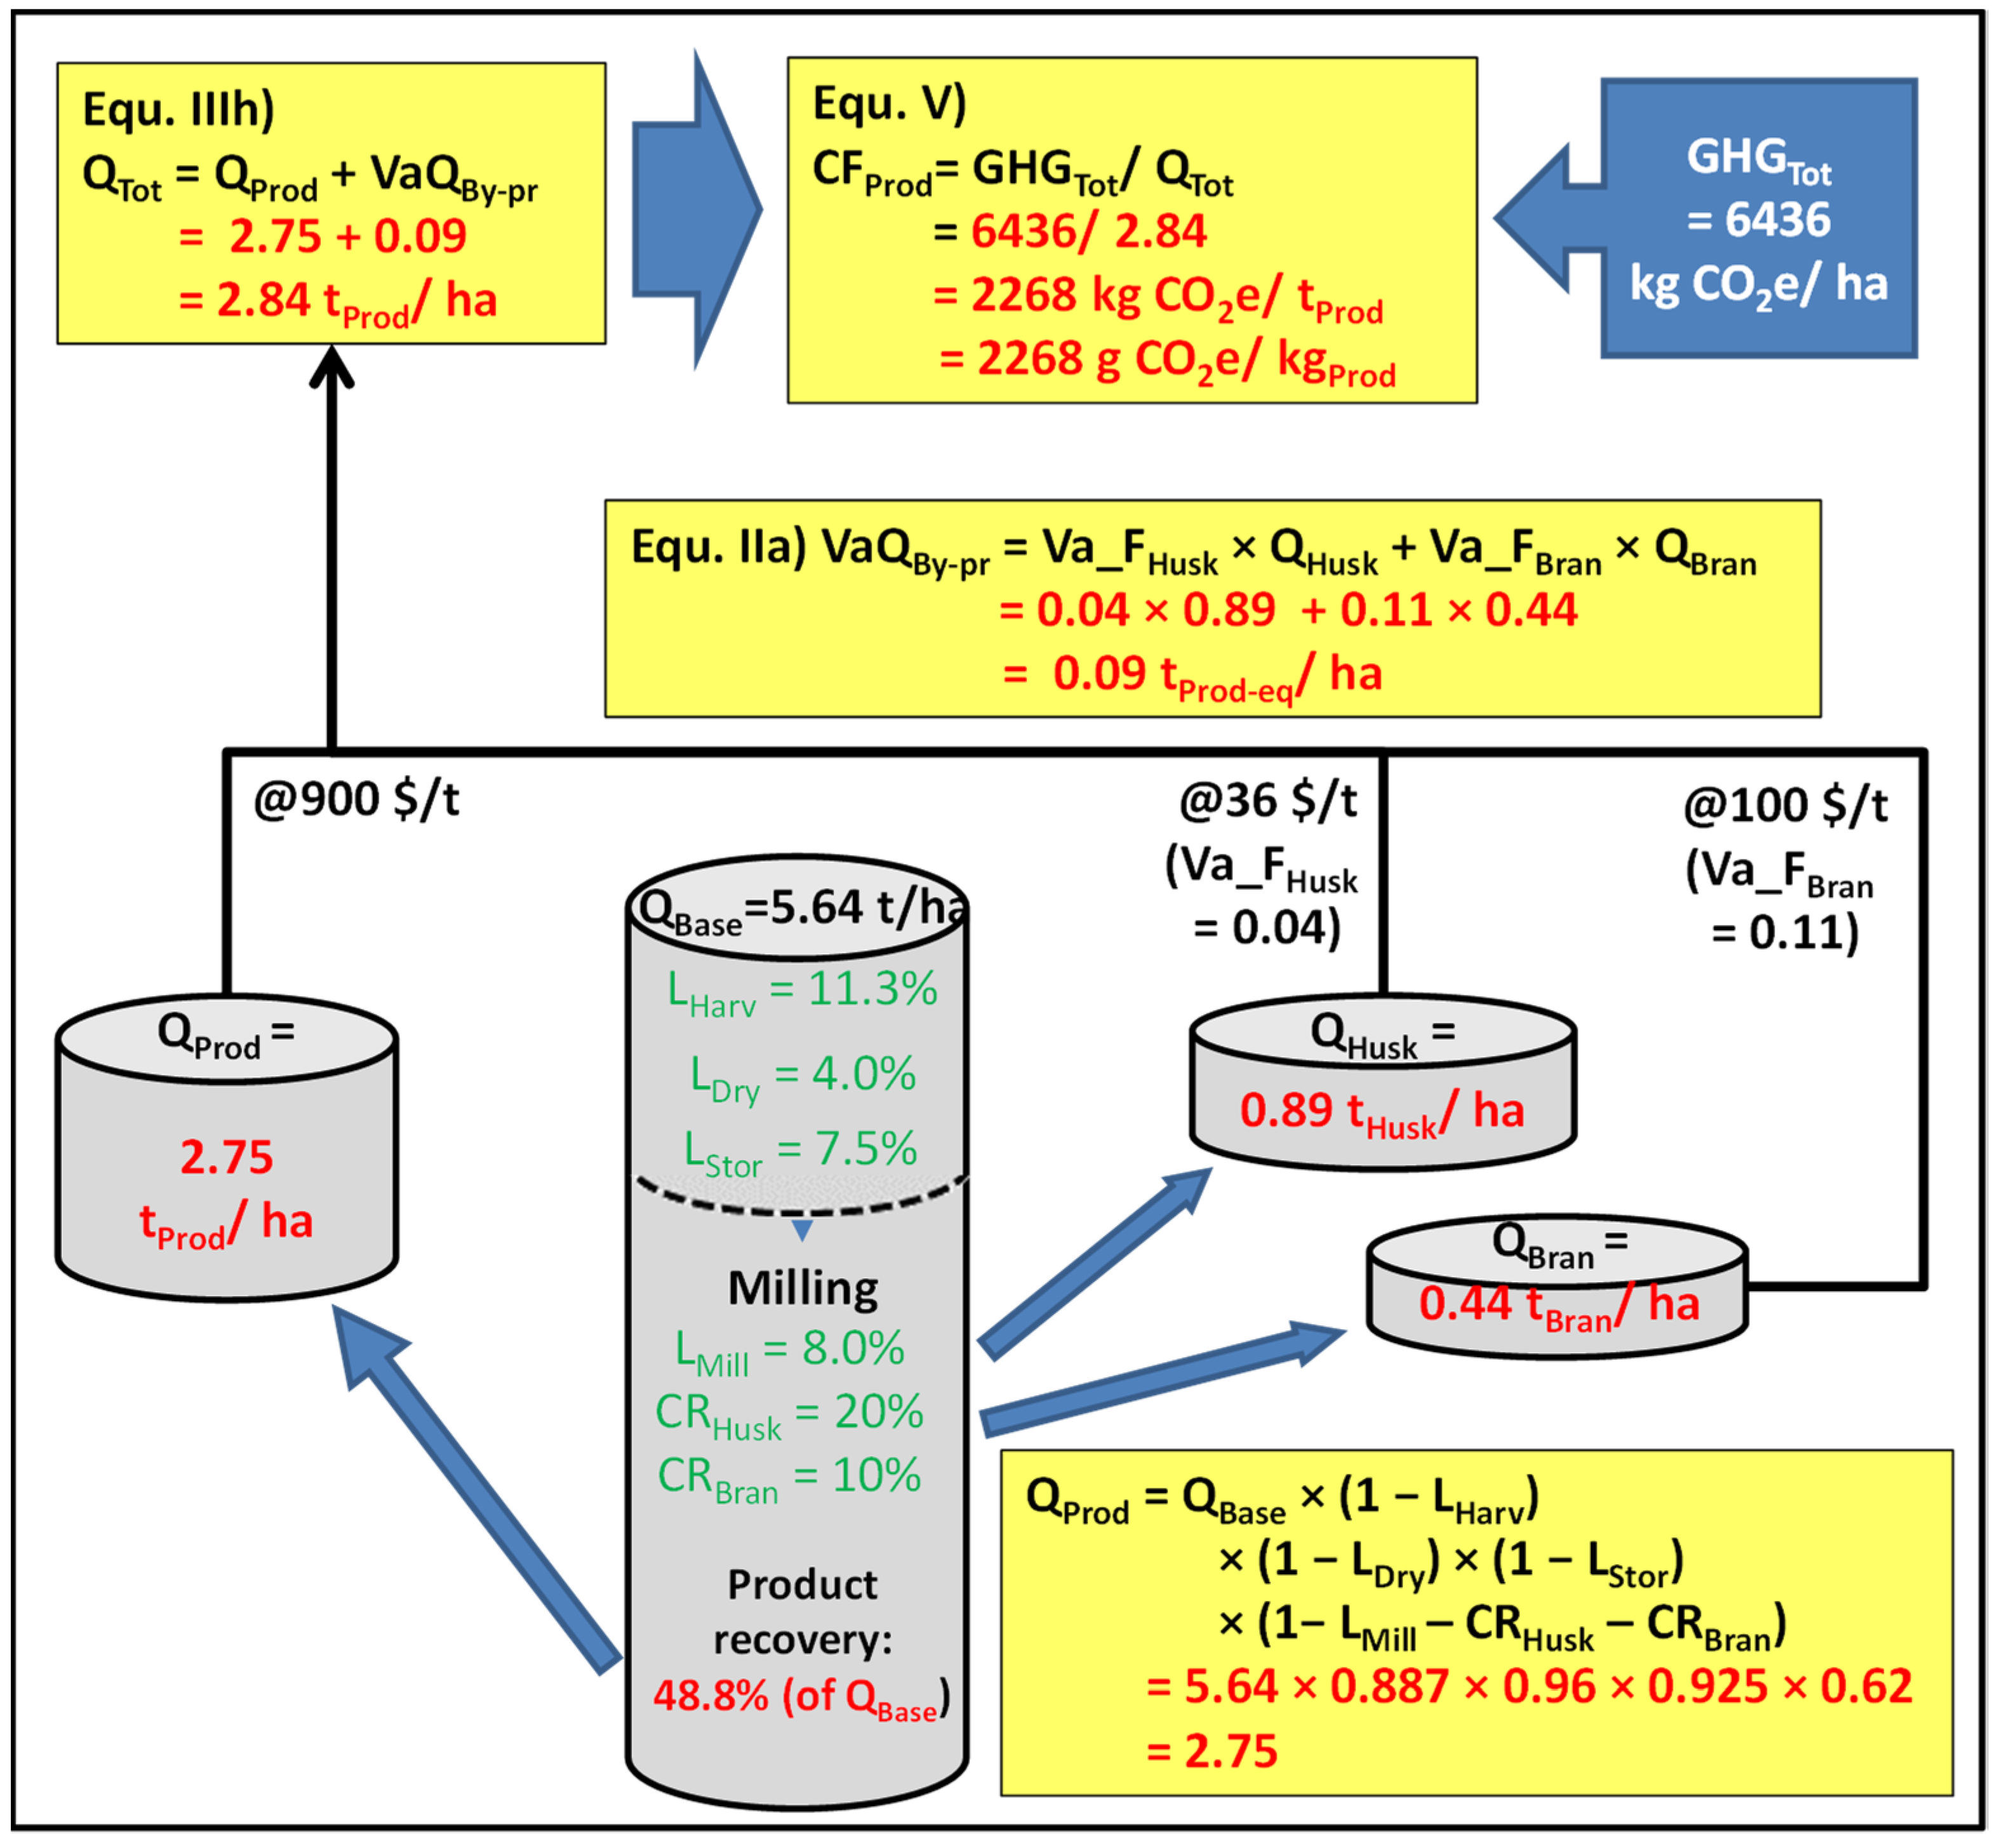
(IIIa) VaQBy-pr = VaQStr_com + VaQHusk + VaQBran   Insert Equ. IIIb, IIId, IIIf
= QBase × CRStr_com × Va_FStr_com + QStor × (CRHusk × Va_FHusk+ CRBran × Va_FBran)
(IIIb) VaQStr_com = QStr_com × Va_FStr_com   Insert Equ. IIIc
= QBase × CRStr_com × Va_FStr_com
(IIIc) QStr_com = QBase × CRStr_com
(IIId) VaQHusk = QHusk × Va_FHusk   Insert Equ. IIIe
= QStor × CRHusk × Va_FHusk
(IIIe) QHusk = QSto × CRHusk
(IIIf) VaQBran = QBran × Va_FBran   Insert Equ. IIIg
= QStor × CRBran × Va_FBran
(IIIg) QBran = QSto × CRBran
(IIIh) QTot = QProd + VaQBy-pr
In which,
VaQStr_com; VaQHusk; VaQBran; VaQBy-pr = value-adjusted quantities of straw (if traded as commodity), husk, bran and all by-products,
QStraw_com; QHusk; QBran; QBy-pr = absolute quantities of straw (if traded as commodity), husk, bran and all by-products,
Va_FStraw; Va_FHusk; Va_FBran = value adjustment factors of straw (if traded as commodity), husk, bran,
CRStraw = commodity rate of straw (if traded as commodity),
QTot = total quantity (products and value-adjusted by-products),
QProd = product quantity.
Equations Cluster (IV) Calculating CO2-, CH4- and N2O- emissions for each stage
Assumptions:
  • CF-Rice calculates the CO2-, CH4- and N2O- emissions separately for each stage of the value chain (see Table 1 for GHG equations and acronyms of stages).

(IVa) GHGCEP = CO2CEP + CH4CEP   (IVb) GHGWSM = CH4WSM
(IVc) GHGFer = N2OFer + CO2Fer   (IVd) GHGMO = CO2MO
(IVe) GHGHarv = CO2Harv   (IVf) GHGStraw = CO2Straw + CH4Straw
(IVg) GHGDry = CO2Dry IVh) GHGSto = CO2Sto   (IVi) GHGMill = CO2Mill
(IVj) GHGPk = CO2Pk   (IVk) GHGTr = CO2Tr
In which,
GHGCEP; GHGWSM; GHGFer; … GHGTr = stage-specific GHG emissions,
CO2CEP; CO2Fer; CO2MO; … CO2Tr = stage-specific CO2- emissions,
CH4CEP; CH4WSM; CH4Straw = stage-specific CH4 emissions,
N2OFer = stage-specific N2O- emissions (only fertilizer application).
Equations Cluster (V) Aggregating GHG emissions for CO2, CH4 and N2O as well as for stages
Assumptions:
  • CF-Rice adds up emissions per GHG as well as per stage, so that the total value corresponds to both, the sum of GHG-specific emissions (equ. Vd) as well as stage-specific emissions (equ. Ve),
(Va) CO2Tot = CO2CEP + CO2Fer + CO2MO + CO2Harv + CO2Dry + CO2Sto + CO2Mill + CO2Pk
+ CO2Tr
(Vb) CH4Tot = CH4CEP + CH4WSM + CH4Straw
(Vc) N2OTot = N2OFer
(Vd) GHGTot = CO2Tot + CH4Tot + N2OTot
(Ve) GHGTot = GHGCEP + GHGWSM + GHGFer + GHGMO + GHGHarv + GHGStraw + GHGDry
+ GHGSto + GHGMill + GHGPk + GHGTr
In which,
CO2Tot; CH4Tot; N2OTot = total emissions of CO2, CH4 and N2O, respectively,
GHGTot = total GHG emissions.
Equations Cluster (VI) Calculating CF
Assumptions:
  • The equation for the CF follows the ISO-definition, namely, total GHG emission divided by quantity of the functional unit, but also considers value-adjusted by-products,

(VI) CFProd = GHGTot/QTot   Insert Equ. IIIf
= GHGTot/(QProd + vQBy-pr)
In which,
CFProd = CF of product.
Figure A1. Illustration of input format of CF-Rice; the GUI input window is shown for the stage of water/ soil management with opened drop-down menu for water management.
Sustainability 14 00315 g0a1
Figure A2. Illustration of output formats of CF-Rice comprising data inputs and outputs in alpha-numerical form as well as graphical presentations of the results including a scale of reported literature values of rice CFs (green = low end, red = high end) with a mark for the calculated value.
Sustainability 14 00315 g0a2

References

  1. Porter, J.; Howden, M.; Smith, P. Considering agriculture in IPCC assessments. Nat. Clim. Chang. 2017, 7, 680–683. [Google Scholar] [CrossRef] [Green Version]
  2. Poore, J.; Nemecek, T. Reducing food’s environmental impacts through producers and consumers. Science 2018, 360, 987–992. [Google Scholar] [CrossRef] [Green Version]
  3. Hjorth, T.; Huseinovic, E.; Hallström, E.; Strid, A.; Johansson, I.; Lindahl, B.; Sonesson, U.; Winkvist, A. Changes in dietary carbon footprint over ten years relative to individual characteristics and food intake in the Västerbotten Intervention Programme. Sci. Rep. 2020, 10, 20. [Google Scholar] [CrossRef]
  4. Clark, M.A.; Domingo, N.G.G.; Colgan, K.; Thakrar, S.K.; Tilman, D.; Lynch, J.; Azevedo, I.L.; Hill, J.D. Global food system emissions could preclude achieving the 1.5° and 2 °C climate change targets. Science 2020, 370, 705–708. [Google Scholar] [CrossRef] [PubMed]
  5. Wassmann, R. Environmental Footprints of Modernization Trends in Rice Production Systems of Southeast Asia; Oxford Research Encyclopedia of Environmental Science; Oxford University Press: Oxford, UK, 2019. [Google Scholar] [CrossRef]
  6. Seck, P.A.; Diagne, A.; Mohanty, S.; Wopereis, M.C.S. Crops that feed the world 7: Rice. Food Secur. 2012, 4, 7–24. [Google Scholar] [CrossRef]
  7. Smith, P.; Clark, H.; Dong, H.; Elsiddig, E.A.; Haberl, H.; Harper, R.; House, J.; Jafari, M.; Masera, O.; Mbow, C.; et al. Agriculture, Forestry and Other Land Use (AFOLU). In Climate Change 2014: Mitigation of Climate Change. Contribution of Working Group III to the Fifth Assessment Report of the Intergovernmental Panel on Climate Change; Edenhofer, O., Pichs-Madruga, R., Sokona, Y., Farahani, E., Kadner, S., Seyboth, K., Adler, A., Baum, I., Brunner, S., Eickemeier, P., et al., Eds.; Cambridge University Press: Cambridge, UK; New York, NY, USA, 2014. [Google Scholar]
  8. Roe, S.; Streck, C.; Beach, R.; Busch, J.; Chapman, M.; Daioglou , V.; Deppermann, A.; Doelman, J.; Emmet-Booth, J. Contribution of the land sector to a 1.5 °C world. Nat. Clim. Chang. 2021, 9, 817–828. [Google Scholar] [CrossRef]
  9. IPCC (Intergovernmental Panel on Climate Change). 2006 IPCC Guidelines for National Greenhouse Gas Inventories; Eggleston, H.S., Buendia, L., Miwa, K., Ngara, T., Tanabe, K., Eds.; Institute for Global Environmental Studies (IGES): Hayama, Japan, 2006. [Google Scholar]
  10. IPCC (Intergovernmental Panel on Climate Change). Refinement to the 2006 IPCC Guidelines for National Greenhouse Gas Inventories; Calvo Buendia, E., Tanabe, K., Kranjc, A., Baasansuren, J., Fukuda, M., Ngarize, S., Osako, A., Pyrozhenko, Y., Shermanau, P., Federici, S., Eds.; IPCC: Geneva, Switzerland, 2019. [Google Scholar]
  11. SRP—Sustainable Rice Platform. Sustainable Rice Platform Performance Indicators for Sustainable Rice Cultivation (Version 2.1). Bangkok. 2019. Available online: https://www.sustainablerice.org/wp-content/uploads/2021/10/203-SRP-Performance-Indicators-Version-2.1.pdf (accessed on 19 December 2021).
  12. Van Hung, N.; Migo, M.V.; Quilloy, R.; Chivenge, P.; Gummert, M. Life cycle assessment applied in rice production and residue management. In Sustainable Rice Straw Management; Gummert, M., van Hung, N., Chivenge, P., Douthwaite, B., Eds.; Springer Nature: Berlin/Heidelberg, Germany, 2020; pp. 161–174. [Google Scholar] [CrossRef] [Green Version]
  13. Janz, B.; Weller, S.; Kraus, D.; Racela, H.S.; Wassmann, R.; Butterbach-Bahl, K.; Kiese, R. Greenhouse gas footprint of diversifying rice cropping systems: Impacts of water regime and organic amendments. Agric. Ecosyst. Environ. 2019, 270-271, 41–54. [Google Scholar] [CrossRef]
  14. Van Hung, N.; Sander, B.O.; Quilty, J.; Balingbing, C.; Castalone, A.G.; Romasanta, R.; Alberto, M.C.R.; Sandro, J.M.; Jamieson, C.; Gummert, M. An assessment of irrigated rice production energy efficiency and environmental footprint with in-field and off-field rice straw management practices. Sci. Rep. 2019, 9, 16887. [Google Scholar] [CrossRef]
  15. Mainuddin, M.; Kirby, M. Spatial and temporal trends of water productivity in the lower Mekong River Basin. Agric. Water Management. 2009, 96, 1567–1578. [Google Scholar] [CrossRef]
  16. Gummert, M.; Hung, N.V.; Cabardo, C.; Quilloy, R.; Aung, Y.L.; Thant, A.M.; Kyaw, M.A.; Labios, R.; Htwe, N.M.; Singleton, G.R. Assessment of post-harvest losses and carbon footprint in intensive lowland rice production in Myanmar. Sci. Rep. 2020, 10, 19797. [Google Scholar] [CrossRef]
  17. Romasanta, R.R.; Sander, B.O.; Gaihre, Y.K.; Alberto, M.C.; Gummert, M.; Quilty, J.; Castalone, A.G.; Balingbing, C.; Sandro, J.; Correa, T., Jr.; et al. How does rice straw burning compare with other straw management practices in terms of on-field CH4 and N2O emissions? A comparative field experiment. Agric. Ecosyst. Environ. 2017, 239, 143–153. [Google Scholar] [CrossRef]
  18. RCB—Rice Knowledge Bank. Available online: http://www.knowledgebank.irri.org/step-by-step-production/postharvest (accessed on 19 December 2021).
  19. Grolleaud, M. Post-harvest losses: Discoverying the full story. In Overview of the Phenomenon of Losses during the Post-Harvest System; FAO, Agro Industries and Post-Harvest Management Service (AGSI): Rome, Italy, 2002; Available online: https://www.fao.org/3/ac301e/ac301e04.htm (accessed on 20 December 2021).
  20. Weidema, B.P.; Bauer, C.; Hischier, R.; Mutel, C.; Nemecek, T.; Reinhard, J.; Vadenbo, C.O.; Wernet, G. Overview and Methodology. Data Quality Guideline for the Ecoinvent Database Version 3; Ecoinvent Report 1(V3); The Ecoinvent Centre: St. Gallen, Switzerland, 2013; Available online: https://lca-net.com/files/Overview_and_methodology.pdf (accessed on 19 December 2021).
  21. Van Nguyen, H.; Nguyen, C.D.; van Tran, T.; Hau, H.D.; Nguyen, N.T.; Gummert, M. Energy efficiency, greenhouse gas emissions, and cost of rice straw collection in the Mekong river delta of Vietnam. Field Crop. Res. 2016, 198, 16–22. [Google Scholar] [CrossRef] [Green Version]
  22. Van Hung, N.; Tuan, T.V.; Meas, P.; Tado, C.J.M.; Kyaw, M.A.; Gummert, M. Best practices for paddy drying: Case studies in Vietnam, Cambodia, Philippines, and Myanmar. Plant Prod. Sci. 2018, 22, 107–118. [Google Scholar] [CrossRef]
  23. Mutert, E.; Fairhurst, T.H. Developments in rice production in Southeast Asia. Better Crops Int. 2002, 15, 12–17. [Google Scholar]
  24. IRRI International Rice Research Institute 2019. Regional Strategy for Southeast Asia. Available online: http://books.irri.org/SEA-Regional-Strategy-2020-2025-full.pdf (accessed on 19 December 2021).
  25. Kritee, K.; Nair, D.; Zavala-Araiza, D.; Proville, J.; Rudek, J.; Adhya, T.K.; Loecke, T.D.; Esteves, T.; Balireddygari, S.; Dava, O.; et al. High nitrous oxide fluxes from rice indicate the need to manage water for both long- and short-term climate impacts. Proc. Natl. Acad. Sci. USA 2018, 115, 9720–9725. [Google Scholar] [CrossRef] [Green Version]
  26. Wassmann, R.; Sander, B.O.; Yadav, S.; Bouman, B.; Singleton, G.; Stuart, A.; Hellin, J.; Johnson, D.; Hughes, J.; Butterbach-Bahl, K.; et al. New records of very high nitrous oxide fluxes from rice cannot be generalized for water management and climate impacts. Proc. Natl. Acad. Sci. USA 2019, 116, 1464–1465. [Google Scholar] [CrossRef] [PubMed] [Green Version]
  27. Jiang, Y.; Carrijo, D.; Huang, S.; Chen, J.; Balaine, N.; Zhang, W.; van Groenigen, K.J.; Linquist, B. Water management to mitigate the global warming potential of rice systems: A global meta-analysis. Field Crop. Res. 2019, 234, 47–54. [Google Scholar] [CrossRef]
  28. Carrijo, D.R.; Lundy, M.E.; Linquist, B.A. Rice yields and water use under alternate wetting and drying irrigation: A meta-analysis. Field Crop. Res. 2017, 203, 173–180. [Google Scholar] [CrossRef]
  29. Tirol-Padre, A.; Minamikawa, K.; Tokida, T.; Wassmann, R.; Yagi, K. Site-specific feasibility of alternate wetting and drying as a greenhouse gas mitigation option in irrigated rice fields in Southeast Asia: A synthesis. Soil Sci. Plant Nutr. 2017, 64, 2–13. [Google Scholar] [CrossRef]
  30. Buresh, R.J.; Castillo, R.L.; Torre, J.C.D.; Laureles, E.V.; Samson, M.I.; Sinohin, P.J.; Guerra, M. Site-specific nutrient management for rice in the Philippines: Calculation of field-specific fertilizer requirements by Rice Crop Manager. Field Crop. Res. 2019, 239, 56–70. [Google Scholar] [CrossRef]
  31. Hillier, J.; Walter, C.; Malin, D.; Garcia-Suarez, T.; Mila-I-Canals, L.; Smith, P. A farm-focused calculator for emissions from crop and livestock production. Environ. Model. Softw. 2011, 26, 1070–1078. [Google Scholar] [CrossRef]
  32. Grewer, U.; Bockel, L.; Galford, G.; Gurwick, N.; Nash, J.; Pirolli, G.; Wollenberg, E. A Methodology for Greenhouse Gas Emission and Carbon Sequestration Assessments in Agriculture: Supplemental Materials for Info Note Series Analyzing Low Emissions Agricultural Practices in USAID Development Projects. CCAFS Working Paper no. 187; Copenhagen, Denmark, 2016; Available online: https://cgspace.cgiar.org/bitstream/handle/10568/77767/Working%20Paper%20187%20Methodology%20for%20GHG%20emissions%20Nov%202016.pdf (accessed on 19 December 2021).
  33. Tseng, M.-C.; Roel, A.; Deambrosi, E.; Terra, J.; Zorrilla, G.; Riccetto, S.; Pittelkow, C.M. Towards actionable research frameworks for sustainable intensification in high-yielding rice systems. Sci. Rep. 2020, 10, 9975. [Google Scholar] [CrossRef]
  34. Wang, X.-L.; Wang, W.; Guan, Y.-S.; Xian, Y.-R.; Huang, Z.-X.; Feng, H.-Y.; Chen, Y. A joint use of emergy evaluation, carbon footprint and economic analysis for sustainability assessment of grain system in China during 2000–2015. J. Integr. Agric. 2018, 17, 2822–2835. [Google Scholar] [CrossRef]
  35. Arunrat, N.; Wang, C.; Pumijumnong, N. Alternative cropping systems for greenhouse gases mitigation in rice field: A case study in Phichit province of Thailand. J. Clean. Prod. 2016, 133, 657–671. [Google Scholar] [CrossRef]
  36. Carlsson-Kanyama, A. Climate change and dietary choices—How can emissions of greenhouse gases from food consumption be reduced? Food Policy 1998, 23, 277–293. [Google Scholar] [CrossRef]
  37. Mungkung, R.; Pengthamkeerati, P.; Chaichana, R.; Watcharothai, S.; Kitpakornsanti, K.; Tapananont, S. Life Cycle Assessment of Thai organic Hom Mali rice to evaluate the climate change, water use and biodiversity impacts. J. Clean. Prod. 2019, 211, 687–694. [Google Scholar] [CrossRef]
  38. Thanawong, K. Eco-efficiency of paddy rice production in Northeastern Thailand: A comparison of rain-fed and irrigated cropping systems. J. Clean. Prod. 2014, 73, 204–217. [Google Scholar] [CrossRef]
  39. Clune, S.; Crossin, E.; Verghese, K. Systematic review of greenhouse gas emissions for different fresh food categories. J. Clean. Prod. 2017, 140, 766–783. [Google Scholar] [CrossRef] [Green Version]
  40. Chen, Z.D.; Xu, C.C.; Ji, L.; Feng, J.F.; Li, F.B.; Zhou, X.Y.; Fang, F.P. Effects of multi-cropping system on temporal and spatial distribution of carbon and nitrogen footprint of major crops in China. Glob. Ecol. Conserv. 2019, 22, e00895. [Google Scholar] [CrossRef]
  41. Haq, M.E. Carbon Footprint of Selected Cereal and Legume Crops Cultivated in the Old Brahmaputra Floodplain Soil. Master’s Thesis, Bangladesh Agricultural University, Mymensingh, Bangladesh, 2014. Available online: https://www.researchgate.net/publication/306277898_CARBON_FOOTPRINT_OF_SELECTED_CEREAL_AND_LEGUME_CROPS_CULTIVATED_IN_THE_OLD_BRAHMAPUTRA_FLOODPLAIN_SOIL (accessed on 19 December 2021). [CrossRef]
  42. Jimmy, A.N.; Khan, N.A.; Hossain, M.N.; Sujauddin, M. Evaluation of the environmental impacts of rice paddy production using life cycle assessment: Case study in Bangladesh. Model. Earth Syst. Environ. 2017, 3. [Google Scholar] [CrossRef]
  43. Kägi, T.; Wettstein, D.; Dinkel, F. Comparing rice products: Confidence intervals as a solution to avoid wrong conclusions in communicating carbon footprints. Proc. LCA Food 2010, 1, 229–233. [Google Scholar]
  44. Kim, S.; Kim, T.; Smith, T.; Suh, K. Environmental Implications of Eco-Labeling for Rice Farming Systems. Sustainability 2018, 10, 1050. [Google Scholar] [CrossRef] [Green Version]
  45. Lin, J.; Hu, Y.; Cui, S.; Kang, J.; Xu, L. Carbon footprints of food production in China (1979–2009). J. Clean. Prod. 2015, 90, 97–103. [Google Scholar] [CrossRef]
  46. Phong, L.T.; de Boer, M.; Udo, K.M.J. Life cycle assessment of food production in integrated agriculture–aquaculture systems of the Mekong Delta. Livest. Sci. 2011, 139, 80–90. [Google Scholar] [CrossRef]
  47. Saarinen, M.; Kurppa, S.; Virtanen, Y.; Usva, K.; Mäkelä, J.; Nissinen, A. Life cycle assessment approach to the impact of home-made, ready-to-eat and school lunches on climate and eutrophication. J. Clean. Prod. 2012, 28, 177–186. [Google Scholar] [CrossRef]
  48. Xia, L.; Ti, C.; Li, B.; Xia, Y.; Yan, X. Greenhouse gas emissions and reactive nitrogen releases during the life-cycles of staple food production in China and their mitigation potential. Sci. Total Environ. 2016, 556, 116–125. [Google Scholar] [CrossRef]
  49. Xu, X.; Lan, Y. Spatial and temporal patterns of carbon footprints of grain crops in China. J. Clean. Prod. 2017, 146, 218–227. [Google Scholar] [CrossRef]
  50. Xu, Z.; Xu, W.; Peng, Z.; Yang, Q.; Zhang, Z. Effects of different functional units on carbon footprint values of different carbohydrate-rich foods in China. J. Clean. Prod. 2018, 198, 907–916. [Google Scholar] [CrossRef]
  51. Zhang, D.; Shen, J.; Zhang, F.; Li, Y.; Zhang, W. Carbon footprint of grain production in China. Sci. Rep. 2017, 7, 4126. [Google Scholar] [CrossRef] [PubMed] [Green Version]
  52. Zhang, G.; Wang, X.; Zhang, L.; Xiong, K.; Zheng, C.; Lu, F.; Zhao, H.; Zheng, H.; Ouyang, Z. Carbon and water footprints of major cereal crops production in China. J. Clean. Prod. 2018, 194, 613–623. [Google Scholar] [CrossRef]
  53. FAOSTAT. Data for 2019. Available online: https://www.fao.org/faostat/en/#data/QCL (accessed on 21 November 2021).
  54. Carlson, K.M.; Gerber, J.; Mueller, N.D.; Herrero, M.; MacDonald, G.; Brauman, K.A.; Havlik, P.; O’Connell, C.S.; Johnson, J.; Saatchi, S.; et al. Greenhouse gas emissions intensity of global croplands. Nat. Clim. Chang. 2017, 7, 63–68. [Google Scholar] [CrossRef]
  55. Tilman, D.; Clark, M. Global diets link environmental sustainability and human health. Nature 2014, 515, 518–522. [Google Scholar] [CrossRef] [PubMed]
Figure 1. Schematic presentation of system boundaries, reference flow along the individual stages of the rice value chain and the flow of GHGs; GHGCEP, GHGWSM…GHGTr = stage-specific GHG emissions; GHGCult, GHGH&Ph = segment- specific GHG emissions; GHGProd = product-specific (total) GHG emissions; QBase = base quantity (before harvest) entering the reference flow; LHarv, LSto, LDry, LMill = stage-specific product losses; QStr_com; QHusk; QBran = quantities of straw (if traded as commodity), husk and bran, VaQBy-pr = value-adjusted by-product quantity; QProd = product quantity; QTot = total quantities of product + value-adjusted by-products; see Table A1 of the Appendix A/Table A1 for other acronyms; GHG emission from straw management only considers incomplete combustion derived from straw burning while future methane emissions derived from straw incorporated into soil will be considered under water/soil management of the ensuing crop.
Sustainability 14 00315 g001
Figure 2. Mass balance of baseline scenario distinguishing between product and by-product flows; CRHusk, CRBran = commodity rate for husk and bran; Va_FHusk, Va_FBran = value-adjustment factor for husk and bran; straw is not traded as a commodity in this scenario; see Figure 1 for other acronyms.
Sustainability 14 00315 g002
Figure 3. Stage-specific GHG emissions of baseline scenario with QBase = 5.6 t of paddy rice per ha entering the reference flow; baseline settings correspond to the regional context of Southeast Asia (see Table 1 and Table 2 for details).
Sustainability 14 00315 g003
Figure 4. Scenario assessment: (a) GHG emissions differentiated by CO2, CH4 and N2O, (b) quantity of product output, and (c) CFs.
Sustainability 14 00315 g004
Table 1. Overview of stages, GHG emission sources (incl. citation), equations for GHG calculations and technology-specific input parameters; emission factors for CH4 and N2O are converted to CO2e for baseline (B) and alternative technologies (A1…A5), respectively; @-sign is prefix for rate factor.
Stage (Acronym)GHG Emission Source Incl. CitationGHG Calculation and Input Parameters
B= Baseline Technology;
A1…A5 = Alternative Technologies)
Crop establishment and protection (CEP)CH4 from water-logged soil [13]; CH4 from seed production; CO2 from pesticide production [14]GHGCEP = GHGWet + GHGSeed + GHGPest
= EFWet + EFSeed × @Seed_Rate + EFPest
EFawet:
B = Conventional
EFSeed:
B = Conventional;
A1 = Hybrids;
@Seed_Rate (kg/ha)
EFPest
B = Recomm.;
A1 = High intensity rate;
A2 = No pesticides
Water/soil manage-
ment (WSM)
CH4 from soil flooding [11] based on daily emission factor, cultivation period, water management, pre-season management and organic amendmentsGHGWSM = EFCH4 × @Cult_Per × ScFW × ScFP × (1 + @ROAStraw × CFOAStraw + @ROAAdd_Org × CFOAAdd_Org)0.59
EFCH4
B = Southeast Asia;
A1 = … South Asia
… A5 = South America;
@Cult_Per (d)
SFW:
B = Contin. Flooding;
A1 = Intermitt. Drainage;
A2 = Multiple drainage
SFP:
B = Short aeration;
A1 = Long aer.;
A2 = Extra-long aer.
A3 = Water logged
CFOAStraw:
B = Straw: Short offset
A1 = Straw: Long offset
A2 = Straw: Incorpor. as compost
@ ROAStraw (t/ha)
CFOAAdd_Org:
B = No additional OA
A1 = Farm yard man.
A2 = Green manure
@ROAAdd_Org. (t/ha)
Fertilizer applications (Fer)N2O from on-site application [10];
CO2 from fertilizer production [14]
GHGFert = GHGN2O + GHGCO2_F
= (EFN-N2O + EFCO2-N) × @N_Rate
EFN-N2O
B = Continuous Flooding;
A1 = Intermittent drainage
EFCO2-N
B= Conventional Fertilizer
Production
@N_Rate (kg N/ha)
Machine operations (MO)CO2 from electricity for pumping [15];
CO2 from fuel for vehicles [16]
GHGMO = EFMO
EFMO: B = Conventional (pumping and field operations)
Harvest (H)CO2 from fuel; food losses [14,16]GHGHarv = EFHarv
EFHarv: B = Conventional;
A1 = Combine harvesting
Straw management (SM)CH4 from straw burning [17]; minor N2O emissions are neglectedGHGStraw = EFStraw × @Straw_Rate
EFStraw: B = Burning; A1 = Here not considered; A2 = Used as commodity;
@Straw_Rate (only for burning)
Drying (D)CO2 from electricity [16];
food losses [16,18])
GHGDry = CoFDry × QHarv
CoFDry: B = Sun drying; A1 = Solar bubble dryer; A2 = Flatbed dryer;
A3 = Recirculating dryer
Storage (S)CO2 from electricity
food losses [16,18])
GHGSto = CoFSto × QDry
CoFSto: B = Farmer granary A1= Hermetic storage A2= Back stacking
A3= Bulk stacking
Milling (M)CO2 from electricity [16])
food losses and by-products [19]
GHGMill = CoFMill × QSto
CoFMill: B = Basic technology; A1 = Integrated techn./white rice; A2= Integrated techn./brown rice
Packaging (Pk)CO2 from electricity [20]GHGPk = CoFPk × QProd
CoFPk: B = Automatic facility
Transport (Tr)CO2 from fuel [20]GHGTr = GHGTruck + GHGTract + GHGShip + GHGBoat
= (CoFTract × DistTract + CoaTruck × DistTruck + CoFBoat+ × DistBoat + CoFShip × DistShip) × QProd
CoFTruck:
B = Conventional truck
@ DistTruck (km)
CoFTract:
B = Conventional tractor/trailer
@ DistTract (km)
CoFBoat:
B = Conventional boat
@ DistBoat (km)
CoFShip:
B = Conventional ship
@ DistShip (km)
Acronyms: EF_ = technology-specific emission factor (area-scaled or input-scaled). SF_ = technology-specific scaling factor (unit-less). CoF_ = technology-specific conversion factor (quantity-scaled). Seed_Rate, N_Rate, Straw_Rate = rate of seeds; N-Fertilizer, straw (incorporated). Cult_Per = cultivation period (in days; used as rate in WSM equation). OA = organic amendments. CFOAStraw, ROAStraw = conversion factor and rate of straw (incorporated), respectively. CFOAAdd_Org, ROAAdd_Org = conversion factor and rate of additional OA, respectively. QHarv, QDry, QSto, QProd = quantities after harvest, drying, storing as well as product, respectively. DistTruck, DistTract, DistShip, DistBoat = distance transported by truck, tractor/trailer, ship, boat, respectively.
Table 2. Stage-specific settings of technology-based scenarios (based on QBase = 5.64 t/ha); only distinctive stages for at least one scenario are listed in this table; cells with dark gray background indicate deviations from the baseline. Acronyms of scenarios: B = Baseline; E = Export; W = Water-saving; L = Low-carbon; S = Straw incorporation.
Stage of Value ChainScenarios
BEWLS
Water management
Continuous floodingXX X
Multiple drainage XX
Pre-season management----
Short aerationXX X
Long aeration XX
Organic amendm.----
Straw (2.1 t/ha) X
Fertilizer application (kg N/ha)
EFN-N2O/contin. flood. 100100 90
EFN-N2O/mult. drain. 10080
Harvest
ConventionalXXXX
Combine harvester X
Straw management
Straw burningXXXX
Here not considered X
Drying
Sun dryingXXX X
Solar bubble dryer X
Storing
Farmer granaryXXX X
Hermetic storage X
Milling
Basic technology/whiteXXX X
Integrated techn./white X
Transport
Truck (km)100100100100100
Tractor/Trailor (km)5050505050
Ship (km) 9000
Table 3. Comparison of GHG emissions calculated with CF-Rice versus other calculation tools for selectedimportant stages of the baseline/water-saving scenarios.
StageSettingCalculation by Different Tools (kg CO2e/ha)Remarks
CF-
Rice
CFT 1EX-
ACT 2
EX-ACT_VC 3
Soil/water manage-
ment
Conti-
nuous Flood.
348434223484-Possible rounding error in the CFT results due to recalculation from data output as percentage
Multiple Drainage191617281916-CF-Rice and EX-ACT use SFW = 0.55 [10], whereas CFT appears to use SFw = 0.52 [9]
Fertilizer application (under continuous flooding)100
kg N
569 (CO2)
140 (N2O)
725 (CO2 + N2O)642 (CO2)
443 (N2O)
-CF-Rice and CFT are based on the specific IPCC value given for flooded rice (EFN-N2O = 0.3% of applied N) [10], whereas EX-ACT appears to assume the uniform value for upland crops (EFN-N2O = 1% of applied N) [9]
Straw managementBurning867467--CF-Rice is based on specific GHG measurements for rice straw burning under typically moist conditions whereas CFT uses a global GHG average for straw burning of various crops
MillingBasic technology102--(A) 118
(B) 82
(C) 80
(A) including by-products;
(B) including value-adjusted by-products;
(C) exclusing by-poducts
Table 4. Published CFs of rice (see explanations on exclusion criteria in the text).
SourceCF
(kgCO2e/kgProd)
RemarksGeographic Scope
Rice ProductionRice Consumpt.
[39]Mean: 2.66;
Median: 2.55;
Stdev: 1.29;
Min: 0.66; Max: 5.69
Meta-analysis used as reference for data outputs of CF-Rice (Figure A2)Global
[40]0.74 to 0.83Comparison of cropsChina
[41]0.86 to 1.28Comparison of cereal and legume cropsBangladesh
[42]3.15High irrigation costsBangladesh
[43]2.6 to 3.1 USASwitzerland
[44]1.87 to 2.98Focus on eco-friendly riceKorea
[45]1.6 to 2Comparison of cropsChina
[46]0.94Rice—aquaculture rotationVietnam/Mekong Delta
[47]2.67Comparison of diets Finland
[48]1.84 to 2.49Mitigation assessmentChina
[49]1.06Comparison of cropsChina
[50]2.9Focus on carbohydrate-rich foodsChinaChina
[51]1.60Comparison of cropsChina
[52]1.4Comparison of cropsChina
Publisher’s Note: MDPI stays neutral with regard to jurisdictional claims in published maps and institutional affiliations.

