Abstract
The meshed network may become a standard for future distribution systems owing to its various benefits regarding voltage profile, reliability, losses, and the distributed generation (DG). Therefore, in Korea, there is a plan to introduce an advanced form of meshed network called a networked distribution system (NDS). This refers to a system with permanent linkages between four distribution lines (DLs) and NN communication-based protection. To properly introduce NDS to an actual grid, this study proposes a strategy for optimal grid planning and system evaluation. Four different topologies and four practical indicators are explained. First, load imbalance is used to find the optimal grid that maximizes the load capacity. Second, line overload, fault current, and temporary overvoltage (TOV) were used to evaluate the necessity of load transfer, availability of circuit breakers, relay settings, and system stability. PSCAD/EMTDC were employed for the simulation. This study establishes the construction and evaluation guidelines of NDS for distribution system operators (DSOs).
1. Introduction
1.1. Motivation and Aims
As global climate change and energy-related concerns are growing, medium-voltage (MV) networks are facing challenges due to distributed generation (DG). Despite its various benefits (reduction of losses and mitigation of voltage drop) [1], excessive DGs can evoke the violation of voltage limits and thermally overloaded lines [2]. Therefore, utilities are encouraged to restrict the interconnection of DGs within the DG hosting capacity (in Korea, 12 MW per distribution line) [3]. As a result of this, massive amounts of DG interconnections are prohibited and delayed, causing long-term inefficiency.
Various methods have been proposed to overcome these issues [4,5,6,7,8,9,10,11]. Among these, one of the most revolutionary one is network reconfiguration from radial to meshed. Several studies have referred to meshed networks as a promising solution for integrating massive amounts of DGs [4,5,6,7,8,9]. Other options such as smart grid, BESS, volt/var control, and power factor settings can also be employed [10,11]. However, additional advantages such as improvement of reliability, power quality, voltage profile, flexibility, and reduction of losses of meshed network make itself a more attractive option [12,13,14].
Consequently, these features may justify the introduction of meshed network, and it is expected to become the standard for future distribution systems. Hence, to properly move to the next step, the main topic of this study is the optimal and stable introduction of a meshed network to an actual grid. More specifically, the construction and evaluation of meshed networks are addressed. Therefore, the main goal of this work is to establish guidelines for meshed networks for distribution system operators (DSOs).
1.2. Literature Survey
The meshed network is a new paradigm that is entirely different from a conventional radial or open loop. This concept was proposed many years ago but has rarely been introduced owing to certain challenges. The author of [9] argued that short circuit level, voltage regulation, and protection coordination may become the main issues in meshed networks. To resolve these issues, fault current limiters (FCLs) and modifications of voltage regulator are suggested. Protection coordination has been proposed in several other studies [15,16,17]. The author of [15] proposed a transient fault detection algorithm that is based on the angle between the zero-sequence voltage and current phasors. Communication is also used for the signal exchange between directional relays. The author of [16] proposed a dual-setting directional overcurrent relay (DOCR) for multisource meshed distribution networks with DGs. Relay settings that minimize the relay operating time are derived using a genetic algorithm. The author of [17] proposed plug-and-play (PnP) protection schemes that do not require relay settings independent of a specific distribution system. Furthermore, circulating currents can also appear in a meshed network and negatively influence protection devices. This is due to the mutual coupling between the positive and negative sequences that have been ignored in a radial distribution system (RDS) [18]. For the efficient future operation of meshed networks, the authors of [19,20] identified that DG’s the lagging power factor can reduce real and reactive losses and improve the voltage profile compared to DG’s unity power factor. Optimal DG siting and sizing along with the operating power factor using optimization can also reduce loss, improve voltage profile, and improve reliability [21,22]. The author of [23] proved that a constant impedance load is better than a constant power load in terms of voltage profile and losses. The author of [24] suggested dynamic meshing to reduce the overloaded line length and grid expansion.
From the above-mentioned literature, it can be observed that researchers have mainly focused on the impact of meshing and efficient operation plans. These are all crucial tasks, but none of them focus on specific plans for constructing a meshed network regarding grid conditions. This paper also addresses the evaluation of necessity of load transfer, breaker replacement, relay setting, and system stability, which is important in network reconfiguration. A comparison between the TOV in a meshed network and a radial network was also offered.
1.3. Contributions and Organization of the paper
In Korea, research on networked distribution systems (NDS) is currently in progress for future distribution operations. NDS is an advanced form of meshed network in which there exists permanent linkages between four distribution lines (DLs) and NN communication-based protection. This has the advantage of a meshed network and is expected to solve the low utilization rate of closed-loop systems. To introduce NDS optimally and stably, this paper presents a strategy for optimal grid planning and system evaluation.
The contributions of this study are summarized as follows:
- The key contribution of this study is to present a strategy for optimal grid planning. This provides an optimal grid that maximizes the load capacity with specific plans regarding the conditions of existing radial feeders.
- This paper provides an assessment of network reconfiguration based on the standard of the Korea Electric Power Corporation (KEPCO) with practical indicators. A review from a practical point of view can facilitate the understanding of NDS for distribution system operators (DSOs).
- The paper also presents the rationale for network reconfiguration by comparing the temporary overvoltage (TOV) that has not been addressed. It is worthwhile to establish a theoretical basis for the influence of introducing NDS.
The remainder of this paper is organized as follows. In 
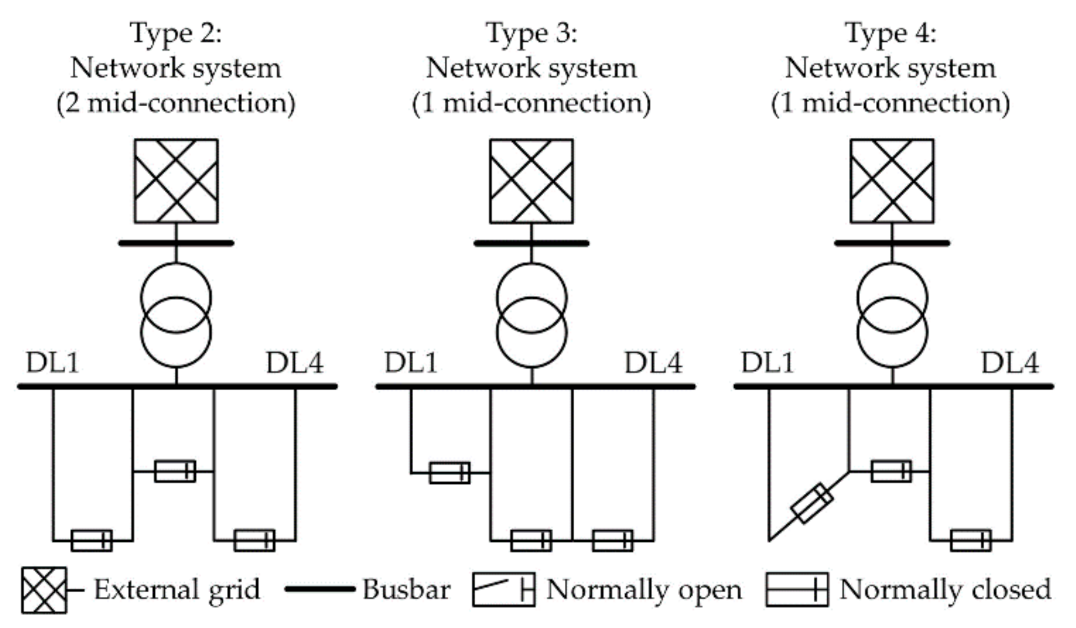
Section 2, different NDS topologies and indicators are explained. Subsequently, a methodology for optimal grid planning and system evaluation is presented. In Section 3, simulation setups for case studies are explained. In Section 4, case studies of the proposed methodology are performed using the PSCAD software tool. Finally, we discuss and conclude the paper in Section 5.
2. Proposed Methodology
2.1. Mid-Voltage Networked Distribution System
Figure 1 illustrates a 22.9 kV NDS with permanent linkages between four DLs withdrawn from the same 154 kV/22.9 kV main transformer (MTR). This system is composed of a generator, MTR, underground or overhead distribution lines, and loads that are based on specific parameters of the KEPCO distribution system. The rated power and voltage levels are described in Table 1. In addition, communication lines are installed for NN communication-based protection. Distribution lines and loads are divided into three regions, where circuit breakers (CBs) or reclosers (RCs) are installed at the entrance. Moreover, three-phase (3P) faults (# 1–4) and faults with various conditions (# 5–16) were also simulated in the middle of the lines between the CB and RCs. Furthermore, a distributed generator (DG) with 8 MW output is connected to the endpoint of DL2 with the transformer.
Figure 1.
Detailed model of networked distribution system.
Table 1.
System parameters.
The distribution system described in Figure 1 was defined as Type 1. This is the basic topology of the NDS that links the endpoints of the four feeders. The three different topologies are described in Figure 2. Type 2 represents the mid-linkage of the two feeders when the line lengths of the four feeders are the same. In addition, Types 3 and 4 represent the mid-linkage of one feeder when the line length of one feeder (DL1, DL2 each) is shorter than the others.
Figure 2.
Different types of NDS topology.
2.2. Indicator
2.2.1. Load Imbalance
The load imbalance refers to the imbalance of load distribution among four feeders in the NDS, which thus causes the imbalance among load currents of four feeders. High load imbalance can cause load concentration in a feeder, which reduces the load capacity. Therefore, a load imbalance analysis is necessary for network reconfiguration. Load imbalance is obtained from the maximum and average load currents of each feeder, as shown below. Load currents are measured from CB1 at the entrance of the four DLs.
2.2.2. Line Overload
Load current must be maintained under the line ratings (CNCV/W 325 and ACSR 160, 252 A) for preventing thermal damage to lines. If load current exceeds 252A, DSOs are encouraged to transfer loads to other lines, causing inefficiency. Line overload is obtained from the maximum load currents of each phase, as shown below. Load currents are measured from CB1 at the entrance of the four DLs.
2.2.3. Fault Current Level
Utilities need to maintain the maximum fault current within the CB ratings (12.5 kA); otherwise, existing CBs must be replaced. Owing to its high cost, utilizing the existing equipment is economical for reducing the cost of network reconfiguration. For this, a comparison between the maximum fault current and 12.5 kA was conducted as follows.
Furthermore, the fault current can be used to evaluate the protection system, which is one of the most important issues in network reconfiguration. Neutral and phase fault currents were measured from CBs or RCs that were adjacent to the fault location. A comparison between the fault current and existing relay settings was conducted as follows. These settings (400 A, 70 A) are determined based on the MV CB and RC standard of KEPCO.
2.2.4. Temporary Overvoltage (TOV)
Temporary overvoltage due to the increased penetration of DGs can be used to evaluate the system stability. This can damage the insulation of power equipment and needs to be addressed in network reconfiguration. TOV can be calculated using the voltage on healthy phase measured from the adjacent RCs before and after the fault.
2.3. Theoretical Basis
This section presents a mathematical analysis of how the load imbalance of NDS can be minimized. The basic theory of a closed-loop system (CLS) is addressed first, and an explanation of the optimal grid condition of NDS is followed.
2.3.1. CLS
Formula 1: Voltage Drops (
The voltage difference between the entrance and endpoint of each feeder can be calculated by Equation (7). Figure 3 can be applied for each case (left: DL1, right: DL2). It is assumed that both feeders are radial operations.
Figure 3.
The equivalent circuit of the CLS for formula 1.
Formula 2: Voltage Drops (
The voltage difference between the entrance of each feeder and a specific location can be calculated by Equation (8). Figure 4 can be applied for each case (left: DL1, right: DL2). Similar to Formula 1, it is assumed that both feeders are radial operations.
Figure 4.
The equivalent circuit of the CLS for formula 2.
As shown in Figure 4, voltage drops () at a particular point can be calculated by Equation (9) when connecting the two feeders. Hence, the voltage level of a specific location can be derived by Equation (10).
2.3.2. NDS
Figure 5 presents the equivalent circuit of NDS that is composed of two CLSs and a linkage line. If the voltage drops ( of four feeders are all the same, which is calculated using Equation (7), an optimal grid can be derived by linking the same voltage locations. The voltage at a specific location of the CLS can be derived using Equation (10). Equations (11) and (12) represent the condition for this method and can be used for minimizing the load imbalance in Types 1 and 2.
Figure 5.
The equivalent circuit of the NDS when voltage drops of four feeders are the same.
On the other hand, if the voltage drops ( of the two feeders are different, the linkage between the endpoint of the short feeder and the middle of the adjacent feeder can be possible, as shown in Figure 6. In this method, it is assumed that only one feeder (DL2) supplies power to the linkage line (green line). This is because the line impedance between the entrance of DL2 and the linkage line is relatively lower than that of the other feeders. The optimal mid-linkage point at DL2 can be determined by the conditions, as described in Equations (13) and (14). These conditions can be used for minimizing the load imbalance in Type 3. In this case, voltage drops ( of DL2 that are composed of closed-loop and radial can be calculated using Equation (15).
Figure 6.
The equivalent circuit of the NDS when voltage drops of four feeders are different.
2.4. Proposed Methodology
Figure 7 shows a detailed algorithm of the proposed methodology. First, we found the optimal grid of NDS according to the conditions of existing radial feeders. Second, we evaluated the necessity of load transfer, availability of existing CBs, relay settings, and system stability.
Figure 7.
Algorithm for finding optimal grid and system evaluation.
2.4.1. Methodology 1: Finding Optimal Grid
As mentioned in Section 2.2, the load capacity is determined by the load imbalance. Methodology 1 employs this indicator to find the optimal grid. For this purpose, load imbalance analysis of four different topologies (Types 1–4) was conducted by changing the grid conditions. Through this, a strategy for finding the optimal grid according to the conditions of existing radial feeders was derived. In addition, the influence distributed generation (DG) on load imbalance was also analyzed. Table 2 lists this methodology.
Table 2.
Methodology 1—simulation cases.
2.4.2. Methodology 2: System Evaluation
The evaluation of the necessity of load transfer, availability of existing CBs, relay settings, and system stability is an important task for introducing a newly designed system stably. Methodology 2 employs the line overload, fault current, and temporary overvoltage (TOV) for evaluating the NDS. This process consists of four parts as listed in Table 3.
Table 3.
Methodology 2—simulation cases.
- Compare the maximum load current to existing line ratings (252 A) by changing loads at DL1. By doing this, the load growth impact on the line overload can be evaluated. In this case, line overload analysis of RDS is also compared with NDS.
- Compare the maximum fault current level and existing CB ratings (12.5 kA) by simulating a 3-phase (3P) fault (#1–4). Thus, the availability of existing CBs installed in an RDS can be evaluated.
- In fault analysis, it is assumed that the relay detects the fault current on one side and trips to another side with N N communication-based protection. This is because the reverse fault current level in the NDS is too small, making it difficult to detect. Considering this, the forward fault current measured by adjacent CB or RC is mainly addressed. First, we find the location with the minimum forward fault current by simulating a single-line-to-ground (SLG) fault (#5–16). Second, we compare the forward fault current with existing relay settings (400 A, 70 A) by changing the fault impedance and fault type. These settings (400 A, 70 A) are determined based on the MV CB and RC standard of KEPCO.
- The TOV level and standard of effective grounding requirement are compared by simulating a single-line-to-ground (SLG) fault (#10). By changing the DG types and transformer windings, the system stability can be evaluated. In this case, TOV analysis of RDS with no linkages between feeders is also addressed.
3. Numerical Experiment Setup
In this section, a description of the PSCAD/EMTDC model is firstly explained. Detailed simulation setups for finding the optimal grid and evaluating system are as follows. Cases 1–5 represent the simulation conditions for finding the optimal grid, and Cases 6–11 describe the system evaluation processes.
3.1. PSCAD/EMTDC Modeling
Figure 8 represents the grid model of MV NDS using PSCAD/EMTDC. This is composed of a distribution substation, overhead and underground lines, loads, and distributed generation with a transformer. Detailed parameters including sequence impedance, rated power, and voltage are described in Figure 1 and Table 1. The main transformer (M.TR) connection types are determined by . A neutral grounding reactor (j0.6 ohm) that is the effective grounding standard of KEPCO is connected to the neutral point of to limit the neutral fault current. In addition, distribution lines are modeled with a three-phase -equivalent circuit, and the loads are characterized by constant impedance type. The model of distributed generation is composed of SBDG (synchronous-based distributed generation) and IBDG (inverter-based distributed generation). The SBDG model consists of a synchronous machine, exciter, hydro governor, and hydro turbine. The IBDG model is composed of an AC–DC–AC converter (grid-side, generator-side) and controls, a permanent magnet synchronous machine (PMSM), and a low-pass filter. Basic functions such as low voltages ride through (LVRT) and a fault current limiter are modeled. SBDG and IBDG are interconnected to the endpoint of DL2 with a two-winding transformer.
Figure 8.
The PSCAD/EMTDC-based grid model.
3.2. Simulation Setups
3.2.1. Methodology 1: Finding Optimal Grid
Methodology 1 consisted of five cases (Cases 1–5). First, detailed setups for analyzing the load imbalance of each topology (Types 1–4) with multiple grid conditions are described in Figure 9. Case 1 represents the load imbalance analysis of Type 1 with various line lengths of DL1. In addition, Cases 2–4 represent the load imbalance analysis of Types 2–4 by changing the position of the mid-linkage point.
Figure 9.
Simulation setups for Methodology 1 (Cases 1–4).
Second, finding an optimal DG place with a minimum effect on load imbalance is also conducted in Case 5, as shown in Figure 10. Optimal grids of Types 1–4 that are derived in Cases 1–4 are used.
Figure 10.
Simulation setups for Methodology 1 (Case 5).
3.2.2. Methodology 2: System Evaluation
Methodology 2 employs six cases to evaluate the system derived from Section 3.2.1. Simulation setups for evaluating systems of Types 1–4 are shown in Figure 11. This figure only describes Type 1, but additional simulations are conducted under the same conditions using Types 2–4. First, Case 6 represents the comparison between line overload and 1 pu for evaluating the necessity of load transfer. Second, Case 7 represents the comparison between maximum fault currents and 12.5 kA for evaluating the availability of existing equipment for use. Third, a fault location with a minimum forward fault current is detected in Case 8. Subsequently, the fault current is analyzed by simulating different fault conditions. The fault current level with three different fault types (SLG, LL, 3P) and eight different fault impedances (0.01 Ω, 0.1 Ω, 1 Ω, 10 Ω, 20 Ω, 30 Ω, 50 Ω, 100 Ω) were evaluated in Cases 9–10. Finally, TOV levels under multiple conditions (DG types and transformer windings) are compared with 1.38 pu by simulating the SLG fault. In this case, the TOV of the RDS is also addressed.
Figure 11.
Simulation setups for Methodology 2 (Cases 6–11).
4. Case Study
4.1. Methodology 1: Finding Optimal Grid
Figure 12 shows the load imbalance analysis results of Case 1. In this graph, load imbalance tends to increase proportionally with the length difference between feeders. In particular, when one feeder (DL1) is shorter than other feeders (8 km), the loads are concentrated seriously to a short line. This can be a main concern when introducing NDS with a Type 1 topology. However, load imbalance can be minimized when the line lengths of the four feeders are all equal (8 km). Therefore, introducing Type 1 is desirable when the line lengths of the four feeders are equal.
Figure 12.
Case 1 simulation result.
Figure 13 shows two different types of simulation results that were conducted using Type 2. The first graph shows that the load imbalance of Type 2 is minimized when the mid-linkage points of DL2 and DL3 have the same distance from the substation (4 km). With this condition, further simulations were conducted resulting in the second graph, which changes the distance between the mid-linkage point and the substation. This shows that load imbalance is not affected by the position of mid-linkage points, even the same as Type 1 (8 km). In other words, linking DL2 and DL3 with minimum distance is possible without affecting the load imbalance. Thus, the line extension cost can be minimized. Therefore, introducing Type 2 is economical when the minimum distance points are in the middle of DL2 and DL3.
Figure 13.
Case 2 simulation results representing the change of one linkage point (the upper) and two linkage points (the below picture).
Figure 14 shows the load imbalance analysis results of Case 3. In this figure, most of the load imbalance results of Type 3 are lower than those of Type 1 (8 km). This indicates that introducing Type 3 is better than Type 1 when one feeder (DL1) is shorter than the others. In this case, load imbalance can be minimized to 1 (no load imbalance exists) when the mid-linkage point is 2.85 km far from the substation. This can also be applied when DL4 is short by linking the endpoint of DL4 to the middle of DL3. In addition, introducing Type 3 has the advantage of reducing the line extension cost compared to Type 1 owing to the decreased line length needed for linkage.
Figure 14.
Case 3 simulation result.
Figure 15 shows the load imbalance analysis results of Case 4. Similar to Case 3, most of the load imbalance results for Type 4 are lower than those for Type 1 (8 km). This indicates that introducing Type 4 is better than Type 3 when one feeder (DL2) is shorter than the others. In contrast to Case 3, load imbalance cannot be minimized to 1, and there exists a certain load imbalance between feeders. The minimum load imbalance is 1.103 when the mid-linkage point is 2.76 km far from the substation. This can also be applied when DL3 is short by linking the endpoint of DL3 to the middle of DL2. Furthermore, introducing Type 3 has the advantage of reducing the line extension cost compared to Type 1 because of the decreased line length needed for linkage.
Figure 15.
Case 4 simulation result.
Table 4 represents the load imbalance analysis results when DG is interconnected. DG placement on DL2 and DL3 is more desirable in an optimal grid because the rise in load imbalance is relatively low. This is based on the fact that DG output can be easily dispersed to other feeders due to the relatively lower line impedance.
Table 4.
Case 5 simulation result: load imbalance (L.I).
4.2. Methodology 2: System Evaluation
Figure 16 represents the line overload analysis results for Case 6. As shown below, line overload in NDS is relatively less volatile than that of RDS according to load change. This is because load concentration in one feeder can be dispersed to other feeders. Hence, the maximum load current does not exceed the line ratings (252 A) even when more than 10 MW per distribution line is connected. Accordingly, the probability of line overload can be reduced by introducing NDS, presenting similar results in [24], which indicates that integrating variable resources such as an electric vehicle (EV) is also advantageous in NDS.
Figure 16.
Case 6 simulation results of Types 1, 2, 3, and 4 in an order from the top to the bottom.
Table 5 presents the maximum fault current analysis results for Case 7. This shows that the maximum fault current level is almost unaffected by the fault location (#1–4) or topology (Types 1–4). Accordingly, meshing the feeders withdrawn from the same main transformer has almost no effect on the short circuit current, which is different from the result of reference [9]. All results are 9.95 kA, which is lower than the existing CB ratings (12.5 kA). Therefore, every topology (Types 1–4) can be applied to an actual grid without the additional cost of circuit breaker installation.
Table 5.
Case 7 simulation result: maximum fault current level (kA).
Figure 17 presents the neutral fault current analysis results of Case 8. As mentioned in Section 2.4.2, most forward fault currents are higher than reverse fault currents. In particular, when a fault occurs near a substation (#5–8), the forward fault current is dominant, and the reverse fault current is too low. Fault locations where the minimum fault current is detected are usually located near the endpoint of each feeder (#13–16). These are shown with blue round marks in Figure 17.
Figure 17.
Case 8 simulation results of Types 1, 2, 3, and 4 in an order from the top to the bottom.
Table 6 presents the neutral fault current analysis results for Case 9. In this table, the neutral fault current of Type 2 exceeds the overcurrent ground relay (OCGR) settings (70 A) regardless of the fault condition. In addition, the neutral fault currents of Types 1, 3, and 4 exceed 70 A except when an extremely high impedance fault (100 Ω) occurs. In other words, most faults can be protected by existing OCGR pick-up settings. Therefore, network reconfiguration does not require a change in OCGR settings.
Table 6.
Case 9 simulation results: neutral fault current (kA).
Table 7 presents the phase fault current analysis results. In this table, the phase fault current of each case does not exceed the overcurrent relay (OCR) settings (400 A) when the LL fault impedance is higher than 30 Ω or 50 Ω. However, most 3P faults are well protected except when extremely high impedance faults occur. This indicates that a high-impedance LL fault may not be properly eliminated. Lowering the OCR pick-up settings can be a solution, but this has limitations owing to the difficulty of discriminating with load current. Therefore, network reconfiguration requires a new method to protect high-impedance faults. Research on this topic will be conducted in future work.
Table 7.
Case 10 simulation result: phase fault current (kA).
Table 8 shows the TOV analysis results for Case 11. In this table, the maximum TOV results are observed under conditions of synchronous DG and Yg-Y transformer. This is based on the fact that the TOV level is proportional to the zero-sequence impedance. Under these conditions, the TOV level is within the standard of effective grounding (1.38 pu), regardless of the topology. Furthermore, the TOV level of the NDS is lower than that of the RDS under the same conditions. This indicates that introducing NDS may reduce the TOV level and contribute to system stability, which is a new characteristic of meshed networks.
Table 8.
Case 11 simulation result: temporary overvoltage (pu).
5. Discussions and Conclusions
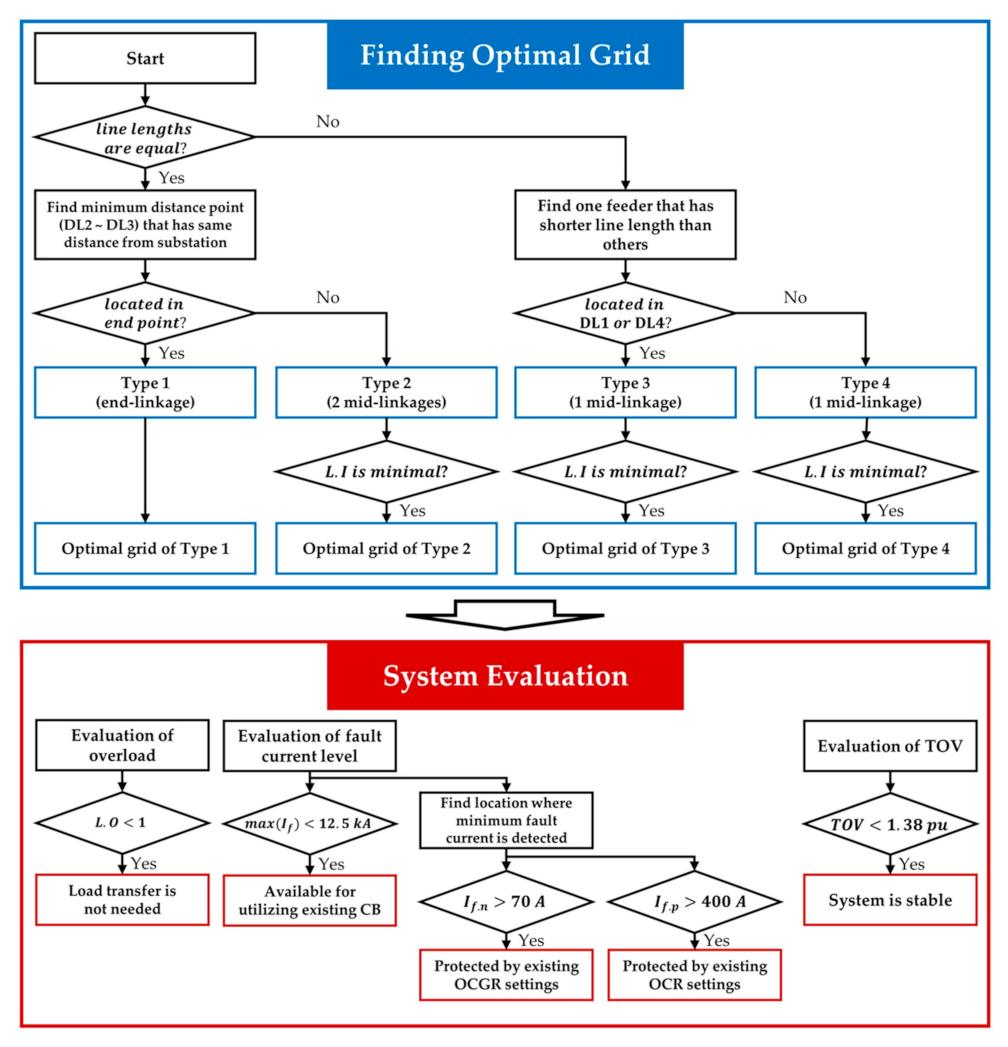
This paper proposes a methodology for determining the optimal grid and evaluating system. To this end, an optimal grid that can maximize the load capacity is derived according to the conditions of existing radial feeders. In addition, evaluation results for line overload, the availability of existing CBs for use, relay settings, and system stability in the network reconfiguration are provided. Through these, it provides a distribution system operator (DSO) with guidelines on how to construct an optimal NDS efficiently and stably.
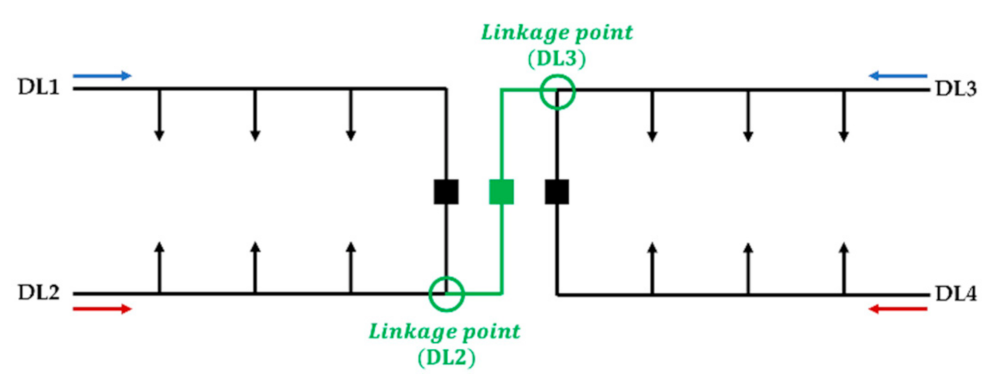
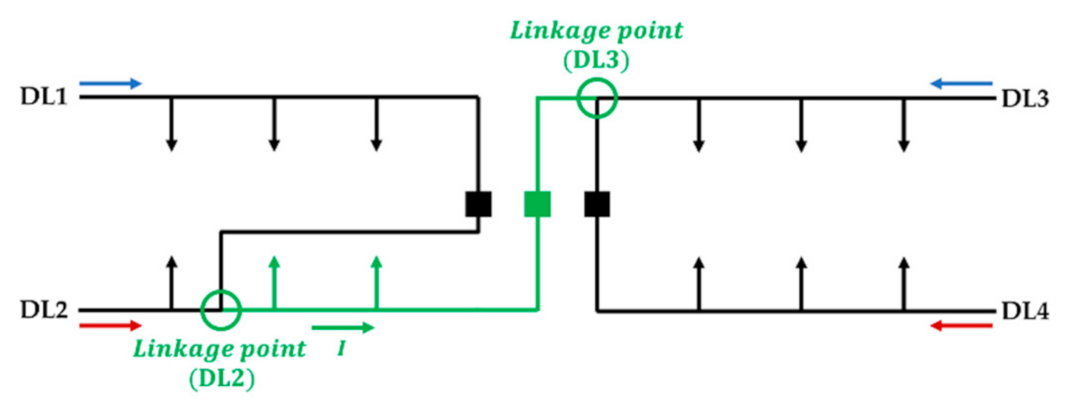
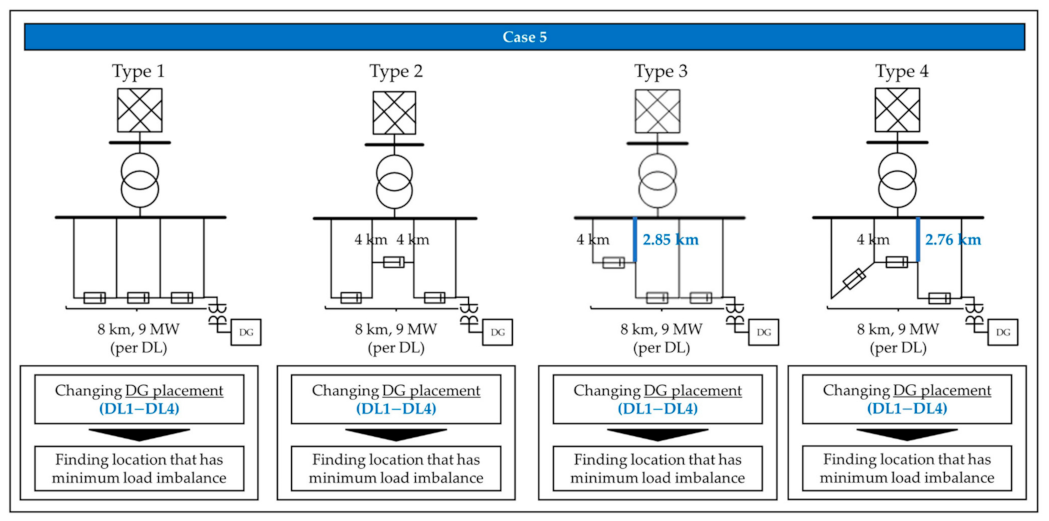
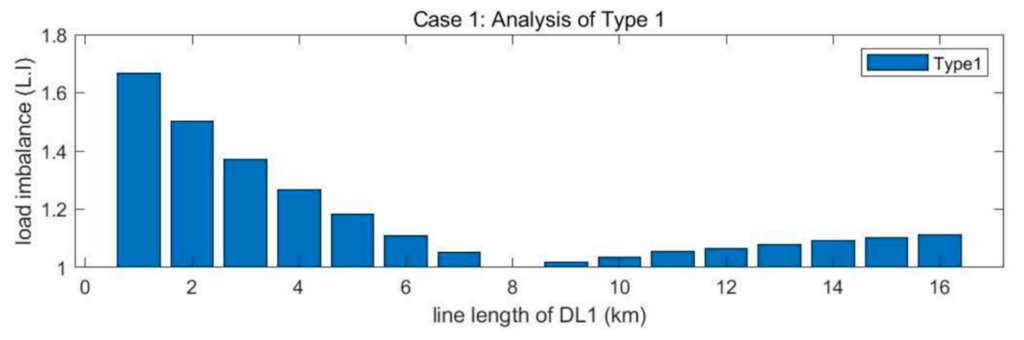
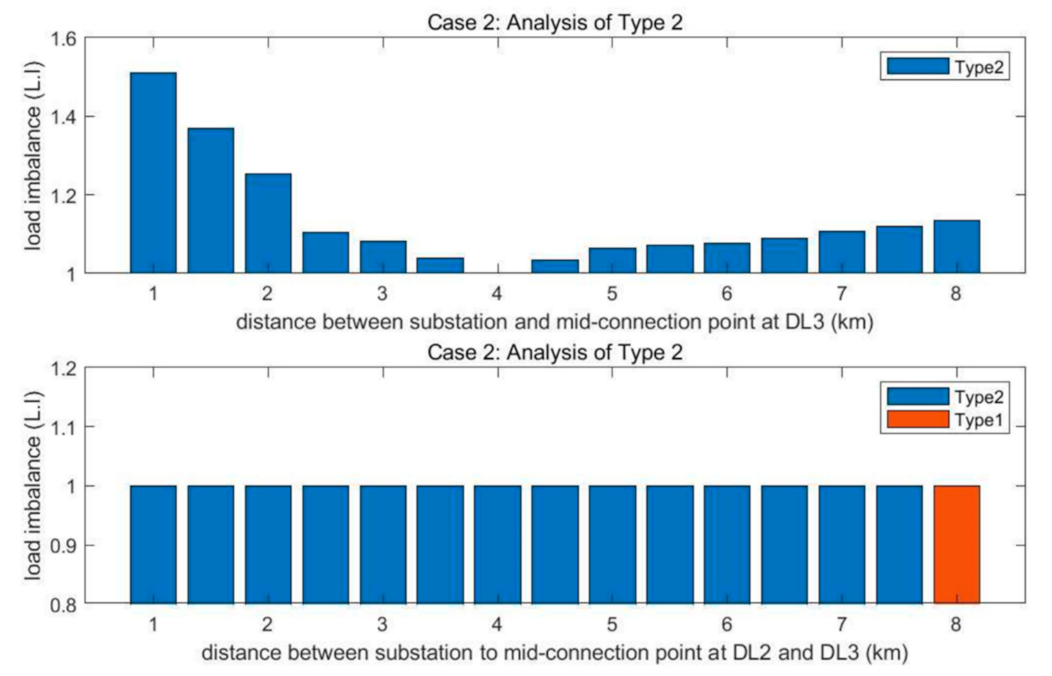
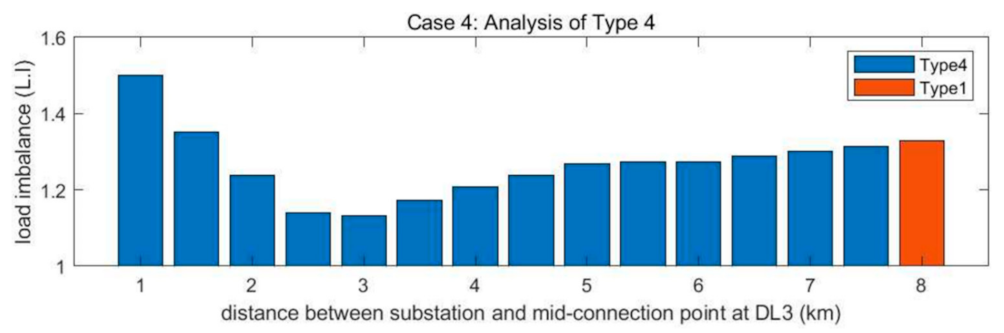
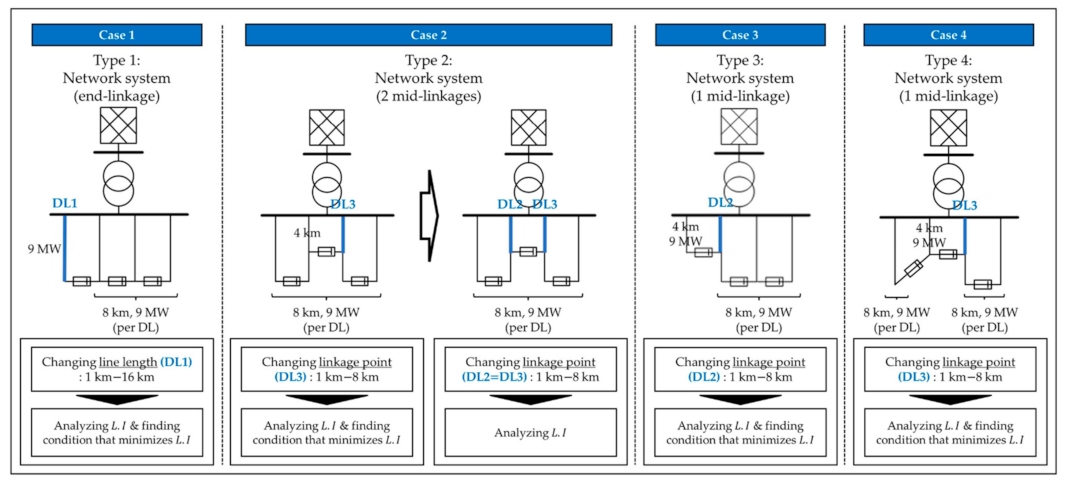
Consequently, it was observed that the introduction of NDS through end-linkage is most efficient when the line lengths of the four feeders are the same. In this condition, it is also possible to link the minimum distance points between the DLs, thereby reducing the cost of linkage. However, when one feeder is shorter than the others, the load is concentrated to one feeder and significantly reduces the load capacity. This can be the main concern for introducing an end-linkage NDS. To resolve this issue, a linkage between the endpoint of the short feeder and the middle of the adjacent feeder is feasible. Thus, the load capacity can be increased without additional line construction, and the cost required for linkage can also be reduced.
It is noteworthy that this work is primarily based on balanced loading conditions among three phases. Therefore, the proposed approach, which designs optimal grid topology as described in Figure 7, is based only on the relative differences of feeder line lengths; that is, neither line impedances nor unbalanced loads are considered. In practice, distribution systems are more likely to have unbalanced loads, which might affect the effectiveness of the NDS optimal design proposed in this work since the minimization of the load imbalance (i.e., load distribution among feeders in the NDS) depends not only on line lengths but on loading conditions among three phases. This realistic consideration will be addressed for further study.
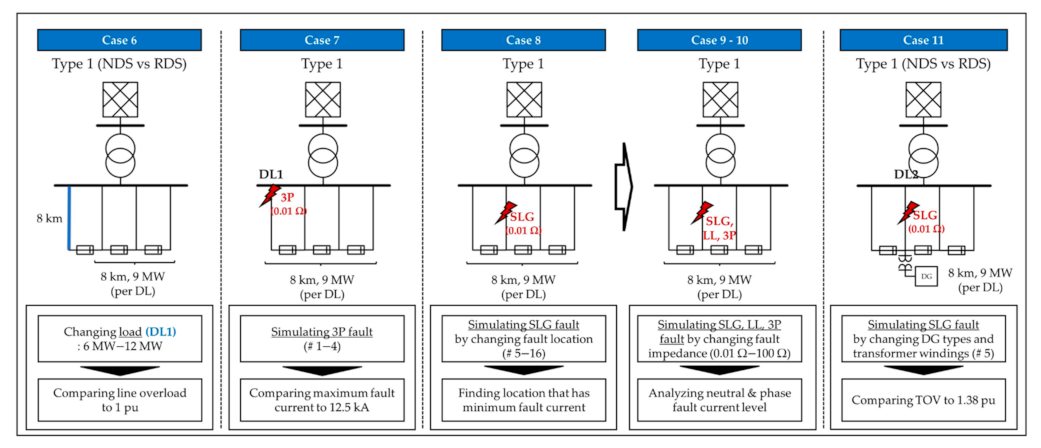
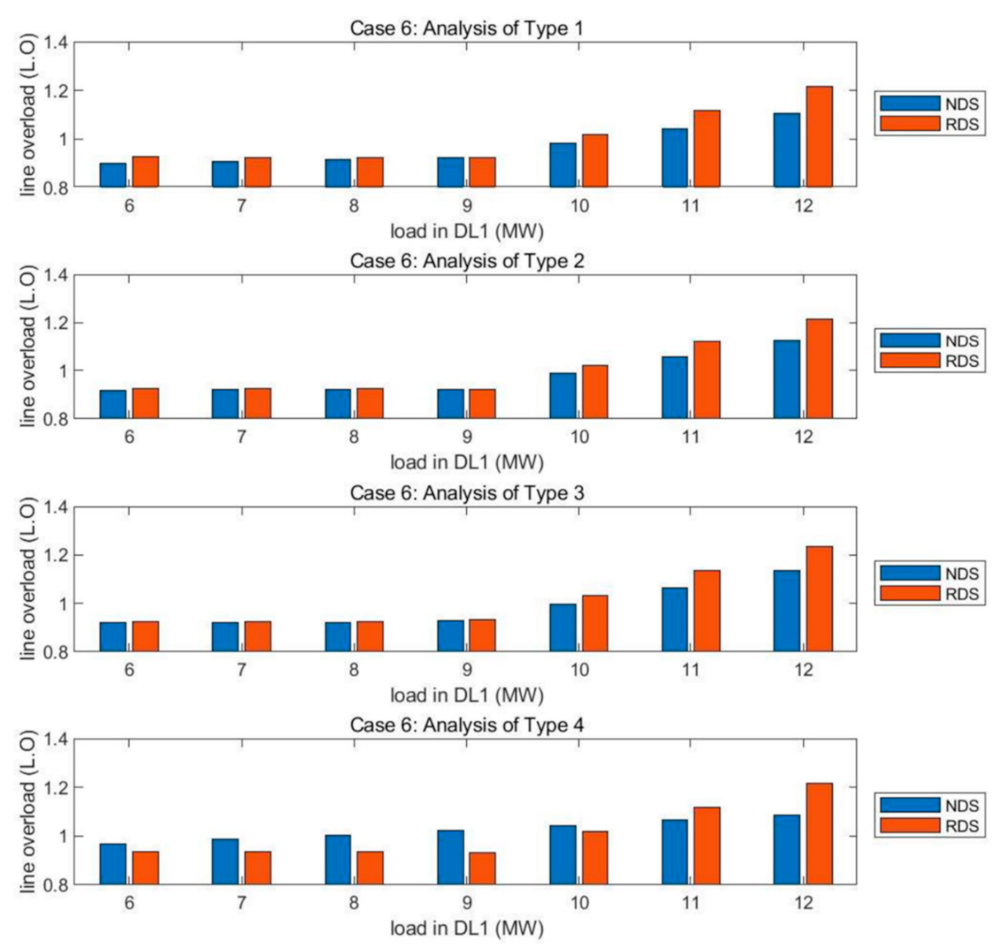
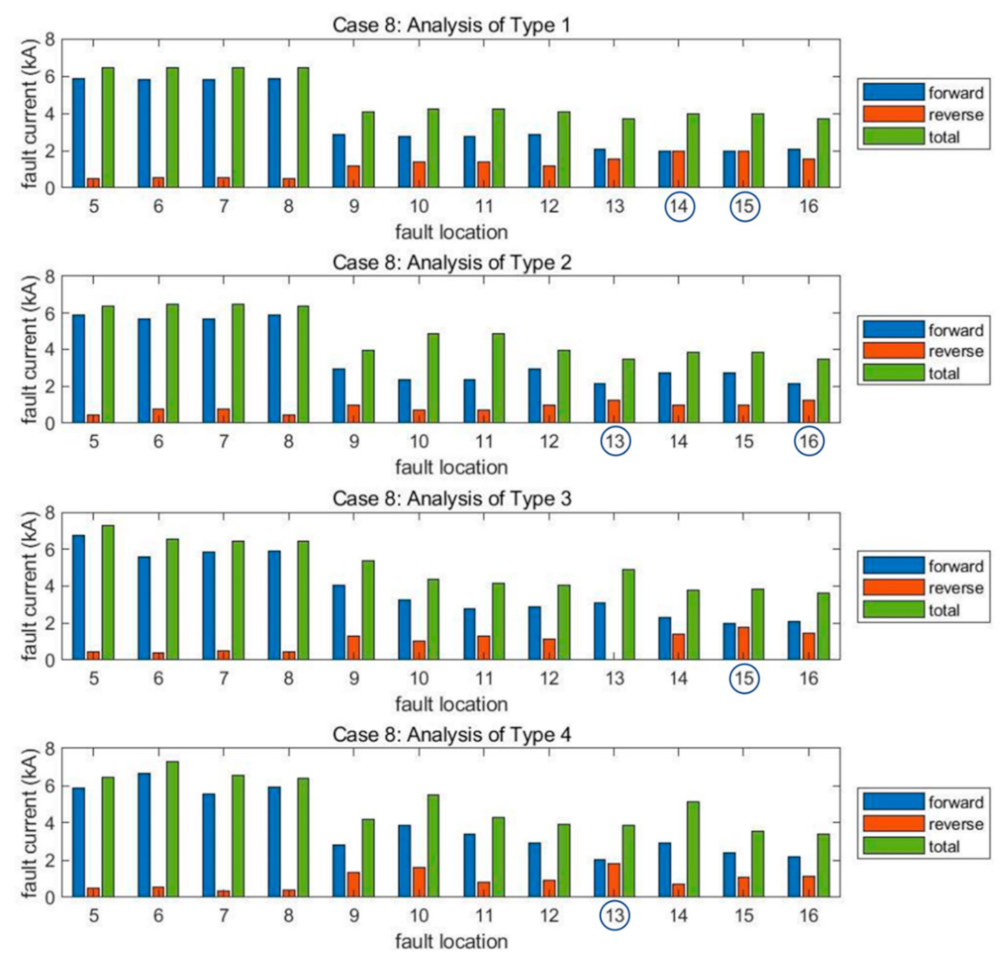
In addition, the system evaluation results are summarized as follows: introducing NDS can reduce the line overload by dispersing the overload to other feeders. In addition, when introducing NDS within the same MTR, it is judged that the replacement of CBs or RCs is unnecessary regardless of the topology. Furthermore, single-line-to-ground and three-phase faults are well protected even if the existing relay settings (70 A, 400 A) are used, but measures are needed to protect the high impedance line-to-line fault. Lastly, the introduction of NDS can reduce the TOV level compared to RDS and thus contribute to system stability, which is a new characteristic of meshed networks.
Succinctly, introducing NDS has many advantages and may become a standard for future distribution systems. However, load concentration may occur depending on the length of the radial feeders, and violation of the line capacity can be a major concern in NDS. The proposed methodology can effectively solve this problem by providing guidelines for network reconfiguration. In addition, the evaluation of line overload, breaker replacement, relay settings, and system stability can be used as important references for the DSO in the construction and operation stages.
In the end, this work is an initial stage of introducing NDS, and numerical factors may also need to be considered. Research on communication-based protection schemes will be followed as a future work using IED (intelligent electronic device) with HIL (hardware-in-the-loop) simulation. In addition, voltage-based protection schemes and a line-impedance equivalent reactor for improving load imbalance may also follow. Furthermore, transient phenomena due to the grid supporting the function of inverter-based DG will be conducted in future work. This can cause transient overvoltage such as spark [25] and must be addressed carefully for stable NDS operation.
Author Contributions
Conceptualization, J.L., M.Y., W.C. and W.K.; Data curation, J.L. and S.C.; Formal analysis, J.L.; Funding acquisition, S.C.; Investigation, M.Y. and S.C.; Methodology, J.L.; Project administration, W.C., W.K. and S.C.; Resources, M.Y. and W.K.; Software, J.L.; Supervision, S.C.; Validation, J.L., W.C. and W.K.; Visualization, J.L. and S.C.; Writing—original draft, J.L.; Writing—review & editing, J.L. and S.C. All authors have read and agreed to the published version of the manuscript.
Funding
This research was supported in part by the Korea Electric Power Corporation (No. CX7120030), in part by the Korea Institute of Energy Technology Evaluation and Planning (KETEP) grant funded by the Korean government (MOTIE) (No. 20191210301890), and in part by the Basic Research Program through the National Research Foundation of Korea (NRF) funded by the MSIT (No. 2020R1A4A1019405).
Institutional Review Board Statement
Not applicable.
Informed Consent Statement
Not applicable.
Conflicts of Interest
The authors declare no conflict of interest.
References
- Aguero, J.R. Improving the Efficiency of Power Distribution Systems through Technical and Non-Technical Losses Reduction. In Proceedings of the IEEE PES Transmission and Distribution Conference and Exposition (T&D), Orlando, FL, USA, 7–10 May 2012; pp. 1–8. [Google Scholar]
- Wolter, D.; Zdrallek, M.; Stotzel, M.; Schacherer, C.; Mladenovic, I.; Biller, M. Impact of meshed grid topologies on distribution grid planning and operation. CIRED—Open Access Proc. J. 2017, 2017, 2338–2341. [Google Scholar] [CrossRef]
- Widiputra, V.; Junhyuk, K.; Yejin, Y.; Jaesung, J.; Robert, B. Maximizing Distributed Energy Resource Hosting Capacity of Power System in South Korea Using Integrated Feeder, Distribution, and Transmission System. Energies 2020, 13, 3367. [Google Scholar] [CrossRef]
- Capitanescu, F.; Ochoa, L.F.; Margossian, H.; Hatziargyriou, N.D. Assessing the Potential of Network Reconfiguration to Improve Distributed Generation Hosting Capacity in Active Distribution Systems. IEEE Trans. Power Syst. 2014, 30, 346–356. [Google Scholar] [CrossRef]
- Davoudi, M.; Cecchi, V.; Aguero, J.R. Investigating the Ability of Meshed Distribution Systems to Increase Penetration Levels of Distributed Generation. In Proceedings of the IEEE Southeastcon 2014, Lexington, KY, USA, 13–16 March 2014; pp. 1–5. [Google Scholar]
- Cruz, M.R.M.; Fitiwi, D.Z.; Santos, S.F.; Catalao, J.P.S. Meshed Operation of Distribution Network Systems: Enabling Increased Utilization of Variable RES Power. In Proceedings of the IEEE International Conference on Environment and Electrical Engineering and 2018 IEEE Industrial and Commercial Power Systems Europe (EEEIC/I&CPS Europe), Palermo, Italy, 12–15 June 2018; pp. 1–6. [Google Scholar]
- Cruz, M.R.M.; Fitiwi, D.Z.; Santos, S.F.; Mariano, S.J.P.S.; Catalao, J.P.S. Prospects of a Meshed Electrical Distribution System Featuring Large-Scale Variable Renewable Power. Energies 2018, 11, 3399. [Google Scholar] [CrossRef] [Green Version]
- Alvarez-Herault, M.C.; N’Doye, N.; Gandioli, C.; Hadjsaid, N.; Tixador, P. Meshed distribution network vs reinforcement to increase the distributed generation connection. Sustain. Energy Grids Netw. 2015, 1, 20–27. [Google Scholar] [CrossRef]
- Celli, G.; Pilo, F.; Pisano, G.; Allegranza, V.; Cicoria, R.; Iaria, A. Meshed vs. Radial MY Distribution Network in Presence of Large Amount of DG. In Proceedings of the IEEE PES Power Systems Conference and Exposition, New York, NY, USA, 10–13 October 2004; pp. 709–714. [Google Scholar]
- Ding, F.; Mather, B.; Gotseff, P. Technologies to Increase PV Hosting Capacity in Distribution Feeders. In Proceedings of the 2016 IEEE Power and Energy Society General Metting (PESGM), Boston, MA, USA, 17–21 July 2016; pp. 1–5. [Google Scholar]
- Wang, B.; Zhang, C.; Dong, Z.Y.; Li, X.J. Improving Hosting Capacity of Unbalanced Distribution Networks via Robust Allocation of Battery Energy Storage System. IEEE Trans. Power Syst. 2020, 36, 2174–2185. [Google Scholar] [CrossRef]
- Thapar, A.; Saha, T.K.; McDonald, J.D.F. An Investigation of Composite System Reliability in Meshed and Extended Networks. In Proceedings of the 2005 International Power Engineering Conference, Singapore, 29 November–2 December 2005; pp. 1099–1104. [Google Scholar]
- Ruben, B.; Cross, A.; Strickland, D.; Aten, M.; Ferris, R. Meshing Radial Networks at 11kV. In Proceedings of the 2011 2nd IEEE PES International Conference and Exhibition on Innovative Smart Grid Technologies, Manchester, UK, 5–7 December 2011; pp. 1–8. [Google Scholar]
- Cristian, N.; Ahmed, A.A.; Dakyo, B. Impact Analysis of Distributed Generation on Mesh and Radial Distribution Network. Overview and State of the art. In Proceedings of the PLUMEE Conference, Bucharest, Romania, 18–20 June 2013; pp. 1–10. [Google Scholar]
- Penaloza, J.D.R.; Borghetti, A.; Napolitano, F.; Tossani, F.; Nucci, C.A. A New Transient-Based Earth Fault Protection System for Unearthed Meshed Distribution Networks. IEEE Trans. Power Deliv. 2021, 36, 2585–2594. [Google Scholar] [CrossRef]
- Yazdaninejadi, A.; Nazarpour, D.; Golshannavaz, S. Dual-setting directional over-current relays: An optimal coordination in multiple source meshed distribution networks. Int. J. Electr. Power Energy Syst. 2017, 86, 163–176. [Google Scholar] [CrossRef]
- Tsimtsios, A.M.; Nikolaidis, V.C. Toward Plug-and-Play Protection for Meshed Distribution Systems with DG. IEEE Trans. Smart Grid. 2020, 11, 1980–1995. [Google Scholar] [CrossRef] [Green Version]
- Loos, M.; Werben, S.; Maun, J.C. Circulating Currents in Closed Loop Structure, a New Problematic in Distribution Networks. In Proceedings of the 2012 IEEE Power and Energy Society General Meeting, San Diego, CA, USA, 22–26 July 2012; pp. 1–7. [Google Scholar]
- Chalapathi, B.; Agrawal, D.; Murty, V.V.S.N.; Kumar, A. Optimal Placement of Distributed Generation in Weakly Meshed Distribution Network for Energy Efficient Operation. In Proceedings of the 2015 Conference on Power Control Communication and Computational Technologies for Sustainable Growth (PCCCTSG), Kurnool, India, 11–12 December 2015; pp. 150–155. [Google Scholar]
- Murty, V.V.S.N.; Kumar, A. Mesh distribution system analysis in presence of distributed generation with time varying load model. Int. J. Electr. Power Energy Syst. 2014, 62, 836–854. [Google Scholar] [CrossRef]
- Meera, P.S.; Hemamalini, S. Integrated resource planning for a meshed distribution network under uncertainty. Electr. Power Syst. Res. 2021, 195, 107127. [Google Scholar] [CrossRef]
- Teja, B.R.; Kumar, A. Optimal DG Placement in Unbalance Mesh Distribution System for Loss Reduction and Voltage Profile Improvement. In Proceedings of the 2014 IEEE International Conference on Power Electronics, Drives and Energy Systems (PEDES), Mumbai, India, 16–19 December 2014; pp. 1–5. [Google Scholar]
- Ahmad, H.W.; Ali, Q.; Kazmi, S.A.A. Optimal Placement and Sizing of Distributed Generator in Meshed Distribution System. In Proceedings of the 2019 3rd International Conference on Energy Conversation and Efficiency (ICECE), Lahore, Pakistan, 23–24 October 2019; pp. 1–6. [Google Scholar]
- Kerzel, M.; Garzon-Real, J.; Zdrallek, M.; Wolter, D.; Schacherer, C. Optimal Switch Configuration Algorithm for Dynamically Meshed Power Distribution Grids. In Proceedings of the 2020 International Conference on Smart Energy Systems and Technologies (SEST), Istanbul, Turkey, 7–9 September 2020; pp. 1–6. [Google Scholar]
- Gonzalez, S.; Gurule, N.; Reno, M.J.; Johnson, J. Fault Current Experimental Results of Photovoltaic Inverters Operating with Grid-Support Functionality. In Proceedings of the 2018 IEEE 7th World Conference on Photovoltaic Energy Conversion (WCPEC), Waikoloa, HI, USA, 10–15 June 2018; pp. 1406–1411. [Google Scholar]
Publisher’s Note: MDPI stays neutral with regard to jurisdictional claims in published maps and institutional affiliations. |
© 2021 by the authors. Licensee MDPI, Basel, Switzerland. This article is an open access article distributed under the terms and conditions of the Creative Commons Attribution (CC BY) license (https://creativecommons.org/licenses/by/4.0/).