
Ecological and/or Nutritional Scores for Food Traffic-Lights: Results of an Online Survey Conducted on Pizza in France

Abstract
:1. Introduction
2. Material and Method
2.1. The Sample Recruitment
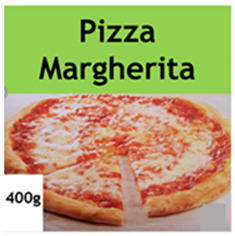
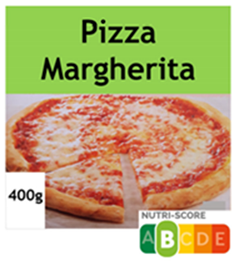
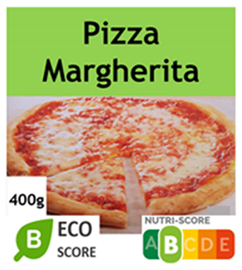
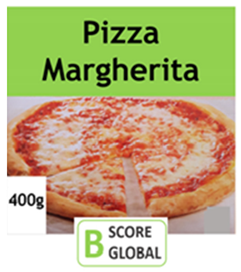
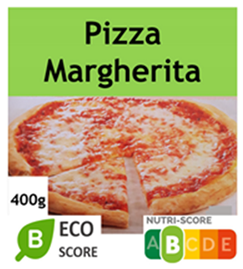
2.2. The Product
2.3. Purchase Intents for One Pizza
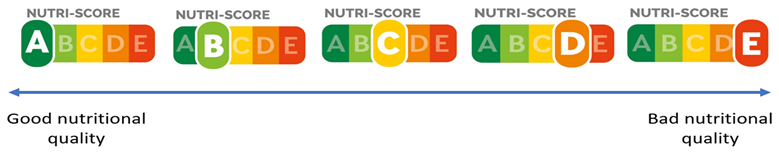
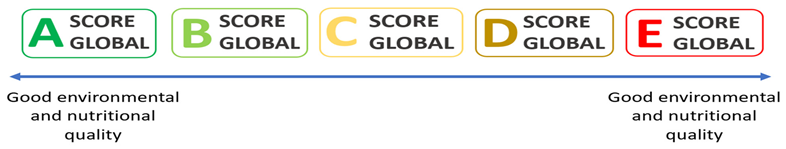
2.4. Nutri-Score, Eco-Score or Global-Score at Rounds #2 and #3
2.5. Data Analysis
3. The Results
4. Discussion
5. Conclusions
Funding
Institutional Review Board Statement
Informed Consent Statement
Data Availability Statement
Acknowledgments
Conflicts of Interest
Appendix A
- A brief description of questions asked in the web-survey:
- Messages on scores and purchase intents:
Appendix B
- Messages about purchase intents and scores
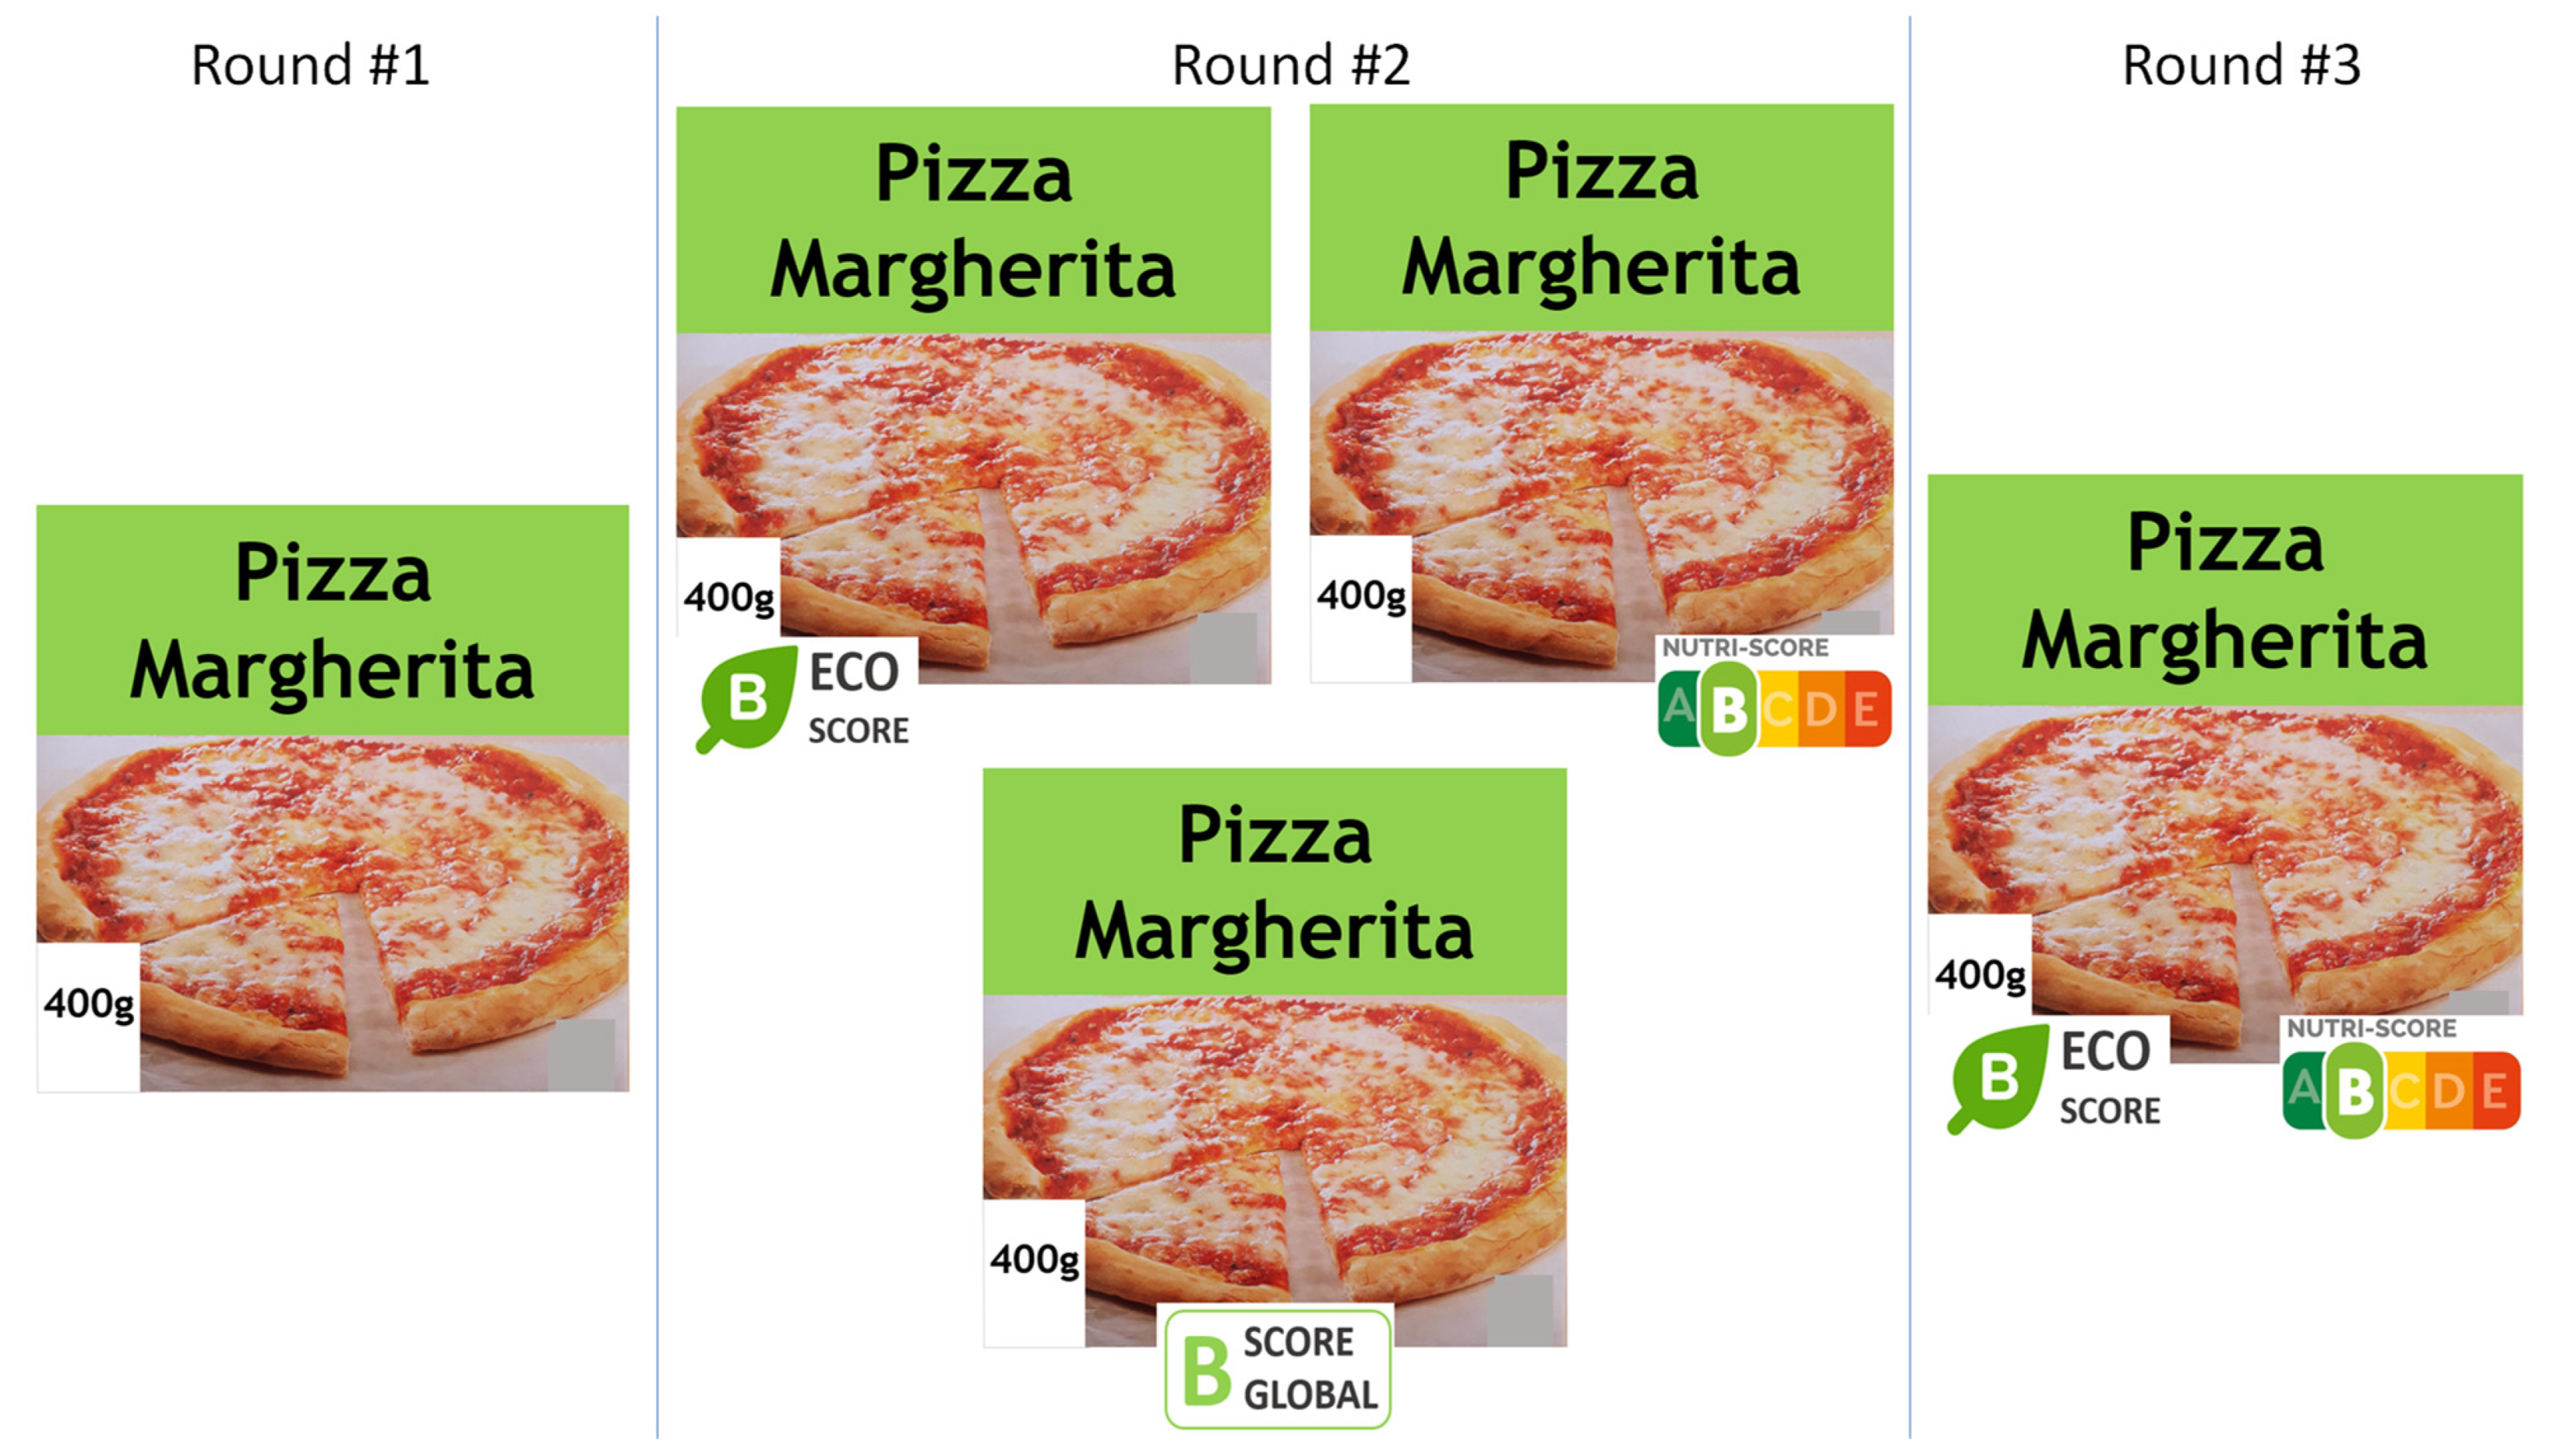
- Round #1 without any score:
- Purchase intent #1:
- Rounds #2 and #3 with different scores are described for 3 types of subgroups of Table 2.
- (1)
- For the 5 subgroups at the top of Table 2 (400 participants), the Nutri-Score was revealed at round #2 and the Eco-Score was revealed at round #3.
- Round #2:
- Purchase intent #2:
- Round #3:

- Purchase intent #3:
- (2)
- For the 5 subgroups at the middle of Table 2 (400 participants), the Eco-Score was revealed at round #2 and the Eco-Score was revealed at round #3.
- (3)
- For the 5 subgroups at the bottom of Table 2 (400 participants), the Global-Score was revealed at round #2 and the corresponding Eco-Score and Nutri-Score were revealed at round #3.
- Round #2:
- Purchase intent #2:
- Round #3:


- Purchase intent #3:
References
- Lock, K.; Smith, R.D.; Dangour, A.D.; Keogh-Brown, M.; Pigatto, G.; Hawkes, C.; Fisberg, R.M.; Chalabi, Z. Health, agricultural, and economic effects of adoption of healthy diet recommendations. Lancet 2010, 376, 1699–1709. [Google Scholar] [CrossRef]
- Auestad, N.; Fulgoni, V.L. What Current Literature tells us about Sustainable Diets: Emerging Research Linking Dietary Patterns, Environmental Sustainability, and Economics. Adv. Nutr. 2015, 6, 19–36. [Google Scholar] [CrossRef]
- Marette, S.; Requillart, V. Dietary Models and Challenges for Economics. Rev. Agric. Food Environ. Stud. 2020, 101, 5–22. [Google Scholar] [CrossRef]
- Disdier, A.C.; Marette, S. Taxes, minimum-quality standards and/or product labeling to improve environmental quality and welfare: Experiments can provide answers. J. Regul. Econ. 2012, 41, 337–357. [Google Scholar] [CrossRef]
- Cowburn, G.; Stockley, L. Consumer understanding and use of nutrition labelling: A systematic review. Public Health Nutr. 2005, 8, 21–28. [Google Scholar] [CrossRef] [Green Version]
- Neal, B.; Crino, M.; Dunford, E.; Gao, A.; Greenland, R.; Li, N.; Ngai, J.; Ni Mhurchu, C.; Pettigrew, S.; Sacks, G.; et al. Effects of Different Types of Front-of-Pack Labelling Information on the Healthiness of Food Purchases—A Randomised Controlled Trial. Nutrients 2017, 9, 1284. [Google Scholar] [CrossRef] [Green Version]
- Egnell, M.; Talati, Z.; Hercberg, S.; Pettigrew, S.; Julia, C. Objective Understanding of Front-of-Package Nutrition Labels: An International Comparative Experimental Study across 12 Countries. Nutrients 2018, 10, 1542. [Google Scholar] [CrossRef] [Green Version]
- Goiana-Da-Silva, F.; Goiana-Da-Silva, F.; Miraldo, M.; Calhau, C.; Bento, A.; Cruz, D.; Almeida, F.; Darzi, A.; Araújo, F. Front-of-pack labelling policies and the need for guidance. Lancet Public Health 2019, 4, e15. [Google Scholar] [CrossRef] [Green Version]
- Franco-Arellano, B.; Vanderlee, L.; Ahmed, M.; Oh, A.; L’Abbé, M. Influence of front-of-pack labelling and regulated nutrition claims on consumers’ perceptions of product healthfulness and purchase intentions: A randomized controlled trial. Appetite 2020, 149, 104629. [Google Scholar] [CrossRef] [PubMed]
- An, R.; Shi, Y.; Shen, J.; Bullard, T.; Liu, G.; Yang, Q.; Chen, N.; Cao, L. Effect of front-of-package nutrition labeling on food purchases: A systematic review. Public Health 2021, 91, 59–66. [Google Scholar] [CrossRef]
- Draper, A.K.; Adamson, A.J.; Clegg, S.; Malam, S.; Rigg, M.; Duncan, S. Front-of-pack nutrition labelling: Are multiple formats a problem for consumers? Eur. J. Public Health 2013, 23, 517–521. [Google Scholar] [CrossRef]
- Muller, L.; Ruffieux, B. What Makes a Front-of-Pack Nutritional Labelling System Effective: The Impact of Key Design Components on Food Purchases. Nutrients 2020, 12, 2870. [Google Scholar] [CrossRef]
- Keller, K.L.; Staelin, R. Assessing biases in measuring decision effectiveness and information overload. J. Consum. Res. 1989, 15, 504–508. [Google Scholar] [CrossRef]
- Santé Publique France. Nutri-Score. 2021. Available online: https://www.santepubliquefrance.fr/determinants-de-sante/nutrition-et-activite-physique/articles/Nutri-Score (accessed on 2 October 2021).
- Crosetto, P.; Muller, L.; Ruffieux, B. Helping consumers with a front-of-pack label: Numbers or colors? Experimental comparison between Guideline Daily Amount and Traffic Light in a diet-building exercise. J. Econ. Psychol. 2015, 55, 30–50. [Google Scholar] [CrossRef]
- Dubois, P.; Albuquerque, P.; Allais, O.; Bonnet, C.; Bertail, P.; Combris, P.; Lahlou, S.; Rigal, N.; Ruffieux, B.; Chandon, P. Effects of front-of-pack labels on the nutritional quality of supermarket food purchases: Evidence from a large-scale randomized controlled trial. J. Acad. Mark. Sci. 2021, 49, 119–138. [Google Scholar] [CrossRef] [Green Version]
- Marette, S.; Nabec, L.; Durieux, F. Improving Nutritional Quality of Consumers’ Food Purchases with Traffic-Lights Labels: An Experimental Analysis. J. Consum. Policy 2019, 42, 377–395. [Google Scholar] [CrossRef]
- Poquet, D.; Ginon, E.; Goubel, B.; Chabanet, C.; Marette, S.; Issanchou, S.; Monnery Patris, S. Impact of a front-of-pack nutritional traffic-light label on the nutritional quality and the hedonic value of mid-afternoon snacks chosen by mother-child dyads. Appetite 2019, 143, 104425. [Google Scholar] [CrossRef]
- Girard, L. Le Nutri-Score et Yuka Bousculent L’agroalimentaire. Le Monde, 14 October 2019. Available online: https://www.lemonde.fr/economie/article/2019/10/14/le-Nutri-Score-et-yuka-bousculent-l-agroalimentaire_6015367_3234.html(accessed on 2 October 2021).
- Intermarché. Chantier de «Reformulation des Recettes» Chez Intermarché: 900 Produits à Marque Distributeur déjà Optimisés. 2021. Available online: https://www.mousquetaires.com/communique/chantier-de-reformulation-des-recettes-chez-intermarche-900-produits-a-marque-distributeur-deja-optimises/ (accessed on 2 October 2021).
- Yuca. 2021. Available online: https://yuka.io/ (accessed on 2 October 2021).
- Girard, L. Avec le Roquefort, Lactalis Veut Contrer le Nutri-Score. Le Monde, 11 October 2021. Available online: https://www.lemonde.fr/economie/article/2021/10/11/avec-le-roquefort-lactalis-veut-contrer-le-Nutri-Score_6097947_3234.html(accessed on 2 October 2021).
- Ministère de la Transition Ecologique. Projet de loi Climat et Résilience: Les Députés ont Voté le Titre 1er “Consommer”. Paris, France. Available online: https://www.ecologie.gouv.fr/projet-loi-climat-et-resilience-deputes-ont-vote-titre-1er-consommer (accessed on 2 October 2021).
- Ademe. Affichage Environnemental dans le Secteur Alimentaire: Expérimentation 2020/2021. 27 August 2021. Available online: https://www.ademe.fr/expertises/consommer-autrement/passer-a-laction/reconnaitre-produit-plus-respectueux-lenvironnement/dossier/laffichage-environnemental/affichage-environnemental-secteur-alimentaire-experimentation-20202021 (accessed on 2 October 2021).
- Open Food Facts. Eco-Score: L’impact Environnemental des Produits Alimentaires. 2021. Available online: https://fr.openfoodfacts.org/Eco-Score-l-impact-environnemental-des-produits-alimentaires (accessed on 2 October 2021).
- La Note Globale. 2021. Available online: https://lanoteglobale.org/la-note-globale/ (accessed on 2 October 2021).
- Peyroche, M.; Symoneaux, R. Perception des Consommateurs Français Face aux Affichages Environnementaux des Produits Alimentaires Ecole Supérieure d’Agricultures. 2021. Available online: https://www.ademe.fr/sites/default/files/assets/documents/etude-esa-perception-consommateurs-synthese.pdf (accessed on 2 October 2021).
- Arrazat, L.; Chambaro, S.; Marty, L.; Arvisenet, G.; Nicklaus, S. Impact of Environmental Labelling on Food Choices: A Randomized Controlled Trial in a Virtual Reality Supermarket; Working Paper; INRAE: Dijon, France, 2021. [Google Scholar]
- Soler, L.G.; Aggeri, F.; Dourmad, J.Y.; Hélias, A.; Julia, C.; Nabec, L.; Pellerin, S.; Ruffieux, B.; Trystram, G.; van der Werf, H. L’Affichage Environnemental des Produits Alimentaires Rapport du Conseil Scientifique; Institut du Développement Durable et des Relations Internationales: Paris, France, 2021; Available online: https://www.ademe.fr/sites/default/files/assets/documents/affichage-environnemental-produits-alimentairs-synthese-conseil-scientifique.pdf (accessed on 2 October 2021).
- Marette, S. Consumer Confusion and Multiple Equilibria. Econ. Bull. 2010, 30, 1120–1128. [Google Scholar]
- Yokessa, M.; Marette, S. A Review of Eco-labels and their Economic Impact. Int. Rev. Environ. Resour. Econ. 2019, 13, 1–45. [Google Scholar] [CrossRef]
- Drichoutis, A.; Lazaridis, P.; Nayga, R. Consumers’ use of nutritional labels: A review of research studies and issues. Acad. Mark. Sci. Rev. 2006, 10, 1–22. [Google Scholar]
- Ares, G.; Varela, F.; Machin, L.; Antúnez, L.; Giménez, A.; Curutchet, M.R.; Aschemann-Witzel, J. Comparative performance of three interpretative front-of-pack nutrition labelling schemes: Insights for policy making. Food Qual. Prefer. 2018, 68, 215–225. [Google Scholar] [CrossRef]
- Hallstein, E.; Villas-Boas, S.B. Can Household Consumers Save the Wild Fish? Lessons from A Sustainable Seafood Advisory. J. Environ. Econ. Manag. 2013, 66, 52–71. [Google Scholar] [CrossRef] [Green Version]
- Kortelainen, M.; Raychaudhuri, J.; Roussillon, B. Effects of Carbon Reduction Labels: Evidence from Scanner Data. Econ. Inq. 2016, 54, 1167–1187. [Google Scholar] [CrossRef] [Green Version]
- Drescher, L.; Roosen, J.; Marette, S. The effects of traffic light labels and involvement on consumer choices for food and financial products. Int. J. Consum. Stud. 2014, 38, 217–227. [Google Scholar] [CrossRef]
- Loomis, J.; Ekstrand, E. Alternative approaches for incorporating respondent uncertainty when estimating willingness to pay: The case of the Mexican spotted owl. Ecol. Econ. 1998, 27, 29–41. [Google Scholar] [CrossRef]
- Marette, S.; Rosen, J. Just a little bit more legumes! Results of an online survey in Europe. Int. Food Agribus. Manag. Rev. 2021, 1–18. [Google Scholar] [CrossRef]
- Croissant, Y. Package Pglm: Panel Generalized Linear Models, R Package Version 0.2-1. 2017. Available online: https://cran.r-project.org/web/packages/pglm/pglm.pdf (accessed on 2 October 2021).
- Kahneman, D.; Tversky, A. Prospect theory: An analysis of decision under risk. Econometrica 1979, 47, 263–292. [Google Scholar]
- Girard, L. La Bataille Pour L’étiquetage Continue dans L’agroalimentaire. Le Monde, 10 July 2021. Available online: https://www.lemonde.fr/economie/article/2021/07/09/dans-l-agroalimentaire-la-bataille-pour-l-etiquetage-fait-toujours-rage_6087664_3234.html(accessed on 2 October 2021).


| Nutri-Score | Eco-Score | ||
|---|---|---|---|
 | 1% |  | 3% |
 | 16% |  | 35% |
 | 41% |  | 51% |
 | 40% |  | 9% |
 | 2% |  | 1% |
| Round #2 | Round #3 | Participants |
|---|---|---|
 |  | 80 |
 |  | 80 |
 |  | 80 |
 |  | 80 |
 |  | 80 |
 |  | 80 |
 |  | 80 |
 |  | 80 |
 |  | 80 |
 |  | 80 |
 |  | 80 |
 |  | 80 |
 |  | 80 |
 |  | 80 |
 |  | 80 |
| Intent at round #1 | ||||
| % of YES at round #1 | % of NO at round #1 | % of MAYBE at round #1 | ||
| 34% | 44% | 22% | ||
| Intents at round #2 | ||||
| Intent at round #1 | TL shown at round #2 | % of YES at round #2 | % of NO at round #2 | % of MAYBE at round #2 |
| YES |  | 59% | 22% | 19% |
| YES |  | 33% | 49% | 18% |
| YES |  | 78% | 0% | 22% |
| YES |  | 51% | 35% | 14% |
| YES |  | 67% | 16% | 17% |
| YES |  | 41% | 40% | 19% |
| MAYBE |  | 21% | 0% | 79% |
| MAYBE |  | 0% | 32% | 68% |
| MAYBE |  | 3% | 42% | 55% |
| MAYBE |  | 24% | 3% | 73% |
| MAYBE |  | 0% | 19% | 81% |
| MAYBE |  | 0% | 64% | 36% |
| MAYBE |  | 29% | 0% | 71% |
| MAYBE |  | 7% | 28% | 65% |
| MAYBE |  | 5% | 53% | 42% |
| NO |  | 7% | 68% | 25% |
| NO |  | 3% | 80% | 17% |
| NO |  | 14% | 57% | 29% |
| Independent Variables | Yes Model 1 | Yes Model 2 |
|---|---|---|
| Price | −0.78 *** (0.07) | −1.42 *** (0.22) |
| Green Nutri-Score (1/0) | 0.45 (0.36) | −0.97 (0.59) |
| Yellow Nutri-Score (1/0) | −2.72 *** (0.60) | −2.79 *** (0.61) |
| Red Nutri-Score (1/0) | −4.03 *** (0.48) | −4.26 *** (0.53) |
| Green Eco-Score (1/0) | 0.72 ** (0.35) | 1.05 *** (0.39) |
| Yellow Eco-Score (1/0) | −1.35 * (0.72) | −1.13 * (0.67) |
| Red Eco-Score (1/0) | −2.99 *** (0.72) | −3.08 *** (0.50) |
| Green Global-Score (1/0) | 1.03 ** (0.42) | 1.17** (0.47) |
| Yellow Global-Score (1/0) | −1.58 *** (0.45) | −1.71 *** (0.41) |
| Red Global-Score (1/0) | −3.31 *** (0.61) | −3.10 *** (0.63) |
| Green Nutri-Score (1/0) × Nutri-Score as the most useful label (1/0)) a | 2.82 ** (0.80) | |
| High Consumption of Pizzas (1/0) b | 1.16*** (0.33) | |
| Age | 0.03 *** (0.01) | |
| Person in charge of food purchases (1/0) c | −0.67 * (0.36) | |
| High level of studies d | −0.60 ** (0.30) | |
| σ e | 5.81 *** (0.35) | 6.33 *** (0.39) |
| Observations | N = 2400 | N = 2400 |
| Log likelihood | −1141.88 | −1122.26 |
| Intent at Round #1 | TL Shown at Round#3 | % of YES at Round #3 | % of NO at Round #3 | % of MAYBE at Round #3 | |
|---|---|---|---|---|---|
| YES |  |  | 96% | 1% | 3% |
| YES |  |  | 60% | 16% | 24% |
| YES |  |  | 60% | 19% | 21% |
| YES |  |  | 47% | 30% | 23% |
| YES |  |  | 25% | 53% | 22% |
| MAYBE |  |  | 45% | 0% | 55% |
| MAYBE |  |  | 10% | 30% | 60% |
| MAYBE |  |  | 7% | 34% | 59% |
| MAYBE |  |  | 13% | 44% | 43% |
| MAYBE |  |  | 4% | 84% | 12% |
| NO |  |  | 14% | 61% | 25% |
| NO |  |  | 5% | 82% | 13% |
| NO |  |  | 2% | 94% | 4% |
| NO |  |  | 3% | 90% | 7% |
| NO |  |  | 2% | 96% | 2% |
| Independent Variables | Yes Model 1 |
|---|---|
| Price | −0.58 *** (0.05) |
| Green Eco-Score (1/0) × Green Nutri-Score (1/0) | 1.04 *** (0.24) |
| Red Eco-Score (1/0) × Green Nutri-Score (1/0) | −0.99 *** (0.31) |
| Yellow Eco-Score (1/0) × Yellow Nutri-Score (1/0) | −1.34 *** (0.32) |
| Green Eco-Score (1/0) × Red Nutri-Score (1/0) | −1.77 *** (0.35) |
| Red Eco-Score (1/0) × Red Nutri-Score (1/0) | −3.16 *** (0.37) |
| σ a | 4.36 *** (0.25) |
| Observations | N = 2400 |
| Log likelihood | −1213.05 |
| Independent Variables | Yes Model 1 |
|---|---|
| Price | −0.68 *** (0.06) |
| Green Nutri-Score at round #2 (1/0) | −0.27 (0.35) |
| Yellow Nutri-Score at round #2 (1/0) | −1.71 *** (0.51) |
| Red Nutri-Score at round #2 (1/0) | −3.03 *** (0.38) |
| Green Eco-Score at round #2 (1/0) | −0.25 (0.35) |
| Yellow Eco-Score at round #2 (1/0) | −1.12 ** (0.47) |
| Red Eco-Score at round #2 (1/0) | −1.90 *** (0.35) |
| Green Global-Score at round #2 (1/0) | 0.17 (0.46) |
| Yellow Global-Score at round #2 (1/0) | −0.87 *** (0.29) |
| Red Global-Score at round #2 (1/0) | −0.88 * (0.53) |
| Green Nutri-Score at round #3 (1/0) | 1.23 *** (0.31) |
| Yellow Nutri-Score at round #3 (1/0) | −0.11 (0.51) |
| Red Nutri-Score at round #3 (1/0) | −1.42 *** (0.33) |
| Green Eco-Score at round #3 (1/0) | 0.46 (0.30) |
| Yellow Eco-Score at round #3 (1/0) | −0.10 (0.50) |
| Red Eco-Score at round #3 (1/0) | −1.01 *** (0.33) |
| σ a | 4.75 *** (0.18) |
| Observations | N = 3600 |
| Log likelihood | −1521.41 |
| Was the information provided by the Nutri-Score useful? % of yes | 78% |
| Was the information provided by the Eco-Score useful? % of yes | 65% |
| Which was the most important information given by these scores? | |
| - Information about the nutrition | 49% |
| - Information about the environment | 6% |
| - Both types equally (nutritional & ecological) | 38% |
| - None of these types of information | 7% |
| Do you think that a Global-Score which would synthesize the Nutri-score and the Eco-score in a single indicator would be relevant? % of yes | 53% |
| Before this survey, have you already seen the Nutri-Score in stores? | |
| - On many foods | 38% |
| - On a few foods | 41% |
| - On very few foods | 8% |
| - Not seen or no idea | 13% |
| Before this survey and when posted on foods, the Nutri-Score has influenced your purchases? | |
| - Always | 9% |
| - Often | 48% |
| - Sometimes | 28% |
| - Never or no idea | 15% |
| Before this survey, did you already hear about this new Eco-Score? % of yes | 33% |
| Should the Nutri-Score be mandatory for all foods? % of yes | 75% |
| Should the Eco-Score be mandatory for all foods? % of yes | 59% |
| Should the public authorities be involved in the definition of scores? % of yes | 65% |
| Do you use an App on your cell phone for checking food quality? | |
| - Always | 5% |
| - Often | 15% |
| - Sometimes | 23% |
| - Never | 57% |
Publisher’s Note: MDPI stays neutral with regard to jurisdictional claims in published maps and institutional affiliations. |
© 2021 by the author. Licensee MDPI, Basel, Switzerland. This article is an open access article distributed under the terms and conditions of the Creative Commons Attribution (CC BY) license (https://creativecommons.org/licenses/by/4.0/).
Share and Cite
Marette, S. Ecological and/or Nutritional Scores for Food Traffic-Lights: Results of an Online Survey Conducted on Pizza in France. Sustainability 2022, 14, 247. https://doi.org/10.3390/su14010247
Marette S. Ecological and/or Nutritional Scores for Food Traffic-Lights: Results of an Online Survey Conducted on Pizza in France. Sustainability. 2022; 14(1):247. https://doi.org/10.3390/su14010247
Chicago/Turabian StyleMarette, Stéphan. 2022. "Ecological and/or Nutritional Scores for Food Traffic-Lights: Results of an Online Survey Conducted on Pizza in France" Sustainability 14, no. 1: 247. https://doi.org/10.3390/su14010247
APA StyleMarette, S. (2022). Ecological and/or Nutritional Scores for Food Traffic-Lights: Results of an Online Survey Conducted on Pizza in France. Sustainability, 14(1), 247. https://doi.org/10.3390/su14010247