Article

Consuming to Conserve: A Multilevel Investigation of Sustainable Consumption

1
Glorious Sun School of Business and Management, Donghua University, Shanghai 200051, China
2
College of Business Administration, Central Michigan University, Mount Pleasant, MI 48859, USA
*
Author to whom correspondence should be addressed.
Sustainability 2022, 14(1), 223; https://doi.org/10.3390/su14010223
Submission received: 25 October 2021 / Revised: 22 December 2021 / Accepted: 23 December 2021 / Published: 26 December 2021

Abstract

:
As the world grapples with the ever-worsening specter of climate change, it becomes important for various nations/governments to develop mitigating measures. One of the ways to ebb the march of climate decline is to educate the population in respective countries about sustainable consumption that reduces carbon emissions. While prior research has explored the key factors of sustainable consumption in several industries, such as consumer knowledge and personal norm, it has played relatively little attention to them macro-level variables such as level of post-materialism and innovation. To this end, we study the interplay between individual-level factors and national-level variables using a hierarchical linear model on consumers’ perceived value for sustainable products and subsequent sustainable behavior. We used a dataset from the World Value Survey, which includes over 34 thousand respondents covering 40 different nations. The finding suggests that differences in individual-level sustainable consumption are explained by national-level factors. Post-materialist societies were willing to make financial sacrifices for sustainable consumption. Our findings also emphasize that the national-level factor Green Innovation modifies the relationship between Preserved Value and Sustainable Consumption at the individual-level. The findings not only sharpen our sustainability knowledge from a hierarchical view, but also provide useful guidelines for policymakers to promote sustainable consumption. Our study emphasizes that sustainable behavior is the consequence of the interplay between multilevel factors.

1. Introduction

The COVID-19 pandemic has changed many industries. Consumers are more cautious of waste and carbon dioxide emissions [1]. The pandemic has also prompted many companies to take action to apply sustainable development. The fashion apparel industry is a typical example of Nike’s Reuse-A-Shoe program, which will recycle shoes into materials that will be used for other sports products. Despite the environmental pressure, the key factor to promote green products is sustainable consumption behavior [2]. Consumers play a critical role in green innovation as they shape the market landscape and technology development. Hence, more activities are needed to raise consumers’ awareness of sustainable [3]. Moreover, governmental effects are instrumental towards sustainable development and environmental awareness, as the policy can not only stimulate green innovation to affect the industry but also advocate sustainable consumption on national levels [4].
It is believed that the most effective way for environmental protection is to raise taxes on pollutions [5]. Instead of carbon tax policies, industries prefer supportive green innovation to guide future trajectories. These green innovations promote the development of sustainable products and advocate sustainable consumption. However, it is not clear how these green innovations can change companies and consumers as a national factor. Studies also find that education is a critical factor. People with higher education are more likely to buy green products than those with lower education [6]. Well-educated consumers can identify environmental problems and are more sensitive to sustainable goods [7]. However, education is an individual level factor. It is nested within national factors. We suggest that post-materialism, which emphasizes self-expression and quality of life over economic and physical security, is an important national level factor. Without considering the interplay between national level and individual level factors, the current literature appears a lack of understanding on why people behaved so differently from place to place. Thus, our research question is, how do the national-level variables influence personal behavior? It is important to raise such a research question, as it helps us to elaborate nesting effects on sustainable behavior. This paper aims to reveal the interplay between national and individual level factors.
To answer the question and to better understand the sustainable behaviors across different countries, we consider both individual-level and national-level effects in our analysis method. We employed a dataset from World Value Survey. The dataset contains samples from 40 different nations, which help us to investigate the behavior within nesting countries. Hierarchical modelling is employed as the main analysis approach. Since the participants are from different countries, they share some common variance associated with being in the same country [4,8]. From the findings of the current literature, we believe sustainable behavior is the consequence of multilevel interactions. We seek to explain the complex interaction by considering factors from both levels. Therefore, this study has three key research objectives: (1) To explore people’s sustainable behavior in different countries. Specifically, why in some post-materialist countries are consumers more willing to insist on sustainability? (2) To investigate on the national level, how do green innovation reshape the industries and further reshape people’s sustainable behavior? (3) On the individual level, how does a person’s preserved value affect his/her sustainable behavior?
This paper enables us to exam sustainable behavior from a more realistic perspective, specifically by considering national influence. Moreover, the findings draw a clear picture of how national factors can change people’s behavior. It can be useful supports for authorities to propose new green policies.

2. Literature Review

Previous studies propose different types of definitions of sustainable consumption behavior (SCB). Lee [9] defines SCB as environmental-friendly consumption. Dong [10] found that SCB includes green purchases, reusing, and recycling. In addition, SCB is known as the activities that consumers strive to protect the ecological environment and minimize the negative impact on product purchasing, using, and post-processing [11]. Sustainable consumption behavior often comes with higher costs. However, in many developed economies, consumers are willing to bear the extra for sustainability. For example, when choosing products, 67% of the Dutch, 80% of the Germans, and 77% of the American consumers would consider environmental issues. Most of them are willing to take financial sacrifices on environmentally friendly products [12]. Individuals are willing to pay more because some studies find that corporations do not act responsibly toward the environment [13]. However, customers will consider ecological issues when making a purchase [14]. They hope that enterprises can save energy and improve energy efficiency, so as to reduce environmental pollution. For years, sustainable consumption has drawn a lot of attention in ecology, social psychology, biology, and many other fields [15,16]. It is rated as the most significant element to our sustainable ecosystem [17,18]. Researchers have tried different approaches to raise consumers’ environmental awareness, such as investing in green innovation and technology to develop better products, reducing energy consumption through supply chain processes, and marketing brands’ environmental value [19].
The current literature studied sustainable consumption behavior from many prospects, and the researchers have developed several variables to measure and explore the connections related to sustainable behavior. Straughan [20] used perceived consumer effectiveness (PCE) as a key indicator for ecologically conscious consumer behavior. Chan [21] then adopted the PCE to classify heavy and light green consumers. Wang [22] developed environmental protection knowledge (EPK) to measure consumers’ recycling behavior. Lao [23] focuses on how product innovation can change sustainable consumption behavior. With the development of sustainable consumption literature, a two-level research pattern emerged.
In this paper, we try to analyze sustainability through a multi-level point of view. The approach is often known as mix effect modeling. As people are wildly spread in many different nations, the data consist of their behavior nested within countries. Currently, there are many sustainability studies, for this paper, we try to reveal the interactions between national and individual level factors. Therefore, we focus on three types of literature. They are, firstly, the antecedents at the individual level, secondly, the national-level impacts, and lastly, specific industrial solutions. Table 1 outlined the variables that are commonly used in sustainable consumption literature. These variables can be categorized into two different levels. For the individual level, studies are striving to explore the antecedents of persons’ consumption behavior. For example, Ting [24] points out that environmental protection is mainly driven by consumer value, followed by price, emotion, and quality. Tina Joanes [25] developed a Norm Activation Model (NAM) to study how personal norms reduce clothing consumption. Hwang [26] revealed the moderating role of consumer knowledge. Notably, many studies at the individual level focus on specific industries, for example, fashion apparel. As the environmental issues already raise the concerns of authority and academics. For the national level, studies are trying to compare sustainable behavior among different countries and revealing how national factors influence people’s sustainable behavior. Duroy [8] proposed and tested his renowned affluence hypothesis. The article suggested that national income affects people’s decisions on purchasing and recycling. Gelissen [4] further pointed out that consumers, who live in high-income countries, have higher post-materialist tendencies. These consumers are more willing to make financial sacrifices for environmental protection. Harsh also found a positive correlation between green innovation and green purchase intention [27].
The studies on sustainable consumption behavior covered various factors at both the national and individual levels. The impact of sustainable consumption behavior is the hybrid consequence from both levels. Previous studies often focused on one level and did not adopt a multi-level approach to analyze. To sharpen our knowledge on sustainable consumption behavior, we establish a compound model by considering key variables from the national and individual levels.
At the national level, many studies have acknowledged the impact of national wealth and environmental attitude. However, we use post-materialism as key independent variable. Post-material emphasis human relationships and the meaningfulness of people’s unique lives, including trust, community resilience and participation in the life of society as well as establishment, and flourishing of civil rights and personal expression [30,31,32]. Not only because wealth and attitude are interconnected, but also because post-materialism can better represent these two variables [4]. Green innovation is also adapted as key independent variable since it reflects the determination of industry leaders and country governors [27]. Green innovation is a concept with both internal drive and external response. It not only has the novelty and value of innovation, but also emphasizes the attributes of resource conservation and environmental improvement [33,34]. Green innovation can be divided into “hardware” and “software” [35]. “Hardware” is mainly realized by adopting environmental protection materials, developing energy-saving technology, and reducing process pollution; “software” is mainly realized by providing green services, implementing green management, and carrying out green marketing [36]. So, in our paper, we focus on the “hardware” in clothing industry. Green innovation also has strong guiding effects on individual behavior [37]. At the individual level, both personal norms and personal environmental knowledge have proved to have a positive impact on sustainable consumption. These two factors can further be aggregate to a variable called perceived value [
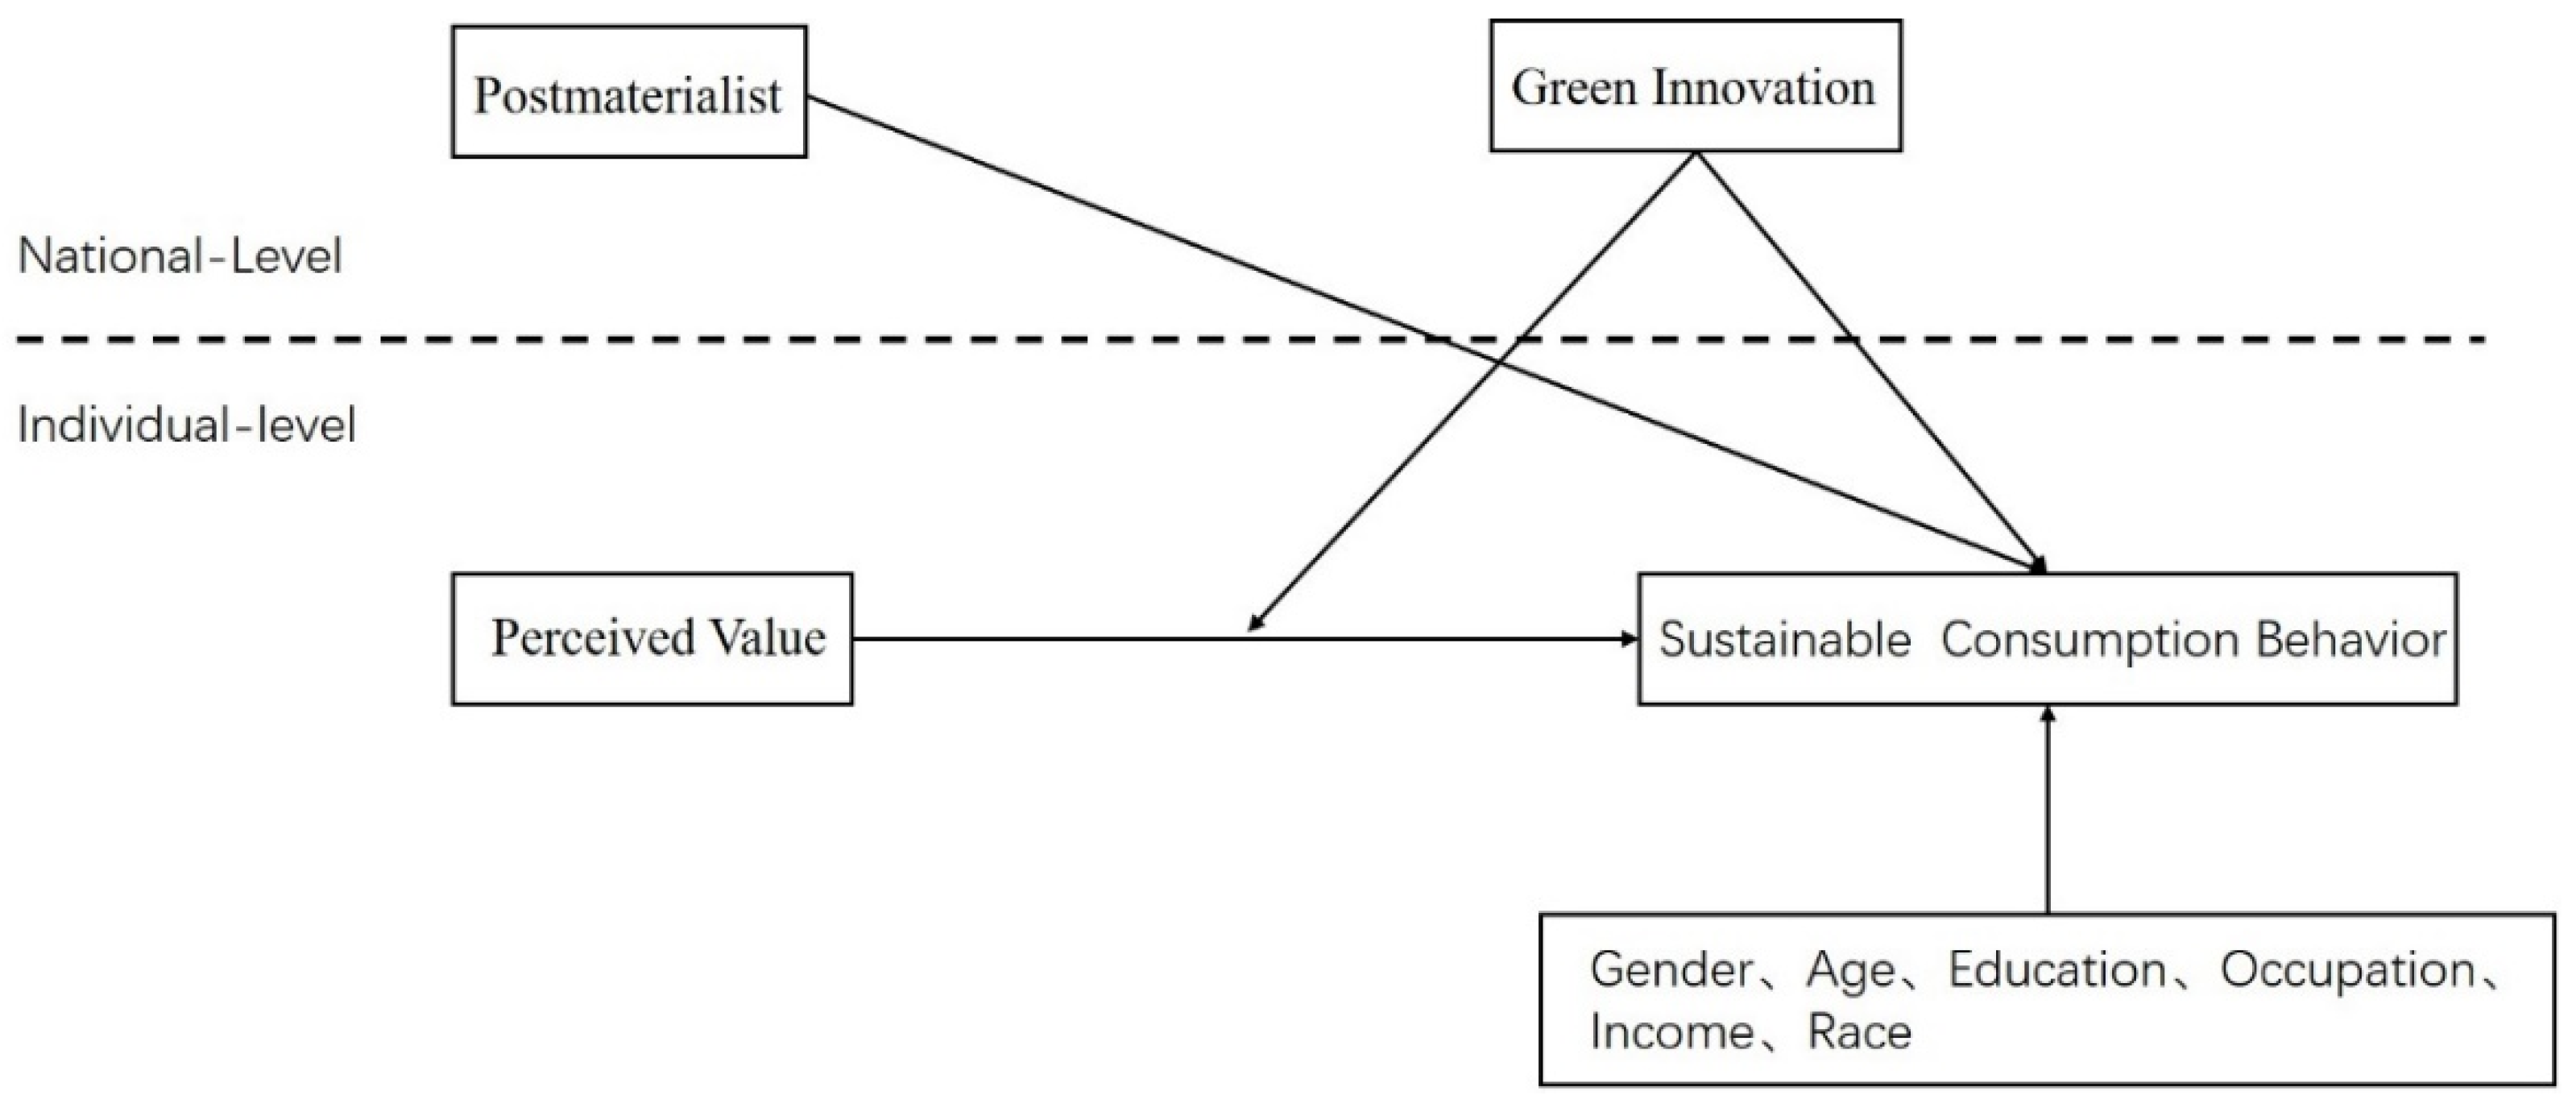
24], which strongly influence sustainable behavior. Thus, this paper selects sustainable consumption behavior as dependent variable, perceived value as independent variable at individual level, and post-materialism, green innovation as independent variable at national level.

3. Research Model and Hypotheses

This study aims to examine the determinants of sustainable consumption behavior from a multi-level perspective. Figure 1 depicts the research framework, which reflects the impacts of post-materialism and green innovation from national-level and perceived value from individual-level on sustainable consumption behavior. The research framework also considers the moderate effect of national-level construct. The multi-level analysis not only reveals how the perceived value as the antecedent affects the consumption behavior, but also compares the role of postmaterialist and green innovation in different countries.
The proposed conceptual model as follows:

3.1. Consumer Perceived Value

Perceived value refers to the individual’s subjective evaluation of product or service utility [38]. The trade-off is mainly based on the gains and losses perceived by consumers. Sheth [39] put forward the theoretical framework of perceived value. They believed that perceived value includes five dimensions: functional value, social value, emotional value, cognitive value, and conditional value.
Further, a framework of sustainable consumption behavior is developed [40] based on Sheth’s work. Within the framework, four types of value are related to sustainable behavior. Functional value reflects the viewpoints on price, quality, and function. Social value brings consumers respect and social praise through their sustainable behavior. Emotional value refers to a psychological bond with the product, such as emotional preference. Green value reflects the willingness and experience of ecological system contribution and environment protection. Papista [41] found that the perceived value of green products increases willingness to pay in the purchasing decision. Therefore, when a consumer exercises sustainable behavior, he or she hopes to obtain these physical and emotional values. Asshidin [42] found that the customers’ perceived functional value and emotional value can effectively predict their purchase intention of domestic products. This means sustainable behavior brings consumers perceived values, and with more of these perceived values, consumers are more willing to bear financial sacrifices. Medeiros [43] also confirmed that perceived value can increase consumers’ willingness to pay for green products. From these studies, we consider consumer perceived value as one of the most significant explanatory variables at the individual level. Thus, we posit the hypothesis below:
Hypothesis 1.
Consumer Perceived Value positively impacts Sustainable Consumption Behavior.

3.2. Post-Materialist

Inglehart constructed a post-materialism framework based on the scarcity hypothesis and Maslow’s hierarchy of needs [30]. Maslow’s hierarchy of needs posits that people typically aim at achieving basic needs such as survival and security before they turn to other psychological needs and self-actualization goals. The scarcity hypothesis posits that people tend to value what they do not have in abundance. Therefore, when the basic security needs are largely fulfilled, people would turn to more abstract and expressive values, such as freedom, justice, and self-actualization.
Inglehart’s theory of post-materialism has generated a large body of literature in the past decades. He argued that people growing up in relatively affluent and secure social settings would exhibit a stronger post-materialism [30]. A large amount of cross-national evidence was presented to support the theory’s key arguments [44,45,46]. Cross-national studies had shown that the concept and measure of post-materialism were useful for various purposes, such as explaining people’s environmental attitudes and consumer behaviors [47,48,49].
A survey [50] of 838,151 people from 158 countries found that the richer the country is, the higher post-materialist needs (pertaining to autonomy, social support, and respect) of its citizens. The level of a nation’s affluence was also considered to be an important determinant of environment protection attitudes. A study showed that countries with higher post-materialistic attitudes rank higher in their readiness to make financial sacrifices for environmental protection [51]. Gelissen’s study [4] has similar findings that a country’s affluence is positively related to public willingness to take on higher costs for environmental quality. There is a direct and significant association between post-materialism and public support for sustainability. Peoples are more concerned about sustainable behavior if they live in a country dominated by post-materialism. Post-materialism is a national level variable and sustainable behavior is an individual level variable. Therefore, we hypothesize that:
Hypothesis 2.
Post-materialism has a positive impact on the Sustainable Consumption Behavior.

3.3. Green Innovation

Green innovation has shown a rising trend for more than decades. It is known as a key factor for achieving environmental protection and resource saving for industrial and political [52]. Green innovation enables companies and countries gaining long-term development and competitive advantages. Green innovation forces on ecology systems, emphasizes the pursuit of economic benefits while minimizing the negative impact of resource consumption and pollution activities. Green innovation aims to achieve harmonious and sustainable development of ecology, economy and society [53]. Although green innovation has a clear goal, the implementation process is complex, which requires efficient guiding and leading from authorities.
Governmental support is known as a key determinant of green innovation [52]. Governments want to push new technology and advocate sustainable consumptions by establish green policies. In 2004, Ireland was the first country in the world to impose tax on plastic shopping bags, which led consumers to switch to durable fabric bags. This policy not only changed peoples’ habits, but also significantly influenced social development [54]. The German government had also found an effective way to help manufacturers to recycle and reuse the packaging waste. Retailers and manufacturers are sharing the cost of collecting packaging waste in residential areas, which slightly passes the cost to consumers. This policy rase the environmental issues and let both consumers and manufactures engaging in green production and consumption [55]. Green innovation is not only focus on new technology on an industrial level that can save production cost, but also focus on sustainable society development on a national level. Therefore, we hypothesize that:
Hypothesis 3a.
Green Innovation has a positive impact on the consumer Sustainable Consumption Behavior.
Green innovation does not have to be directly related to production nor consumption. Some innovations are the methodical creation of the sustainable habits. For example, Shanghai, as the biggest city in China, has endured its trash recycling for a long time. In July 2019, a strict waste classification policy was implemented, but residents have little knowledge of classification code. After struggling for weeks, a useful mobile application was developed which allow users to classify waste by simply take a picture [56]. Technology in this case act as catalyst that improved outcome of green policy [57]. In fact, instead of restricting consumers’ behavior, today more innovations are helping consumers to achieve their environmental goals [58]. Green innovation, as a national level construct, is supporting individuals to have sustainable habits. Thus, we hypothesize that:
Hypothesis 3b.
Green Innovation moderates the relationship between consumer Perceived Value and consumer Sustainable Consumption Behavior.

3.4. Control Variables

Previous studies have found that demographic variables such as gender, age, education level, occupation and income have an impact on consumption behavior [4,59,60,61]. In a cross-level model, these control variables must be considered, as their impacts often vary from cluster to cluster. These variations are hard to spot in a regular regression model. Therefore, sex, education, income, age, occupation, and race are selected as the control variables in this study. They are tested later to model the nesting effects. This testing method is more appropriate than a conventional multiple linear regression.

4. Methodology

4.1. Sample and Data Collection

To test the hypotheses presented in Figure 1, we adopted data from the World Values Survey (WVS) [62]. It is a global research project aimed at exploring people’s values, beliefs, and political impact. These data are also often used by governments, scholars, international organizations such as the World Bank and the United Nations (UNDP and UN-Habitat).
We use the dataset of WVS WAVE 7, which covers from mid-2017 to early-2020. Due to the outbreak of COVID, the 2021 data is still not available. So, the data we used was not affected by pandemic. The survey provide insight into the values and attitudes of the people from 81 countries (regions) around the world by using standardized cross-cultural measures [4]. Topics covered include human values and goals concerning politics, economics, religion, sexual behavior, gender roles, family values, communal identities, civic engagement, and ethical concerns, and such issues as environmental protection, scientific process and technological development, and human happiness [63].
World Values Survey is a renowned international research program that allows researchers and scientists to conduct studies in a comparative cross-nation and over-time perspective. In the sustainability and environmental protection field, WVS data facilitated many achievements, for example, John Gelissen [4] adopted variance analysis to reveal different protection methods across countries. Jesper and Ignacio [64] also used WVS to study people’s psychological health and behavior. Many studies highly recommended WVS data, especially for cross-national analysis. Therefore, this paper used the latest dataset from WVS as the main research samples. Within the many WVS variables, we chose social values, attitudes and stereotypes (items from Q1 to Q6 and Q27 to Q32) as consumer perceived value variable items. We selected the post-materialist index (items from Q152 to Q157) as post-materialist variable items. We selected the science and technology index (items from Q158 to Q163) as green innovation variable items. In addition, we selected MN31 TO MN38 as consumers’ sustainable consumption behavior. Detailed information about the origins of the WVS and how they were organized can be found on the World Values Survey website (www.worldvaluessurvey.org) (accessed on 30 December 2020).

4.2. Data Analysis

SPSS 22.0, AMOS 23 and HLM 6.08 were used to test hypotheses. We start with a descriptive analysis to present the demographic characteristics of the data. Then, a measurement model was used to test data reliability and validity. The Cronbach’s α coefficient was to test the reliability, and all the variables were between 0.588–0.782, which meant items have good reliability. The confirmatory factor analysis was to test the validity. The value of the composite reliability (CR) was greater than 0.7, the average variance extracted (AVE) value was greater than 0.5, which indicated that the scale has a good validity [65]. Following the measurement models, Hierarchical linear modeling (HLM) was used to test the multilevel hypotheses.
In this paper, samples consist of 34,084 respondents which cover 40 nations (regions). Notably, we deleted all the null values records from the raw dataset. Therefore, our dataset contains fewer records than the raw dataset. Our dataset includes Andorra (881), Argentina (431), Australia (1426), Bangladesh (336), Bolivia (1220), Brazil (690), Chile (398), China (1993), Colombia (1195), Cyprus (282), Ecuador (623), Ethiopia (552), Greece (739), Hong Kong SAR (1785), Indonesia (2001), Iran (830), Iraq (477), Kazakhstan (571), Kyrgyzstan (612), Macau SAR (668), Malaysia (1192), Mexico (1041), Myanmar (868), Nicaragua (785), Nigeria (615), Pakistan (614), Peru (802), Philippines (920), Puerto Rico (687), Romania (544), Russia (920), Serbia (589), South Korea (847), Taiwan ROC (894), Tajikistan (1029), Thailand (960), Tunisia (422), United States (1139), Vietnam (879), and Zimbabwe (627). It is also conspicuous that within the dataset, most respondents are from developing countries (about 87%). It happens as WVS explores people’s values and beliefs all over the world, and do not focus on the proportion of developed and developing counties. The proportion of the participated countries was shown in Figure 2.

5. Results

5.1. Demographic Analysis

Among a total of 34,084 respondents, 55% were male (=1), and 45% were female (=2). For variable age, the mean is 42.7 with a standard deviation of 15.0. In total, 13% of respondents are between 16 to 25 years old, 24% were between 26 to 35 years old, 22% were between 36 to 45 years old, 19% were between 46 to 55 years old, and 22% were 56 years and older. In terms of education, codes from 1 (primary level) to 8 (doctoral level) are used to classify education levels. In total, 26% had an undergraduate degree (=6), or above (=7, =8), 8% had a short-term tertiary certificate (=5), 9% had post-secondary non-tertiary education (=4), and 38% were secondary education and below (=3, =2, =1). Occupations are classified into 11 categories, 17% were professionals and technicians (e.g., doctors, teachers) (=1), 17% were sales (e.g., sales managers, shop owners) (=4), 13% were clericals (e.g., secretaries, clerks, office managers) (=3), 10% were services (e.g., restaurant owners, police officers) (=5), 10% were skilled workers (e.g., foremen, motor mechanics) (=6), 9% were unskilled workers (e.g., laborers, porters) (=8), 9% Semi-skilled workers (e.g., bricklayers, bus drivers) (=7), 5% were higher administrations (e.g., bankers) (=2), and 10% were farm workers or farm owners (=9 or 10). For the income levels, 26% were low-income people (=1), 8% were high-income people (=3). The majority of samples (66%) were in the medium-income group, according to the criteria of World Economic Forum [66]. Table 2 summarizes the demographic characteristics.

5.2. Hierarchical Linear Model Analysis

A two-layer linear model, as in Figure 1, was created to test sustainable consumption behavior. This hierarchical linear model connected the national-level and individual-level data and discriminated the individual and national effects clearly. So that the relationships in the model can be meticulously explained. Hierarchical linear model is appropriate in this study, as a conventional multiple linear regression analysis assumes that all cases are independent of each other. Additionally, in this research, all records are nested within countries. Thus, hierarchical linear model is more applicable. To test the hypotheses in a hierarchical linear model, four steps procedure is needed, including null model, random coefficients regression model, intercept-as-outcomes regression model, and full model.

5.2.1. Null Model

The null model is the first step of hierarchical linear model testing. The null model starts without independent variables in the equation of each layer. It is conducted to decompose the total variance of consumers’ sustainable consumption behavior (SCB) at two levels to determine the necessity of the establishment of the second layer model. The particular formulas are as follows:
Individual   level :   S C B i j = β 0 j + r i j National   level :   β 0 j = γ 00 + u 0 j Mixed   model :   S C B i j = γ 00 + u 0 j + r i j
where P u r c h a s e i j is the dependent variable in this model, consumers sustainable consumption behavior; β 0 j is the regression coefficient of dependent variable (individual-level) to independent variable; γ 00 denotes the intercept of the national-level variable to β 0 j ; r i j and μ 0 j are the random elements of these two levels.
The estimated results of the model were shown in Table 3. The fixed effect of the model passed the significance test, and the intra and inter group variance were 0.13322 and 0.2236, respectively. Afterwards, it can be calculated that the Intraclass Correlation Coefficient (ICC), which gives the proportion of the total variance that exists among groups [56], was 0.14 ( I C C ( 1 ) = τ 00 / ( τ 00 + σ 2 ) = 0.2236 / ( 0.2236 + 0.13322 ) = 0.14 ), indicating that 14% of the variability in individual -level was due to the national-level. Under this circumstance, if ICC (1) of the model estimation results greater than 0.059 [67], it can be considered that the model fits the requirement of hierarchical linear model analysis. The ICC (1) results also suggested a nested data structure, which means further multi-level analysis is required. Thus, HLM was used to test the cross-level hypotheses.
ICC (1) is an important result, as it points out that regarding on people’s sustainable behavior, there is significant nesting effects. In other word, we have to study the behavior in a hierarchical linear model. If we draw conclusions from one country, we must understand that conclusions are solipsistic and fragmentary. The conclusions may not be appropriate in other countries.

5.2.2. Random Coefficients Regression Model

The random coefficients regression model can judge whether the first-level variables have significant effects on the dependent variable. It can also further determine whether the first-level variables are significantly affected by the second-level variables. In the random coefficient regression model, only first-level independent variables are supposed to be introduced. Based on the null model, the random coefficients regression model is established as follows:
Individual   level : S C B i j = β 0 j + β 1 j ( S E X i j ) + β 2 j ( E D U C A T I O N i j ) + β 3 j ( I N C O M E i j ) + β 4 j ( P E R C E I V E D   V A L U E i j ) + r i j National   level : β 0 j = γ 00 + u 0 j β 1 j = γ 10 β 2 j = γ 20 β 3 j = γ 30 β 4 j = γ 40 + u 4 j Mixed   model : S C B i j = γ 00 + γ 10 S E X i j + γ 20 E D U C A T I O N i j + γ 30 I N C O M E i j + γ 40 ( P E R C E I V E D   V A L U E i j ) + u 4 j ( P E R C E I V E D   V A L U E ) + r i j
where X i j ( S E X i j ,   E D U C A T I O N i j ,   I N C O M E i j ,   a n d   P E R C E I V E D   V A L U E i j ) are the prediction variables of the individual-level. The other variables are the same as variables in Formula (1).
The results of fixed effects of independent variables as shown in Table 4. Sex ( γ 10 = 0.011 ,   p < 0.01 ), education ( γ 20 = 0.012 ,   p < 0.001 ), income ( γ 30 = 0.020 ,   p < 0.001 ), and consumer perceived value ( γ 70 = 0.011 ,   p < 0.05 ) have significant positive effects on sustainable consumption behavior. Hypothesis 1 was supported. However, the effects of age, occupation and race were not significant. Meanwhile, the deviance (28,061), which represented how well the model fitted the data, was also smaller than the null model (28,217). The statistical results revealed that the individual-level model showed a better model fit than the null model. However, the ICC (2) showed that 0.7% (0.133 − 0.132)/0.133 = 0.007) of variance should be explained by considering the contextual (cross-level) factors. Thus, we further examined a model including the individual-level and national-level variables in the next stage.
To this point, our research is in line with other cross counties studies [49]. With the result of fixed effects and ICC (2), a two-level modelling approach is considered as appropriate. As Pisano [49] pointed out, when studying at people’s sustainable behavior, we should not neglect the influence from society.

5.2.3. Intercept-as-Outcomes Regression Model

In the intercept-as-outcomes regression model, the control variables in the individual-level and prediction variables in the national-level are included. In the two-level model, the direct effects were examined. Based on the random coefficient regression model, the intercept-as-outcomes regression model is established as follows:
Individual   level : S C B i j = β 0 j + β 1 j ( S E X i j ) + β 2 j ( E D U C A T I O N i j ) + β 3 j ( I N C O M E i j ) + r i j National   level : β 0 j = γ 00 + γ 01 ( P O S T M A T E R I A L I S T ) + γ 02 ( G R E E N   I N N O V A T I O N ) + u 0 j β 1 j = γ 10 β 2 j = γ 20 β 3 j = γ 30 Mixed   model :   S C B i j = γ 00 + γ 01 ( P O S T M A T E R I A L I S T ) j + γ 02 ( G R E E N   I N N O V A T I O N ) j + γ 10 S E X i j + γ 20 E D U C A T I O N i j + γ 30 I N C O M E i j + u 0 j + r i j
where X i j ( S E X i j ,   E D U C A T I O N i j ,   I N C O M E i j ) are the control variables of the individual-level; W j ( P O S T M A T E R I A L I S T j ,   G R E E N   I N N O V A T I O N j ) denotes prediction variable of the national level; γ p 0 denotes the intercept of the national-level variable to β p j ; γ 0 q is the slope of the national-level variable to β p j . The other variables are the same as variables in Formula (1).
Table 5 showed that both post-materialist ( γ 01 = 0.294 ,   p < 0.1 ) and green innovation ( γ 02 = 0.005 ,   p < 0.1 ) in the level-2 had significant positive effects. The control variables (sex, education, income) in the level-1 also have significant effects on consumer sustainable consumption behavior. It is also shown that the deviance (28,059) was smaller than the null model. To examine the indirect effects of the national-level variables, we conducted a full model analysis that included the direct effects from both levels and the moderating effects across different levels.
This is important evidence, now we know that the national-level factors have significant effects on people’s behavior. Together with the control variables, we can conclude that people’s behaviors are so different. The behavior is depending not only on the personal status but also on where they live, and the overall status of the place they live.

5.2.4. Full Model

According to the analysis result of the random coefficients regression model and intercept-as-outcomes regression model, independent variables in individual-level passed the random effect test, it indicates that different nations may play roles in the model, and we need to investigate the variation of the regression coefficients in national level. In other words, the data nesting effect needs to be further tested. Therefore, national-level variables and individual-level variables should both be introduced to the following full model:
Individual   level : S C B i j = β 0 j + β 1 j ( S E X i j ) + β 2 j ( E D U C A T I O N i j ) + β 3 j ( I N C O M E i j ) + β 4 j ( P E R C E I V E D   V A L U E i j P E R C E I V E D   V A L U E ¯ . j ) + r i j National   level : β 0 j = γ 00 + γ 01 ( P O S T M A T E R I A L I S T ) + γ 02 ( G R E E N   I N N O V A T I O N )       + u 0 j β 1 j = γ 10 β 2 j = γ 20 β 3 j = γ 30 β 4 j = γ 40 + γ 41 ( G R E E N   I N N O V A T I O N j G R E E N   I N N O V A T I O N ¯ ) + u 4 j Mixed   model :   S C B i j = γ 00 + γ 01 ( P O S T M A T E R I A L I S T ) j + γ 02 ( G R E E N   I N N O V A T I O N ) j + γ 10 S E X i j + γ 20 E D U C A T I O N i j + γ 30 I N C O M E i j + γ 40 ( P E R C E I V E D   V A L U E i j P E R C E I V E D   V A L U E ¯ . j ) + γ 41 ( G R E E N   I N N O V A T I O N j G R E E N   I N N O V A T I O N ¯ ) ( P E R C E I V E D   V A L U E i j P E R C E I V E D   V A L U E ¯ . j ) + u 0 j + u 4 j ( P E R C E I V E D   V A L U E i j P E R C E I V E D   V A L U E ¯ . j ) + r i j
where W j ( P O S T M A T E R I A L I S T j ,   G R E E N   I N N O V A T I O N j ) denotes prediction variables of the national-level; γ p 0 denotes the intercept of the national-level variable to β p j ; γ 0 q is the slope of the national-level variable to β p j . The other variables are the same as variables in Formula (1).
In the full model, Hypothesis 3b was examined by considering the moderating effects across levels and the direct effects from both individual and national levels. Table 6 showed that both post-materialist ( γ 01 = 0.270 ,   p < 0.1 ) and green innovation ( γ 02 = 0.008 ,   p < 0.1 ) had significant positive effects. Hypotheses 2 and 3a were supported. There is barely any difference between full model results and previous models’ results, especially on the main effects. However, in the full model, the moderating effect ( γ 41 = 0.014 ,   p < 0.05 ) was revealed. This result confirmed the hypothesis that green innovation had a moderating effect on the relationships between consumer perceived value and sustainable consumption behavior. In other words, for the countries which have the same level of sustainable perceived value, the higher green innovation performance would result in better sustainable behavior.
The full model examined our hypothesis and outlined how these factors from different levels interplay together. In the full model, it is clear that the response variable is the consequence of both level factors. The full model results reassure that hierarchal modelling is the better approach to study sustainable behavior, as we cannot neglect the national level factors.
In terms of the model fit, the full model has the smallest deviance (28,055) among all these models. It indicates that the full model fitted the data better than other models. The results of these four models were shown in Table 7.

5.3. The Moderating Effect

From the full model result, it can be seen that the green innovation had a strong moderating effect on consumer perceived value and consumption behavior. We verified the moderating effect with regression analysis by making use of the PROCESS program developed by Hayes [68]. In Table 8, the interaction of green innovation and consumer perceived value was significantly related to consumer sustainable consumption behavior ( β = 0.015 ,   p < 0.01 ,   Δ R 2 = 0.003 ). To aid the interpretation, these relationships were presented graphically in Figure 3. The effect of consumer perceived value on sustainable consumption behavior was significantly increased when the green innovation was high. Therefore, the results supported Hypothesis 3b.

6. Discussion and Conclusions

Our research is novel in sustainability studies, as hierarchical model is not commonly used in current literature. The hierarchical analysis requires huge data. We used a dataset from WVS, which contains over 34 thousand respondents covering 40 different nations. With this huge volume of data and the cross-level modeling tool, we are able to better understand sustainable behavior from a higher perspective. Specifically, when we exam sustainable behaviors, instead of focusing on personal antecedents, we should consider additional national-level factors. It is essential to understand that sustainable behavior is the consequence of the interaction between multilevel factors.
Our models revealed the connections at national and individual levels, with a range of five socio-demographic variables, sustainable consumption behavior, consumer perceived value, post-materialist, and green innovation. There was a difference in individual-level, of about 14% (ICC) was generated at the national level. This article provided novel cross-national evidence of how and to what extent sustainable consumption behavior was related to individual and national-level characteristics. Our study has theoretical implications in both individual-level and national-level.
At the individual level, the control variables, sex, education, and income, had significant effects on sustainable consumption behavior. These findings are consistent with Lee (gender) [59], (education and income) [60] and Zelezny (gender) [61]. We found that sustainable consumption behavior is stronger with females, higher education, and higher income samples. Many green fashion brands are targeting female consumers. As compared to males, females are believed more sensitive to others members in the community. They often show up their helpfulness and altruistic behaviors [69]. Moreover, people who have received higher education have more knowledge and better understanding of sustainability. They are more concerned about the impact on the environment and are willing to adapt the sustainable lifestyle. It is also interesting that the result shows no difference in their behavior regarding on different ages, occupations, and races. It means people with the same value perception should have similar consumption behaviors, no matter if they are young or old, a teacher or a cook, an Asian or European.
As for consumer perceived value, our result is similar to the research of Zeithaml [70], Chen Yu Shan [71], En-Chi [72] and Biswas [73]. We found that consumer perceived value had a significant effect on sustainable consumption behavior. This means fashion manufacturers should pay more attention on establish brands’ green reputations. For some renowned brands, green capability should also consider as a novel marketing breakthrough. Our result also suggests that the improvement of production technology, reduction of production cost or improvement of product quality can not only increase the functional value of green products perceived by consumers, but also effectively enhance their purchase intention. Consumers want to positively shape their personal image by buying and wearing sustainable garments. These green consumption behaviors enhance their values and personality. Thus, consumers are more likely to engage in sustainable consumption behavior when they perceive high social value. The emotional value will lead to the change of consumer sentiment, and further affect their behaviors. Recent years, fashion brands are competing to get be the green leaders in the market. Their activities are not only shaping consumers awareness of environmental protection, but also educating some consumer to be the opinion leader of green fashion.
For the national level, the post-materialist has a significant positive effect on sustainable consumption behavior. Higher postmaterialist level countries appear to have more individual involvement in sustainable behavior than countries with lower levels. Our results are consistent with available literature (Inglehart, 1995 [51]; Dalton, 2005 [74]; Oreg and Katz-Gerro, 2006 [75]; Gelissen, 2007 [4]; Freymeyer and Johnson, 2010 [28]; Pirani and Secondi, 2011 [76]). Our result suggests that post-materialism has a positive effect on sustainable consumption behavior. It is a typical hierarchical relationship, where a national explanatory variable influences an individual dependent variable. People with post-materialist values, emphasizing self-expression and quality of life, are more concerned about surroundings, especially environment wellness. As a result, countries with high post-materialists are more willing to make financial sacrifices to support sustainable development. A notable paradox exists in economic development. On one hand, developing in one country, often accompanied by environmental pollution, such as carbon emission and harmful sewage. On the other hand, a developed economy with a higher post-materialist spirit can enhance people’s awareness of sustainable behaviors. Therefore, fashion manufacturers, such as GAP, H&M, and Uniqlo, need to carefully evaluate one country’s post-materialism level before advocating the brand’s suitability, as it would be more effective in developed countries. Moreover, for governors in developing countries, decisions should be made after balancing pollution suffering and post-materialism raise. As the increasing national wealth would lead to sustainable development in the future.
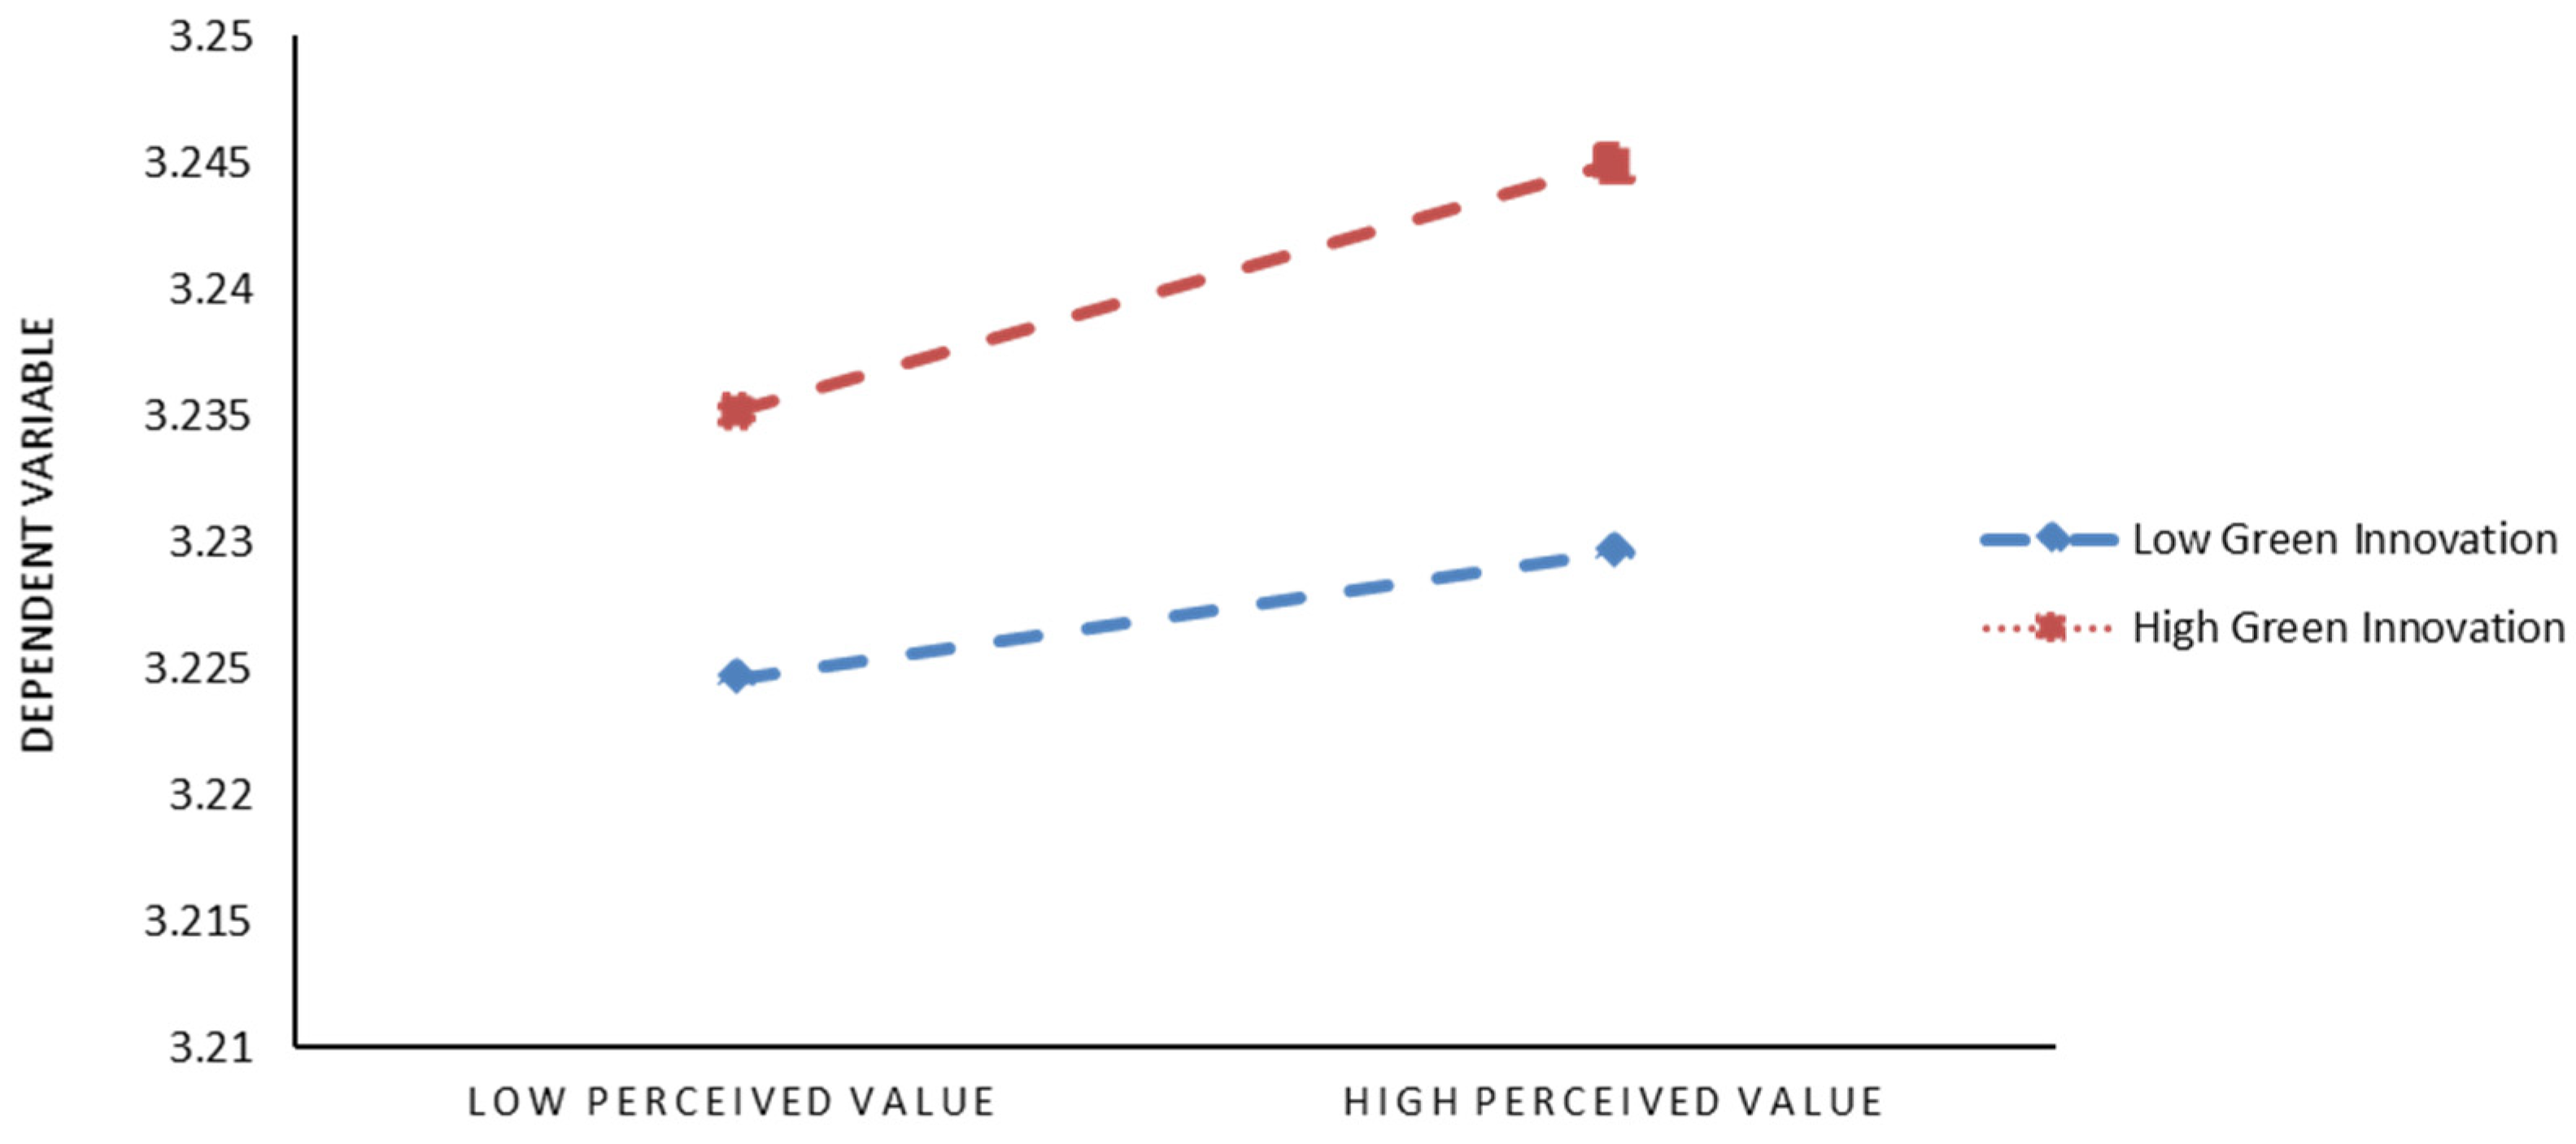
Finally, our result shows that green innovation has a significant positive effect on sustainable consumption behavior. Moreover, it also has a moderating effect between consumer perceived value and sustainable consumption behavior. In other words, a country that has better green innovation capability often has citizens with a stronger sense of sustainability.
Our study also has implications to industries and country authorities. From the perspective of recyclable materials, the country should invest more funds and resources in the sustainable development of materials, such as the recycling of glass fiber. This allows more materials to be reused and achieve carbon neutrality as soon as possible. From the government’s perspective, the government should focus on the combined design of different types of environmental regulations and provide targeted policy support for enterprises’ green technological innovation. At the same time, companies should strengthen their own environmental responsibility training and promotion. In the production process, the factory should keep the environment friendly. By motivate of green innovation, people would pay more attention to the positive role of sustainable development in society. They would actively engage in sustainable development by changing living habits to take part in the national sustainable development strategy, such as choosing environmentally friendly shopping bags and purchasing recycled materials products. Governments should also be aware that green innovation can be reinforced by increasing investment in educational resources, optimizing the industrial structure, and improving economic development [25]. Furthermore, the country’s green innovation would affect the peoples’ value proposition. Effective green innovation is a sequence of good green policies, which may gradually change society’s daily operation mode, and further influence the perceived values of citizens so that citizens would subconsciously consider green issues as a part of their daily life, like environmental protection, sustainable development, and recycle utilization.
For the further research, we could focus on the impact of subsidy policies and education in developing countries. These two factors play important roles in high-income countries. However, it appears a lack of evidence on developing countries. Are these factors act the same in low-income countries? If not, what is the difference?

Author Contributions

Conceptualization, L.C. and H.Z.; Methodology, H.Z.; Formal Analysis, L.C. and H.Z.; Investigation, L.C. and H.Z.; Resources, L.C. and H.Z.; Data Curation, H.Z.; Writing—Original Draft Preparation, H.Z.; Writing—Review and Editing, L.C. and V.S.; Visualization, L.C. and H.Z.; Supervision, L.C. and V.S. All authors have read and agreed to the published version of the manuscript.

Funding

This research was funded by the National Natural Science Foundation of China, grant number 7187020554.

Institutional Review Board Statement

Not applicable.

Informed Consent Statement

Not applicable.

Data Availability Statement

The data presented in this study are available on request from the corresponding author. Primary data was obtained from the World Values Survey (available from https://www.worldvaluessurvey.org/WVSContents.jsp, accessed date: 30 December 2020).

Conflicts of Interest

The authors declare no conflict of interest.

References

  1. Severo, E.A.; De Guimarães, J.C.F.; Dellarmelin, M.L. Impact of the COVID-19 pandemic on environmental awareness, sustainable consumption and social responsibility: Evidence from generations in Brazil and Portugal. J. Clean. Prod. 2020, 286, 124947. [Google Scholar] [CrossRef] [PubMed]
  2. Rustam, A.; Wang, Y.; Zameer, H. Environmental awareness, firm sustainability exposure and green consumption behaviors. J. Clean. Prod. 2020, 268, 122016. [Google Scholar] [CrossRef]
  3. Moslehpour, M.; Chaiyapruk, P.; Faez, S.; Wong, W.-K. Generation Y’s Sustainable Purchasing Intention of Green Personal Care Products. Sustainability 2021, 13, 13385. [Google Scholar] [CrossRef]
  4. Gelissen, J. Explaining Popular Support for Environmental Protection: A Multilevel Analysis of 50 Nations. Environ. Behav. 2007, 39, 392–415. [Google Scholar] [CrossRef]
  5. Li, H.; Peng, W. Carbon Tax, Subsidy, and Emission Reduction: Analysis Based on DSGE Model. Complexity 2020, 2020, 1–10. [Google Scholar] [CrossRef]
  6. Kaufmann, H.R.; Panni, M.F.A.K.; Orphanidou, Y. Factors Affecting Consumers’ Green Purchasing Behavior: An Integrated Conceptual Framework. Amfiteatru Econ. 2012, 14, 50–69. [Google Scholar]
  7. Banyte, J.; Brazionienė, L.; Gadeikiene, A. Investigation of Green Consumer Profile: A Case of Lithuanian Market of Eco-Friendly Food Products. Econ. Manag. 2010, 15, 374–383. [Google Scholar]
  8. Duroy, Q.M. Testing the affluence hypothesis: A cross-cultural analysis of the determinants of environmental action. Soc. Sci. J. 2008, 45, 419–439. [Google Scholar] [CrossRef]
  9. Lee, C.K.; Levy, D.S.; Yap, C.S.F. How does the theory of consumption values contribute to place identity and sustainable consumption? Int. J. Consum. Stud. 2015, 39, 597–607. [Google Scholar] [CrossRef]
  10. Dong, X.; Li, H.; Liu, S.; Cai, C.; Fan, X. How does material possession love influence sustainable consumption behavior towards the durable products? J. Clean. Prod. 2018, 198, 389–400. [Google Scholar] [CrossRef]
  11. Sigala, M. Customer Involvement in Sustainable Supply Chain Management: A Research Framework and Implications in Tourism. Cornell Hosp. Q. 2013, 55, 76–88. [Google Scholar] [CrossRef]
  12. Qing-hua, Z.; Ya-ru, G. Statistical Analysis on Influencing and Behavior of Sustainable Consumption. China Popul. Resour. Environ. 2011, 21, 459–463. [Google Scholar]
  13. Laroche, M.; Bergeron, J.; Barbaro-Forleo, G. Targeting consumers who are willing to pay more for environmentally friendly products. J. Consum. Mark. 2001, 18, 503–520. [Google Scholar] [CrossRef] [Green Version]
  14. Bei, L.-T.; Simpson, E.M. The determinants of consumers’ purchase decisions for recycled products: An application of acquisition-transaction utility theory. ACR N. Am. Adv. 1995, 22, 257–261. [Google Scholar]
  15. Banytė, J.; Šalčiuvienė, L.; Dovalienė, A.; Piligrimienė, Ž.; Sroka, W. Sustainable Consumption Behavior at Home and in the Workplace: Avenues for Innovative Solutions. Sustainability 2020, 12, 6564. [Google Scholar] [CrossRef]
  16. Pepper, M.; Jackson, T.; Uzzell, D. An examination of the values that motivate socially conscious and frugal consumer behaviours. Int. J. Consum. Stud. 2009, 33, 126–136. [Google Scholar] [CrossRef]
  17. Gupta, S.; Agrawal, R. Environmentally Responsible Consumption: Construct Definition, Scale Development, and Validation. Corp. Soc. Responsib. Environ. Manag. 2018, 25, 523–536. [Google Scholar] [CrossRef]
  18. Hosta, M.; Zabkar, V. Antecedents of Environmentally and Socially Responsible Sustainable Consumer Behavior. J. Bus. Ethics 2020, 171, 273–293. [Google Scholar] [CrossRef]
  19. Lorek, S.; Fuchs, D. Strong Sustainable Consumption Governance—Precondition for a Degrowth Path? J. Clean. Prod. 2013, 38, 36–43. [Google Scholar] [CrossRef] [Green Version]
  20. Straughan, R.D.; Roberts, J.A. Environmental segmentation alternatives: A look at green consumer behavior in the new millennium. J. Consum. Mark. 1999, 16, 558–575. [Google Scholar] [CrossRef]
  21. Chan, K. Market Segmentation of Green Consumers in Hong Kong. J. Int. Consum. Mark. 1999, 12, 7–24. [Google Scholar] [CrossRef] [Green Version]
  22. Wang, J.M. Why Do Consumers Recycle—An Empirical Analysis of Determinants of City Consumers’ Recycling Behavior. China Ind. Econ. 2007, 235, 95–102. [Google Scholar]
  23. Kefu, L. Research on Mechanism of Consumer Innovativeness Influences Green Consumption Behavior. Nankai Bus. Rev. 2013, 16, 106–113, 132. [Google Scholar]
  24. Chi, T. Consumer perceived value of environmentally friendly apparel: An empirical study of Chinese consumers. J. Text. Inst. 2014, 106, 1038–1050. [Google Scholar] [CrossRef]
  25. Joanes, T. Personal norms in a globalized world: Norm-activation processes and reduced clothing consumption. J. Clean. Prod. 2018, 212, 941–949. [Google Scholar] [CrossRef]
  26. Hwang, Y.Y.; Jo, G.Y.; Oh, M.J. The Persuasive Effect of Competence and Warmth on Clothing Sustainable Consumption: The Moderating Role of Consumer Knowledge and Social Embeddedness. Sustainability 2020, 12, 2661. [Google Scholar] [CrossRef] [Green Version]
  27. Tullani, H.; Saha, R.; Dahiya, R. Green Innovation and Ethical Responsibility: Do They Improve Customer’s Green Purchase Intentions? Int. J. Sustain. Entrep. Corp. Soc. Responsib. 2018, 3, 35–52. [Google Scholar] [CrossRef]
  28. Franzen, A.; Meyer, R. Environmental Attitudes in Cross-National Perspective: A Multilevel Analysis of the ISSP 1993 and 2000. Eur. Sociol. Rev. 2010, 26, 219–234. [Google Scholar] [CrossRef]
  29. Minton, E.A.; Spielmann, N.; Kahle, L.R.; Kim, C.-H. The subjective norms of sustainable consumption: A cross-cultural exploration. J. Bus. Res. 2018, 82, 400–408. [Google Scholar] [CrossRef]
  30. Inglehart, R. The Silent Revolution; Princeton University Press: Princeton, NJ, USA, 1977. [Google Scholar]
  31. Inglehart, R.F. Changing Values among Western Publics from 1970 to 2006. West Eur. Politics 2008, 31, 130–146. [Google Scholar] [CrossRef]
  32. Nevarez, L. Pursuing Quality of Life: From the Affluent Society to the Consumer Society; Routledge: London, UK, 2011. [Google Scholar]
  33. Carrión-Flores, C.E.; Innes, R. Environmental innovation and environmental performance. J. Environ. Econ. Manag. 2010, 59, 27–42. [Google Scholar] [CrossRef]
  34. Peng, H.; Shen, N.; Ying, H.; Wang, Q. Can environmental regulation directly promote green innovation behavior?—Based on situation of industrial agglomeration. J. Clean. Prod. 2021, 314, 128044. [Google Scholar] [CrossRef]
  35. Chen, Y.-S.; Lai, S.-B.; Wen, C.-T. The Influence of Green Innovation Performance on Corporate Advantage in Taiwan. J. Bus. Ethics 2006, 67, 331–339. [Google Scholar] [CrossRef]
  36. Chen, L.; Qie, K.; Memon, H.; Yesuf, H. The Empirical Analysis of Green Innovation for Fashion Brands, Perceived Value and Green Purchase Intention—Mediating and Moderating Effects. Sustainability 2021, 13, 4238. [Google Scholar] [CrossRef]
  37. Fan, F.; Lian, H.; Liu, X.; Wang, X. Can environmental regulation promote urban green innovation Efficiency? An empirical study based on Chinese cities. J. Clean. Prod. 2020, 287, 125060. [Google Scholar] [CrossRef]
  38. Zeithaml, V.A.; Berry, L.L.; Parasuraman, A. The Behavioral Consequences of Service Quality. J. Mark. 1996, 60, 31–46. [Google Scholar] [CrossRef]
  39. Sheth, J.N.; Newman, B.I.; Gross, B.L. Why we buy what we buy: A theory of consumption values. J. Bus. Res. 1991, 22, 159–170. [Google Scholar] [CrossRef]
  40. Saari, U.A.; Damberg, S.; Frömbling, L.; Ringle, C.M. Sustainable consumption behavior of Europeans: The influence of environmental knowledge and risk perception on environmental concern and behavioral intention. Ecol. Econ. 2021, 189, 107155. [Google Scholar] [CrossRef]
  41. Papista, E.; Chrysochou, P.; Krystallis, A.; Dimitriadis, S. Types of value and cost in consumer-green brands relationship and loyalty behaviour. J. Consum. Behav. 2017, 17, e101–e113. [Google Scholar] [CrossRef]
  42. Asshidin, N.H.; Abidin, N.; Borhan, H. Perceived Quality and Emotional Value that Influence Consumer’s Purchase Intention towards American and Local Products. Procedia Econ. Financ. 2016, 35, 639–643. [Google Scholar] [CrossRef] [Green Version]
  43. de Medeiros, J.F.; Ribeiro, J.L.D.; Cortimiglia, M.N. Influence of perceived value on purchasing decisions of green products in Brazil. J. Clean. Prod. 2016, 110, 158–169. [Google Scholar] [CrossRef]
  44. Abramson, P.R.; Inglehart, R. Value Change in Global Perspective; University of Michigan Press: Ann Arbor, MI, USA, 2009; pp. 1–180. [Google Scholar]
  45. Inglehart, R. Culture Shift in Advanced Industrial Society; Princeton University Press: Princeton, NJ, USA, 2018. [Google Scholar]
  46. Ronald, I.; Welzel, C. Modernization, Cultural Change, and Democracy: The Human Development Sequence; Cambridge University Press: Cambridge, UK, 2005. [Google Scholar]
  47. Best, H.; Mayerl, J. Values, Beliefs, Attitudes: An Empirical Study on the Structure of Environmental Concern and Recycling Participation. Soc. Sci. Q. 2013, 94, 691–714. [Google Scholar] [CrossRef]
  48. Pampel, F.C. The Varied Influence of SES on Environmental Concern. Soc. Sci. Q. 2013, 95, 57–75. [Google Scholar] [CrossRef] [PubMed]
  49. Pisano, I.; Lubell, M. Environmental Behavior in Cross-National Perspective: A Multilevel Analysis of 30 Countries. Environ. Behav. 2015, 49, 31–58. [Google Scholar] [CrossRef]
  50. Ng, W.; Diener, E. What matters to the rich and the poor? Subjective well-being, financial satisfaction, and postmaterialist needs across the world. J. Pers. Soc. Psychol. 2014, 107, 326–338. [Google Scholar] [CrossRef] [PubMed]
  51. Ronald, I. Public Support for Environmental Protection: The Impact of Objective Problems and Subjective Values in 43 Societies. PS Political Sci. Politics 1995, 28, 55–72. [Google Scholar]
  52. Takalo, S.K.; Tooranloo, H.S.; Parizi, Z.S. Green Innovation: A Systematic Literature Review. J. Clean. Prod. 2021, 279, 122474. [Google Scholar] [CrossRef]
  53. Yang, Z.; Chen, H.; Du, L.; Lin, C.; Lu, W. How Does Alliance-Based Government-University-Industry Foster Cleantech Innovation in A Green Innovation Ecosystem? J. Clean. Prod. 2020, 283, 124559. [Google Scholar] [CrossRef]
  54. Convery, F.; McDonnell, S.; Ferreira, S. The most popular tax in Europe? Lessons from the Irish plastic bags levy. Environ. Resour. Econ. 2007, 38, 1–11. [Google Scholar] [CrossRef]
  55. Cairncross, F. How Europe’s Companies Reposition to Recycle. Harv. Bus. Rev. March–April 1992, 70, 34–45. [Google Scholar]
  56. Lei, L. Apps Assist with Waste Classification. China Daily, 18 June 2019. [Google Scholar]
  57. Lei, C.; Bo-Guang, Z.; Stevenson, D. A Study on Creativity Support Efficiency. In Proceedings of the 12th Annual Conference of Chinese Soft Sciences, Beijing, China, 13 October 2016. [Google Scholar]
  58. Pinkse, J.; Bohnsack, R. Sustainable product innovation and changing consumer behavior: Sustainability affordances as triggers of adoption and usage. Bus. Strat. Environ. 2021. [Google Scholar] [CrossRef]
  59. Lee, K. Gender differences in Hong Kong adolescent consumers’ green purchasing behavior. J. Consum. Mark. 2009, 26, 87–96. [Google Scholar] [CrossRef] [Green Version]
  60. Lee, K. Opportunities for green marketing: Young consumers. Mark. Intell. Plan. 2008, 26, 573–586. [Google Scholar] [CrossRef]
  61. Zelezny, L.C.; Chua, P.P.; Aldrich, C. Elaborating on Gender Differences in Environmentalism. J. Soc. Issues 2000, 56, 443–458. [Google Scholar] [CrossRef]
  62. Haerpfer, C.; Inglehart, R.; Moreno, A.; Welzel, C.; Kizilova, K.; Diez-Medrano, J.; Lagos, P.M.; Norris, E.; Ponarin; Puranen, B.; et al. (Eds.) World Values Survey: Round Seven—Country-Pooled Datafile; JD Systems Institute & WVSA Secretariat: Madrid, Spain; Vienna, Austria, 2020. [Google Scholar] [CrossRef]
  63. Ronald, I.; Basáñez, M.; Jaime, D.-M.; Halman, L.; Luijkx, R. Human Beliefs and Values: A Cross-Cultural Sourcebook Based on the 1999-2002 Value Surveys; Siglo XXI: Mexico City, Mexico, 2004. [Google Scholar]
  64. Petersen, J.; Lindström, M. Materialist/Postmaterialist Values and their Association with Psychological Health and Health Locus of Control: A Population-Based Study. Soc. Sci. J. 2010, 47, 789–801. [Google Scholar] [CrossRef]
  65. Bagozzi, R.P. Evaluating Structural Equation Models with Unobservable Variables and Meas Error: A Comment. J. Mark. Res. 1981, 18, 375–381. [Google Scholar] [CrossRef]
  66. Forum, W.E. Yale Center for Environmental Law and Policy, and Center for International Earth Science Information Network. Available online: www.ciesin.columbia.edu/indicators/ESI/archive.html (accessed on 5 January 2021).
  67. James, L.R.; Demaree, R.G.; Wolf, G. rwg: An Assessment of Within-Group Interrater Agreement. J. Appl. Psychol. 1993, 78, 306–309. [Google Scholar] [CrossRef]
  68. Hayes, A.F.; Preacher, K.J. Statistical Mediation Analysis with A Multicategorical Independent Variable. Br. J. Math. Stat. Psychol. 2014, 67, 451–470. [Google Scholar] [CrossRef]
  69. Stern, P.C.; Dietz, T.; Kalof, L. Value Orientations, Gender, and Environmental Concern. Environ. Behav. 2016, 25, 322–348. [Google Scholar] [CrossRef]
  70. Zeithaml, V.A. Consumer Perceptions of Price, Quality, and Value: A Means-End Model and Synthesis of Evidence. J. Mark. 1988, 52, 2–22. [Google Scholar] [CrossRef]
  71. Chen, Y.S.; Chang, C.H. Enhance Green Purchase Intentions: The Roles of Green Perceived Value, Green Perceived Risk, and Green Trust. Manag. Decis. 2012, 50, 502–520. [Google Scholar] [CrossRef]
  72. Chang, E.-C.; Tseng, Y.-F. Research Note: E-store Image, Perceived Value and Perceived Risk. J. Bus. Res. 2013, 66, 864–870. [Google Scholar] [CrossRef]
  73. Biswas, A.; Roy, M. Green products: An exploratory study on the consumer behaviour in emerging economies of the East. J. Clean. Prod. 2015, 87, 463–468. [Google Scholar] [CrossRef]
  74. Dalton, R.J. The Greening of the Globe? Cross-national Levels of Environmental Group Membership. Environ. Politics 2005, 14, 441–459. [Google Scholar] [CrossRef] [Green Version]
  75. Oreg, S.; Katz-Gerro, T. Predicting proenvironmental behavior cross-nationally: Values, the theory of planned behavior, and value-belief-norm theory. Environ. Behav. 2006, 38, 462–483. [Google Scholar] [CrossRef]
  76. Pirani, E.; Secondi, L. Eco-Friendly Attitudes: What European Citizens Say and What They Do. Int. J. Environ. Res. 2011, 5, 67–84. [Google Scholar] [CrossRef]
Figure 1. The conceptual model.
Sustainability 14 00223 g001
Figure 2. Respondents by countries.
Sustainability 14 00223 g002
Figure 3. Influence of consumer perceived value on sustainable consumption behavior under different green innovation level.
Sustainability 14 00223 g003
Table 1. The variables used in national level and individual level.
LevelVariablesAuthorTopic
NationalAffluenceQuentin M.H. Duroy (2008) [8]Environmental Action
Post-materialistJohn Gelissen (2007) [4]Environmental Protection
Green InnovationHarsh Tullani et al. (2018) [27]Customer’s Green Purchase Intentions
Environmental AttitudesAxel Franzen and Reto Meyer (2010) [28]Environmental Concern
Subjective NormsElizabeth A. Minton et al. (2018) [29]Sustainable Consumption
IndividualPerceived ValueTing Chi (2015) [24]Environmentally Friendly Apparel
Personal NormsTina Joanes (2019) [25]Clothing Consumption
Environmental KnowledgeYoon Yong Hwang et al. (2020) [26]Clothing Sustainable Consumption
Table 2. The demographic characteristics.
VariableMeanS.D.LevelCountsPercentage
Gender1.450.498Male = 118,64354.7%
Female = 215,44145.3%
Age43.7214.987
Education3.671.918Primary = 1474713.9%
Lower secondary = 2585417.2%
Upper secondary = 3872325.6%
Post-secondary = 431259.2%
Short cycle = 527678.1%
Bachelor or equivalent = 6627518.4%
Master or equivalent = 721726.4%
Doctoral or equivalent = 84211.2%
Occupation4.842.674Professional/technical = 1568016.7%
Higher administrative = 213063.8%
Clerical = 3429112.6%
Sales = 4582417.1%
Service = 5356210.5%
Skilled worker = 6355610.4%
Semi-skilled worker= 731879.4%
Unskilled worker = 829738.7%
Farm worker = 920626.0%
Farm owner/manager = 1014764.3%
Income1.830.551Low income845924.8%
Medium income22,78766.8%
High income28388.3%
Table 3. The results of null model.
Fixed EffectCoefficientS.E.T-Ratiod.f.p-Value
INTRCPT1, G003.2480.024136.793390.000
Table 4. The results of random coefficients regression model.
Fixed EffectCoefficientS.E.T-Ratiod.f.p-Value
INTRCPT1, G003.1600.030105.507390.000
SEX, G100.0110.0042.62134,0790.009
EDUCATION, G200.0120.0019.87734,0790.000
INCOME, G300.0200.0045.49034,0790.000
AGE, G400.0000.0001.40034,0790.161
OCCUPATION, G500.0010.0001.54834,0790.122
RACE, G600.0030.0012.30034,0790.253
PERCEIVED VALUE, G700.0020.0050.642390.024
Table 5. The results of intercept-as-outcomes regression model.
Fixed EffectCoefficientS.E.T-Ratiod.f.p-Value
INTRCPT1, G002.4160.5534.365370.000
POSTMATERIALIST, G010.2940.1591.853370.071
INNOVATION, G020.0050.0570.096370.075
SEX, G100.0110.0042.63634,0780.009
EDUCATION, G200.0120.0019.89134,0780.000
INCOME, G300.0200.0045.44734,0780.000
Table 6. The results of full model.
Fixed EffectCoefficientS.E.T-Ratiod.f.p-Value
INTRCPT1, G002.5070.3716.765370.000
POSTMATERIALIST, G010.2700.1531.766370.085
INNOVATION, G020.0080.0570.138370.092
SEX, G100.0110.0042.61734,0760.009
EDUCATION, G200.0120.0019.90734,0760.000
INCOME, G300.0200.0045.47434,0760.000
PERCEIVED VALUE, G400.0120.0022.215380.036
INNOVA × VALUE, G410.0140.0062.277380.028
Table 7. Random intercept regression of consumers’ sustainable consumption behavior on individual and national variables.
Model 1Model 2Model 3Model 4
National-level variables:
Post-materialist 0.071 ***0.085 ***
Green Innovation 0.075 **0.092 **
Individual-level variables:
Gender(reference = female) 0.009 ***0.009 ***0.009 ***
Education 0.000 ***0.000 ***0.000 ***
Income 0.000 ***0.000 ***0.000 ***
Perceived Value 0.024 ** 0.036 ***
Intercept3.248 ***3.159 ***2.416 ***2.507 ***
Variance   component   σ 2 0.1330.1320.1320.132
Variance   component   τ 00 0.0220.0300.0240.024
R 2 Individual level0.0000.3640.3640.364
R 2 National level0.0000.1320.1330.133
Deviance28,21728,06128,05928,055
Number of parameters2424
** p < 0.05, *** p < 0.01 (two-tailed test).
Table 8. The moderating effect of consumer perceived value and green innovation consciousness.
VariablesBetatBetat
Perceived Value0.0122.1960.0101.765
Green Innovation0.0448.1780.0448.125
Perceived Value × Green Innovation 0.0152.685
R Square0.0020.005
F27.43237.535
Publisher’s Note: MDPI stays neutral with regard to jurisdictional claims in published maps and institutional affiliations.

