Article

Mechanism Study on the Impact of China Population Structure Change on the Water Use of the Three Main Industries

1
School of Marxism, Hohai University, Nanjing 211100, China
2
School of Physics and Electronic Electrical Engineering, Huaiyin Normal University, Huai’an 223300, China
3
School of Sociology and Population Science, Nanjing University of Posts and Telecommunication, Nanjing 210023, China
4
College of Architecture & Design, Chung Hua University, Hsinchu 30012, Taiwan
5
Graduate Institute Service Industries and Management, Minghsin University of Science and Technology, Hsinchu 30401, Taiwan
*
Authors to whom correspondence should be addressed.
Sustainability 2022, 14(1), 204; https://doi.org/10.3390/su14010204
Submission received: 16 November 2021 / Revised: 20 December 2021 / Accepted: 21 December 2021 / Published: 25 December 2021

Abstract

:
As the principal part of economic and social development, the demographic factor is the fundamental factor driving the change of water resources, and achieving the harmony of human and water has been one of the most important tasks to promote high-quality development. Based on Maslow’s hierarchy of needs theory, this article applied panel data for 19 years and employed impulse response functions and threshold models to do a mechanism analysis of the impact of population structure changes on the water consumption changes of the three main industries. The study found the following: Firstly, the urban population promotes an increase of the total water consumption, industrial water consumption, and domestic water consumption, which suppresses agricultural water consumption and shows an inverted “N” trend. Secondly, the aging population has expanded the total water consumption, and agricultural and domestic water demand, and reduced industrial water consumption. Thirdly, food consumption helps to reduce the total water consumption and agricultural water consumption, but increases the industrial water consumption and the growth rate rises. Fourthly, the increase in the proportion of agricultural employment reduces the total water consumption, and agricultural and domestic water consumption, and increases industrial water consumption. Fifthly, the total water consumption and domestic water consumption both increase with the improvement of the population education level, while the agricultural water consumption declines first and then rises. The empirical results can provide a reference for analyzing the driving mechanisms of regional water consumption changes.

1. Introduction

The IPCC (Intergovernmental Panel on Climate Change) Assessment Report, Climate Change 2021: The Physical Science Basis, reveals that the ecological environment is deteriorating, and water resources, as the basic resource for carrying human civilization, are a fundamental need for human survival and development, and water scarcity will seriously restrict the sustainable development of mankind. China’s water resources are characterized by an abundance of total water resources, scarce in per capita, and large differences in spatial and temporal distribution. Rapid industrialization and urbanization have led to a rapid increase in water consumption (Figure 1), threatening China’s water security. As the main body of economic and social development, the demographic factor is the fundamental factor driving changes in water consumption, and there is a high degree of consistency between total water consumption and per capita water consumption (Figure 1). At present, water resources have become the main indicator to measure the regional population carrying capacity [1]. With the change of China’s population structure, a comprehensive study of the relationship between the change of population structure and water consumption will be conducive to exercising the green development concept of harmony between people and water, as well as the ecological civilization construction, and also help to further promote economic and social sustainable development. To this end, based on Maslow’s demand hierarchy theory, the PVAR (panel vector auto-regression) model and the threshold model were used to analyze the multi-dimensional impact of demographic changes on industrial water consumption, and it was found that there were variabilities in the impact of demographic changes on the water consumption of different industries.
Facing an expanding population and limited freshwater resources, many scholars have studied the factors and mechanisms affecting water resource utilization from the demographic perspective. Hydraulic civilization has been one of the characteristics that highlight cultural development since the Minoan era; Wittfogel [2] and Butzer [3] researched ancient civilizations such as Greece and China and discovered that water conservancy was a basic guarantee for the development of ancient civilizations. It is a basic need for human survival to provide sufficient water for emerging towns to meet religious and social needs [4], but it also limits the development of regional population size due to water carrying capacity [5]. Therefore, scholars have studied the hierarchy of water needs with the help of Maslow’s hierarchy of needs theory. Marshall and Kaminsky [6] studied the issue of achieving sustainable water development by combining different stages of Maslow’s motivation of needs theory and found that successful water management strategies tend to focus on higher level needs and are able to address multiple needs. Melloul and Collin [7], while studying meeting society’s needs for sustainable water management, proposed a pyramidal hierarchy of water needs based on Maslow’s hierarchy of needs theory, arguing that higher levels of needs will not exist until the lower levels of water needs are met; they also argued that an operable water management plan can effectively coordinate the social needs of the resident population. Crouch et al. [8] studied the absolute basic consumption of individuals and developed a 21-item theoretical model that randomly describes individual water use activities based on the lifestyle level of Maslow’s physiological demand hierarchy, which was applied to the formulation of strict water restriction policies. In addition, the security of water consumption also depends on the construction of well-established water networks and high-quality water services [9,10]. Meanwhile, foreign scholars rely on the micro data of families to analyze the utilization of water resources. They think that when families are taken as units, the new and old housing [11], housing area [12], bathing facilities [13], and income [14] will all affect water resource utilization. Fuentes et al. [15] further studied the age structure of the family and found that the amount of hot water consumption in the family is closely related to the age structure. The amount of water consumption in the family was the highest when the family is composed of two young adults, and showed a downward trend when the average age of the family increased [16]. However, Chenoweth et al. [17], in a survey in the UK, found that the number of adults, minors, and the total number of family members had a certain inhibiting effect on water consumption per capita, while the number of elderly people increased water consumption. In addition, studies by foreign scholars also show that population size is the main driving force for the increase in water consumption [18], and internationally recognized household consumption capacities and seasonal variations also need to be taken into account when assessing the water resource carrying capacity.
With the rapid development of China’s economy, especially the rapid growth of the population of large cities, the contradiction between population and water resource has become increasingly prominent; Maslow’s hierarchy of needs theory has become a fundamental theory to guide Chinese scholars in their research on water utilization. Pan et al. [19] used research data to establish a hierarchy and ranking theory of household water use based on Maslow’s demand hierarchy theory, which classifies household water use into three levels (rigid water use, flexible water use, and luxury water use) and three ranks (basic water demand, reasonable water demand, and representative water demand). Xue et al. [20] established a water conservation community public participation model based on Maslow’s five levels of human demand theory, where economic benefits, environmental improvement benefits, and self-fulfilling satisfaction of participation will be the driving force for the model to work. In addition, the theory of water resources carrying capacity is significant for economic development, ecological environmental protection, and public health [21], involving harmony of the population structure and water resources [22], the population carrying capacity of water resources [23], and population size [24]. Meanwhile, micro-level studies have been conducted based on the above theory; Hu Zhen et al. argue that the impact of household size on water consumption showed an inverted “N” trend, and in the age structure of population, the order of influence degree of water consumption was middle-aged > minors > the elderly > young adults [25]. Tong Yufen and Li Zheng [1] further analyzed water consumption according to the income level of residents. Simultaneously, some scholars also analyzed the impact of population structure on water consumption at micro-levels, such as the urban and rural population ratio, diet structure, education level, and Engel coefficient [26,27,28].
From the study of hydraulic civilization, water resource carrying capacity, and sustainable development theory, it has been found that the water resource and population development have a mutual influence. The change of population structure can affect water resource utilization from multiple aspects, and the influence shows a nonlinear trend. In addition, the same index may lead to different research conclusions by different scholars, which indicates that the impact of the population structure on water resource utilization is diverse. However, whether there is heterogeneity in the impact of population structure changes on water consumption in different industries, and how the population structure under its own influence affects water consumption in each industry in a multi-dimensional perspective, are questions that have necessity and space for further systematic study. Therefore, based on Maslow’s hierarchy of needs theory, this paper constructs a research paradigm of “demographic change-demand-behavior water use of the three main industries” to investigate the mechanism of multiple demographic changes on water resource utilization. On this basis, applying China’s provincial panel data from 2001 to 2019, by means of the PVAR model and threshold models constructed based on the STIRPAT model, this paper accurately depicts the supply and demand trend of China’s water resources under the change of population structure from the dimensions of population structure−total water consumption, population structure−agricultural water consumption, population structure−industrial water consumption, population structure−domestic water consumption, etc. The scientific cognition of human−water relations is enriched from the perspective of demographic changes, which provides countermeasures to effectively deal with the interaction between population development and water resources in the future. This is not only important for promoting harmonious human−water development and mitigating human−water conflicts in China, but can also provide different management perspectives and recommendations for securing sustainable water use for different groups and stakeholders globally.
The chapters are as follows: Section 2 is the impact mechanism and basic hypotheses, which includes the mechanism of the effect of demographic change on industrial water consumption, and the mechanism of the resulting hypothetical impact. Section 3 is model establishment and data collation, including the construction of the PVAR model, STIRPAT model, and threshold model; indicator settings; and data sources. Section 4 is the multi-dimensional empirical analysis, covering the impulse response analysis and threshold effect analysis. Section 5 consists of conclusions and recommendations.

2. Impact Mechanism and Basic Hypotheses

The change of population structure will promote the diversification of resident lifestyles and concepts, and make the consumption tend to be differentiated [29], thus changing the current situation of water resources utilization in the production, living, and ecological environment [30]. Based on Maslow’s hierarchy of needs (physiological needs, safety needs, belongingness and love needs, esteem needs, and self-actualization needs) and the division of consumption materials (survival type, development type, and enjoyment type) (Figure 2), this paper analyzes the impact mechanism of the population structure changes on water resources utilization. In order to fully investigate the influence path of the population structure on different water resources utilization modes and reflect the characteristics of the current population structure changes in China, this paper divides the population structure into five aspects: urban−rural structure of population, age structure of population, population consumption structure, employment structure of population, and education level of population.

2.1. Urban−Rural Structure of Population

The urban−rural structure of population refers to the proportion of the urban population and rural population. At present, China’s urban infrastructure, job opportunities, and medical and educational conditions are better than those of the rural areas. Driven by the national urbanization policy and the improvement of demands, the proportion of the urban population has increased rapidly. On the one hand, the rapidly expanding urban population has increased the rigid water demand [31]. At the same time, the imperfect infrastructure in cities has also led to the incomplete popularization of water-saving facilities and technologies after the increase of residents, thus inhibiting the efficiency of urban water utilization. On the other hand, there are far more domestic water facilities for urban residents than in rural areas, and the new urban population may increase urban water consumption. In addition, with the flow of urban and rural population, convenient and clean water facilities in cities will have a “demonstration effect” on rural residents, resulting in an increase in rural water consumption. However, with the implementation of the national “double control” policy on water resources, water-saving technologies and facilities have been popularized in urban and rural areas, and the market regulation mechanism for water resources has been improved. In this way, the water consumption of urban and rural residents will show a downward trend [32]. Therefore, this paper hypothesizes that the change of the urban−rural structure of the population will increase water consumption in the short term and decrease water consumption in the long term.

2.2. Population Age Structure

In the theory of the human life cycle, there are significant differences in consumption demand and lifestyle among different age groups. The consumption demand in adolescence is predominantly physiological and safety demands, which is mainly reflected in the increase of water consumption by clothes washing, bathing, and meals. After entering the young and middle-aged stage of life, with the increase of income and the change of family lifestyle, people have more tours, showers, and cooking, which will inevitably increase water consumption; however, it will also improve water utilization efficiency and reduce water consumption due to the use of water-saving facilities. In the elderly age period, due to the longer periods spent at home, water consumption rises [25]. Moreover, the progress of medical technology and the improvement of social security policies enables the elderly to have more time to participate in social and economic activities, making less probability of water consumption decline among the elderly. In addition, the elderly spend more on food than the young and middle-aged population, especially on healthcare cash crops, thus increasing the demand for agricultural water [33]. Therefore, this paper hypothesizes that the increase of the elderly population in the population age structure can increase water consumption.

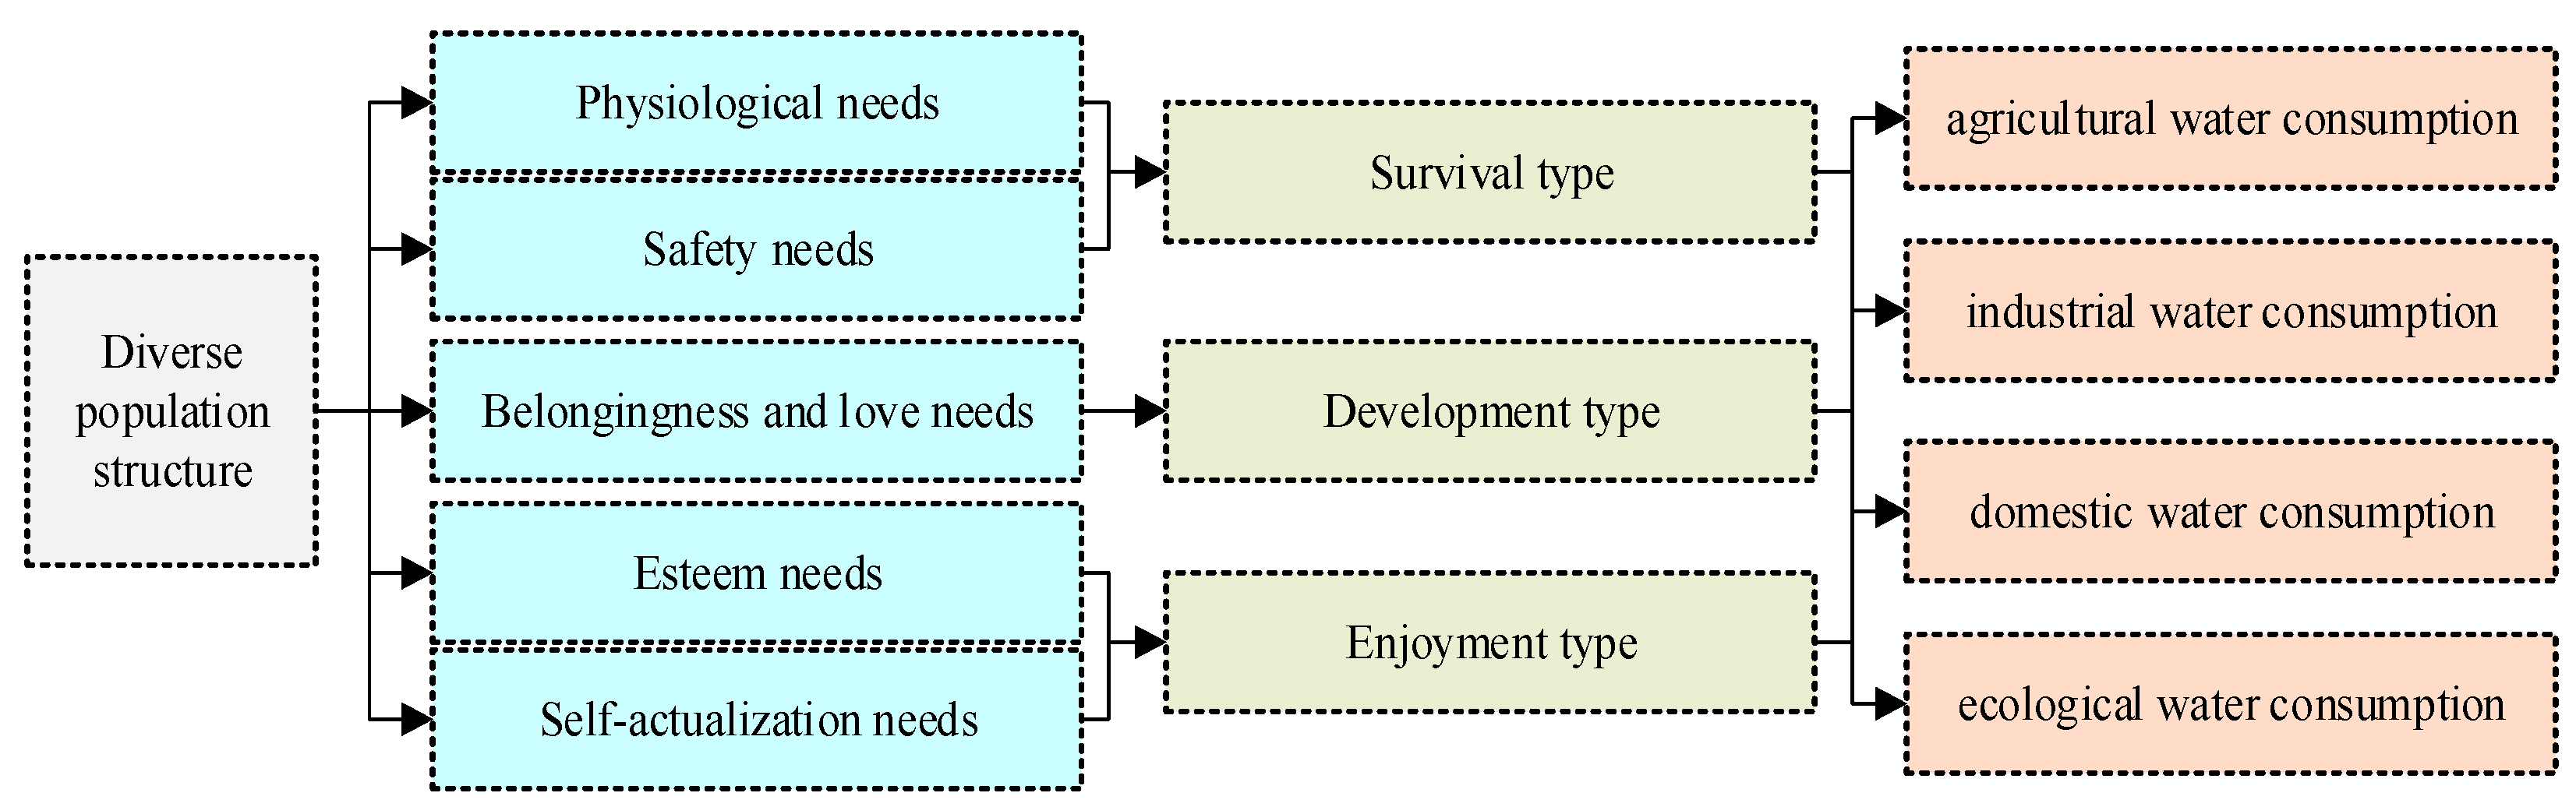
2.3. Population Consumption Structure

Driven by the ever-increasing demand, resident consumption materials have gradually changed from survival type to development type and enjoyment type. With the increase of consumption, the water use of high-end consumption materials is much higher than that of basic consumption materials. For example, meat production requires dozens of times as much water for livestock and poultry breeding as grain [26,34], at the same the expansion of demand for cash crops is bound to increase water consumption, which directly or indirectly increases agricultural water consumption. In addition, the demand for high-end consumption is also reflected in the requirements for the living environment and living comfort. Large living area and water recreation facilities will expand the demand for water [12]. However, with the improvement of production technology and water utilization efficiency, the increase in water consumption due to the upgrading of the consumption structure will show a downward trend. Therefore, it is hypothesized that the upgrading of population consumption will promote an increase in water consumption.

2.4. Population Employment Structure

The employment structure of the population is mainly reflected in the industries in which humans engage. Different industries have different demands for water resources. The proportion of agricultural water consumption far exceeds 50% [35]. Thanks to the improvement of agricultural modernization and the transfer of agricultural employment population, agricultural modernization helps to improve the efficiency of agricultural water utilization, push forward the realization of large-scale and intensive production in agriculture, improve the efficiency of agricultural irrigation [36], reduce agricultural water consumption, and at the same time promote the reduction of total water consumption. In addition, the shift of agricultural employees to the tertiary industry with a higher water utilization efficiency will also indirectly reduce the total water consumption. It can be seen that the reduction of employment proportion in the primary industry will help reduce the demand for water resources.

2.5. Population Education Structure

On the one hand, good education for residents can meet people’s social and higher-level needs. A high level of education corresponds to an increase in high-end consumption demands. Combined with the previous analysis, this is bound to increase water consumption. On the other hand, a good education is conducive for residents to form a strong awareness of water conservation and protection, and helps to curb the increase of water consumption. However, some scholars have found that residents’ awareness of water conservation and protection does not reduce water consumption currently, and the impact of resident education level on water resources utilization is not significant [27]. Therefore, this paper hypothesizes that an improvement in population education can restrict the increase of water consumption.

2.6. Other Factors

According to the existing research, water resources utilization is also restricted by population size, economic development level, water resource endowment, water-saving technology, etc. Among them, the expansion of population size can directly increase water consumption, but the scale effect may reduce the growth rate. The relationship between economic development and water resources is affected by the environmental Kuznets curve. Areas with high water resource endowment are prone to produce the illusion of “inexhaustible water resources” by humans, which may produce serious waste of water resources; otherwise, human tends to have water-saving awareness. The water utilization efficiency of the tertiary industry, which is higher than that of the primary and secondary industries, has great water-saving advantages. Technological progress can often effectively curb the increase of water consumption.

3. Model Establishment and Data Collation

3.1. Model Establishment

On the basis of mechanism analysis, this paper first applies the PVAR (Panel Vector Auto-regression, PVAR for short) model to describe the impact of population structure changes on water resources utilization from multiple dimensions, and then makes use of the threshold model based on the STIRPAT (Stochastic Impacts by Regression on Population, Affluence, and Technology, STIRPAT for short) model to further quantitatively analyze the nonlinear relationship between the two. The specific model is established as follows.

3.1.1. PVAR Model

Holtz-Eakin et al. [37] first the proposed panel vector auto-regression model (PVAR) in 1988. After development by Love and Zicchino [38], it has been widely used in economics, management, and many other fields. The PVAR model does not only reflect the interaction between all endogenous variables, but also allows for the existence of individual heterogeneity in panel data. Compared with the VAR model, the PVAR model improves the accuracy and stability of model estimation. In this paper, the establishment of the PVAR model mainly draws lessons from the method of Love and Zicchino [38], and regards population structure as an endogenous variable that affects the change of water resources. The model is set as follows:
Y i , t = α i + β n n = 1 q Y i , t n + φ n n = 1 q X i , t n + ϕ i + μ i , t
In this formula, Y i , t represents the M × 1 order vector of M observable endogenous variables of province i in year t. X i , t n indicates the n-order lag term of exogenous variables of province i in year t. α i is the M × 1 order vector, which represents the individual fixed effect of M endogenous variables in each province i. β n and φ n are coefficients to be estimated for lag terms of M endogenous variables and exogenous variables, respectively, which are M × M order vectors. ϕ i is the M × 1 order vector, representing time effect; μ i , t represents a residual term. n indicates the lag order. The exogenous variables selected in this paper include population size, economic development level, water resource endowment, and technological progress.

3.1.2. STIRPAT Model

The STIRPAT model is developed on the basis of the IPAT (I = human impact, P = population, A = affluence, T = technology) equation [39]. The IPAT equation mainly examines the impact of human factors on the environment, and the expression is I = P × A × T, where I, P, A, and T represent environmental factors, demographic factors, economic factors, and environmental load, respectively. The STIRPAT model adds variables such as technology and wealth to the IPAT equation, and the expression is as follows:
I = α × P γ 1 × A γ 2 × T γ 3 × ε
Among them, α is the constant term; γ 1 , γ 2 and γ 3 , are exponential terms representing P, A, and T respectively; ε is the error term, and the meanings of the other variables are the same as those of Equation (1). Logarithmic processing is carried out on both sides of Equation (2) at the same time to obtain Equation (3):
ln I = α + γ 1 ln P + γ 2 ln A + γ 3 ln T + ε
Combined with the previous mechanism analysis, the econometric model of this paper is constructed on the basis of the STIRPAT model, which is set as follows:
ln W i , t = α + γ 1 ln P i , t + γ 2 ln X i , t + ε + σ i , t
In the equation, W i , t represents the water consumption of province i in year t, P represents the population structure variables of each province, X represents the non-population structure variables affecting water resources, and σ represents the fixed effect of the panel model. The meanings of other variables are consistent with Equation (2).

3.1.3. Threshold Model

On the basis of the STIRPAT model, a threshold model is constructed to verify the accuracy of PVAR model and the threshold effect of the population structure changes regarding water consumption. Referring to Hansen’s panel threshold model, the threshold model in this paper is set as follows:
ln W i t = θ X i t + η 1 ln P i t I i t ( t h r i t γ 1 ) + η 2 ln P i t I i t ( t h r i t γ 2 ) + ε i t
In Equation (5), thr is the threshold variable, γ is the threshold value to be estimated, I (·) is the indicator function, and η and θ are the elastic coefficients of threshold variables and non-threshold variables to water consumption, respectively. Other indexes have the same meaning as above. In the process of threshold model estimation, it is necessary to test the existence of the threshold first, and to then estimate the corresponding threshold values and threshold-dependent variable coefficients based on the existence of the threshold, and to lastly demonstrate the threshold effect among the variables.

3.2. Data Processing and Data Sources

Based on the previous analysis, this paper sets the specific data as follows.

3.2.1. Industrial Water Consumption Variables

The industrial water consumption structure of each province includes the total water consumption (W); agricultural water consumption (AW); industrial water consumption (IW); and domestic water consumption, which includes urban domestic water consumption and rural domestic water consumption (DW) (domestic water consists of water for tertiary industry and construction industry and residents’ domestic water).

3.2.2. Variables Affecting Industrial Water Consumption

Referring to existing literature [27,40], the population structure is divided into the urban−rural structure of population (URS), age structure of population (ASP), population consumption structure (PCS), population employment structure (PES) and population education level (PEL). Non-population structure factors include population size (PS), economic development expressed by per capita gross domestic product (PGDP), potential of water (PW), industrial structure (IS), and technological progress expressed by water consumption of 10,000 RMB gross domestic product (WGDP). The specific settings are as follows.
Population structure variables: the urban−rural structure of the population adopts the proportion of the permanent urban population. In view of the current social aging pressure and its mechanism of impact on water resources, the age structure of the population adopts the proportion of the population over 65 years old. The population consumption structure adopts the Engel coefficient. The population employment structure adopts the proportion of the employed population in the primary industry. The population educational structure adopts the educational level of residents.
Non-population structure variables: the population size is expressed by the total population at the end of the year, the economic development level is expressed by GDP per capita, the potential of water is expressed by the amount of water resources per capita, the industrial structure adopts the proportion of the tertiary industry, and the technological progress adopts the water consumption of 10,000 CNY GDP. The above-mentioned relevant economic indicators are all adjusted in price based on 2001. The above data come from the China Statistical Yearbook [35], China Rural Statistical Yearbook [41], China Population and Employment Statistical Yearbook [42], and provincial statistical yearbooks from 2001 to 2019.

3.2.3. Descriptive Statistics of Data

Firstly, the variables are logarithmically processed according to the requirements of the model. Secondly, descriptive statistics are carried out on each variable (as shown in Table 1).
After logarithmic analysis, there are still obvious differences among the variables, indicating that there are certain regional differences in population structure, water utilization mode, and economic development degree among provinces. Each variable is the panel data of 31 provinces in China from 2001 to 2019, and the sample size of each variable is 589 sets of data.

4. Multi-Dimensional Empirical Analysis

4.1. Impulse Response Analysis

Based on the PVAR model, the impulse response function is used to analyze the dynamic impact tracks of population structure change on water consumption, and to accurately describe the response of the latter to the impact of the former. According to the minimum criterion of the AIC and SC test values, the lag period is set as two periods. Simultaneously, considering that the population structure has a certain stability and there is less fluctuation in the short term, this paper sets the duration of the impulse response period as 10 years. The dynamic impact tracks of the urban−rural population structure, age structure of population, population consumption structure, population employment structure, and population education level on water resources are shown in Figure 3, Figure 4, Figure 5, Figure 6 and Figure 7.

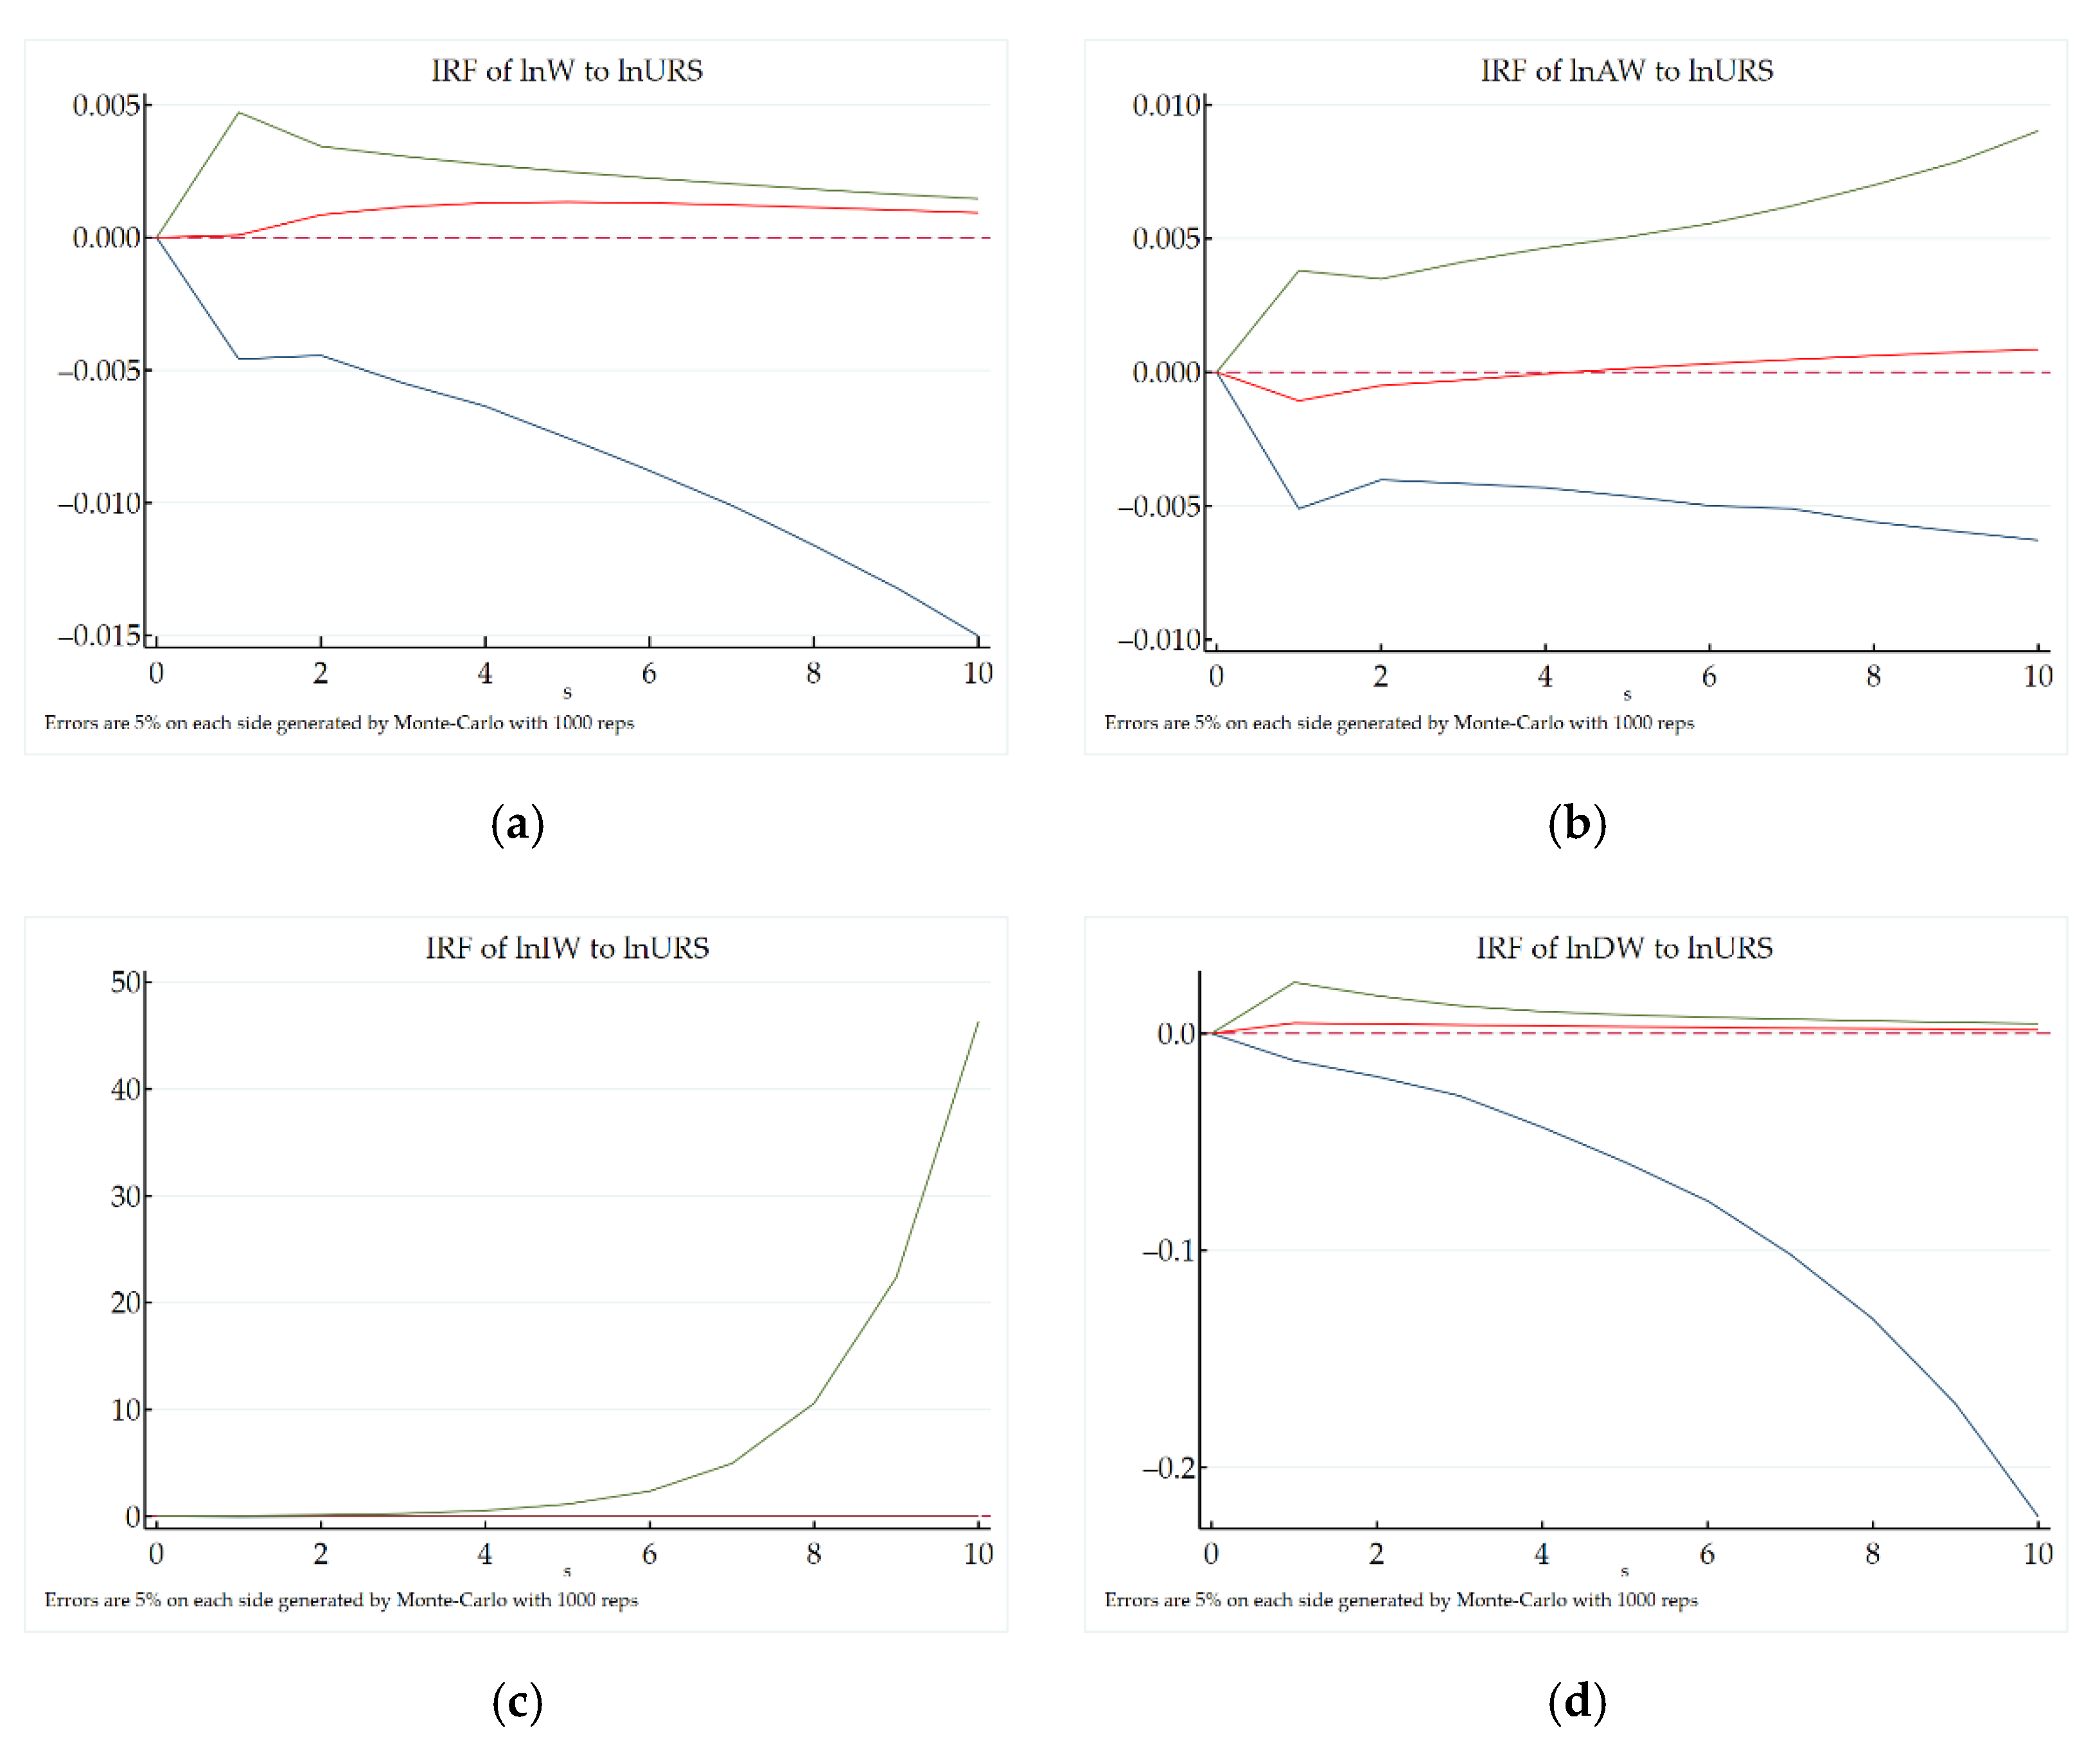
4.1.1. Analysis of Impulse Response of Urban−Rural Population Structure Changes to Water Consumption

Figure 3a–d shows the impulse response functions of urban−rural population structure changes on total water use, agricultural water use, industrial water use, and domestic water use, respectively, where the horizontal axis indicates the responding time and the number of lag periods of the shock effect, and the vertical axis indicates the magnitude of change in water use of each industry affected by urban−rural population structure changes; the green and blue solid lines represent the positive and negative two standard deviation bands, the red solid line represents the impulse response trend of the urban−rural population structure changes to industrial water consumption, and the red dashed line is the positive and negative dividing line.
As can be seen from Figure 3, first of all, the impact of the increase of urban population on the total water consumption (Figure 3a) is zero in the first phase, positive in the second phase, reaches its peak in the fourth phase, declines in the sixth phase, and then the response function gradually decays, but always maintains a positive impact effect. Secondly, the increase of urban population has a negative impulse response to agricultural water consumption and is at the lowest point in the first phase (Figure 3b). It is restrained to zero in the fifth phase, then presents a positive impulse response and gradually expands. Thirdly, the impulse response of the urban population increase to industrial water consumption has been restrained to zero (Figure 3c). Fourthly, the positive impulse response of urban−rural population structure changes to domestic water consumption reaches its peak in the first phase, and then is gradually restrained to zero.
Combined with the previous mechanism analysis and basic hypotheses, the initial population urbanization has a weak impact on the total water consumption, mainly due to the lag effect of water consumption [27]. With the acceleration of urbanization, the demand for water resources also increases rapidly, while the growth rate of the demand for water resources in the middle and late stages of urbanization slows down and shows a downward trend, but it will continue to rise, which is consistent with the previous mechanism analysis and basic hypotheses. In the early stage of urbanization of the rural population, agricultural water consumption drops sharply due to the decline of agricultural production. However, with the increase of urban population and the improvement of urban living standards, the demand for high water-consuming cash crops, vegetables, and livestock and poultry is expanded, and agricultural water consumption is increased with a higher growth rate. Domestic water consumption would be greatly increased in the early stage of urbanization, but with the popularization of urban infrastructure and water-saving technologies, the impact of the urban population increase on domestic water consumption would gradually go to zero.

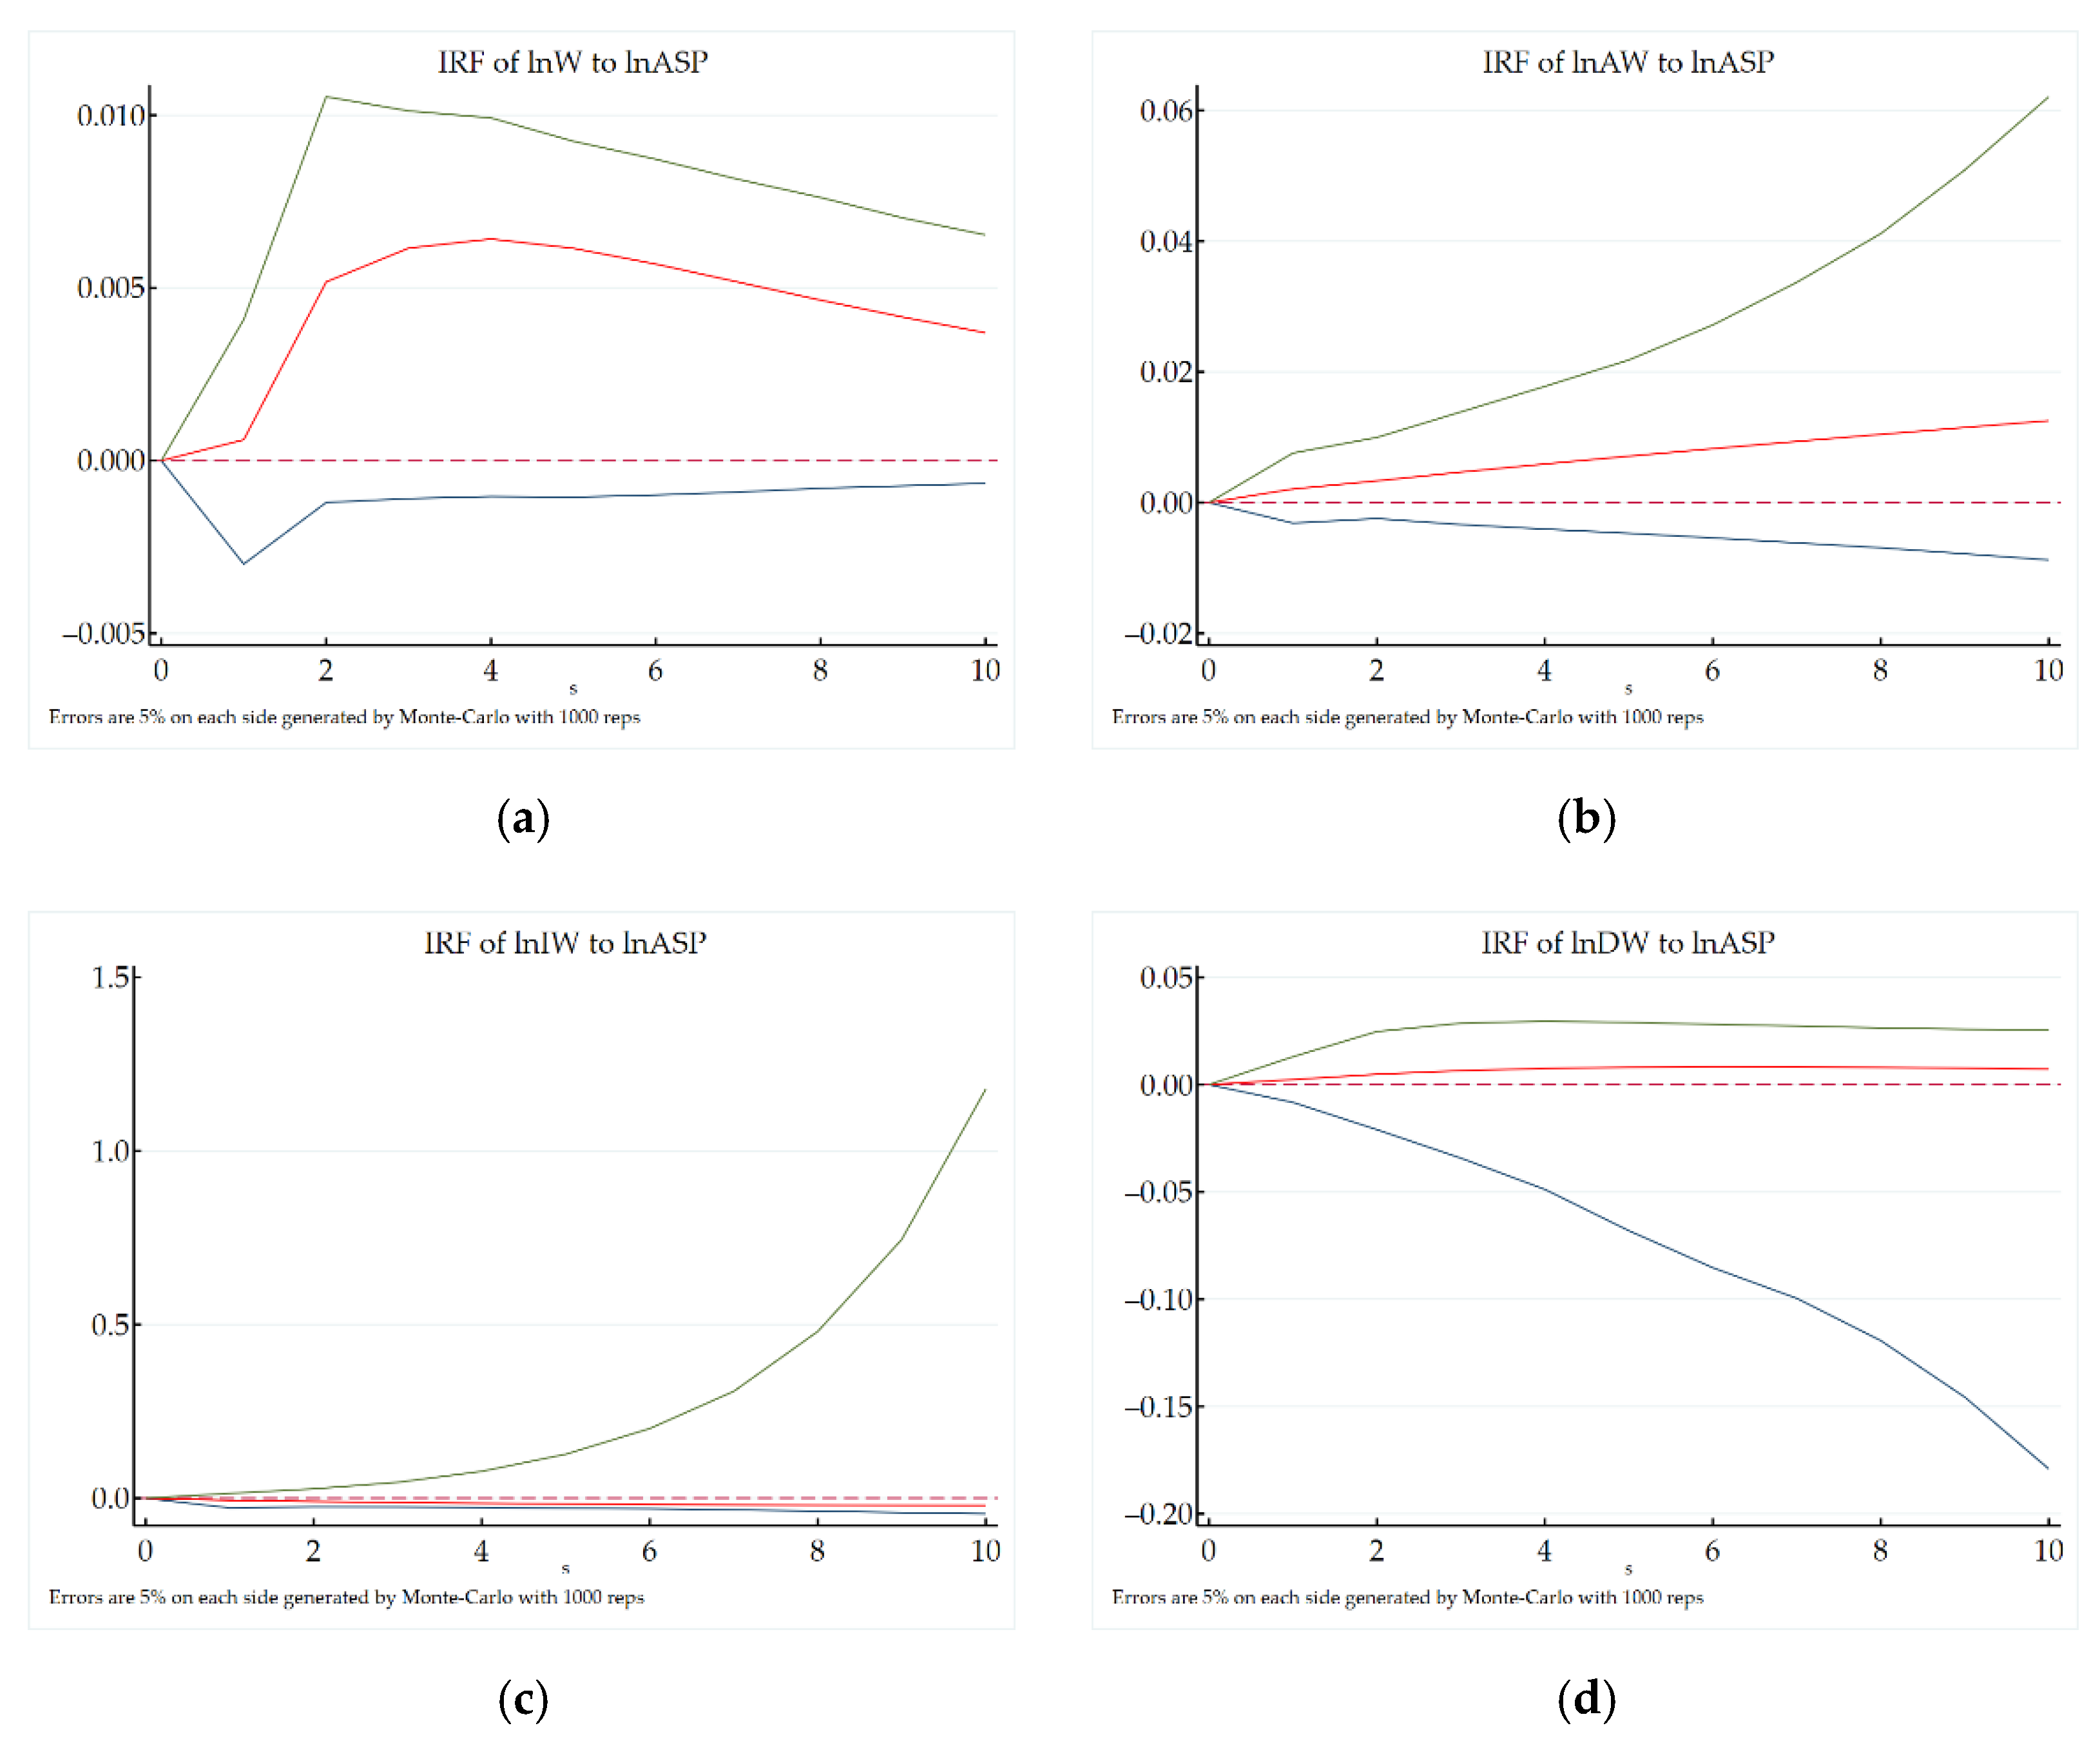
4.1.2. Impulse Response Analysis of Age Structure Change to Water Consumption

Figure 4a–d shows the impulse response functions of population age structure changes on total water use, agricultural water use, industrial water use, and domestic water use, respectively, where the horizontal axis indicates the responding time and the number of lag periods of the shock effect, and the vertical axis indicates the magnitude of change in water use of each industry affected by population age structure changes; the green and blue solid lines represent the positive and negative standard deviation bands, the red solid line represents the impulse response trend of population age structure changes to industrial water consumption, and the red dashed line is the positive and negative dividing line.
As can be seen from Figure 4, the impulse response of the aging population to the total water consumption has always been positive, and shows an inverted “U” trend, reaching its peak in the fourth phase and then gradually decreasing. Agricultural water consumption also increases under the impact of aging, industrial water consumption gradually decreases under its influence, and the impulse response of domestic water consumption is consistent with the total water consumption, but the impact degree is small. The above changes may be due to the longer time spent at home by older retirees in the early stage of population aging, which leads to an increase in domestic water consumption. In recent years, the frequency and time of travel by the elderly are also more than those of other groups, further increasing the water consumption of domestic and tertiary industries. At the same time, the consumption of industrial products by the elderly after retirement decreases day by day, while the demand for cash crops, or example through health preservation increases [33], expanding agricultural water consumption. However, thanks to the frugality consciousness of the elderly, they have strong awareness of saving water and protecting water, which alleviates the impact on the total water consumption.

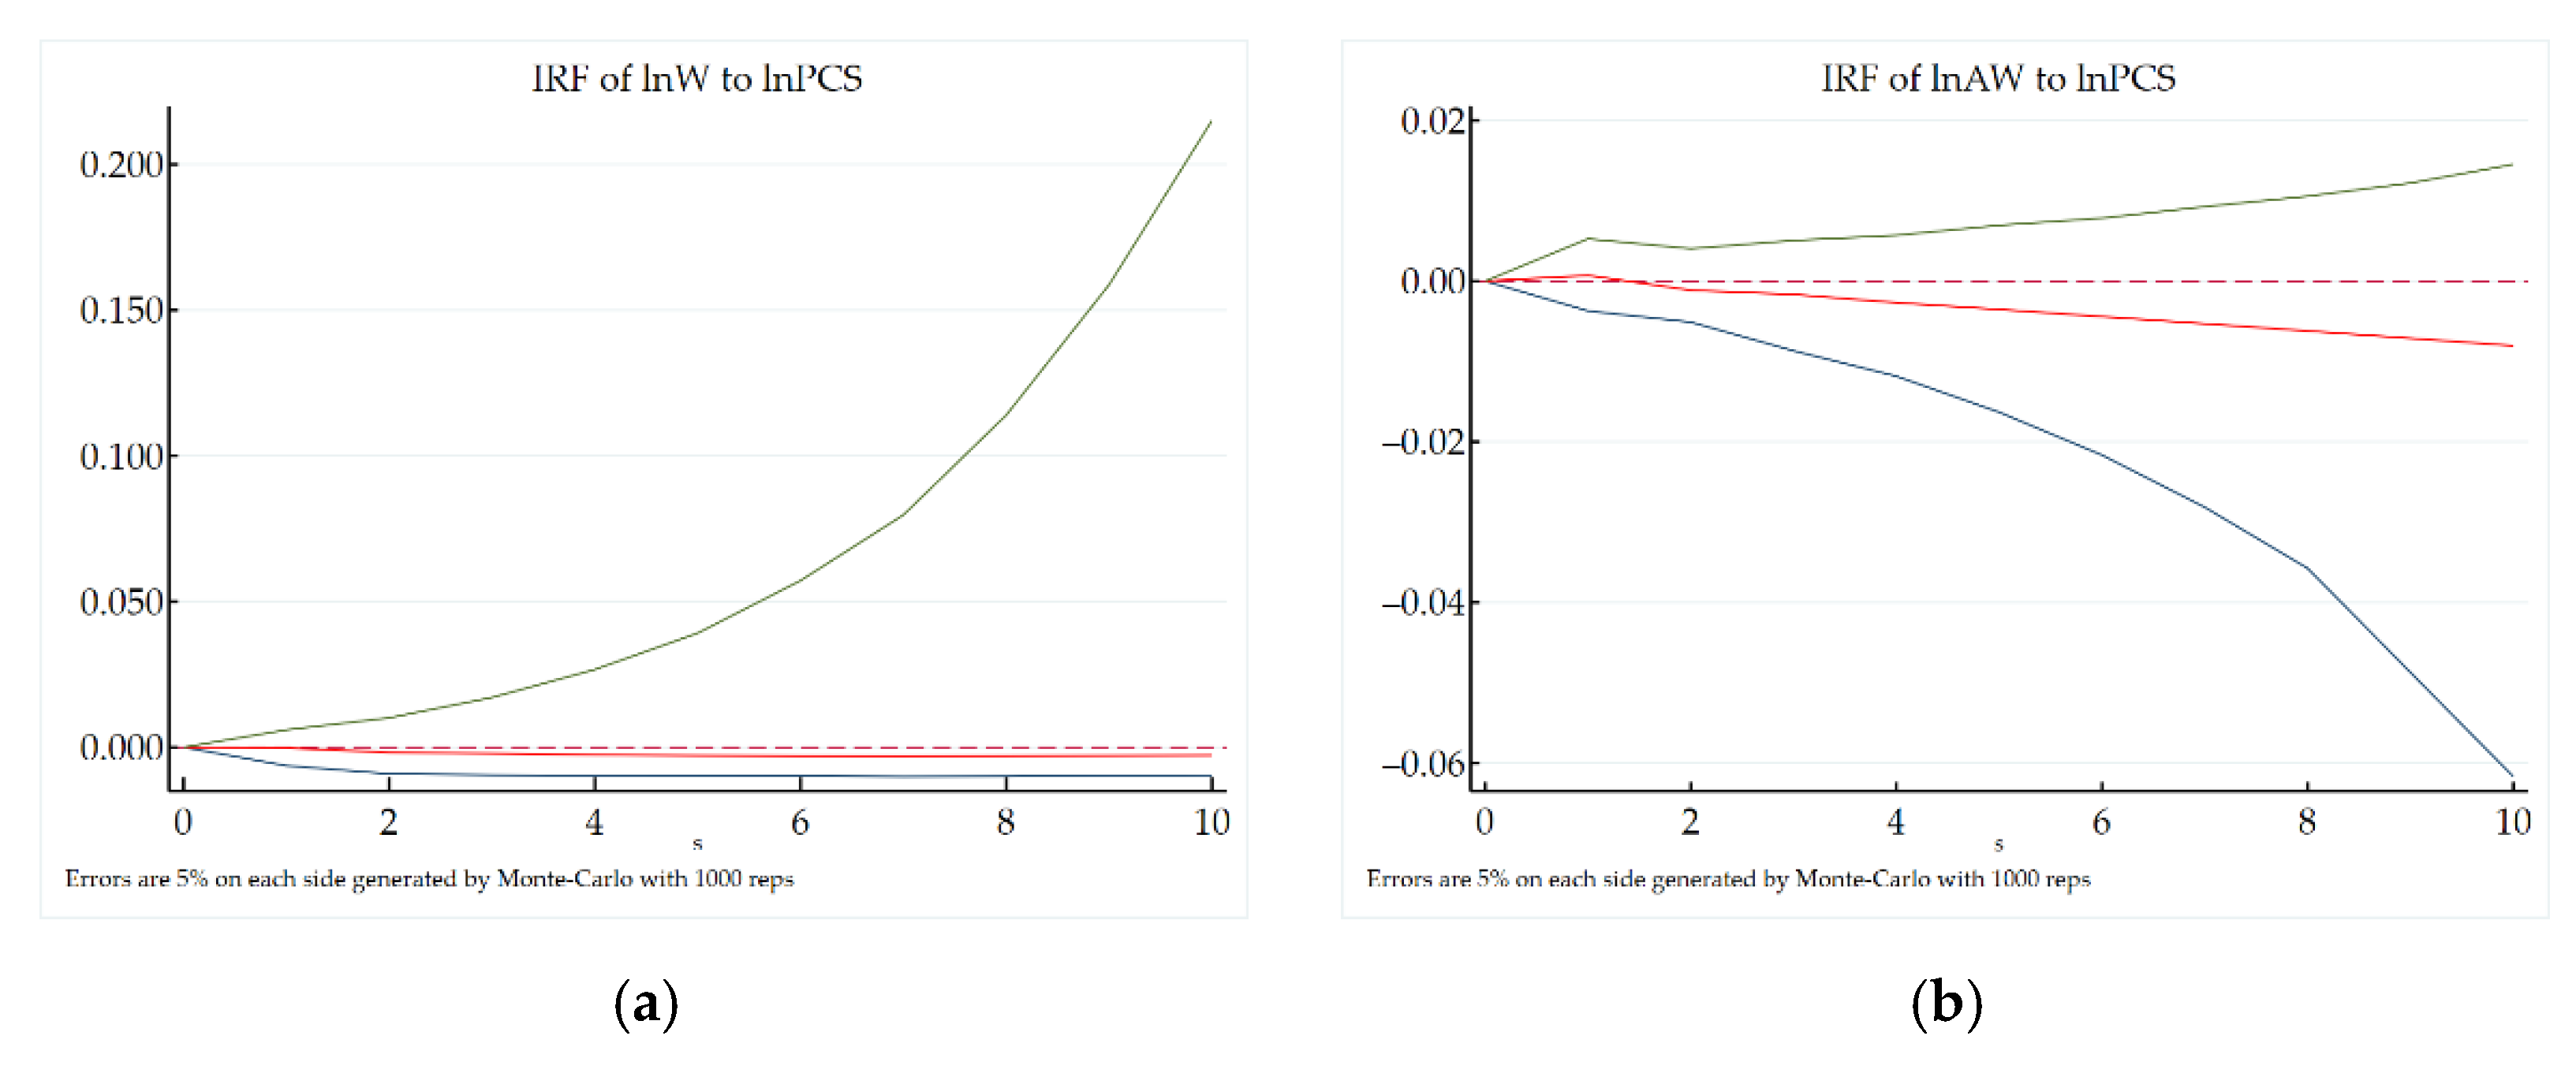
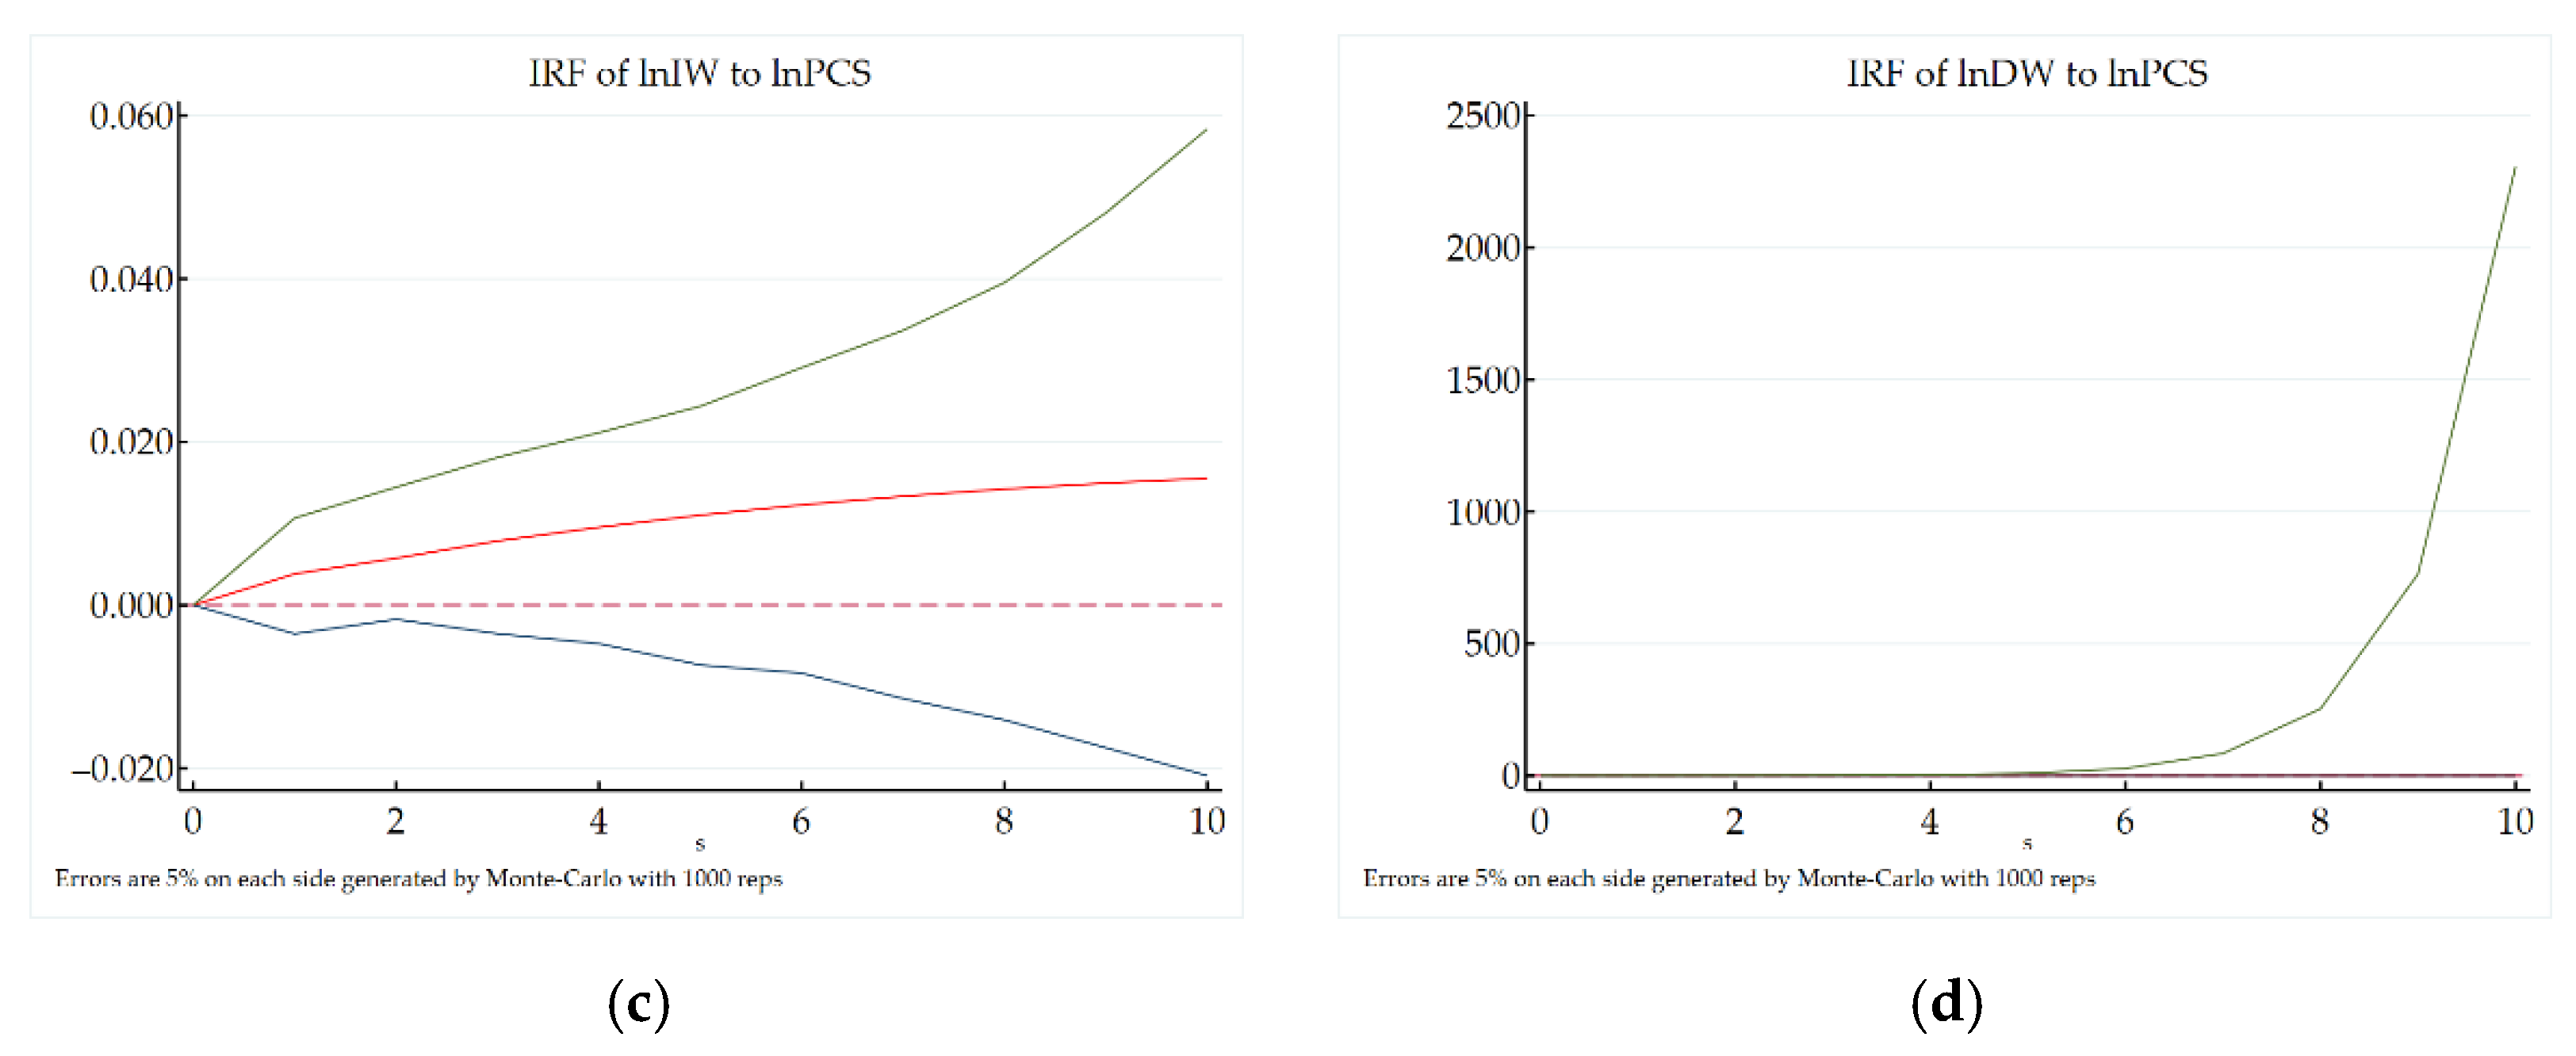
4.1.3. Impulse Response Analysis of Population Consumption Structure Change to Water Consumption

Figure 5a–d shows the impulse response functions of the population consumption structure changes on the total water use, agricultural water use, industrial water use, and domestic water use, respectively, where the horizontal axis indicates the responding time and the number of lag periods of the shock effect, and the vertical axis indicates the magnitude of change in water use of each industry affected by population consumption structure changes. The green and blue solid lines represent the positive and negative two standard deviation bands, the red solid line represents the impulse response trend of population consumption structure changes to industrial water consumption, and the red dashed line is the positive and negative dividing line.
In the first stage (Figure 5), the impulse response of the total water consumption impacted by the change of population consumption structure tends to become zero, and then turns to a negative response, showing a “U” trend. The impulse response to agricultural water consumption is positive in the first stage, and turns into a negative response in the second stage, and gradually expands. The impulse response of industrial water consumption is always positive and gradually increases. The impact on domestic water consumption is not obvious. The above results are similar to the previous mechanism analysis. The increase of the Engel coefficient means that the food expenditure in resident life grows, the high-end consumption decreases, and the impulse response to the total water consumption is negative. However, with the increase of the Engel coefficient, agricultural water consumption is reduced and the industrial water demand is expanded, which is mainly due to the fact that China is in the stage of agricultural modernization during the investigation period, and water-saving irrigation is implemented in agriculture, which reduces agricultural water consumption. Agricultural modernization needs the support of industrial industries such as equipment manufacturing and agricultural product processing industries. During the inspection period, China’s industry is still in the stage of high-quality development transformation, and both equipment manufacturing and agricultural product processing industries belong to high water consumption industries [43,44], resulting in a continuous positive impact on industrial water consumption due to the increase in resident food expenditure.

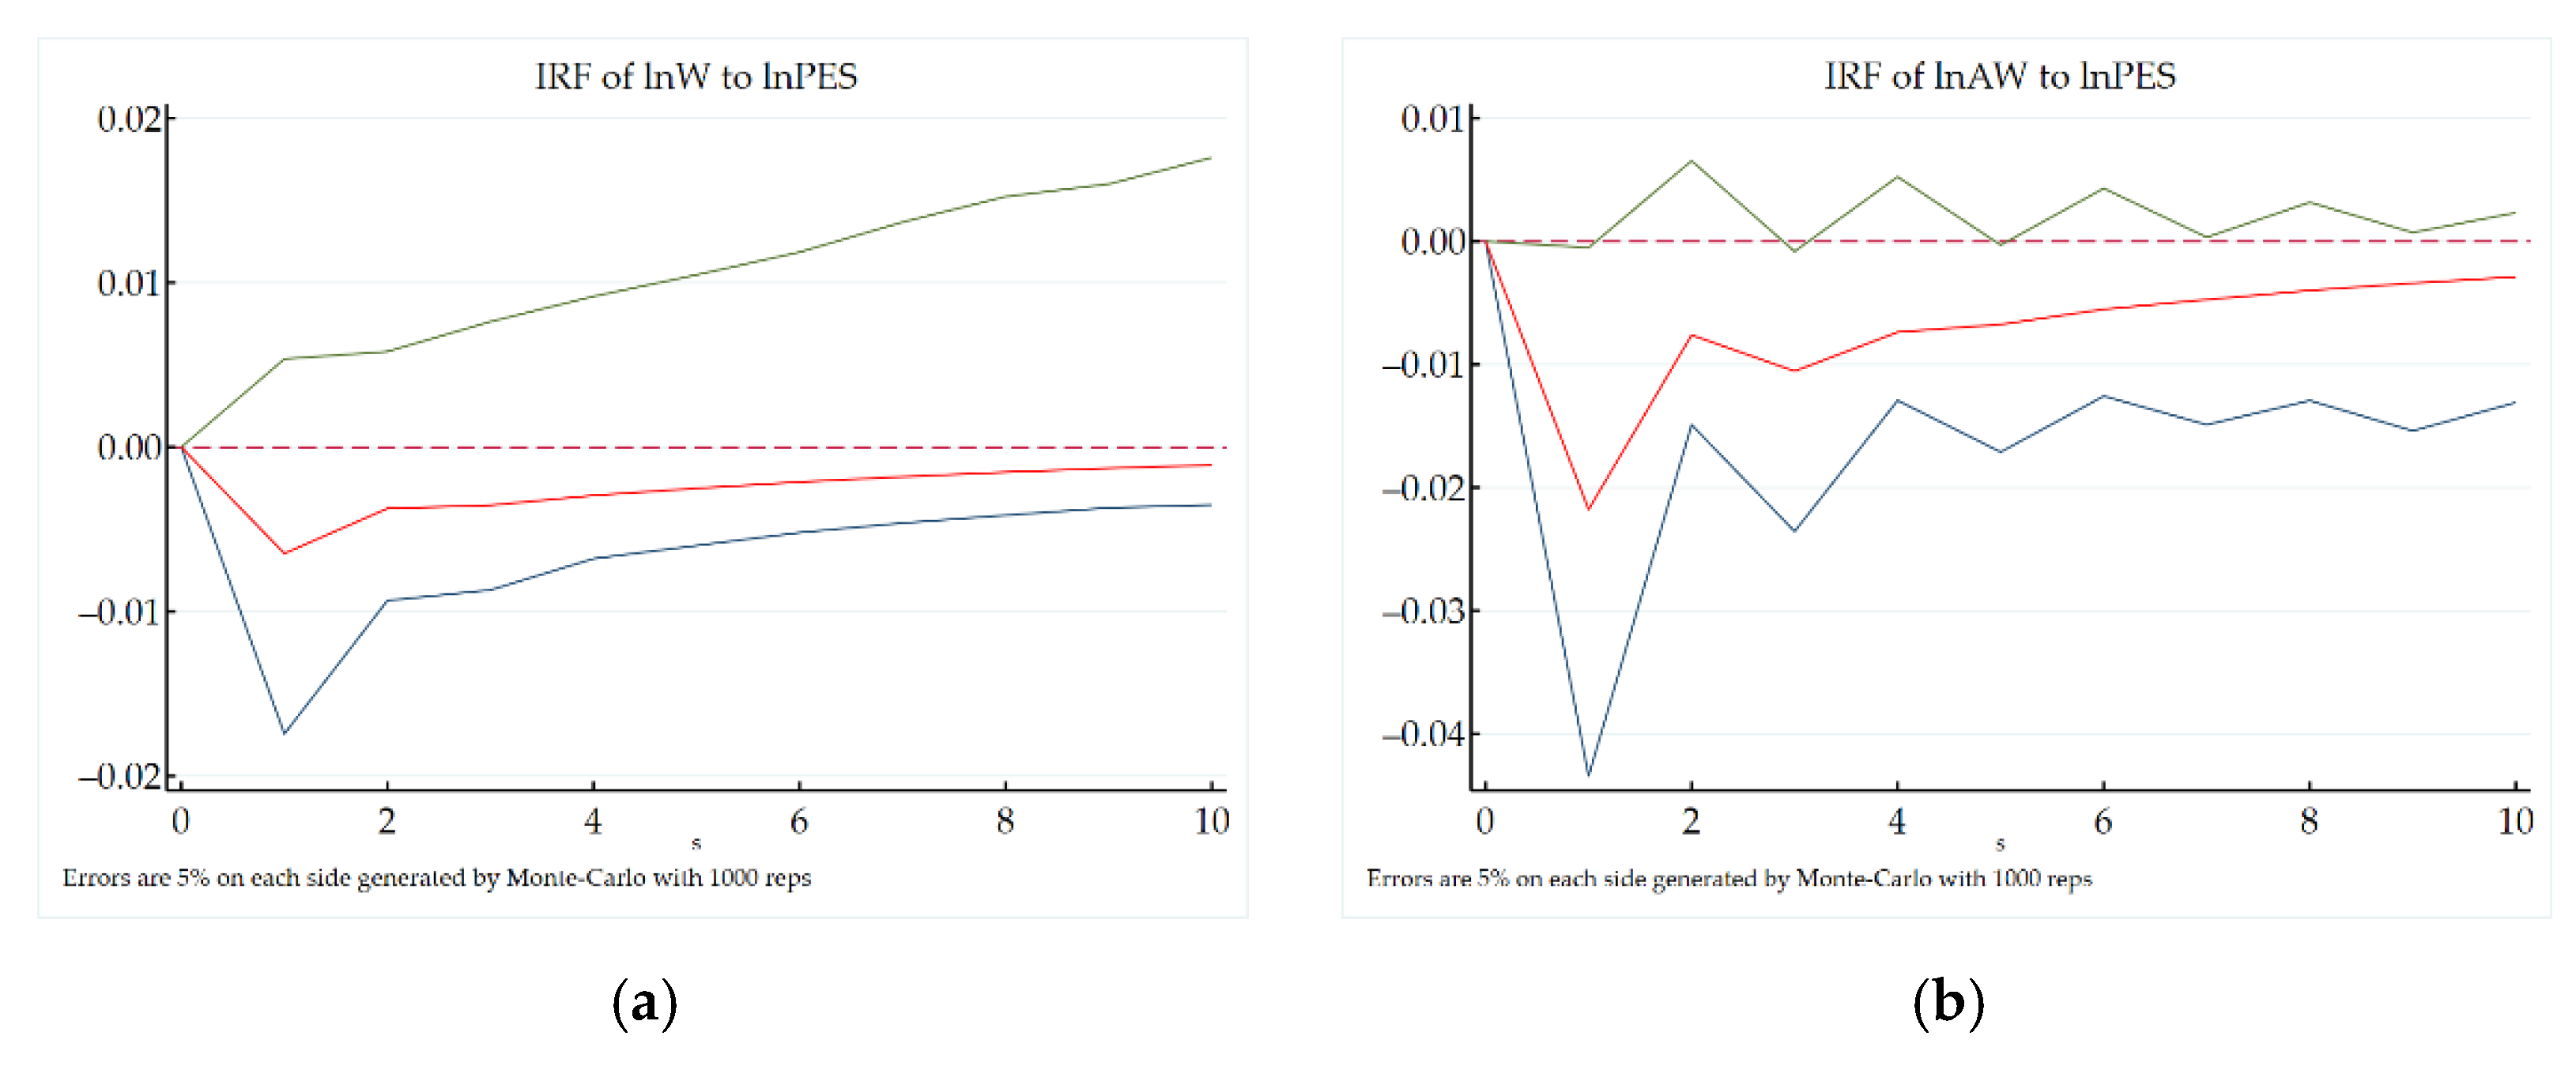
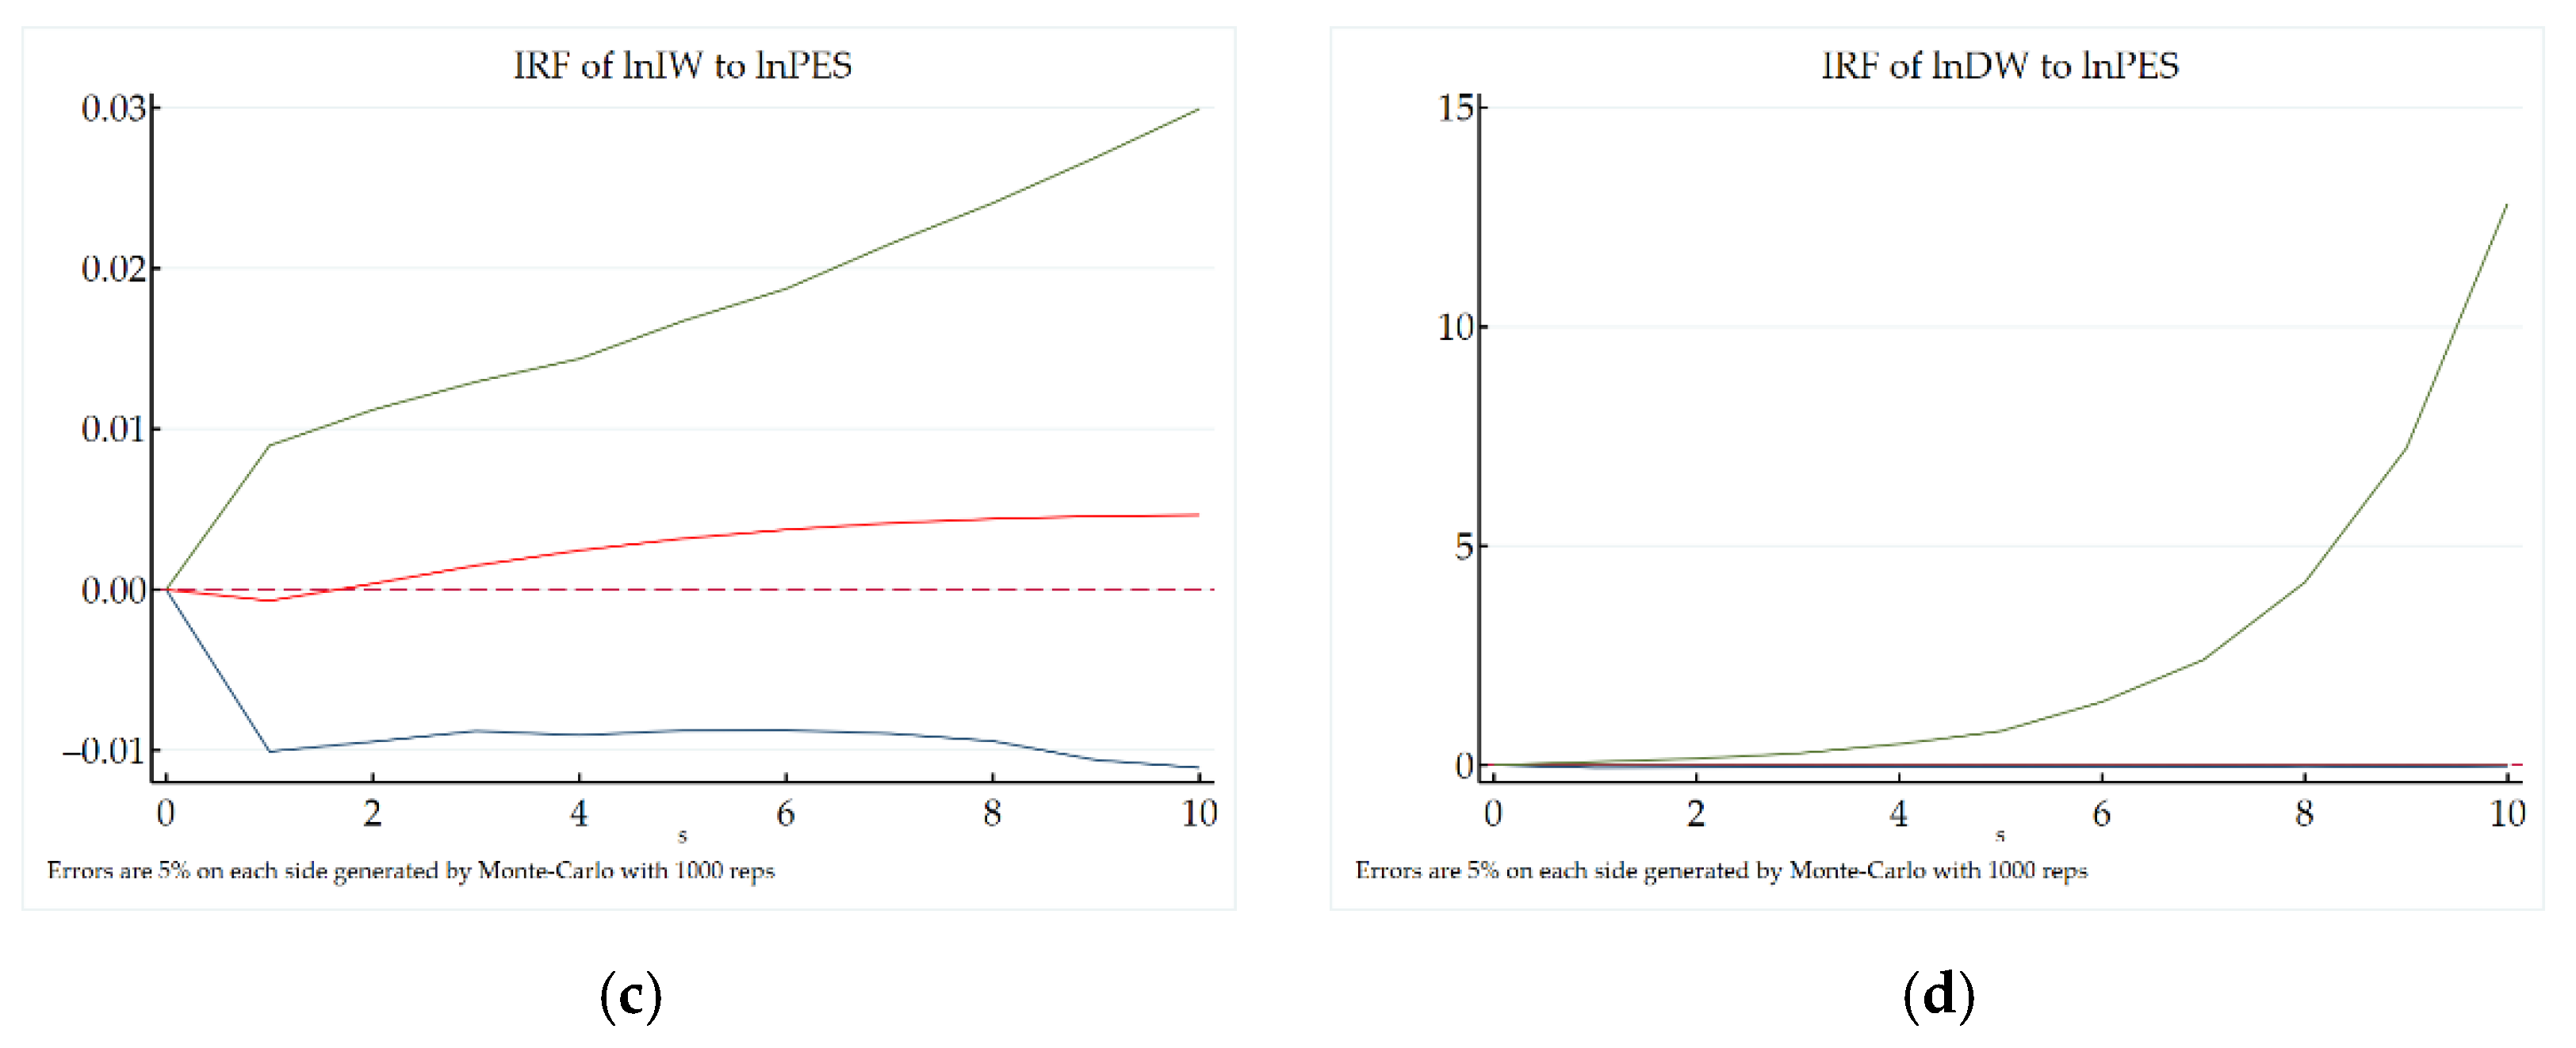
4.1.4. Impulse Response Analysis of Population Employment Structure Change to Water Consumption

Figure 6a–d shows the impulse response functions of population employment structure changes on total water use, agricultural water use, industrial water use, and domestic water use, respectively, where the horizontal axis indicates the responding time and the number of lag periods of the shock effect, and the vertical axis indicates the magnitude of change in water use of each industry affected by the population employment structure changes. The green and blue solid lines represent the positive and negative two standard deviation bands, the red solid line represents the impulse response trend of population employment structure changes to industrial water consumption, and the red dashed line is the positive and negative dividing line.
The employment structure of the population has a continuous negative impulse effect on the total water consumption, and the impact effect shows a “U” trend. The negative impact in the first period is the largest, and then gradually decreases and tends to be stable (Figure 6). Agricultural water consumption also shows a continuous inhibiting effect due to the impact of the population employment structure, and shows a “W” trend. The inhibiting effect is the strongest in the first stage, and is weakened in the second stage, but is strengthened again in the third stage and is then weakened again. The impulse response to industrial water consumption only has a short negative impact in the first stage, and presents a continuously enhanced positive impact after the second stage. The total domestic water consumption is not impacted. The above impulse response is consistent with the previous mechanism analysis. The massive transfer of the agricultural labor force leads to the lack of labor force in the process of agricultural modernization, resulting in management dislocation. At the initial stage of agricultural labor return, the shortage of labor is made up, which is conducive to maximizing the utilization effect of water-saving facilities and modern irrigation technology, thus showing a strong inhibiting effect on water consumption. The continuous return of the agricultural labor force will weaken the positive effect of agricultural modernization on water utilization efficiency. In addition, the increase of the agricultural employment population means more demand for agricultural tools, which has an inhibiting effect on industrial water consumption in the short term and then promotes industrial water consumption.

4.1.5. Impulse Response Analysis of Population Education Level Change to Water Consumption

Figure 7a–d shows the impulse response functions of population education structure changes on total water use, agricultural water use, industrial water use, and domestic water use, respectively, where the horizontal axis indicates the responding time and the number of lag periods of the shock effect, and the vertical axis indicates the magnitude of change in water use of each industry affected by population education structure changes. The green and blue solid lines represent the positive and negative two standard deviation bands, the red solid line represents the impulse response trend of population education structure changes to industrial water consumption, and the red dashed line is the positive and negative dividing line.
As can be seen from Figure 7, the impulse response of the resident education level to total water consumption and domestic water consumption tends to become zero. The impact effect on agricultural water consumption is negative for a short time in the first period, and then presents a stable positive impact, and gradually expands. Industrial water consumption begins to suffer a slight positive impact in the sixth phase. This is similar to the conclusion of other scholars, that is, improving resident education has little impact on total water consumption at this stage. However, the improvement of resident education often indicates an increase in income, which in turn increases the demand for industrial products and cash crops, so as to expand the water consumption for agriculture and industry.

4.2. Threshold Effect Analysis

The impulse response analysis of the population structure change on water consumption shows that there is a nonlinear relationship between population structure change and different water resources utilization modes. In order to further verify the nonlinear relationship, and to clarify the inflection point of the influence of each population structure variable on water consumption in its own change process, this paper uses the threshold model to deeply explore the threshold effect of population structure variables on water resources utilization.
Based on the above threshold model, firstly, the paper tests whether there are thresholds and the number of threshold values in the model, i.e., no threshold, single threshold, and double threshold. The hypotheses in the three scenarios are set as no threshold (original hypothesis) and single threshold (alternative hypothesis), single threshold (original hypothesis) and double threshold (alternative hypothesis), and double threshold (original hypothesis) and triple threshold (alternative hypothesis), respectively. Then, the self-sampling method and the least square likelihood ratio statistic LR are used to estimate the corresponding p value and critical value, and the results are shown in Table 2.
From the threshold existence test, it can be seen that each population structure variable has a threshold effect on water consumption under its own action, which also verifies the accuracy of the PVAR model results. From the results of the threshold existence test, each demographic variable is not significant for some single and triple thresholds of water consumption, and the dual threshold effects are significant at a 10% level. Therefore, based on the double threshold model, this paper will further carry out the multi-dimensional analysis of the impact of population structure changes on water consumption, so as to accurately identify the nonlinear effects of population structure changes on water resources utilization. On this basis, least square likelihood ratio statistics are applied to estimate the threshold value and the 95% confidence interval of each population structure variable (Table 3), as well as the double threshold regression results of the impact of each population structure variable on water consumption (Table 4).

4.2.1. Threshold Effect Analysis of Population Structure

(1) Urban−Rural Structure: The increase in the urban population will significantly promote the total water consumption, industrial water consumption, and domestic water consumption, and have a significant inhibiting effect on agricultural water consumption. From the perspective of effect, the total water consumption shows an “N” trend with the increase of urban population, the industrial water consumption shows an inverted “U” trend, the domestic water consumption gradually decreases, and the agricultural water consumption shows an inverted “N” trend. It means that in the process of the rural population moving to cities, due to the change of lifestyle and the increase of domestic water equipment, the total water consumption//, and industrial and domestic water consumption have increased. However, as the urbanization rate crosses the second inflection point (84.52%), the demand for industrial and domestic water resources will be alleviated. At the same time, due to the reduction of the rural population, this is beneficial to agricultural modernization and large-scale planting, thus improving the efficiency of agricultural water utilization and reducing agricultural water consumption, which is similar to the results of the PVAR model.
(2) Age Structure: With the aggravation of the social population aging crisis, the demand for total water consumption is rising, but the growth rate is gradually decreasing. Industrial water consumption shows a significant downward trend due to the aging of the population, presenting as a “U” trend (inflection point value is 6.48%). Agricultural and domestic water consumption is not significantly affected by population aging. The above phenomenon is similar to the impulse response structure. However, aging has no significant promotion effect on agricultural water consumption in the first and third stages and on domestic water consumption in the second and third stages, mainly because, although the elderly have higher requirements for diet and travel, they have no significant impact on high water-consuming agricultural cash crops and consumption due to their weak consumption ability.
(3) Consumption Structure: There is a difference between the double threshold effect and the impulse response result. The main manifestation is that the inhibiting effect of the consumption structure changes on the total water consumption and agricultural water consumption is not significant in the second stage, as well as the first and third stages, respectively, and has a promoting effect in the other stages. This is mainly due to the fact that food expenditure at this stage is mainly high protein meat and high water-consumption cash crops, thus expanding the demand for agricultural water. In addition, under the double threshold of the consumption structure, domestic water consumption shows a significant downward trend in the first and third stages, mainly because the increase in food expenditure will erode the consumption expenditure of the service industry.
(4) Employment Structure: Under the double threshold, the total water consumption and industrial water consumption are affected by the increase of the agricultural employment population, which is consistent with the impulse response. In the first stage, the agricultural water consumption is not significantly affected by the increase of the agricultural employment population. After entering the second and third stage, the agricultural water consumption increases significantly, mainly due to the excessive increase of the agricultural employment population, leading to inhibiting the process of agricultural modernization and reducing the efficiency of agricultural irrigation. Domestic water consumption decreases with the increase of agricultural employment population. The reason is that the increase in the agricultural employment population reduces the employment of the tertiary industry and the number of permanent residents in cities, which is bound to reduce domestic water consumption.
(5) Education Structure: Under the double threshold of the population education structure, the total water consumption and domestic water consumption increase with the improvement of residents’ education, while the agricultural and industrial water consumption is not significantly affected. This is somewhat different from the impulse response analysis, but is consistent with the previous mechanism analysis, that is, the improvement of education may increase, decrease, or may not affect water consumption [27,32].

4.2.2. Non-Demographic Regression Results

On the basis of the multi-dimensional analysis of the impact of population structure changes on water consumption, the impact of non-population structure variables on water consumption is further analyzed as follows (Table 5).
(1) The increase in population size can promote the total water consumption, and the agricultural, industrial, and domestic water consumption as a result of the expansion of the rigid water demand. However, its impact on industrial and domestic water consumption is not significa/nt, which may be due to the weak demand for industry and services in the early stage of population growth.
(2) The level of economic development has significantly pushed the total water consumption, as well as the agricultural and industrial water consumption, mainly because China’s economy is still in a high-quality transition stage, agricultural and industrial development has not yet fully achieved high-quality development, and there is great demand for water resources. However, thanks to the higher water utilization efficiency of the tertiary industry, its demand for water resources is not significant in the process of rapid economic development.
(3) Water endowment has a certain inhibiting effect on total water consumption, as well as agricultural and industrial water consumption. The reason for this is that the regions with a high water resource potential are mainly concentrated in the economically underdeveloped provinces in the central and western regions, such as Tibet, Qinghai, and Yunnan. These provinces have less water demand, thus showing an inhibiting effect on water consumption. However, its promotion effect on domestic water consumption is not significant, and is mainly affected by water-saving awareness.
(4) The increase in the proportion of tertiary industry helps to reduce the total water consumption, and the industrial and domestic water demands, which is mainly due to the higher water utilization efficiency of the tertiary industry. Among them, the inhibiting effect on the increase of the total water consumption and industrial water consumption is not significant, which may be due to the rapid development of the tertiary industry and the need for equipment support from the manufacturing industry, making the rigid demand for water resources conceal the effect of improving water utilization efficiency [43]. However, the increase in the proportion of the tertiary industry has no significant effect on the promotion of agricultural water consumption, which may be due to the increase in the demand of the tertiary industry for high water-consuming cash crops, which plays a potential role in pushing agricultural water consumption.
(5) The increase in water consumption per 10,000 CNY of GDP promotes water resources utilization, which means that technological progress has expanded the demand for water resources. It is inconsistent with the previous mechanism analysis. This is mainly because China’s economy is undergoing high-quality development and transformation, and the extensive development model has not been completely abandoned. As a result, the water resources saved due to technological progress are far less than the water demand increased due to the expansion of the economic scale. Finally, the water demand is still expanding in the process of increasing the water consumption per 10,000 CNY of GDP.

4.2.3. Model Robustness Test

During the threshold model regression, the threshold dependent variable is not used as an explanatory variable in the regression, which means that when the population structure variables are used as threshold-dependent variables, respectively, there are five different combinations of explanatory variables in the model. The regression results of these five models (Table 5) show that the non-demographic variables have the same sign of elasticity coefficient for water consumption, and the differences between elastic coefficients are rather small. It can be concluded that the threshold model is robust and reliable.

5. Conclusions and Water Resources Management Recommendations

Based on Maslow’s hierarchy of needs, this paper makes a multi-dimensional analysis of the impact of population structure changes on water resources utilization in 31 provinces of China from 2001 to 2019 by using the PVAR model and threshold model, and draws the following conclusions and suggestions.

5.1. Conclusions

(1) Population structure variables: Firstly, the increase in the urban population significantly promotes an increase in the total water consumption, as well as industrial and domestic water consumption, and shows a “N” trend, inverted “U” trend, and gradual decrease trend, respectively, but it is conducive to inhibiting the increase of agricultural water consumption, and the inhibition effect shows an inverted “N” trend. Secondly, the increase in the aging population expands the total water consumption, and agricultural and domestic water demand, while it has a significant inhibiting effect on industrial water consumption. Thirdly, the increase in resident food expenditure helps to reduce the total water consumption and agricultural water consumption, but increases the industrial water consumption with a rising growth rate, while the domestic water consumption continues to decline due to its influence. Fourthly, an increase in the number of agricultural employees reduces the total water consumption, as well as agricultural and domestic water consumption, and promotes the increase of industrial water consumption, but the inhibiting effect on agricultural water consumption is unstable. Fifthly, the total water consumption and domestic water consumption both increase with the improvement of the population education level, while the agricultural water consumption “declines first and then rises”.
(2) Among the non-demographic variables, the increase in population size can promote the total water consumption, as well as the agricultural, industrial, and domestic water consumption. The level of economic development has a significant role in promoting the total water consumption, as well as agricultural and industrial water consumption. The water resource potential has a certain inhibiting effect on total water consumption, as well as agricultural and industrial water consumption, but increases domestic water consumption. The increase in the proportion of the tertiary industry will help reduce the total water consumption, as well as the industrial and domestic water demand. An increase in the water consumption per 10,000 CYN of GDP expands the demand for water resources for social and economic development.

5.2. Water Resources Management Recommendations

Based on the above conclusions and the previous analysis, the following suggestions are proposed at demographic change and non-demographic structure levels, respectively:
(1) As for the impact of population structure changes on water resources utilization: Firstly, improve the construction of water-saving infrastructure in rural and urban areas, and popularize household water-saving devices in the process of changing the lifestyles of urban and rural residents, thus avoiding increasing demand for water due to the increase in water-using device. Secondly, guide the aging population to spend more time outdoors and reduce household water consumption, and strengthen the intensive use of water resources in the tertiary industry and reduce the demand for water resources in the tertiary industry, represented by tourism. Thirdly, guide them to reasonably improve their dietary structure and promote the consumption of water-saving products and services in the process of increasing consumption of the population. What’s more, improve the skills of agricultural laborers, expand the construction of well-facilitated farmland, and reduce agricultural water demand by importing high-water-consuming agricultural products. Lastly, prevent the consumption of high-water-consuming crops through increased education, strengthen the awareness of water conservation among high-income groups, and raise the status of resource scarcity in the education system.
(2) As for the impact of the non-demographic structure on water consumption: Firstly, persist in basing population development and production development on water resources, improve the efficiency of water use, enhance the water resources carrying capacity, and alleviate the rigid demand for water resources caused by population scale growth. Secondly, establish and improve market systems such as water rights trading, and transform the economic development model of high water consumption. At the same time, use policies and systems to force industries to implement water-saving transformation, improve the water-use efficiency of each industry, and give priority to the development of industries with a high water-use efficiency. Fourthly, exercise the role of technological innovation in promoting resource conservation and economic development, promote the transformation and application of water-saving technology, and reduce the water consumption of 10,000 CNY GDP.

Author Contributions

Conceptualization, S.L.; Formal analysis, S.L., S.G. and W.-L.H.; Funding acquisition, S.L.; Investigation, S.G. and H.-L.L.; Methodology, S.L.; Project administration, S.L. and W.-L.H.; Resources, S.G. and W.-L.H.; Software, S.G. and H.-L.L.; Supervision, S.L.; Validation, Y.-C.S. and H.-L.L.; Visualization, H.-L.L.; Writing—review and editing, Y.-C.S. All authors have read and agreed to the published version of the manuscript.

Funding

2018 Philosophy and Social Science Research Fund Project of Higher Education in Jiangsu Province (grant number: 2018SJA1585): “Marx’s Ecological Thought and Its Practice in China”; 2019 Postgraduate Science Research and Innovation Project in Jiangsu Province (grant number: SJKY19_0396): “Time Reflection on Xi Jinping’s Ecological Civilization Thought and Its Realistic Value”.

Institutional Review Board Statement

Not applicable.

Informed Consent Statement

Not applicable.

Data Availability Statement

Not applicable.

Acknowledgments

We would like to thank anonymous reviewers for their valuable comments and suggestions for improving this paper. At the same time, we gratefully acknowledge the Fengming Han.

Conflicts of Interest

The authors declare no conflict of interest.

References

  1. González-Trinidad, J.; Júnez-Ferreira, H.E.; Bautista-Capetillo, C.; Ávila Dávila, L.; Robles Rovelo, C.O. Improving the Water-Use Efficiency and the Agricultural Productivity: An Application Case in a Modernized Semiarid Region in North-Central Mexico. Sustainability 2020, 12, 8122. [Google Scholar] [CrossRef]
  2. Wittfogel, K. The Hydraulic Civilisations; Chicago University Press: Chicago, IL, USA, 1956. [Google Scholar]
  3. Butzer, K.W. Early Hydraulic Civilization in Egypt: A Study in Cultural Ecology. University of Chicago Press. J. Archaeol. Sci. 1976, 5, 185–186. [Google Scholar] [CrossRef]
  4. Rodina, L. Water resilience lessons from Cape Town’s water crisis. Wiley Interdiscip. Rev. Water 2019, 6, 1–7. [Google Scholar] [CrossRef]
  5. Kuspili/, M.; Vuković, Ž.; Halkijević, I. Assessment of water resources carrying capacity for the Island of Cres. Gradevinar 2018, 70, 305–313. [Google Scholar] [CrossRef]
  6. Marshall, L.; Kaminsky, J. When behavior change fails: Evidence for building WASH strategies on existing motivations. J. Water Sanit. Hyg. Dev. 2016, 6, 287–297. [Google Scholar] [CrossRef] [Green Version]
  7. Melloul, A.J.; Collin, M.L. Harmonizing water management and social needs: A necessary condition for sustainable development. The case of Israel’s coastal aquifer. J. Environ. Manag. 2003, 67, 385–394. [Google Scholar] [CrossRef]
  8. Crouch, M.L.; Jacobs, H.E.; Speight, V.L. Defining domestic water consumption based on personal water use activities. J. Water Supply Res. Technol. AQUA 2021, 70, 1002–1011. [Google Scholar] [CrossRef]
  9. Rak, J.R.; Tchórzewska-Cieślak, B.; Pietrucha-Urbanik, K. A Hazard Assessment Method for Waterworks Systems Operating in Self-Government Units. Int. J. Environ. Res. Public Health 2019, 16, 767. [Google Scholar] [CrossRef] [Green Version]
  10. Pietrucha-Urbanik, K.; Rak, J.R. Consumers’ Perceptions of the Supply of Tap Water in Crisis Situations. Energies 2020, 13, 3617. [Google Scholar] [CrossRef]
  11. Ricart, S.; Villar-Navascués, R.A.; Hernández-Hernández, M.; Rico-Amorós, A.M.; Olcina-Cantos, J.; Moltó-Mantero, E. Extending Natural Limits to Address Water Scarcity? The Role of Non-Conventional Water Fluxes in Climate Change Adaptation Capacity: A Review. Sustainability 2021, 13, 2473. [Google Scholar] [CrossRef]
  12. Gibson, K.E.; Lamm, A.J.; Woosnam, K.M.; Croom, D.B. Predicting Intent to Conserve Freshwater Resources Using the Theory of Planned Behavior (TPB). Water 2021, 13, 2581. [Google Scholar] [CrossRef]
  13. Musz-Pomorska, A.; Widomski, M.K.; Golebiowska, J. Financial Sustainability of Selected Rain Water Harvesting Systems for Single-Family House under Conditions of Eastern Poland. Sustainability 2020, 12, 4853. [Google Scholar] [CrossRef]
  14. Kim, S.H.; Choi, S.H.; Koo, J.Y.; Choi, S.I.; Hyun, I.H. Trend analysis of domestic water consumption depending upon social, cultural, economic parameters. Water Sci. Technol. Water Supply 2007, 7, 61–68. [Google Scholar] [CrossRef]
  15. Fuentes, E.; Arce, L.; Salom, J. A review of domestic hot water consumption profiles for application in systems and buildings energy performance analysis. Renew. Sustain. Energy Rev. 2018, 81, 1530–1547. [Google Scholar] [CrossRef]
  16. Wolters, E.A. Attitude–behavior consistency in household water consumption. Soc. Sci. J. 2014, 51, 455–463. [Google Scholar] [CrossRef]
  17. Chenoweth, J.; López-Avilés, A.; Morse, S.; Druckman, A. Water consumption and subjective wellbeing: An analysis of British households. Ecol. Econ. 2016, 130, 186–194. [Google Scholar] [CrossRef]
  18. Shadeed, S.; Alawna, S. Optimal Sizing of Rooftop Rainwater Harvesting Tanks for Sustainable Domestic Water Use in the West Bank, Palestine. Water 2021, 13, 573. [Google Scholar] [CrossRef]
  19. Pan, W.; Hou, B.; Yang, R.; Zhan, X.; Tian, W.; Li, B.; Xiao, W.; Wang, J.; Zhou, Y.; Zhao, Y.; et al. Conceptual Framework and Computational Research of Hierarchical Residential Household Water Demand. Water 2018, 10, 696. [Google Scholar] [CrossRef] [Green Version]
  20. Xue, B.X.; Li, T.Y.; Hou, X.H.; Guo, J.Y. Study on the organization of water-conservation activities and guiding strategies for urban communities based on public participation in China. J. Water Supply: Res. Technol. -Aqua 2020, 69, 538–554. [Google Scholar] [CrossRef]
  21. Zhang, N.; Wang, Z.C.; Zhang, L.; Yang, X. Assessment of Water Resources Carrying Risk and the Coping Behaviors of the Government and the Public. Int J Env. Res Public Health 2021, 18, 7693. [Google Scholar] [CrossRef]
  22. Zuo, Q.; Li, W.; Zhao, H.; Ma, J.; Han, C.; Luo, Z. A Harmony-Based Approach for Assessing and Regulating Human-Water Relationships: A Case Study of Henan Province in China. Water 2021, 13, 32. [Google Scholar] [CrossRef]
  23. Li, X.; Yin, D.; Zhang, X.; Croke, B.F.; Guo, D.; Liu, J.; Jakeman, A.J.; Zhu, R.; Zhang, L.; Mu, X.; et al. Mapping the Distribution of Water Resource Security in the Beijing-Tianjin-Hebei Region at the County Level under a Changing Context. Sustainability 2020, 11, 6463. [Google Scholar] [CrossRef] [Green Version]
  24. Wang, X.W.; Li, R.R. Is Urban Economic Output Decoupling from Water Use in Developing Countries?—Empirical Analysis of Beijing and Shanghai, China. Water 2019, 11, 1335. [Google Scholar] [CrossRef] [Green Version]
  25. Hu, Z.; Liu, Y.; Li, Y.F. Study on Demographic Marginal Effect of Domestic Water Consumption in Western China Cities—Based on Survey Data of China Household Tracking Survey. Ecol. Econ. 2018, 34, 165–171. [Google Scholar]
  26. Bringezu, S.; Distelkamp, M.; Lutz, C.; Wimmer, F.; Schaldach, R.; Hennenberg, K.J.; Böttcher, H.; Egenolf, V. Environmental and socioeconomic footprints of the German bioeconomy. Nat. Sustain. 2021, 4, 775–783. [Google Scholar] [CrossRef]
  27. Aikowe, J.O.; Mazancova, J. Barriers to Water Access in Rural Communities: Examining the Factors Influencing Water Source Choice. Water 2021, 13, 2755. [Google Scholar] [CrossRef]
  28. Fan, L.; Gai, L.; Tong, Y.; Li, R. Urban water consumption and its influencing factors in China: Evidence from 286 cities. J. Clean. Prod. 2017, 166, 124–133. [Google Scholar] [CrossRef]
  29. Boakye-Ansah, A.S.; Schwartz, K.; Zwarteveen, M. Service differentiation as an improvement strategy for access to water in urban low-income areas: Evidence from three Kenyan cities. Int. J. Water Resour. Dev. 2021, 1, 1–17. [Google Scholar] [CrossRef]
  30. Jin, W.; Zhang, H.Q.; Liu, S.S.; Zhang, H.B. Technological innovation, environmental regulation, and green total factor efficiency of industrial water resources. J. Clean. Prod. 2019, 211, 61–69. [Google Scholar] [CrossRef]
  31. He, C.; Liu, Z.; Wu, J.; Pan, X.; Fang, Z.; Li, J.; Bryan, B.A. Future global urban water scarcity and potential solutions. Nat. Commun. 2021, 12, 4667. [Google Scholar] [CrossRef] [PubMed]
  32. He, G.; Geng, C.; Zhai, J.; Zhao, Y.; Wang, Q.; Jiang, S.; Zhu, Y.; Wang, L. Impact of food consumption patterns change on agricultural water requirements: An urban-rural comparison in China. Agric. Water Manag. 2021, 243, 106504. [Google Scholar] [CrossRef]
  33. Vieux, F.; Maillot, M.; Rehm, C.D.; Barrios, P.; Drewnowski, A. Opposing Consumption Trends for Sugar-Sweetened Beverages and Plain Drinking Water: Analyses of NHANES 2011-16 Data. Front. Nutr. 2020, 16, 587123. [Google Scholar] [CrossRef]
  34. Descheemaeker, K.; Amede, T.; Haileslassie, A. Improving water productivity in mixed crop-livestock farming systems of sub-Saharan Africa. Agric. Water Manag. 2010, 97, 579–586. [Google Scholar] [CrossRef]
  35. National Bureau of Statistics of China. China Statistical Yearbook; China Statistics Press: Beijing, China, 2019. [Google Scholar]
  36. Multsch, S.; Elshamy, M.E.; Batarseh, S.; Seid, A.H.; Frede, H.G.; Breuer, L. Improving irrigation efficiency will be insufficient to meet future water demand in the Nile Basin. J. Hydrol. Reg. Stud. 2017, 12, 315–330. [Google Scholar] [CrossRef]
  37. Holtz-Eakin, D.; Newey, W.; Rosen, H.S. Estimating Vector Autoregressions with Panel Data. Econometrica 1988, 56, 1371–1395. [Google Scholar] [CrossRef]
  38. Love, I.; Zicchino, L. Financial Development and Dynamic Investment Behavior: Evidence from Panel VAR. Q. Rev. Econ. Financ. 2006, 46, 190–210. [Google Scholar] [CrossRef]
  39. York, R.; Rosa, E.A.; Dietz, T. STIRPAT, IPAT and ImPACT: Analytic tools for unpacking the driving forces of environmental impacts. Ecol. Econ. 2005, 46, 351–365. [Google Scholar] [CrossRef]
  40. Chen, B.K.; Yang, X.; Zhong, N.H. Housing demand and household saving rates in china: Evidence from a housing reform. J. Hous. Econ. 2020, 49, 101693. [Google Scholar] [CrossRef]
  41. National Bureau of Statistics of China. China Rural Statistical Yearbook; China Statistics Press: Beijing, China, 2019. [Google Scholar]
  42. National Bureau of Statistics of China. China Population and Employment Statistical Yearbook; China Statistics Press: Beijing, China, 2019. [Google Scholar]
  43. Zhang, Z.Y.; Zhang, X.L.; Shi, M.J. Urban transformation optimization model: How to evaluate industrial structure under water resource constraints? J. Clean. Prod. 2018, 195, 1497–1504. [Google Scholar] [CrossRef]
  44. Wang, X.C.; Klemeš, J.J.; Wang, Y.; Dong, X.; Wei, H.; Xu, Z.; Varbanov, P.S. Water-Energy-Carbon Emissions nexus analysis of China: An environmental input-output model-based approach. Appl. Energy 2020, 261, 114431. [Google Scholar] [CrossRef]
Figure 1. Trends of total and per capita water consumption in China for 2000–2019.
Sustainability 14 00204 g001
Figure 2. The relationship between population structure and water resources under the framework of Maslow’s hierarchy of needs.
Sustainability 14 00204 g002
Figure 3. Impulse Response function of urban−rural population structure changes to water consumption (Monte Carlo simulation 1000 times): (a) response of URS changes to total water consumption; (b) response of URS changes to agricultural water consumption; (c) response of URS changes to industrial water consumption; (d) response of URS changes to domestic water consumption.
Sustainability 14 00204 g003
Figure 4. Impulse response function of age structure change to water consumption (Monte Carlo simulation 1000 times): (a) response of ASP Changes to total water consumption; (b) response of ASP changes to agricultural water consumption; (c) response of ASP changes to industrial water consumption; (d) response of ASP changes to domestic water consumption.
Sustainability 14 00204 g004
Figure 5. Impulse response function of population consumption structure change to water consumption (Monte Carlo simulation 1000 times): (a) response of PCS changes to total water consumption; (b) response of PCS changes to agricultural water consumption; (c) response of PCS changes to industrial water consumption; (d) response of PCS changes to domestic water consumption.
Sustainability 14 00204 g005aSustainability 14 00204 g005b
Figure 6. Impulse response function of population employment structure change to water consumption (Monte Carlo simulation 1000 times): (a) response of PES changes to total water consumption; (b) response of PES changes to agricultural water consumption; (c) response of PES changes to industrial water consumption; (d) response of PES changes to domestic water consumption.
Sustainability 14 00204 g006aSustainability 14 00204 g006b
Figure 7. Impulse response function of population education level change to water consumption (Monte Carlo simulation 1000 times). (a) response of PEL changes to total water consumption; (b) response of PEL changes to agricultural water consumption; (c) response of PEL changes to industrial water consumption; (d) response of PEL changes to domestic water consumption.
Sustainability 14 00204 g007
Table 1. Descriptive statistics of variables.
Variable NameAverageStandard DeviationMaximum ValueMinimum ValueCoefficient of Variation
Total water consumption (ln W)4.9370.8476.3842.9520.172
Agricultural water consumption (ln AW)4.4070.9676.3311.4350.219
Industrial water consumption (ln IW)3.1751.2155.542−1.2040.383
Domestic water consumption (ln DW)2.8200.9144.6260.0300.324
Urban−rural structure (ln URS)3.8550.3244.4952.9400.084
Age structure of population (ln ASP)2.1780.2392.7961.4660.110
Population consumption structure (ln PCS)3.6280.2074.2912.3380.057
Population employment structure (ln PES)3.5620.6324.4051.0640.177
Population education level (ln PEL)2.1190.1622.5301.3190.077
Population size (ln PS)8.0760.8689.3375.5530.108
Economic development (ln PGDP)9.7910.77511.7367.9230.079
Potential of water (ln PW)7.1761.50412.1293.4490.210
Industrial structure (ln IS)3.7230.1864.3943.3530.050
Technological progress (ln WGDP)5.2191.0638.1662.4740.204
Note: Descriptive statistics were obtained by the authors by compiling data from Stata 16.0 statistical analysis. Data from the China Statistical Yearbook [35], China Rural Statistical Yearbook [41], China Population and Employment Statistical Yearbook [42], 2002–2020.
Table 2. Threshold existence test of population structure variables on water consumption.
Explained VariableLnWLnAWLnIWLnDW
Threshold Dependent VariableThreshold OrderF Valuep ValueF Valuep ValueF Valuep ValueF Valuep Value
LnURSSingle51.9490.01388.5710.00021.6260.07053.1570.000
Double26.9970.02740.9230.00017.3090.07716.4020.033
Triple16.8370.04736.2820.01011.7320.0775.9030.220
LnASPSingle11.7050.10328.7330.0106.3640.2476.7920.117
Double3.8250.04712.5610.01513.2990.0177.8960.077
Triple5.2140.1809.8440.0376.1320.1003.2350.333
LnPCSSingle45.0350.01746.7670.00054.0890.00326.9150.010
Double31.4310.00330.1770.02012.8400.0979.4890.097
Triple12.8060.04314.8560.0678.8660.15024.6960.003
LnPESSingle19.8660.08736.3600.00032.6930.02010.1840.133
Double18.6970.04028.2770.02720.9370.02010.0480.017
Triple7.8120.14311.3580.0609.9950.2179.4330.110
LnPELSingle45.9090.0008.4890.1171.7770.20313.6540.023
Double19.7480.00028.4400.01738.1310.0004.3460.023
Triple7.2790.2108.2710.10014.3940.0473.9080.087
Note: Due to the page limitation, the threshold values of 1%, 5%, and 10% of each threshold dependent variable are no longer listed.
Table 3. Threshold values and 95% confidence intervals of demographic variables.
Explained VariableLnWLnAWLnIWLnDW
Threshold Dependent
Dependent Variable
Threshold Value95% Confidence IntervalThreshold Value95% Confidence IntervalThreshold Value95% Confidence IntervalThreshold Value95% Confidence Interval
LnURS14.096(4.076,
4.104)
3.692(3.671,
3.695)
3.086(3.086,
3.086)
3.121(3.105,
3.125)
LnURS24.443(4.437,
4.458)
4.458(4.458,
4.458)
4.437(3.710,
4.443)
3.691(3.552,
4.289)
LnASP12.377(1.671,
2.657)
2.421(2.418,
2.421)
1.800(1.780,
2.305)
1.716(1.692,
2.515)
LnASP22.498(1.671,
2.657)
2.610(2.191,
2.657)
1.869(1.834,
2.458)
1.997(1.798,
2.610)
LnPCS13.232(3.209,
3.815)
3.209(3.209,
3.209)
3.841(3.320,
3.859)
3.524(3.498,
3.984)
LnPCS23.408(3.389,
3.434)
3.659(3.374,
3.676)
3.984(3.984,
3.984)
3.952(3.233,
3.984)
LnPES12.667(2.526,
2.779)
1.526(1.504,
1.649)
3.699(3.655,
4.133)
3.874(1.411,
4.285)
LnPES23.514(3.450,
3.906)
3.694(3.676,
3.735)
3.924(3.921,
3.943)
3.809(3.767,
4.121)
LnPEL12.255(2.241,
2.298)
2.214(1.944,
2.377)
1.530(1.530,
1.530)
1.626(1.626,
2.395)
LnPEL22.406(2.406,
2.413)
2.419(2.419,
2.419)
2.238(1.985,
2.419)
2.122(2.110,
2.142)
Table 4. Elasticity coefficient of each variable when the population structure is taken as the threshold.
Explained VariableLnWLnAWLnIWLnDW
Elasticity coefficient of threshold variableLnURS10.082 ** (2.160)− 0.179 ** (− 2.780)0.249 * (1.690)0.763 *** (7.900)
LnURS20.065 * (1.680)− 0.154 ** (− 2.460)0.372 ** (2.680)0.634 *** (7.040)
LnURS30.094 ** (2.370)− 0.253 *** (− 3.900)0.286 ** (2.010)0.612 *** (7.010)
LnASP10.072 ** (2.380)0.029 (0.650)− 0.458 *** (− 4.040)− 0.050 (− 0.690)
LnASP20.064 ** (2.200)− 0.006 (− 0.140)− 0.584 *** (− 5.550)0.013 (0.220)
LnASP30.052 * (1.860)0.025 (0.610)− 0.487 *** (− 4.990)0.042 (0.730)
LnPCS10.072 ** (1.970)0.024 (0.450)0.372 *** (4.100)− 0.118 * (− 1.810)
LnPCS20.037 (1.070)0.088* (1.820)0.340 *** (3.730)− 0.094 (− 1.510)
LnPCS30.057 * (1.760)0.068 (1.450)0.216 ** (2.330)− 0.118 * (− 1.920)
LnPES1− 0.110 *** (− 3.810)0.042 (0.680)0.201 ** (2.210)− 0.386 *** (− 7.310)
LnPES2− 0.072 ** (− 2.680)0.179 *** (4.050)0.238 ** (2.630)− 0.408 *** (− 7.670)
LnPES3− 0.060 ** (− 2.270)0.157 *** (3.600)0.190 ** (2.060)− 0.384 *** (− 7.180)
LnPEL10.251 ** (3.130)0.156 (1.210)− 0.403 (− 1.190)0.248 (1.260)
LnPEL20.235 ** (2.950)0.173 (1.350)− 0.085 (− 0.280)0.338 * (1.910)
LnPEL30.308 *** (3.880)0.083 (0.650)− 0.149 (− 0.490)0.370 ** (2.090)
Note: *, **, and *** are significant at 10%, 5%, and 1% level, respectively. The value outside the bracket is the elastic coefficient of each variable, and the value inside the bracket is the t value.
Table 5. Elastic coefficients of the other explanatory variables.
Explained VariableLnWLnAWLnIWLnDW
Urban−rural
Structure
Threshold
Variable
LnPS0.087 *** (3.660)0.081 *** (2.260)0.193 (1.630)0.090 * (1.870)
LnPGDP0.534 *** (21.010)0.624 *** (16.600)0.353 *** (3.920)0.021 (0.430)
LnPW−0.014 (−1.550)−0.017 (−1.230)−0.036 (−1.150)0.010 (0.550)
LnIS−0.025 (−0.740)0.058 (1.170)−0.041 (−0.350)−0.217 ** (−3.24)
LnWGDP0.413 *** (20.92)0.504 *** (17.280)0.157 ** (2.240)0.081 ** (2.11)
_cons−4.149 *** (−8.140)−5.654 *** (−7.310)−4.874 ** (−2.660)−0.444 (−0.440)
Age
Structure
Threshold
Variable
LnPS0.106 *** (4.230)0.078 ** (2.010)0.134 (1.550)0.063 (1.260)
LnPGDP0.483 *** (18.790)0.722 *** (18.360)0.410 *** (4.600)0.078 (1.500)
LnPW−0.011 (−1.200)−0.020 (1.360)−0.040 (−1.250)0.007 (0.370)
LnIS−0.004 (−0.130)0.075 (1.410)−0.001 (−0.010)−0.294 *** (* 4.23)
LnWGDP0.392 *** (18.890)0.551 *** (17.530)0.213 ** (2.960)0.108 ** (2.630)
_cons−3.847 *** (−7.220)−7.993 *** (−9.860)−6.788 *** (−3.730)1.065 (1.010)
Consumption
Structure
Threshold
Variable
LnPS0.088 *** (3.680)0.088 ** (2.350)0.115 (1.380)0.067 (1.370)
LnPGDP0.520 *** (20.490)0.635 *** (16.240)0.437 *** (5.170)0.073 (1.460)
LnPW−0.015 * (−1.740)−0.024 * (−1.700)−0.022 (−0.720)0.007 (0.380)
LnIS−0.013 (−0.400)0.084 (1.620)−0.268 ** (−2.220)−0.381 *** (−5.330)
LnWGDP0.402 *** (20.630)0.530 *** (17.350)0.222 ** (3.320)0.094 ** (2.370)
_cons−3.670 *** (−7.010)−7.014 *** (−8.720)−4.974 ** (−2.810)1.900 * (1.830)
Employment
Structure
Threshold
Variable
LnPS0.104 *** (4.230)0.058 * (1.530)0.155 * (1.840)0.066 (1.310)
LnPGDP0.498 *** (19.610)0.621 *** (15.600)0.533 *** (6.080)0.018 (0.340)
LnPW−0.011 (−1.150)−0.028 ** (−1.980)−0.016 (−0.500)0.005 (0.250)
LnIS−0.019 (−0.560)0.060 (1.140)−0.179 (−1.480)−0.255 *** (−3.600)
LnWGDP0.393 *** (19.530)0.473 *** (15.080)0.363 *** (5.170)0.058 (1.430)
_cons−4.009 *** (−7.710)−5.396 *** (−6.350)−8.543 *** (−4.75)1.423 (1.350)
Education Level
Threshold variable
LnPS0.105 *** (4.310)0.067 * (1.710)0.158 * (1.840)0.086 * (1.710)
LnPGDP0.563 *** (20.770)0.601 *** (13.930)0.539 *** (5.960)0.016 (0.310)
LnPW−0.012 (−1.310)−0.022 (−1.530)−0.030 (−0.940)0.005 (0.280)
LnIS−0.007 (−0.200)0.078 (1.450)−0.041 (−0.340)−0.250 *** (−3.530)
LnWGDP0.434 *** (20.88)0.472 *** (14.420)0.259 *** (3.670)0.080 ** (1.990)
_cons−5.067 *** (−9.400)−6.053 *** (−7.100)−7.268 *** (−3.910)1.501 (1.420)
Note: *, **, and *** are significant at 10%, 5%, and 1% level, respectively. The value outside the bracket is the elastic coefficient of each variable, and the value inside the bracket is the t value.
Publisher’s Note: MDPI stays neutral with regard to jurisdictional claims in published maps and institutional affiliations.

