
A Methodological Framework for Life Cycle Sustainability Assessment of Construction Projects Incorporating TBL and Decoupling Principles


Abstract
:1. Introduction
- To identify different TBL based sustainability, i.e., social, economic, and environmental, assessment parameters and indicators for the different life cycle phases of a construction.
- To propose a methodological framework and classification system by integrating TBL based life cycle sustainability parameters and decoupling indices.
2. Building and Construction Sustainability
2.1. Rethinking Sustainability as a System of Well-Being Decoupling and Impact Decoupling
2.2. Current Sustainability Assessment Frameworks in Construction
2.2.1. Critique of Current Sustainability Assessment Frameworks in Construction
- Soc-LCA = f (social assessment parameters, conceptual planning and feasibility study, design and engineering, construction, operation and maintenance, and end-of-life);
- Eco-LCA = f (economic assessment parameters, conceptual planning and feasibility study, design and engineering, construction, operation and maintenance, and end-of-life); and
- Env-LCA = f (environment assessment parameters, conceptual planning and feasibility study, design and engineering, construction, operation and maintenance, and end-of-life)
3. Research Method
3.1. Extraction of Life Cycle Based TBL Sustainability Assessment Parameters
3.2. A Methodological Framework for Calculating TBL Scores and Decoupling Indices for Life Cycle Phases
3.2.1. Identification of Potential Sustainability Parameters/Indicators for Life Cycle Phases of Construction and Weight Determination for Assessment Phases, Categories, and Parameters
3.2.2. Benchmark/Baseline Score Matrix of Sustainability Assessment
3.2.3. Computation of Normalized Performance Score Matrix of Sustainability Assessment
3.2.4. Chain Numbers of Performance Score Matrix of Sustainability Assessment
3.2.5. Computation of Phase Well-Being Decoupling Index and Phase Impact Decoupling Index
3.2.6. Classification System Based on TBL Scores and Decoupling Indices for Different Life Cycle Phases
4. Applicability of Proposed Methodological Framework
- According to the latest report of IPCC (2021) [180], we are already on a trajectory towards a 1.2 degrees Centigrade increase and we must act immediately to meet the 1.5 degrees Centigrade target, highlighting the urgency of this issue. The solutions are clear but the willingness to implement solutions is still lacking. These solutions should focus on long term outcomes and impacts, focusing on inclusive and green economies, prosperity, cleaner air, and better health.
- At present, more than 50% of the population live in cities and this is expected to grow to 70% by 2050. The urban population of India (17.7% of the world’s population) has been rising sharply over the past decades and is projected to reach 9.9 billion by 2050 [181]. Rapid urbanization aimed at economic growth in developing regions of the world (mostly in Africa, Latin America, and Asia) creates unprecedented challenges on environmental and socio-economic fronts. As stated by the GRIHA Council, “as per international commitments, India plans to reduce its energy intensity by 33%–35% by 2030 [182]. Green building design, construction and operation will play a critical role as they are synonymous to both sustainable construction and assured high performance”.
- Further, the GRIHA Council also stated that, “GRIHA—with its commitment towards Intended Nationally Determined Contributions (INDCs) has been instrumental in recent years for good practices and innovative solution for enhancing resource efficiency in the building sector. GRIHA’s large scale adoption will have enormous potential in addressing challenges”. However, like any other assessment tools/schemes, GRIHA, too, has scope for improvement in its assessment framework (as discussed in Section 2.2.1). The endeavor to create large scale impact by proposing a new assessment framework with modifications in the existing assessment framework and mapping projects using well-being and impact decoupling indices (Figure 3) will be instrumental in progressing towards true sense of sustainability.
- The GRIHA rating tool has separate schemes for assessing the sustainability performance of the preconstruction (planning, feasibility, design and engineering) and construction (new construction) phases. Though the assessment parameters are defined from a TBL perspective, the weights allocated to different dimensions are not transparent, and are not based on a clear logical set of parameters.
- In addition, to test the proposed life cycle assessment framework incorporating TBL and decoupling indices (phase well-being and impact well-being), TBL based sustainability scores for at least two phases are required. As GRIHA allows the same projects to be rated against its Pre-certification and New-Construction schemes, providing the TBL based assessment scores for the same project in different life cycle phases. This presents a good opportunity for testing the proposed framework with slight modifications in the assessment scores obtained by the projects in their different life cycle phases.
5. Conclusions
- Construction, especially in the developing world, still operates on take, make, waste (linear/coupled) systems. Life cycle sustainability assessment (LCSA) frameworks that ensure continued economic and social well-being, but with reduced environmental pressures, are missing, i.e., decoupled systems have a clear role to play.
- Comparative analysis of GRIHA (India), LEED-IGBC (India), Green Star (Australia), BCA Green Mark (Singapore), DGNB (Germany), CASBEE (Japan), BREEAM (UK), Green Globes (Canada), BEAM Plus (Hong Kong), and GSAS (Gulf countries) from a TBL perspective shows that most of these assessment tools are biased towards environmental sustainability evaluation and have allocated 69 percent of total credit points, on average. Although most of these assessment tools try to evaluate social sustainability by allocating 25 percent of the total credit points, on average, economic sustainability has been mostly neglected in the sustainability assessment.
- Only the DGNB (Germany) system was observed to have a balance in their approach for allocating credit points across the three dimensions of sustainability. It allocated 30, 30, and 40 percent of total credit points towards evaluating social, economic, and environmental dimensions of sustainability, respectively (Table 1). However, irrespective of initial weights across TBL dimensions, these rating tools provide classification systems based on an aggregate scoring system (except CASBEE) and, therefore, they lack in evaluating interactions among different pillars of sustainability.
- Credit criteria, such as: ethical considerations, a system of environmental–economic accounting, targeted incentives, long term value to the society, design for harmony with nature and the built environment, and design for tackling climate change, are some of the key criteria that are not explicitly included in rating tools/schemes but are found in the literature. For optimized sustainability evaluation, these criteria should be included in the current sustainability rating tools/schemes (Table 2, Table 3 and Table 4).
- DGNB (Germany) is the only rating tool that has a sustainability assessment scheme for rating the decommissioning/deconstruction phase of a building project (pilot mode). Considering the importance of the decommissioning phase in the building life cycle, TBL based sustainability assessment criteria for the decommissioning phase needs to be considered. Green building councils (GBCs) should focus on developing assessment schemes/tools and respective criteria for the decommissioning phase, taking account of the regional context.
- The current study proposes a methodological framework for calculating life cycle based TBL scores and decoupling indices. Two decoupling indices are proposed, i.e., phase well-being decoupling index (PWBDIK) (Equation (6) and phase impact decoupling index (PIDIK) (Equation (7), for supporting TBL-based life cycle assessment. These developed decoupling indices specifically estimate the interdependence of human well-being, economic growth, and environmental pressure associated with construction projects. Construction projects in their different life cycle phases can be mapped using computed PWBDIK and PIDIK by referring to Table 7 and Figure 4 of this study.
- The sustainability assessment criteria from the GRIHA Precertification and GRIHA v.2019 schemes, representing assessment criteria of pre-construction and construction phase, respectively, were used to illustrate the calculations in the proposed LCSA framework. For three hypothetical cases, PWBDIK and PIDIK were computed representing projects moving from the preconstruction phase to the construction phase. It was highlighted that for case-1 and case-3, their GRIHA rating (***) was maintained after sustainability evaluation of the preconstruction and construction phases. It can be seen from Table 8 and Table 9 that the performance of case-2 changed from (****) to (**) when moving from the preconstruction phase to the construction phase. This can be taken to be an example of how the proposed framework can be used to ensure that projects do not lose track when moving from one phase to another.
- The PWBDI value for case-1 indicates that there is a decrease in social well-being with an increase in environmental pressure, and the PIDI value for case-1 indicates that there is an increase in economic well-being that exceeds the increase in environmental pressure. The PWBDI value for case-2 indicates that there is a decrease in social well-being with an increase in environmental pressure and the PIDI value for case-2 indicates that there is a decrease in economic well-being with an increase in environmental pressure. The PWBDI value for case-3 indicates that there is an increase in social well-being that exceeds the increase in environmental pressure and the PIDI value for case-3 indicates that there is a decrease in economic well-being with an increase in environmental pressure (Table 7 and Table 9). However, based on aggregate scores, different scenarios are possible and, moreover, when these projects move from one phase to another phase, they can behave differently, irrespective of their base phase performance, as illustrated by the PWBDI and PIDI for GRIHA cases. For a better understanding of the proposed PWBDI/PIDI approach an illustrative example has been included in Appendix C.
Author Contributions
Funding
Institutional Review Board Statement
Informed Consent Statement
Data Availability Statement
Conflicts of Interest
Appendix A
Methodology for Detailed Division of Credits from TBL Consideration in Different Rating Tools/Schemes
- The classification of the credit points for an individual parameter into social, economic, or environmental dimension was carried out using a subjective judgement based on available literature. This has been explained in Section 2.2.1 and Table 2, Table 3 and Table 4. of the manuscript. The user/technical manuals for each of these mentioned schemes were also referred.
- However, in cases when a parameters/indicator was judged to belong to more than one dimension, the credits assigned to that particular category were divided equally between/among the different dimensions of sustainability the parameter contributes. For example, in the DGNB classification system, under the category of Technical Quality, “Ease of cleaning building components” is one of the assessment parameters. Where the detailed description for this parameter at Criteria “Ease of cleaning building components”|DGNB System (dgnb-system.de), says “The issue of how a building structure can be cleaned has a significant effect on the costs and environmental impact of a building during its use. Surfaces that can be easily cleaned require less cleaning agents and result in lower cleaning costs”. Now, this parameter was qualitatively judged to belong to both—the economic and environmental heads, and therefore the allocated credit (1.66) for this parameter was equally assigned to the economic and environmental heads (i.e., it was taken to be 0.83 and 0.83 for further computations in both these heads).
- In the case of DGNB (Germany), which declares a total of six categories – environment, economic, socio-culture, technical quality, process quality, and site quality. The document also mentions the respective parameters under each of these categories. Now, for the purpose of the present study, whereas the parameters for the first three were adopted as such, the parameters for the latter three were assigned to the former three using qualitative judgement.
- Some of the assessment parameters/indicators under these rating tools/schemes are given as prerequisite. For example, In Part 3—“Resource Stewardship” of Green Mark (Singapore), water efficient fittings are listed as a prerequisite. The schemes expect compliance with respect to these as a minimum, and do not award any points for that in their scoring scheme. This approach has been adopted in the present study also and such parameters have been excluded from award of any credit points under these schemes.
| GRIHA | Maximum Points | Dimension of Sustainability | ||
| Social | Economic | Environment | ||
| Sustainable Site Planning-12% | ||||
| Criterion 1: Green Infrastructure | 5 | 2 + 1 * | 2 | |
| Criterion 2: Low-Impact Design Strategies | 5 | 5 | ||
| Criterion 3: Design to Mitigate UHIE | 2 | 2 | ||
| Construction Management-4% | ||||
| Criterion 4: Air and Soil Pollution Control | 1 | 1 | ||
| Criterion 5: Topsoil Preservation | 1 | 1 | ||
| Criterion 6: Construction Management Practices | 2 | 2 | ||
| Energy Optimization-18% | ||||
| Criterion 7: Energy Optimization | 12 | 12 | ||
| Criterion 8: Renewable Energy Utilization | 5 | 5 | ||
| Criterion 9: Low ODP and GWP Materials | 1 | 1 | ||
| Occupant Comfort-12% | ||||
| Criterion 10: Visual Comfort | 4 | 4 | ||
| Criterion 11: Thermal and Acoustic Comfort | 2 | 2 | ||
| Criterion 12: Indoor Air Quality | 6 | 6 | ||
| Water Management-16% | ||||
| Criterion 13: Water Demand Reduction | 3 | 3 | ||
| Criterion 14: Wastewater Treatment | 3 | 3 | ||
| Criterion 15: Rainwater Management | 5 | 5 | ||
| Criterion 16: Water Quality and Self-sufficiency | 5 | 5 | ||
| Solid Waste Management-6% | ||||
| Waste Management-Post Occupancy | 4 | 4 | ||
| Organic Waste Treatment On-site | 2 | 2 | ||
| Sustainable Building Mateials-12% | ||||
| Criterion 19: Utilization of Alternative Materials in Building | 5 | 5 | ||
| Criterion 20: Reduction in GWP through Life Cycle Assessment | 5 | 5 | ||
| Criterion 21: Alternative Materials for External Site Development | 2 | 2 | ||
| Life Cycle Costing-5% | ||||
| Life Cycle Costing Analysis | 5 | 5 | ||
| Socio-Economic Strategies-8% | ||||
| Criterion 23: Safety and Sanitation for Construction Workers | 1 | 1 | ||
| Criterion 24: Universal Accessibility | 2 | 2 | ||
| Criterion 25: Dedicated Facilities for Service Staff | 2 | 2 | ||
| Criterion 26: Positive Social Impact | 4 | 4 | ||
| Performance Metering and Monitoring-7% | ||||
| Criterion 27: Commissioning for Final Rating | 0 | 0 | ||
| Criterion 28: Smart Metering and Monitoring | 6 | 6 | ||
| Criterion 29: Operation and Maintenance Protocol | 0 | 0 | ||
| Total | 100 | |||
| Innovation | ||||
| Criterion 30: Innovation | 5 | |||
| Grand Total | 100 + 5 = 105 | |||
| Percentile Threshold | Achievable Stars as per GRIHA v. 2019 |
| 25–40 | * |
| 41–55 | ** |
| 56–70 | *** |
| 71–85 | **** |
| 86 and more | ***** |
| IGBC | Maximum Points | Dimension of Sustainability | |||
| Owner-occupied Buildings | Tenant Occupied Buildings | Social | Economic | Environment | |
| Sustainable Architecture and Design | 5 | ||||
| Integrated Design Approach | 1 | 1 | 1 | ||
| Site Preservation | 2 | 2 | 2 | ||
| Passive Architecture | 2 | 2 | 2 | ||
| Site Selection and Planning | 14 | ||||
| Local Building Regulations | Required | Required | |||
| Soil Erosion Control | Required | Required | |||
| Basic Amenities | 1 | 1 | 1 | * | |
| Proximity to Public Transport | 1 | 1 | 1 | ||
| Low-emitting Vehicles | 1 | 1 | 1 | ||
| Natural Topography or Vegetation | 2 | 2 | 2 | ||
| Preservation or Transplantation of Trees | 1 | 1 | 1 | ||
| Heat Island Reduction, Non-roof | 2 | 2 | 2 | ||
| Heat Island Reduction, Roof | 2 | 2 | 2 | ||
| Outdoor Light Pollution Reduction | 1 | 1 | 1 | ||
| Universal Design | 1 | 1 | 1 | ||
| Basic Facilities for Construction Workforce | 1 | 1 | 1 | ||
| Green Building Guidelines | 1 | 1 | 1 | 1 | |
| Water Conservation | 18 | ||||
| Rainwater Harvesting, Roof & Non-roof | Required | Required | |||
| Water Efficient Plumbing Fixtures | Required | Required | |||
| Landscape Design | 2 | 2 | 2 | ||
| Management of Irrigation Systems | 1 | 1 | 1 | ||
| Rainwater Harvesting, Roof & Non-roof | 4 | 4 | 4 | ||
| Water Efficient Plumbing Fixtures | 5 | 5 | 5 | ||
| Wastewater Treatment and Reuse | 5 | 5 | 5 | ||
| Water Metering | 1 | 2 | 1 | ||
| Energy Efficiency | 28 | ||||
| Ozone Depleting Substances | Required | Required | |||
| Minimum Energy Efficiency | Required | Required | |||
| Commissioning Plan for Building Required Equipment & Systems | Required | Required | |||
| Eco-friendly Refrigerants | 1 | 1 | 1 | ||
| Enhanced Energy Efficiency | 15 | 15 | 15 | ||
| On-site Renewable Energy | 6 | 6 | 6 | ||
| Off-site Renewable Energy | 2 | 2 | 2 | ||
| Commissioning, Post-installation of Equipment & Systems | 2 | 2 | 2 | ||
| Energy Metering and Management | 2 | 2 | 2 | ||
| Building Materials and Resources | 16 | ||||
| Segregation of Waste, Post-occupancy | Required | Required | |||
| Sustainable Building Materials | 8 | 8(1 + 2 + 2 + 2 + 2) | * | ||
| Organic Waste Management, Post-occupancy | 2 | 2 | 2 | ||
| Handling of Waste Materials, During Construction | 1 | 1 | 1 | ||
| Use of Certified Green Building Materials, Products & Equipment | 5 | 5 | 5 | ||
| Indoor Environmental Quality | 12 | ||||
| Minimum Fresh Air Ventilation | Required | Required | |||
| Tobacco Smoke Control | Required | Required | |||
| CO2 Monitoring | 1 | 1 | 1 | ||
| Daylighting | 2 | 2 | 2 | ||
| Outdoor Views | 1 | 1 | 1 | ||
| Minimize Indoor and Outdoor Pollutants | 1 | 1 | 1 | ||
| Low-emitting materials | 3 | 3 | 3 | ||
| Occupant Well-being Facilities | 1 | ||||
| Indoor Air Quality Testing, After Construction and Before Occupancy | 2 | 2 | 2 | ||
| Indoor Air Quality Management, During Construction | 1 | 1 | 1 | ||
| Innovation and Development | 7 | ||||
| Innovation in Design Process | 4 | 4 | |||
| Optimization in Structural Design | 1 | 1 | 1 | ||
| Waste Water Reuse, During Construction | 1 | 1 | 1 | ||
| IGBC Accredited Professional | 1 | 1 | 1 | ||
| Total | 100 | ||||
| Certification Level | Owner-Occupied Buildings | Tenant-Occupied Buildings | Recognition |
| Certified | 40–49 | 40–49 | Best Practices |
| Silver | 50–59 | 50–59 | Outstanding Performance |
| Gold | 60–74 | 60–74 | National Excellence |
| Platinum | 75–100 | 75–100 | Global Leadership |
| Green Star | Maximum Points | Dimension of Sustainability | ||
| Owner-Occupied Buildings | Social | Economic | Environment | |
| MANAGEMENT | 14 | |||
| Green Star Accredited Professional | 1 | 1 | ||
| Commissioning and Tuning | 4 | 4 | ||
| Adaptation and Resilience | 2 | 2 | ||
| Building Information | 1 | 1 | ||
| Commitment to Performance | 2 | 2 | ||
| Metering and Monitoring | 1 | 1 | ||
| Responsible Construction Practices | 2 | 1 | 1 | |
| Operational Waste | 1 | 1 | ||
| INDOOR ENVIRONMENT QUALITY | 17 | |||
| Indoor Air Quality | 4 | 4 | ||
| Acoustic Comfort | 3 | 3 | ||
| Lighting Comfort | 3 | 3 | ||
| Visual Comfort | 3 | 3 | ||
| Thermal Comfort | 2 | 2 | ||
| Access to Fresh Food | 2 | 2 | ||
| ENERGY | 22 | |||
| Greenhouse Gas Emissions | 20 | 20 | ||
| Peak Electricity Demand Reduction | 2 | 2 | ||
| TRANSPORT | 10 | |||
| Sustainable Transport | 10 | 5 | 5 | |
| WATER | 12 | |||
| Potable Water | 12 | 12 | ||
| MATERIALS | 14 | |||
| Life Cycle Impacts | 7 | 7 | ||
| Responsible Building Materials | 3 | 3 | ||
| Sustainable Product | 3 | 3 | ||
| Construction and Demolition Waste | 1 | 1 | ||
| LAND USE & ECOLOGY | 6 | |||
| Ecological Value | 3 | 3 | ||
| Sustainable Sites | 2 | 2 | ||
| Heat Island Effect | 1 | 1 | ||
| EMISSIONS | 5 | |||
| Stormwater | 2 | 2 | ||
| Light Pollution | 1 | 1 | ||
| Microbial Control | 1 | 1 | ||
| Refrigerant Impacts | 1 | 1 | ||
| Total | 100 | |||
| INNOVATION | 10 | |||
| Innovation | 10 | 5 | 5 | |
| Grand Total | 110 | |||
| Percentage of Available Points | Rating | Outcome |
| <10 | No * | Assessed |
| 10–19 | * | Minimum practice |
| 20–29 | ** | Average practice |
| 30–44 | *** | Good practice |
| 45–59 | **** | Australian best practice |
| 60–74 | ***** | Australian excellence |
| 75+ | ****** | World leadership |
| Green Mark | Maximum Points | Dimension of Sustainability | ||
| Social | Economic | Environment | ||
| Elective Requirements | ||||
| Part 1-Climate Responsive Design | ||||
| Climate Responsive Design | Prerequisite | |||
| Envelope and Roof Thermal Transfer | Prerequisite | |||
| Air Tightness and Leakage | Prerequisite | |||
| Bicycle Parking | Prerequisite | |||
| 1.1 Leadership | 10 | |||
| 1.1a Climatic & Contextually Responsive Brief | 1 | 1 | ||
| 1.1b Integrative Design Process (*4D, 5D & 6D BIM (Advanced Green Efforts)) | 4(*3) | *1 | *1 | *2 |
| 1.1c Environmental Credentials of Project Team | 2 | 2 | ||
| 1.1d User Engagement | 3 | 3 | ||
| 1.2 Urban Harmony | 10 points | |||
| 1.2a Sustainable Urbanism | Up to 5 points | |||
| (i) Environmental Analysis (* Creation of possible new ecology and natural ecosystems (Advanced Green Efforts)) | 2(*1) | 2(*1) | ||
| (ii) Response to Site Context | 3 | 1 | 1 | 1 |
| (iii) Urban Heat Island (UHI) Mitigation | 1 | 1 | ||
| (iv) Green Transport | 1.5 | 1.5 | ||
| 1.2b Integrated Landscape and Waterscape | Up to 5 points | |||
| Green Plot (i) Ratio (GnPR) (*GnPR ≥ 5.0 (Advanced Green Efforts)) | 3(*1) | 3(*1) | ||
| (ii) Tree Conservation | 1 | 1 | ||
| (iii) Sustainable Landscape Management | 1.5 | 1.5 | ||
| (iv) Sustainable Storm Water Management | 1 | 1 | ||
| 1.3 Tropical | 10 points | |||
| 1.3a Tropical Façade Performance Low heat gain façade (Advanced Green Efforts) Greenery on the East and West Façade (Advanced Green Efforts) Thermal Bridging (Advanced Green Efforts) | 3(*1, 1,1) | 3(*1, 1,1) | ||
| 1.3b Internal Spatial Organisation | 3 | 3 | ||
| 1.3c Ventilation Performance (*Wind Driven Rain Simulation (Advanced Green Efforts)) | 4(*1) | 4(*1) | ||
| Part 2-Building Energy Performance | 22 points | |||
| Air Conditioning Total System and Component Efficiency | Prerequisite | |||
| Lighting Efficiency and Controls | Prerequisite | |||
| Vertical Transportation Efficiency | Prerequisite | |||
| 2.1 Energy Efficiency | ||||
| Option 1: Energy Performance Points Calculator | ||||
| 2.1a Air Conditioning Total System Efficiency | 5 | 5 | ||
| 2.1b Lighting System Efficiency | 3 | 3 | ||
| 2.1c Carpark System Efficiency | 2 | 2 | ||
| 2.1d Receptacle Efficiency | 1 | 1 | ||
| 2.1e Building Energy (*Further Improvement in Design Energy Consumption (Advanced Green Efforts) | 11(*2) | 11(*2) | ||
| Option 2: Performance-Based Computation | ||||
| 2.1f Space Conditioning Performance (*Efficient space conditioning energy design (Advanced Green Efforts)) | 10(*1) | 10(*1) | ||
| 2.1g Lighting Performance (*Efficient lighting design (Advanced Green Efforts)) | 6(*1) | 6(*1) | ||
| 2.1h Building System Performance (*Additional Energy-Efficient Practices and Features (Advanced Green Efforts)) | 6(*2) | 6(*2) | ||
| 2.2 Renewable Energy | 8 points | |||
| 2.2a Solar Energy Feasibility Study | 0.5 | 0.5 | ||
| 2.2b Solar Ready Roof | 1.5 | 1.5 | ||
| 2.2c Adoption of Renewable Energy (*Further Electricity Replacement by Renewables (Advanced Green Efforts)) | 6(*5) | 6(*5) | ||
| Part 3-Resource Stewardship | ||||
| Water Efficient Fittings | Prerequisite | |||
| 3.1 Water | 8 points | |||
| 3.1a Water Efficient Systems | 3 | 3 | ||
| (i) Landscape irrigation | 1 | 1 | ||
| (ii) Water Consumption of Cooling Towers (*Better Water Efficient Fittings (Advanced Green Efforts) | 2 | 2 | ||
| 3.1b Water Monitoring | 2 | 2 | ||
| (i) Water Monitoring and Leak Detection | 1 | 1 | ||
| (ii) Water Usage Portal and Dashboard | 1 | 1 | ||
| 3.1c Alternative Water Sources | 3 | 3 | ||
| 3.2 Materials | 18 points | |||
| 3.2a Sustainable Construction | 8 | 8 | ||
| (i) Conservation and Resource Recovery | 1 | 1 | ||
| (ii) Resource Efficient Building Design (* Use of BIM to calculate CUI (Advanced Green Efforts)) | 4(*1) | 4(*1) | ||
| (iii) Low Carbon Concrete (*Use of Advanced Green Materials (Advanced Green Efforts)) | 3(*1) | 3(*1) | ||
| 3.2b Embodied Carbon (*Provide Own Emission Factors with Source Justification (Advanced Green Efforts), Compute the Carbon Footprint of the Entire Development (Advanced Green Efforts)) | 2(*1,1) | 2(*1,1) | ||
| 3.2c Sustainable Products | 8 points | |||
| (i) Functional System | 8 | 8 | ||
| (ii) Singular Sustainable Products outside of Functional Systems (*Sustainable Products with Higher Environmental Credentials (Advanced Green Efforts)) | 2(*2) | 2(*2) | ||
| 3.3 Waste | 4 points | |||
| 3.3a Environmental Construction Management Plan | 1 | 1 | ||
| 3.3b Operational Waste Management | 3 | 3 | ||
| Part 4-Smart & Healthy Building | ||||
| Thermal Comfort | Prerequisite | |||
| Minimum Ventilation Rate | Prerequisite | |||
| Filtration Media for Times of Pollution | Prerequisite | |||
| Low Volatile Organic Compound (VOC) Paints | Prerequisite | |||
| Refrigerants | Prerequisite | |||
| Sound Level | Prerequisite | |||
| Permanent Instrumentation for the Measurement and Verification of Chilled Water Air-Conditioning Systems | ||||
| Electrical Sub-Metering & Monitoring | Prerequisite | |||
| 4.1 Indoor Air Quality | 10 points | |||
| 4.1a Occupant Comfort | 2 | 2 | ||
| (i) Indoor Air Quality (IAQ) Surveillance Audit | 1 | 1 | ||
| (ii) Post Occupancy Evaluation | 0.5 | 0.5 | ||
| (iii) Indoor Air Quality Display (* Indoor Air Quality Trending (Advanced Green Efforts) | 0.5 | 0.5 | ||
| 4.1b Outdoor Air | 3 points | 3 points | ||
| (i) Ventilation Rates | 1.5 | 1.5 | ||
| (ii) Enhanced Filtration Media | 1 | 1 | ||
| (iii) Dedicated Outdoor Air System | 0.5 | 0.5 | ||
| 4.1c Indoor Contaminants | 5 points | 5 points | ||
| (i) Local Exhaust and Air Purging System | 2 | 2 | ||
| (ii) Ultraviolet Germicidal Irradiation (UVGI) System | 0.5 | 0.5 | ||
| (iii) More Stringent VOC Limits for Interior Fittings and Finishes | 2 | 2 | ||
| (iv)Use of Persistent Bio-cumulative and Toxic (PBT) free lighting (*Zero ODP Refrigerants with Low Global Warming Potential (Advanced Green Efforts)) | 0.5(*1) | 0.5(*1) | ||
| 4.2 Spatial Quality | 10 points | 10 points | ||
| 4.2a Lighting | Up to 6 points | Up to 6 points | ||
| (i) Effective daylighting for common areas | 2 | 2 | ||
| (ii) Effective daylighting for occupied spaces | 4 | 4 | ||
| (iii) Quality of Artificial Lighting | 1 | 1 | ||
| 4.2b Acoustics | 2 | 2 | ||
| (i) Sound Transmission Reduction | 0.5 | 0.5 | ||
| (ii)Acoustic Report | 1.5 | 1.5 | ||
| 4.2c Wellbeing | Up to 2 points | Up to 2 points | ||
| (i) Biophilic Design | 3 | 3 | ||
| (ii) Universal Design (UD) Mark | 1 | 1 | ||
| 4.3 Smart Building Operations | 10 points | |||
| 4.3a Energy Monitoring | 3 | 3 | ||
| (i) Energy Portal and Dashboard | 2 | 2 | ||
| (ii) BAS and Controllers with Open Protocol (* Permanent M&V for VRF Systems (Advanced Green Effort), Permanent M&V for Hot Water systems (Advanced Green Efforts)) | 1(*2,1) | 1(*2,1) | ||
| 4.3b Demand Control | 3 | 3 | ||
| (i) ACMV Demand Control | 2 | 2 | ||
| (ii) Lighting Demand Control | 1 | 1 | ||
| (iii) Carpark Guidance System | 0.5 | 0.5 | ||
| 4.3c Integration and Analytics | 3 | |||
| (i) Basic Integration and Analytics | 0.5/feature | 0.5/feature | ||
| (ii) Advanced Integration and Analytics (* Additional Advanced Integration and Analytical Features (Advanced Green Effort)) | 1/feature (*1) | 1/feature (*1) | ||
| 4.3d System Handover and Documentation | 1 | 1 | ||
| Expanded Post Occupancy Performance Verification by a 3rd Party (Advanced Green Effort) | 2 | 2 | ||
| Energy Performance Contracting (Advanced Green Effort) | 1 | 1 | ||
| Part 5-Advanced Green Efforts | 20 points | |||
| 5.1 Enhanced Performance | Up to 15 points | 15 | ||
| 5.2 Complementary Certifications | 1 | 1 | ||
| 5.3 Demonstrating Cost Effective Design | 1 | 1 | ||
| 5.4 Social Benefits | 2 | 2 | ||
| Annexes for specialized buildings | 10 to 15 points | |||
| Annex 1: Energy Efficiency Features for Specialised Building [Hawker Centres] | 15 | 15 | ||
| Annex 2: Energy Efficiency Features for Specialised Building Healthcare Facilities] | 10 | 10 | ||
| Annex 3: Energy Efficiency Features for Specialised Building [Laboratories] | 10 | 10 | ||
| Annex 4: Energy Efficiency Features for Specialised Building [Schools] | 10 | 10 | ||
| Total | 150–155 | |||
| Green Mark Rating | Green Mark Score (Percentage Point Scored) |
| Green Mark Platinum | 70 and above |
| Green Mark Gold PLUS | 60 to <70 |
| Green Mark Gold | >50 to <60 |
| Green Mark Certified | Compliance with all pre-requisite requirement |
| DGNB | Maximum Points | Dimension of Sustainability | ||
| Social | Economic | Environment | ||
| Environmental Quality | 22.50% | |||
| Building life cycle assessment | 9.5 | |||
| Local environmental impact | 4.7 | |||
| sustainable resource extraction | 2.4 | |||
| Potable water demand and wastewater volume | 2.4 | |||
| Land use | 2.4 | |||
| Bio-diversity at site | 1.2 | |||
| Economic Quality | 22.50% | |||
| Life cycle costing | 10 | |||
| Flexibility and adaptability | 7.5 | |||
| Commercial viability | 5.0 | |||
| Socio-Cultural and functional quality | 22.50% | |||
| Thermal comfort | 4.1 | |||
| Indoor air quality | 5.1 | |||
| Acoustic comfort | 2.0 | |||
| Visual comfort | 3.1 | |||
| User control | 2.0 | |||
| Quality of indoor and outdoor spaces | 2.0 | |||
| Safety and security | 1.0 | |||
| Design for all | 3.1 | |||
| Technical Quality | 15% | |||
| Sound insulation | 1.15 | |||
| Quality of the building envelope | 2.96 | |||
| Use and integration of building technology | 1.23 | 1.23 | ||
| Ease of cleaning building components | 0.83 | 0.83 | ||
| Ease of recovery and recycling | 1.63 | 1.63 | ||
| Emissions control | 0.71 | 0.71 | ||
| Mobility infrastructure | 0.82 | 0.82 | 0.82 | |
| Process Quality | 12.50% | |||
| Comprehensive project brief | 1.6 | |||
| Sustainability aspects in the tender phase | 1.6 | |||
| Documentation for sustainable management | 1.1 | |||
| Procedure for urban and design planning | 0.8 | 0.8 | ||
| Construction site/construction process | 0.8 | 0.8 | ||
| Quality assurance of the construction | 0.53 | 0.53 | 0.53 | |
| Systematic commissioning | 1.6 | |||
| User communication | 0.55 | 0.55 | ||
| FM-compliant planning | 0.5 | |||
| Site Quality | 5% | |||
| Local environment | 0.55 | 0.55 | ||
| Influence on the district | 1.1 | |||
| Transport access | 0.36 | 0.36 | 0.36 | |
| Access to amenities | 0.85 | 0.85 | ||
| Total | 100% | |||
| Certification | Percentage Points |
| DGNB Platinum | 65–80 |
| DGNB Gold | 50–65 |
| DGNB Silver | 35–50 |
| DGNB Bronze | >35 |
| CASBEE | Maximum Points | Dimension of Sustainability | ||
| Social | Economic | Environment | ||
| Water Efficiency | 15 | |||
| Water leakage Detection | 3.6 | 3.6 | ||
| Water use during construction | 1.8 | 1.8 | ||
| Waste water management | 7.2 | 7.2 | ||
| Sanitary used pipe | 2.4 | 2.4 | ||
| Materials Resources | 10 | |||
| Regionally procured materials | 1.5 | 0.75 | 0.75 | |
| Materials fabricated on site | 0.5 | 0.5 | ||
| Use of readily renewable materials | 1.5 | 1.5 | ||
| Use of salvaged material | 1.5 | 0.75 | 0.75 | |
| Use of recycled material | 2 | 1.0 | 1.0 | |
| Use of lightweight materials | 0.5 | 0.5 | ||
| Use of higher durability materials | 0.5 | 0.5 | ||
| Use of prefabricated elements | 1.5 | 0.75 | 0.75 | |
| Life cycle cost analysis of materials in the project | 0.5 | 0.5 | ||
| Indoor Environmental Quality | 10 | 10 | ||
| Sustainable Site, Accessibility and Ecology | 15 | 7.5 | 7.5 | |
| Desert Area Development | 1.5 | 1.5 | ||
| Informal Area Development | 1.5 | 1.5 | ||
| Brownfield site development | 1.5 | 1.5 | ||
| Compatibility with the national development plan | 1.5 | |||
| Transport infrastructure connection | 1.5 | 1.5 | ||
| Catering for remote site | 1.5 | 1.5 | ||
| Alternative methods of transport | 1.5 | 1.5 | ||
| Protection of habitat | 1.5 | 1.5 | ||
| Energy Efficiency | 25 | |||
| Passive External Heat Gain Loss | 7.5 | 7.5 | ||
| Reduction | 3.5 | 3.5 | ||
| Energy Efficient Appliances | 1.5 | 1.5 | ||
| Vertical Transportation Systems | 1.5 | 1.5 | ||
| Peak Load Reductions | 3 | 1.5 | 1.5 | |
| Renewable Energy Sources | 5 | 5 | ||
| Environmental Impact | 2 | 2 | ||
| Energy and Carbon Inventories | 1 | 1 | ||
| Management | 10 | |||
| Providing Containers for site materials waste | 1 | 1 | ||
| Control of emissions and pollutants | 1 | 1 | ||
| Waste recycling workers on site | 0.5 | 0.5 | ||
| Providing Identified and separated storage areas | 1 | 1 | ||
| Project Waste Management Plan | 0.5 | 0.5 | ||
| Engaging a company specialized in recycling | 1 | 1 | ||
| Protecting water sources from pollution | 1 | 1 | ||
| Waste from mixing equipment | 1 | 1 | ||
| Total | 85 | |||
| Ranks | Valuation | BEE Value | Indication |  |
| S | Excellent | BEE = 3.0 or more and Q = 50 or more | ***** | |
| A | Very Good | BEE = 1.5–3.0 BEE = 3.0 or more and Q is less than 50 | **** | |
| B+ | Good | BEE = 1.0–1.5 | *** | |
| B− | Fairly Poor | BEE = 0.5–1.5 | ** | |
| C | Poor | BEE is less than 0.5 | * |
| BREEAM | Maximum Points | Dimension of Sustainability | ||
| Social | Economic | Environment | ||
| Management | 20 | |||
| Project brief and design | (2 + 2) | 4 | ||
| Life cycle cost and service life planning | (2 + 1 + 1) | 4 | ||
| Responsible construction practices | (1 + 1 + 2 + 2) | 3 | 3 | |
| Commissioning and handover | (1 + 1 + 1 + 1) | * | 4 | |
| Aftercare | (1 + 1 + 1) | 2 | 1 * | |
| Health and wellbeing | 22 | |||
| Visual comfort | 6 | 6 | ||
| Indoor air quality | 5 | 5 | ||
| Safe containment in laboratories | 2 | 1 | 1 | |
| Thermal comfort | 3 | 3 | ||
| Acoustic performance | 4 | 4 | ||
| Accessibility | 2 | 2 | ||
| Hazards | 1 | 0.5 | 0.5 | |
| Private space | 1 | 1 | ||
| Water quality | 1 | 1 | * | |
| Energy | 35 | |||
| Reduction of energy use and carbon emissions | 15 | 15 | ||
| Energy monitoring | 2 | 2 | ||
| External lighting | 1 | 1 | ||
| Low carbon design | 3 | 3 | ||
| Energy-efficient cold storage | 3 | 3 | ||
| Energy-efficient transport systems | 3 | 3 | ||
| Energy-efficient laboratory systems | 5 | 5 | ||
| Energy-efficient equipment | 2 | 2 | ||
| Drying space | 1 | 1 | ||
| Transport | 13 | |||
| Public transport accessibility | 5 | 1.67 | 1.67 | 1.67 |
| Proximity to amenities | 2 | 0.67 | 0.67 | 0.67 |
| Alternative modes of transport | 2 | 2 | ||
| Maximum car parking capacity | 2 | 2 | ||
| Travel plan | 1 | 0.33 | 0.33 | 0.33 |
| Home office | 1 | 0.33 | 0.33 | 0.33 |
| Water | 10 | |||
| Water consumption | 5 | * | 5 | |
| Water monitoring | 1 | * | 1 | |
| Water leak detection | 3 | * | 3 | |
| Water-efficient equipment | 1 | * | 1 | |
| Materials | 12 | |||
| Life cycle impacts | 6 | 6 | ||
| Hard landscaping and boundary protection | N/A | |||
| Responsible sourcing of materials | 4 | * | * | 4 |
| Insulation | N/A | |||
| Designing for durability and resilience | 1 | * | 0.5 | 0.5 |
| Material efficiency | 1 | 0.5 | 0.5 | |
| Waste | 10 | |||
| Construction waste management | 3 | 1.5 | 1.5 | |
| Recycled aggregates | 1 | * | 1 | |
| Operational waste | 2 | * | 2 | |
| Speculative floor and ceiling finishes | 1 | * | * | 1 |
| Adaptation to climate change | 1 | 0.33 | 0.33 | 0.33 |
| Functional adaptability | 1 | 0.5 | 0.5 | |
| Land Use and Ecology | 10 | |||
| Site selection | 3 | 3 | ||
| The ecological value of site and protection of ecological features | 2 | 2 | ||
| Minimizing impact on existing site ecology | N/A | |||
| Enhancing site ecology | 3 | 3 | ||
| Long term impact on biodiversity | 2 | 2 | ||
| Pollution | 13 | |||
| Impact of refrigerants | 4 | 4 | ||
| NOx emissions | 2 | * | 2 | |
| Surface water run-off | 5 | 5 | ||
| Reduction of night time light pollution | 1 | 1 | ||
| Reduction of noise pollution | 1 | 1 | ||
| Innovation | 10 | |||
| Innovation | ||||
| Total | 155 | |||
| BREEAM Rating | Percentage Score |
| Outstanding | ≥85 |
| Excellent | ≥70 |
| Very good | ≥55 |
| Good | ≥45 |
| Pass | ≥30 |
| Unclassified | <30 |
| Green Globes | Maximum Points | Dimension of Sustainability | ||
| Social | Economic | Environment | ||
| Project Management | 50 | |||
| Integrated Design Process (IDP) | 9 | 9 | ||
| Environmental Management During Construction | 12 | 12 | ||
| Commissioning | 29 | 29 | ||
| Site | 115 | |||
| Development Area | 30 | 30 | ||
| Ecological Impacts | 32 | 32 | ||
| Stormwater Management | 18 | 18 | ||
| Landscaping | 28 | 28 | ||
| Exterior Light Pollution | 7 | 7 | ||
| Energy | 390 | |||
| Energy Performance | 100 | 100 | ||
| Energy Demand | 35 | * | 35 | |
| Metering, Measurement, and Verification | 12 | * | 12 | |
| Building Opaque Envelope | 31 | 31 | ||
| Lighting | 36 | 36 | ||
| HVAC Systems and Controls | 59 | 59 | ||
| Other HVAC Systems and Controls | 32 | 32 | ||
| Other Energy Efficient Equipment and Measures | 11 | * | ||
| Renewable Energy | 50 | |||
| Energy Efficient Transportation | 24 | 12 | 12 | |
| Water | 110 | |||
| Water Consumption | 42 | 42 | ||
| Cooling Towers | 9 | 9 | ||
| Boilers and Water Heaters | 4 | 4 | ||
| Water Intensive Applications | 18 | 18 | ||
| Water Treatment | 3 | 3 | ||
| Alternate Sources of Water | 5 | 5 | ||
| Metering | 11 | * | 11 | |
| Irrigation | 18 | 18 | ||
| Materials and Resources | 125 | |||
| Building Assembly (core and shell including envelope) | 33 | 33 | ||
| Interior Fit-outs (Including Finishes and Furnishings) | 16 | 16 | ||
| Re-use of Existing Structures | 26 | * | 26 | |
| Waste | 9 | 9 | ||
| Building Service Life Plan | 7 | 7 | ||
| Resource Conservation | 6 | 6 | ||
| Envelope—Roofing/Openings | 10 | 10 | ||
| Envelope—Foundation, Waterproofing | 6 | 6 | ||
| Envelope—Cladding | 5 | 5 | ||
| Envelope—Barriers | 7 | 7 | ||
| Emissions | 50 | |||
| Heating | 18 | 18 | ||
| Cooling | 29 | 29 | ||
| Janitorial Equipment | 3 | 3 | ||
| Indoor Environment | 160 | |||
| Ventilation | 37 | 37 | ||
| Source Control and Measurement of Indoor Pollutants | 46 | 46 | ||
| Lighting Design and Systems | 30 | 30 | ||
| Thermal Comfort | 18 | 18 | ||
| Acoustic Comfort | 29 | 29 | ||
| Total | 1000 | |||
| Green Globes Percentage Score | Green Globes Rating | Description |
| 85–100% | 4 Globes | Demonstrates national leadership and excellence in the practice of energy, water, and environmental efficiency to reduce environmental impacts. |
| 70–84% | 3 Globes | Demonstrates leadership in applying best practices regarding energy, water, and environmental efficiency. |
| 55–69% | 2 Globes | Demonstrates excellent progress in the reduction of environmental impacts and use of environmental efficiency practices. |
| 35–54% | 1 Globes | Demonstrates a commitment to environmental efficiency practices. |
| 85–100% | 4 Globes | Demonstrates national leadership and excellence in the practice of energy, water, and environmental efficiency to reduce environmental impacts. |
| 70–84% | 3 Globes | Demonstrates leadership in applying best practices regarding energy, water, and environmental efficiency. |
| GBI | Maximum Points | Dimension of Sustainability | ||
| ENERGY EFFICIENCY | 38 | Social | Economic | Environment |
| Design & Performance | ||||
| Minimum EE Performance | 2 | 2 | ||
| Lighting Zoning | 3 | 3 | ||
| Electrical Sub-metering | 2 | 2 | ||
| Renewable Energy | 5 | 5 | ||
| Advanced or Improved EE Performance—BEI | 15 | 15 | ||
| Commissioning | ||||
| Enhanced or Re-commissioning | 4 | 4 | ||
| On-going Post Occupancy Commissioning | 2 | 2 | ||
| Monitoring, Improvement & Maintenance | ||||
| EE Monitoring & Improvement | 2 | 2 | ||
| Sustainable Maintenance | 3 | 2 | 1 | |
| INDOOR ENVIRONMENTAL QUALITY | 21 | |||
| Air Quality | ||||
| Minimum IAQ Performance | 1 | 1 | ||
| Environmental Tobacco Smoke (ETS) Control | 1 | 1 | ||
| Carbon Dioxide Monitoring and Control | 1 | 1 | ||
| Indoor Air Pollutants | 2 | 2 | ||
| Mould Prevention | 1 | 1 | ||
| Thermal Comfort | ||||
| Thermal Comfort: Controllability of Systems | 2 | 2 | ||
| Air Change Effectiveness | 1 | 1 | ||
| Lighting, Visual & Acoustic Comfort | ||||
| Daylighting | 2 | 2 | ||
| Daylight Glare Control | 1 | 1 | ||
| Electric Lighting Levels | 1 | 1 | ||
| High-Frequency Ballasts | 1 | 1 | ||
| External Views | 2 | 2 | ||
| Internal Noise Levels | 1 | 1 | ||
| Verification | ||||
| IAQ Before/During Occupancy | 2 | 2 | ||
| Occupancy Comfort Survey: Verification | 2 | 2 | ||
| SUSTAINABLE SITE PLANNING & MANAGEMENT | 10 | |||
| Facility Management | ||||
| GBI Rated Design & Construction | 1 | 1 | ||
| Building Exterior Management | 1 | 1 | ||
| Integrated Pest Management, Erosion Control & Landscape Management | 1 | 1 | ||
| Transportation | ||||
| Green Vehicle Priority | 1 | 1 | ||
| Parking Capacity | 1 | 1 | ||
| Reduce Heat Island Effect | ||||
| Greenery & Roof | 4 | 4 | ||
| Building User Manual | 1 | 1 | ||
| MATERIALS & RESOURCES | 9 | |||
| Reused & Recycled Materials | ||||
| Material Reuse and Selection | 1 | 1 | ||
| Recycle Content Materials | 1 | 1 | ||
| Sustainable Materials & Resources and Policy | ||||
| Sustainable Timber | 1 | 1 | ||
| Sustainable Purchasing Policy | 1 | 1 | ||
| Waste Management | ||||
| Storage, Collection & Disposal of recyclables | 3 | 3 | ||
| Green Products | ||||
| Refrigerants & Clean Agents | 2 | 2 | ||
| WATER EFFICIENCY | 12 | |||
| Water Harvesting & Recycling | ||||
| Rainwater Harvesting | 3 | 3 | ||
| Water Recycling | 2 | 2 | ||
| Increased Efficiency | ||||
| Water Efficient—Irrigation/Landscaping | 2 | 2 | ||
| Water Efficient Fittings | 3 | 3 | ||
| Metering & Leak Detection System | 2 | 2 | ||
| INNOVATION | 10 | |||
| Innovation & Environmental Initiatives | 9 | 9 | ||
| Green Building Index Facilitator | 1 | 1 | ||
| Points | GBI Rating |
| 86–100 | Platinum |
| 76–85 | Gold |
| 66–75 | Silver |
| 50–65 | Certified |
| GSAS | Maximum Points | Dimension of Sustainability | ||
| Urban Connectivity | 0.180 | Social | Economic | Environment |
| Proximity to infrastructure | ||||
| Proximity to amenities | ||||
| Load on local traffic conditions | ||||
| Public transportation | ||||
| Green transportation | ||||
| Neighbourhood acoustics | ||||
| Site | 0.510 | |||
| Land preservation | ||||
| Waterbody preservation | ||||
| Biodiversity preservation | ||||
| Vegetation | ||||
| Drain and stormwater contamination | ||||
| Rainwater runoff | ||||
| Heat island effect | ||||
| Shading | ||||
| Accessibility | ||||
| External lighting | ||||
| Light pollution | ||||
| Noise pollution | ||||
| Eco-Parking | ||||
| Mixed use | ||||
| Construction practices | ||||
| Energy | 0.720 | |||
| Thermal energy demand performance | ||||
| Energy use performance | ||||
| Primary energy performance | ||||
| CO2 emissions | ||||
| Energy sub-metering | * | |||
| Water | 0.480 | |||
| Water demand performance | ||||
| Water reuse performance | ||||
| Water sub-metering | ||||
| Materials | 0.270 | |||
| Locally sourced material | * | |||
| Material eco-labelling | * | |||
| Recycled content of materials | * | |||
| Material reuse | * | |||
| Existing structure reuse | * | |||
| Design for disassembly | * | |||
| Responsible sourcing of material | * | |||
| Indoor Environment | 0.570 | |||
| Thermal comfort | ||||
| Natural ventilation | ||||
| Mechanical ventilation | ||||
| Lighting | ||||
| Daylight | ||||
| Glare | ||||
| Views | ||||
| Acoustics | ||||
| Low VOC-materials | ||||
| Airborne contaminants | ||||
| Cultural & Economic Value | 0.120 | |||
| Heritage and cultural identity | ||||
| Support of national economy | ||||
| Management and Operations | 0.150 | |||
| Systems commissioning | ||||
| Waste management | ||||
| Facility management | ||||
| Leak detection systems | ||||
| Automated control systems | ||||
| Transportation systems in building | ||||
| Total | 3.0 | |||
| * Category weight is divided equally among the category parameters. For example, the Site category points are 0.510 and there are 15 category parameters hence score assumed for each parameter is 0.510/15 i.e., 0.034. | ||||
| Score | Rating |
| X < 0 | Certification denied |
| 0.00 ≤ X ≤ 0.50 | * |
| 0.50 < X ≤ 1.00 | ** |
| 1.00 < X ≤ 1.50 | *** |
| 1.50 < X ≤ 2.00 | **** |
| 2.00 < X ≤ 2.50 | ***** |
| 2.50 < X ≤ 3.0 | ****** |
Appendix B

| Social Sustainability Parameters (Phase 1. Conceptual Planning and Feasibility Study) | |
| Parameters | Further Explanation |
| Stakeholders’ consultation and engagement |
|
| Health and safety considerations |
|
| Ethical considerations |
|
| Social Sustainability Parameters (Phase 2. Design and Engineering) | |
| Parameters | Further Explanation |
| Health, wellbeing, and the environment |
|
| Social Sustainability Parameters (Phase 3. Construction) | |
| Parameters | Further Explanation |
| Socio-economic strategies for workers |
|
| Social Sustainability Parameters (Phase 4. Operation and Maintenance) | |
| Parameters | Further Explanation |
| Prioritizing occupant’s comfort |
|
| Social Sustainability Parameters (Phase 5. End-of-life) | |
| Parameters | Further Explanation |
| Effective project communication |
|
| Security |
|
| Economic Sustainability Parameters (Phase 5. End-of-Life) | |
|---|---|
| Parameters | Further Explanation |
| Values of expandable resources |
|
| Separation, recycling, and disposal |
|
Appendix C
| Description | Sustainability Dimension | ||
| Social | Economic | Environment | |
| Maximum credits | 24 | 5 | 71 |
| Assumed performance score-PROJECT 1 | 14 | 1 | 65 |
| Assumed performance score-PROJECT 2 | 9 | 3 | 68 |
| Description | Sustainability Dimension | ||
| Social | Economic | Environment | |
| Max. Credits | 24 | 5 | 71 |
| Assumed performance score-PROJECT 1 | 14 | 1 | 65 |
| Assumed performance score-PROJECT 2 | 9 | 3 | 68 |
| Normalized performance score-PROJECT 1 | 0.58 | 0.20 | 0.91; environment non-conformance = 1 − 0.91 = 0.09 |
| Normalized performance score-PROJECT 1 | 0.37 | 0.6 | 0.96; environment non-conformance = 1 − 0.96 = 0.04 |
| Base phase chain number-PROJECT 1 | 1 | 1 | 1 |
| Base phase chain-PROJECT 1 | 1 | 1 | 1 |
| Description | Sustainability Dimension | ||
| Social | Economic | Environment | |
| Max. Credits | 24 | 5 | 71 |
| Assumed performance score-PROJECT 1 | 17 | 2 | 61 |
| Assumed performance score-PROJECT 2 | 11 | 2 | 67 |
| Normalized performance score-PROJECT 1 | 0.71 | 0.4 | 0.86; environment non-conformance = 1 − 0.86 = 0.14 |
| Normalized performance score-PROJECT 2 | 0.46 | 0.4 | 0.94; environment non-conformance = 1 − 0.94 = 0.06 |
| Current phase chain number -PROJECT 1 | 1.22 | 2 | 1.55 |
| Current phase chain number -PROJECT 2 | 1.24 | 0.67 | 1.5 |
| PWBDI Scenario -PROJECT 1 | 0.79 | ||
| Remark -PROJECT 1 | As SOPn > 1, ENPn > 1 and PWBDI < 1; It indicates that as the project-1 moves from pre-construction to construction phase, increase in social well-being is coupled with increasing environmental pressure | ||
| PIDI -PROJECT 1 | 1.29 | ||
| Remark -PROJECT 1 | As ECPn > 1, ENPn > 1 and PIDI > 1; It indicates that as the project-1 moves from pre-construction to construction phase, increase in economic well-being exceeds the increase in environmental pressure | ||
| PWBDI -PROJECT 2 | 0.83 | ||
| Remark -PROJECT 2 | As SOPn > 1, ENPn > 1 and PWBDI < 1; It indicates that as the project-2 moves from pre-construction to construction phase, increase in social well-being is coupled with increasing environmental pressure | ||
| PIDI -PROJECT 2 | 0.44 | ||
| Remark -PROJECT 2 | As ECPn < 1, ENPn > 1 and PIDI < 1; It indicates that as the project-2 moves from pre-construction to construction phase, economic well-being decreases with increase in environmental pressure | ||
| Description | GRIHA Rating Based on Aggregate Score (Pre-Construction → Construction) | Interpretation Based on PWBDI/PIDI Approach (PWBDI, PIDI) | |
| Project-1 | **** → **** | (0.79, 1.29) | |
| Project-2 | **** → **** | (0.83, 0.44) | |
| Non-desirable state, which could not have been detected by mere aggregate scoring as offered by these rating tools/schemes | |||
References
- United Nations-The General Assembly. Transforming Our World: The 2030 Agenda for Sustainable Development. 2015. Available online: https://www.un.org/ga/search/view_doc.asp?symbol=A/RES/70/1&Lang=E (accessed on 10 October 2020).
- Heravi, G.; Fathi, M.; Faeghi, S. Evaluation of sustainability indicators of industrial buildings focused on petrochemical projects. J. Clean. Prod. 2015, 109, 92–107. [Google Scholar] [CrossRef]
- World Green Building Council. The Benefits of Green Buildings. 2017. Available online: https://www.worldgbc.org/benefits-green-buildings (accessed on 18 October 2020).
- Goh, C.S.; Chong, H.Y.; Jack, L.; Faris, A.F.M. Revisiting triple bottom line within the context of sustainable construction: A systematic review. J. Clean. Prod. 2020, 252, 119884. [Google Scholar] [CrossRef]
- World Economic Forum. Shaping the Future of Construction: A Breakthrough in Mindset and Technology. 2016. Available online: https://www.weforum.org/reports/shaping-the-future-of-construction-a-breakthrough-in-mindset-and-technology (accessed on 6 December 2020).
- Alawneh, R.; Ghazali, F.E.M.; Ali, H.; Asif, M. Assessing the contribution of water and energy efficiency in green buildings to achieve United Nations Sustainable Development Goals in Jordan. Build. Environ. 2018, 146, 119–132. [Google Scholar] [CrossRef]
- Papajohn, D.; Brinker, C.; Asmar, M.E. Uncovering key criteria to assess sustainability rating systems for the built environment. In Construction Research Congress 2016; 2016; Volume 2016, pp. 1303–1312. Available online: https://doi.org/10.1061/9780784479827.131 (accessed on 2 November 2021).
- Sala, S.; Ciuffo, B.; Nijkamp, P. A systemic framework for sustainability assessment. Ecol. Econ. 2015, 119, 314–325. [Google Scholar] [CrossRef]
- Andrade, J.; Bragança, L. Sustainability assessment of dwellings–a comparison of methodologies. Civ. Eng. Environ. Syst. 2016, 33, 125–146. [Google Scholar] [CrossRef] [Green Version]
- Doan, D.T.; Ghaffarianhoseini, A.; Naismith, N.; Zhang, T.; Ghaffarianhoseini, A.; Tookey, J. A critical comparison of green building rating systems. Build. Environ. 2017, 123, 243–260. [Google Scholar] [CrossRef]
- Awadh, O. Sustainability and green building rating systems: LEED, BREEAM, GSAS and Estidama critical analysis. J. Build. Eng. 2017, 11, 25–29. [Google Scholar] [CrossRef]
- Mattoni, B.; Guattari, C.; Evangelisti, L.; Bisegna, F.; Gori, P.; Asdrubali, F. Critical review and methodological approach to evaluate the differences among international green building rating tools. Renew. Sustain. Energy Rev. 2018, 82, 950–960. [Google Scholar] [CrossRef]
- Yu, W.D.; Cheng, S.T.; Ho, W.C.; Chang, Y.H. Measuring the Sustainability of construction projects throughout their lifecycle: A Taiwan lesson. Sustainability 2018, 10, 1523. [Google Scholar] [CrossRef] [Green Version]
- UNEP. Decoupling Natural Resource Use and Environmental Impacts from Economic Growth. 2011. Available online: https://wedocs.unep.org/handle/20.500.11822/31439 (accessed on 10 January 2021).
- Wu, Y.; Chau, K.W.; Lu, W.; Shen, L.; Shuai, C.; Chen, J. Decoupling relationship between economic output and carbon emission in the Chinese construction industry. Environ. Impact Assess. Rev. 2018, 71, 60–69. [Google Scholar] [CrossRef]
- Du, Q.; Zhou, J.; Pan, T.; Sun, Q.; Wu, M. Relationship of carbon emissions and economic growth in China’s construction industry. J. Clean. Prod. 2019, 220, 99–109. [Google Scholar] [CrossRef]
- Liang, Y.; Cai, W.; Ma, M. Carbon dioxide intensity and income level in the Chinese megacities’ residential building sector: Decomposition and decoupling analyses. Sci. Total Environ. 2019, 677, 315–327. [Google Scholar] [CrossRef] [PubMed]
- Sev, A. How can the construction industry contribute to sustainable development? A conceptual framework. Sustain. Dev. 2009, 17, 161–173. [Google Scholar] [CrossRef]
- Said, H.; Berger, L. Future trends of sustainability design and analysis in construction industry and academia. Pract. Period. Struct. Des. Constr. 2014, 19, 77–88. [Google Scholar] [CrossRef]
- Svensson, G.; Wagner, B. Implementing and managing economic, social and environmental efforts of business sustainability. Manag. Environ. Qual. Int. J. 2015, 26, 195–213. [Google Scholar] [CrossRef]
- Ellen Macarthur Foundation. Circularity in the Built Environment: Case Studies a Compilation of Case Studies from the ce100. 2016. Available online: https://www.ellenmacarthurfoundation.org/assets/downloads/Built-Env-Co.Project.pdf (accessed on 8 September 2020).
- Iyer-Raniga, U.; Huovila, P.; Erasmus, P. Sustainable Buildings and Construction: Responding to the SDGs. Sustain. Cities Communities 2021. [Google Scholar] [CrossRef]
- Nasir, M.H.A.; Genovese, A.; Acquaye, A.A.; Koh, S.C.L.; Yamoah, F. Comparing linear and circular supply chains: A case study from the construction industry. Int. J. Prod. Econ. 2017, 183, 443–457. [Google Scholar] [CrossRef]
- Scheel, C.; Aguiñaga, E.; Bello, B. Decoupling Economic Development from the Consumption of Finite Resources Using Circular Economy. A Model for Developing Countries. Sustainability 2020, 12, 1291. [Google Scholar] [CrossRef] [Green Version]
- Ellen Macarthur Foundation. The Built Environment Two Circular Investment Opportunities for a Low-Carbon and Prosperous Recovery. 2020. Available online: https://www.ellenmacarthurfoundation.org/assets/downloads/The-Built-Environment.pdf (accessed on 2 February 2021).
- Wallbaum, H.; Ostermeyer, Y.; Salzer, C.; Escamilla, E.Z. Indicator based sustainability assessment tool for affordable housing construction technologies. Ecol. Indic. 2012, 18, 353–364. [Google Scholar] [CrossRef]
- Agol, D.; Latawiec, A.E.; Strassburg, B.B. Evaluating impacts of development and conservation projects using sustainability indicators: Opportunities and challenges. Environ. Impact Assess. Rev. 2014, 48, 1–9. [Google Scholar] [CrossRef]
- Illankoon, I.C.S.; Tam, V.W.; Le, K.N.; Shen, L. Key credit criteria among international green building rating tools. J. Clean. Prod. 2017, 164, 209–220. [Google Scholar] [CrossRef]
- Parkin, S. Sustainable development: The concept and the practical challenge. In Proceedings of the Institution of Civil Engineers-Civil Engineering; Thomas Telford Ltd.: London, UK, 2000; Volume 138, No. 6; pp. 3–8. [Google Scholar]
- Karji, A.; Woldesenbet, A.; Khanzadi, M. Social sustainability indicators in mass housing construction. In Proceedings of the 53rd ASC Annual International Conference Proceedings, Motif Hotel, Seattle, 5–8 April 2017; pp. 762–769. Available online: https://digitalcommons.unl.edu/archengfacpub/127 (accessed on 2 November 2021).
- Balkema, A.J.; Preisig, H.A.; Otterpohl, R.; Lambert, F.J. Indicators for the sustainability assessment of wastewater treatment systems. Urban Water 2002, 4, 153–161. [Google Scholar] [CrossRef]
- Zhao, Z.Y.; Zhao, X.J.; Davidson, K.; Zuo, J. A corporate social responsibility indicator system for construction enterprises. J. Clean. Prod. 2012, 29, 277–289. [Google Scholar] [CrossRef]
- Abidin, N.Z. Investigating the awareness and application of sustainable construction concept by Malaysian developers. Habitat Int. 2010, 34, 421–426. [Google Scholar] [CrossRef]
- Munasinghe, M. Sustainomics: A Trans-disciplinary framework for making development more sustainable. Int. Soc. Ecol. Econ. 2004. [Google Scholar] [CrossRef]
- Baloi, D.; Price, A.D. Modelling global risk factors affecting construction cost performance. Int. J. Proj. Manag. 2003, 21, 261–269. [Google Scholar] [CrossRef]
- Goodland, R. The concept of environmental sustainability. Annu. Rev. Ecol. Syst. 1995, 26, 1–24. [Google Scholar] [CrossRef]
- Yates, J.K.; Castro-Lacouture, D. Sustainability in Engineering Design and Construction; CRC Press: Boca Raton, FL, USA, 2018. [Google Scholar]
- UNEP. Global Guidance Principles for Life Cycle Assessment Databases a Basis for Greener Processes and Products. Imprimerie Escourbiac. 2011. Available online: https://www.lifecycleinitiative.org/wp-content/uploads/2012/12/2011%20-%20Global%20Guidance%20Principles.pdf (accessed on 7 March 2021).
- Wulf, C.; Werker, J.; Ball, C.; Zapp, P.; Kuckshinrichs, W. Review of sustainability assessment approaches based on life cycles. Sustainability 2019, 11, 5717. [Google Scholar] [CrossRef] [Green Version]
- Sala, S.; Farioli, F.; Zamagni, A. Life cycle sustainability assessment in the context of sustainability science progress (part 2). Int. J. Life Cycle Assess. 2013, 18, 1686–1697. [Google Scholar] [CrossRef]
- Guinée, J. Life cycle sustainability assessment: What is it and what are its challenges. In Taking Stock of Industrial Ecology; Springer: Cham, Switzerland, 2016; pp. 45–68. [Google Scholar]
- Hannouf, M.; Assefa, G. A life cycle sustainability assessment-based decision-analysis framework. Sustainability 2018, 10, 3863. [Google Scholar] [CrossRef] [Green Version]
- Ji, Y.; Plainiotis, S. Design for Sustainability; China Architecture & Building Press: Beijing, China, 2006. [Google Scholar]
- Bal, M.; Bryde, D.; Fearon, D.; Ochieng, E. Stakeholder engagement: Achieving sustainability in the construction sector. Sustainability 2013, 5, 695–710. [Google Scholar] [CrossRef] [Green Version]
- Herazo, B.; Lizarralde, G. Understanding stakeholders’ approaches to sustainability in building projects. Sustain. Cities Soc. 2016, 26, 240–254. [Google Scholar] [CrossRef]
- Fletcher, R.; Rammelt, C. Decoupling: A key fantasy of the post-2015 sustainable development agenda. Globalizations 2017, 14, 450–467. [Google Scholar] [CrossRef] [Green Version]
- Stanitsas, M.; Kirytopoulos, K.; Leopoulos, V. Integrating sustainability indicators into project management: The case of construction industry. J. Clean. Prod. 2020, 279, 123774. [Google Scholar] [CrossRef]
- Glass, J.; Simmonds, M. “Considerate construction”: Case studies of current practice. Eng. Constr. Archit. Manag. 2007, 14, 131–149. [Google Scholar] [CrossRef]
- Ugwu, O.O.; Haupt, T.C. Key performance indicators and assessment methods for infrastructure sustainability—A South African construction industry perspective. Build. Environ. 2007, 42, 665–680. [Google Scholar] [CrossRef]
- Edum-Fotwe, F.T.; Price, A.D. A social ontology for appraising sustainability of construction projects and developments. Int. J. Proj. Manag. 2009, 27, 313–322. [Google Scholar] [CrossRef]
- Mills, F.T.; Glass, J. The construction design manager’s role in delivering sustainable buildings. Archit. Eng. Des. Manag. 2009, 5, 75–90. [Google Scholar] [CrossRef]
- Valdes-Vasquez, R.; Klotz, L.E. Social sustainability considerations during planning and design: Framework of processes for construction projects. J. Constr. Eng. Manag. 2013, 139, 80–89. [Google Scholar] [CrossRef]
- Cheng, E.W.; Kelly, S.; Ryan, N. Use of safety management practices for improving project performance. Int. J. Inj. Control Saf. Promot. 2015, 22, 33–39. [Google Scholar] [CrossRef]
- Almahmoud, E.; Doloi, H.K. Assessment of social sustainability in construction projects using social network analysis. Facilities 2015, 33, 152–176. [Google Scholar] [CrossRef]
- Abdel-Raheem, M.; Ramsbottom, C. Factors affecting social sustainability in highway projects in Missouri. Procedia Eng. 2016, 145, 548–555. [Google Scholar] [CrossRef]
- Pocock, J.; Steckler, C.; Hanzalova, B. Improving socially sustainable design and construction in developing countries. Procedia Eng. 2016, 145, 288–295. [Google Scholar] [CrossRef] [Green Version]
- O’Connor, J.T.; Torres, N.; Woo, J. Sustainability actions during the construction phase. J. Constr. Eng. Manag. 2016, 142, 04016016. [Google Scholar] [CrossRef]
- Sodangi, M. Overcoming the constraints to the adoption of sustainable civil engineering practices. Int. J. Constr. Manag. 2019, 21, 490–507. [Google Scholar] [CrossRef]
- Farzanehrafat, M.; Akbarnezhad, A.; Ghoddousi, P. Analysis of different views towards social sustainability in construction. In ISARC. Proceedings of the International Symposium on Automation and Robotics in Construction; IAARC Publications, 2015; Volume 32, p. 1. Available online: https://www.iaarc.org/publications/2015_proceedings_of_the_32st_isarc_oulu_finland/analysis_of_different_views_towards_social_sustainability_in_construction.html (accessed on 2 November 2021).
- Sierra, L.A.; Yepes, V.; Pellicer, E. A review of multi-criteria assessment of the social sustainability of infrastructures. J. Clean. Prod. 2018, 187, 496–513. [Google Scholar] [CrossRef]
- Lakhani, R. Occupational health of women construction workers in the unorganised sector. J. Health Manag. 2004, 6, 187–200. [Google Scholar] [CrossRef]
- Vee, C.; Skitmore, C. Professional ethics in the construction industry. Eng. Constr. Archit. Manag. 2003, 10, 117–127. [Google Scholar] [CrossRef] [Green Version]
- Moodley, K.; Smith, N.; Preece, C.N. Stakeholder matrix for ethical relationships in the construction industry. Constr. Manag. Econ. 2008, 26, 625–632. [Google Scholar] [CrossRef]
- Hartley, R. Fighting corruption in the Australian construction industry: The national code of practice. Leadersh. Manag. Eng. 2009, 9, 131–135. [Google Scholar] [CrossRef]
- Oladinrin, O.T.; Ho, C.M. Critical enablers for codes of ethics implementation in construction organizations. J. Manag. Eng. 2016, 32, 04015023. [Google Scholar] [CrossRef]
- Saenz, C.; Brown, H. The disclosure of anticorruption aspects in companies of the construction sector: Main companies worldwide and in Latin America. J. Clean. Prod. 2018, 196, 259–272. [Google Scholar] [CrossRef]
- Alkhatib, O.J.; Abdou, A. An ethical (descriptive) framework for judgment of actions and decisions in the construction industry and engineering—Part I. Sci. Eng. Ethics 2018, 24, 585–606. [Google Scholar] [CrossRef] [PubMed]
- World Green Building Council. The World GBC’s Health & Wellbeing Framework Six Principles for a Healthy, Sustainable Built Environment. 2020. Available online: https://worldgbc.org/health-framework (accessed on 5 March 2021).
- UKGBC. Social Value in New Development: An Introductory Guide for Local Authorities and Development Teams S. 2018. Available online: https://www.ukgbc.org/wp-content/uploads/2018/03/Social-Value.pdf (accessed on 8 February 2021).
- Griha Council. Griha v.2019 Abridged Manual; The Energy and Resources Institute (TERI): New Delhi, India, 2019; Available online: https://www.grihaindia.org/sites/default/files/pdf/Manuals/griha-v2019-abridged-manual.pdf (accessed on 23 October 2020).
- Building Responsibly. Building Responsibly Collaborating to Promote the Welfare of Workers in the Engineering and Construction Industry, 2017. Available online: https://static1.squarespace.com/static/5aa2d2d82971141ff9a61ea5/t/5eb2925fa9dc2768b0a7d51b/1588761202701/Building+Responsibly_Worker+Welfare+Principles.pdf (accessed on 19 October 2020).
- ASHRAE Standards & Guidelines. Standard for the Design of High-Performance Green Buildings. 2018. Available online: https://www.ashrae.org/technical-resources/bookstore/standard-189-1 (accessed on 18 October 2020).
- Du Plessis, C. Agenda 21 for sustainable construction in developing countries. CSIR Rep. BOU E 2002, 204, 2–5. [Google Scholar]
- Loosemore, M.; Chau, D.W. Racial discrimination towards Asian operatives in the Australian construction industry. Constr. Manag. Econ. 2002, 20, 91–102. [Google Scholar] [CrossRef]
- Mitullah, W. Informal Labour in The Construction Industry in Kenya; University of Nairobi: Nairobi, Kenya, 2003. [Google Scholar]
- Shen, L.Y.; Li Hao, J.; Tam, V.W.Y.; Yao, H. A checklist for assessing sustainability performance of construction projects. J. Civ. Eng. Manag. 2007, 13, 273–281. [Google Scholar] [CrossRef]
- Baruah, B. Gender and globalization: Opportunities and constraints faced by women in the construction industry in India. Labor Stud. J. 2010, 35, 198–221. [Google Scholar] [CrossRef]
- Tjoe Nij, E.; Hilhorst, S.; Spee, T.; Spierings, J.; Steffens, F.; Lumens, M.; Heederik, D. Dust control measures in the construction industry. Ann. Occup. Hyg. 2003, 47, 211–218. [Google Scholar] [PubMed] [Green Version]
- Thomas, N.I.R.; Costa, D.B. Adoption of environmental practices on construction sites. Ambiente Construído 2017, 17, 9–24. [Google Scholar] [CrossRef] [Green Version]
- Paul, W.L.; Taylor, P.A. A comparison of occupant comfort and satisfaction between a green building and a conventional building. Build. Environ. 2008, 43, 1858–1870. [Google Scholar] [CrossRef]
- Ioan, S.; Călin, S. Olfactory comfort assurance in buildings. Chem. Emiss. Control Radioact. Pollut. Indoor Air Qual. 2011, 407. [Google Scholar] [CrossRef]
- Bernardini, E.; Spence, S.M.; Kwon, D.K.; Kareem, A. Performance-based design of high-rise buildings for occupant comfort. J. Struct. Eng. 2015, 141, 04014244. [Google Scholar] [CrossRef]
- Andargie, M.S.; Touchie, M.; O’Brien, W. A review of factors affecting occupant comfort in multi-unit residential buildings. Build. Environ. 2019, 160, 106182. [Google Scholar] [CrossRef]
- Evans, G.W. The built environment and mental health. J. Urban Health 2003, 80, 536–555. [Google Scholar] [CrossRef] [PubMed]
- Hoisington, A.J.; Stearns-Yoder, K.A.; Schuldt, S.J.; Beemer, C.J.; Maestre, J.P.; Kinney, K.A.; Postolache, T.T.; Lowry, C.A.; Brenner, L.A. Ten questions concerning the built environment and mental health. Build. Environ. 2019, 155, 58–69. [Google Scholar] [CrossRef]
- Campbell, M.A.; Gunning, J.G. Strategies to improve mental health and well-being within the UK construction industry. Proc. Inst. Civ. Eng. Manag. Procure. Law 2020, 173, 64–74. [Google Scholar] [CrossRef]
- Lingard, H.; Lin, J. Career, family and work environment determinants of organizational commitment among women in the Australian construction industry. Constr. Manag. Econ. 2004, 22, 409–420. [Google Scholar] [CrossRef]
- Karakhan, A.A.; Gambatese, J.A.; Simmons, D.R.; Al-Bayati, A.J. Identifying Pertinent Indicators for Assessing and Fostering Diversity, Equity, and Inclusion of the Construction Workforce. J. Manag. Eng. 2021, 37, 04020114. [Google Scholar] [CrossRef]
- Hübner, F.; Volk, R.; Kühlen, A.; Schultmann, F. Review of project planning methods for deconstruction projects of buildings. Built Environ. Proj. Asset Manag. 2017, 7, 212–226. [Google Scholar] [CrossRef] [Green Version]
- German Sustainable Building Council. DGNB Criteria Set–Deconstruction of Buildings. 2020. Available online: https://www.dgnb-system.de/de/gebaeude/rueckbau/kriterien/ (accessed on 30 November 2020).
- Yeheyis, M.; Hewage, K.; Alam, M.S.; Eskicioglu, C.; Sadiq, R. An overview of construction and demolition waste management in Canada: A lifecycle analysis approach to sustainability. Clean Technol. Environ. Policy 2013, 15, 81–91. [Google Scholar] [CrossRef]
- Enshassi, A.; Kochendoerfer, B.; Al Ghoul, H. Factors affecting sustainable performance of construction projects during project life cycle phases. Int. J. Sustain. Constr. Eng. Technol. 2016, 7. Available online: http://hdl.handle.net/20.500.12358/26557 (accessed on 2 November 2021).
- Vardon, M.; Castaneda, J.P.; Nagy, M.; Schenau, S. How the System of Environmental-Economic Accounting can improve environmental information systems and data quality for decision making. Environ. Sci. Policy 2018, 89, 83–92. [Google Scholar] [CrossRef]
- UNEP. System of Environmental-Economic Accounting—Ecosystem Accounting. 2021. Available online: https://unstats.un.org/unsd/statcom/52nd-session/documents/BG-3f-SEEA-EA_Final_draft-E.pdf (accessed on 4 February 2021).
- Perry, J.G.; Hayes, R.W. Risk and its management in construction projects. Proc. Inst. Civ. Eng. 1985, 78, 499–521. [Google Scholar] [CrossRef]
- Martens, M.L.; Carvalho, M.M. Key factors of sustainability in project management context: A survey exploring the project managers’ perspective. Int. J. Proj. Manag. 2017, 35, 1084–1102. [Google Scholar] [CrossRef]
- Chan, A.P.; Scott, D.; Lam, E.W. Framework of success criteria for design/build projects. J. Manag. Eng. 2002, 18, 120–128. [Google Scholar] [CrossRef]
- Pulaski, M.H.; Horman, M.J. Organizing constructability knowledge for design. J. Constr. Eng. Manag. 2005, 131, 911–919. [Google Scholar] [CrossRef]
- Lind, H.; Brunes, F. Explaining cost overruns in infrastructure projects: A new framework with applications to Sweden. Constr. Manag. Econ. 2015, 33, 554–568. [Google Scholar] [CrossRef]
- Dahl, P.; Horman, M.; Pohlman, T.; Pulaski, M. Evaluating design-build-operate-maintain delivery as a tool for sustainability. In Construction Research Congress 2005: Broadening Perspectives; 2005; pp. 1–10. Available online: https://doi.org/10.1061/40754(183)27 (accessed on 2 November 2021). [CrossRef]
- Spooner, K.; Kaine, S. Defining sustainability and human resource management. Int. Employ. Relat. Rev. 2010, 16, 70–81. [Google Scholar]
- Othman, I.; Idrus, A.; Napiah, M. Human resource management in the construction of a sustainable development project: Towards successful completion. WIT Trans. Ecol. Environ. 2012, 162, 169–180. [Google Scholar]
- Siew, R.Y.J. Human resource management in the construction industry–Sustainability competencies. Constr. Econ. Build. 2014, 14, 87–103. [Google Scholar] [CrossRef] [Green Version]
- Siew, R.Y.J. Integrating sustainability into construction project portfolio management. KSCE J. Civ. Eng. 2016, 20, 101–108. [Google Scholar] [CrossRef] [Green Version]
- Simatupang, T.M.; Sridharan, R. The collaboration index: A measure for supply chain collaboration. Int. J. Phys. Distrib. Logist. Manag. 2005, 35, 44–62. [Google Scholar] [CrossRef]
- Adetunji, I.; Price, A.D.F.; Fleming, P. Achieving sustainability in the construction supply chain. In Proceedings of the Institution of Civil Engineers-Engineering Sustainability; Thomas Telford Ltd.: London, UK, 2008; Volume 161, No. 3; pp. 161–172. [Google Scholar]
- Pero, M.; Moretto, A.; Bottani, E.; Bigliardi, B. Environmental collaboration for sustainability in the construction industry: An exploratory study in Italy. Sustainability 2017, 9, 125. [Google Scholar] [CrossRef] [Green Version]
- Dadhich, P.; Genovese, A.; Kumar, N.; Acquaye, A. Developing sustainable supply chains in the UK construction industry: A case study. Int. J. Prod. Econ. 2015, 164, 271–284. [Google Scholar] [CrossRef]
- Meng, X. Change in UK construction: Moving toward supply chain collaboration. J. Civ. Eng. Manag. 2013, 19, 422–432. [Google Scholar] [CrossRef]
- Banchuen, P.; Sadler, I.; Shee, H. Supply chain collaboration aligns order-winning strategy with business outcomes. IIMB Manag. Rev. 2017, 29, 109–121. [Google Scholar] [CrossRef] [Green Version]
- Spence, R.; Mulligan, H. Sustainable development and the construction industry. Habitat Int. 1995, 19, 279–292. [Google Scholar] [CrossRef]
- Abdulsalam, D.; Faki, A.I.; Dardau, A.A. Impact assessment of incentive schemes for the sustainable development of Nigerian construction industry. J. Civ. Eng. Archit. 2012, 6, 1194. [Google Scholar] [CrossRef] [Green Version]
- Avilova, I.; Krutilova, M.; Peresypkina, E. Economic incentives of green standards in civil and municipal engineering. Int. Multidiscip. Sci. GeoConf. SGEM 2017, 17, 255–261. [Google Scholar]
- Gan, X.; Zuo, J.; Wu, P.; Wang, J.; Chang, R.; Wen, T. How affordable housing becomes more sustainable? A stakeholder study. J. Clean. Prod. 2017, 162, 427–437. [Google Scholar] [CrossRef]
- Adams, K.T.; Osmani, M.; Thorpe, T.; Thornback, J. Circular economy in construction: Current awareness, challenges, and enablers. In Proceedings of the Institution of Civil Engineers-Waste and Resource Management; Thomas Telford Ltd.: London, UK, 2017; Volume 170, No. 1; pp. 15–24. [Google Scholar]
- Schneiderova-Heralova, R. Importance of life cycle costing for construction projects. Eng. Rural Dev. 2018, 17, 1223–1227. [Google Scholar]
- Manege, S.L.; Kennedy, C.J. Investigating whole life costing awareness in Tanzania building construction industry. Int. J. Constr. Manag. 2020, 1–8. [Google Scholar] [CrossRef]
- Kagioglou, M.; Cooper, R.; Aouad, G. Performance management in construction: A conceptual framework. Constr. Manag. Econ. 2001, 19, 85–95. [Google Scholar] [CrossRef]
- Larsen, J.K.; Shen, G.Q.; Lindhard, S.M.; Brunoe, T.D. Factors affecting schedule delay, cost overrun, and quality level in public construction projects. J. Manag. Eng. 2016, 32, 04015032. [Google Scholar] [CrossRef] [Green Version]
- Li, X.; Xu, J.; Zhang, Q. Research on construction schedule management based on BIM technology. Procedia Eng. 2017, 174, 657–667. [Google Scholar] [CrossRef]
- Rumane, A.R. Quality Management in Construction Projects; CRC Press: Boca Raton, FL, USA, 2017. [Google Scholar]
- Levy, S.M. Project Management in Construction; McGraw-Hill Education: New York, NY, USA, 2018. [Google Scholar]
- Dubois, A.; Gadde, L.E. The construction industry as a loosely coupled system: Implications for productivity and innovation. Constr. Manag. Econ. 2002, 20, 621–631. [Google Scholar] [CrossRef]
- Dulaimi, M.F.; Ling, F.Y.Y.; Ofori, G.; Silva, N.D. Enhancing integration and innovation in construction. Build. Res. Inf. 2002, 30, 237–247. [Google Scholar] [CrossRef]
- Park, H.S. Conceptual framework of construction productivity estimation. KSCE J. Civ. Eng. 2006, 10, 311–317. [Google Scholar] [CrossRef]
- Ries, R.; Bilec, M.M.; Gokhan, N.M.; Needy, K.L. The economic benefits of green buildings: A comprehensive case study. Eng. Econ. 2006, 51, 259–295. [Google Scholar] [CrossRef]
- Dobiáš, J.; Macek, D. Leadership in Energy and Environmental Design (LEED) and its impact on building operational expenditures. Procedia Eng. 2014, 85, 132–139. [Google Scholar] [CrossRef] [Green Version]
- German Sustainable Building Council. DGNB System–Buildings in Use Criteria Set VERSION 2020. Deutsche Gesellschaft für Nachhaltiges Bauen. 2020. Available online: https://static.dgnb.de/fileadmin/dgnb-system/downloads/criteria/DGNB-Criteria-Set-Buildings-In-Use-Version-2020.pdf (accessed on 24 November 2020).
- Finch, E.; Jones, K.; Sharp, M. A new performance-based process model for built asset maintenance. Facilities 2007, 25, 525–535. [Google Scholar]
- Wibowo, M.A.; Handayani, N.U.; Mustikasari, A. Factors for implementing green supply chain management in the construction industry. J. Ind. Eng. Manag. 2018, 11, 651–679. [Google Scholar] [CrossRef]
- Villena, V.H. The missing link? The strategic role of procurement in building sustainable supply networks. Prod. Oper. Manag. 2019, 28, 1149–1172. [Google Scholar] [CrossRef]
- Dantata, N.; Touran, A.; Wang, J. An analysis of cost and duration for deconstruction and demolition of residential buildings in Massachusetts. Resour. Conserv. Recycl. 2005, 44, 1–15. [Google Scholar] [CrossRef]
- Akbarnezhad, A.; Ong, K.C.G.; Chandra, L.R. Economic and environmental assessment of deconstruction strategies using building information modeling. Autom. Constr. 2014, 37, 131–144. [Google Scholar] [CrossRef]
- Duran, X.; Lenihan, H.; O’Regan, B. A model for assessing the economic viability of construction and demolition waste recycling—The case of Ireland. Resour. Conserv. Recycl. 2006, 46, 302–320. [Google Scholar] [CrossRef]
- Zheng, L.; Wu, H.; Zhang, H.; Duan, H.; Wang, J.; Jiang, W.; Dong, B.; Liu, G.; Zuo, J.; Song, Q. Characterizing the generation and flows of construction and demolition waste in China. Constr. Build. Mater. 2017, 136, 405–413. [Google Scholar] [CrossRef] [Green Version]
- Sanchez, B.; Rausch, C.; Haas, C. Deconstruction programming for adaptive reuse of buildings. Autom. Constr. 2019, 107, 102921. [Google Scholar] [CrossRef]
- Rašković, M.; Ragossnig, A.M.; Kondracki, K.; Ragossnig-Angst, M. Clean construction and demolition waste material cycles through optimised pre-demolition waste audit documentation: A review on building material assessment tools. Waste Manag. Res. 2020, 38, 923–941. [Google Scholar] [CrossRef]
- Kibert, C.J.; Chini, A.R. August. Overview of Deconstruction in Selected Countries; CIB Publication: Ottawa, ON, Canada, 2000; Volume 252. [Google Scholar]
- Tam, C.M.; Tam, V.W.; Tsui, W.S. Green construction assessment for environmental management in the construction industry of Hong Kong. Int. J. Proj. Manag. 2004, 22, 563–571. [Google Scholar] [CrossRef]
- Ding, G.K. Sustainable construction—The role of environmental assessment tools. J. Environ. Manag. 2008, 86, 451–464. [Google Scholar] [CrossRef] [PubMed] [Green Version]
- Li, X.; Zhu, Y.; Zhang, Z. An LCA-based environmental impact assessment model for construction processes. Build. Environ. 2010, 45, 766–775. [Google Scholar] [CrossRef]
- Letmathe, P.; Doost, R.K. Environmental cost accounting and auditing. Manag. Audit. J. 2000, 15, 424–431. [Google Scholar] [CrossRef]
- Ding, G.K. Life cycle assessment (LCA) of sustainable building materials: An overview. Eco-Effic. Constr. Build. Mater. 2014, 38–62. [Google Scholar] [CrossRef]
- Bredenoord, J. Sustainable building materials for low-cost housing and the challenges facing their technological developments: Examples and lessons regarding bamboo, earth-block technologies, building blocks of recycled materials, and improved concrete panels. J. Archit. Eng. Technol. 2017, 6, 1–11. [Google Scholar] [CrossRef]
- Estokova, A.; Samesova, D. Sustainable Building Materials and Life Cycle Assessment. Sustainability 2021, 13, 2012. [Google Scholar] [CrossRef]
- Kellert, S.R. Dimensions, elements, and attributes of biophilic design. In Biophilic Design: The Theory, Science and Practice of Bringing Buildings to Life; Wiley: Hoboken, NJ, USA, 2008; pp. 3–19. [Google Scholar]
- Kellert, S.R. Nature by Design: The Practice of Biophilic Design; Yale University Press: New Haven, CT, USA, 2018. [Google Scholar]
- Kellert, S.R.; Heerwagen, J.; Mador, M. Biophilic Design: The Theory, Science and Practice of Bringing Buildings to Life; John Wiley & Sons: Hoboken, NJ, USA, 2011. [Google Scholar]
- DeZuane, J. Handbook of Drinking Water Quality; John Wiley & Sons: Hoboken, NJ, USA, 1997. [Google Scholar]
- WHO. Air Quality Air Quality Guidelines Global Update 2005 Guidelines Global Update 2005 A. WHO Regional Office for Europe. 2005. Available online: https://www.euro.who.int/__data/assets/pdf_file/0005/78638/E90038.pdf (accessed on 14 November 2020).
- WHO. Guidelines for Drinking-Water Quality; WHO Press: Geneva, Switzerland, 2008; Available online: https://www.euro.who.int/__data/assets/pdf_file/0005/78638/E90038.pdf (accessed on 10 November 2020).
- Yang, C.T.; Liao, C.J.; Liu, J.C.; Den, W.; Chou, Y.C.; Tsai, J.J. Construction and application of an intelligent air quality monitoring system for healthcare environment. J. Med. Syst. 2014, 38, 1–10. [Google Scholar] [CrossRef] [PubMed]
- Hossaini, N.; Hewage, K.; Sadiq, R. Spatial life cycle sustainability assessment: A conceptual framework for net-zero buildings. Clean Technol. Environ. Policy 2015, 17, 2243–2253. [Google Scholar] [CrossRef]
- Karlsson, I.; Rootzén, J.; Johnsson, F. Reaching net-zero carbon emissions in construction supply chains–Analysis of a Swedish road construction project. Renew. Sustain. Energy Rev. 2020, 120, 109651. [Google Scholar] [CrossRef]
- Son, H.; Kim, C.; Chong, W.K.; Chou, J.S. Implementing sustainable development in the construction industry: Constructors’ perspectives in the US and Korea. Sustain. Dev. 2011, 19, 337–347. [Google Scholar] [CrossRef]
- Kucukvar, M.; Tatari, O. Towards a triple bottom-line sustainability assessment of the US construction industry. Int. J. Life Cycle Assess. 2013, 18, 958–972. [Google Scholar] [CrossRef]
- Waidyasekara, K.G.A.S.; De Silva, L.; Rameezdeen, R. Water use efficiency and conservation during construction: Drivers, barriers and practices. Built Environ. Proj. Asset Manag. 2016, 6, 553–566. [Google Scholar] [CrossRef]
- Furlong, C.; Jegatheesan, J.; Currell, M.; Iyer-Raniga, U.; Khan, T.; Ball, A.S. Is the global public willing to drink recycled water? A review for researchers and practitioners. Util. Policy 2019, 56, 53–61. [Google Scholar] [CrossRef]
- Wu, Z.; Wu, Z.; Li, H.; Zhang, X.; Jiang, M. Developing a strategic framework for adopting water-saving measures in construction projects. Environ. Geochem. Health 2020, 42, 955–968. [Google Scholar] [CrossRef]
- Spiegel, R.; Meadows, D. Green Building Materials: A Guide to Product Selection and Specification; John Wiley & Sons: Hoboken, NJ, USA, 2010. [Google Scholar]
- Llatas, C. A model for quantifying construction waste in projects according to the European waste list. Waste Manag. 2011, 31, 1261–1276. [Google Scholar] [CrossRef] [PubMed]
- Kim, J.T.; Yu, C.W. Hazardous materials in buildings. Indoor Built Environ. 2014, 23, 44–61. [Google Scholar] [CrossRef]
- Velenturf, A.P.; Archer, S.A.; Gomes, H.I.; Christgen, B.; Lag-Brotons, A.J.; Purnell, P. Circular economy and the matter of integrated resources. Sci. Total Environ. 2019, 689, 963–969. [Google Scholar] [CrossRef] [PubMed]
- Schneider, P.; Schwerdt, S.; Schulz, K.; Fiebig, S.; Mirschel, D. Feasibility of substitute building materials for circular use in urban green infrastructure: Dresden Nexus Conference 2020–Session 4–Circular Economy for Building with Secondary Construction Materials to Minimise Resource use and Land use. Civ. Eng. Des. 2020, 2, 159–168. [Google Scholar] [CrossRef]
- Council, U.G.B. US Green Building Council; US Green Building Council: Washington, DC, USA, 1998. [Google Scholar]
- Guo, Y.; Baetz, B.W. Sizing of rainwater storage units for green building applications. J. Hydrol. Eng. 2007, 12, 197–205. [Google Scholar] [CrossRef]
- Ching, F.D.; Shapiro, I.M. Green Building Illustrated; John Wiley & Sons: Hoboken, NJ, USA, 2020. [Google Scholar]
- Kijak, R.; Moy, D. A decision support framework for sustainable waste management. J. Ind. Ecol. 2004, 8, 33–50. [Google Scholar] [CrossRef]
- Wu, Z.; Shen, L.; Ann, T.W.; Zhang, X. A comparative analysis of waste management requirements between five green building rating systems for new residential buildings. J. Clean. Prod. 2016, 112, 895–902. [Google Scholar] [CrossRef]
- Cha, H.S.; Kim, J.; Han, J.Y. Identifying and assessing influence factors on improving waste management performance for building construction projects. J. Constr. Eng. Manag. 2009, 135, 647–656. [Google Scholar] [CrossRef]
- Wu, S.R.; Apul, D. Framework for integrating indoor air quality impacts into life cycle assessments of buildings and building related products. J. Green Build. 2015, 10, 127–149. [Google Scholar] [CrossRef]
- Wang, B.Z.; Zhu, Z.H.; Yang, E.; Chen, Z.; Wang, X.H. Assessment and management of air emissions and environmental impacts from the construction industry. J. Environ. Plan. Manag. 2018, 61, 2421–2444. [Google Scholar] [CrossRef]
- Hu, M.; Van Der Voet, E.; Huppes, G. Dynamic material flow analysis for strategic construction and demolition waste management in Beijing. J. Ind. Ecol. 2010, 14, 440–456. [Google Scholar] [CrossRef]
- Pan, X.; Xie, Q.; Feng, Y. Designing recycling networks for construction and demolition waste based on reserve logistics research field. J. Clean. Prod. 2020, 260, 120841. [Google Scholar] [CrossRef]
- Jain, S.; Singhal, S.; Pandey, S. Environmental life cycle assessment of construction and demolition waste recycling: A case of urban India. Resour. Conserv. Recycl. 2020, 155, 104642. [Google Scholar] [CrossRef]
- Lawson, N.; Douglas, I.; Garvin, S.; McGrath, C.; Manning, D.; Vetterlein, J. Recycling construction and demolition wastes—A UK perspective. Environ. Manag. Health 2001, 12, 146–157. [Google Scholar] [CrossRef]
- Kallio, H.; Pietilä, A.M.; Johnson, M.; Kangasniemi, M. Systematic methodological review: Developing a framework for a qualitative semi-structured interview guide. J. Adv. Nurs. 2016, 72, 2954–2965. [Google Scholar] [CrossRef]
- Glossary: Chain Index. 2013. Available online: https://ec.europa.eu/eurostat/statistics-explained/index.php?title=Glossary:Chain_inde (accessed on 24 September 2021).
- Li, Y.N.; Cai, M.; Wu, K.; Wei, J. Decoupling analysis of carbon emission from construction land in Shanghai. J. Clean. Prod. 2019, 210, 25–34. [Google Scholar] [CrossRef]
- IPCC. Summary for Policymakers. Climate Change 2021: The Physical Science Basis. Contribution of Working Group I to the Sixth Assessment Report of the Intergovernmental Panel on Climate Change. 2021. Available online: https://www.ipcc.ch/report/ar6/wg1/downloads/report/IPCC_AR6_WGI_Full_Report.pdf (accessed on 19 September 2021).
- PRB. Population Mid-2020 (Millions). 2020. Available online: https://www.prb.org/international/indicator/population/table/ (accessed on 21 September 2021).
- UNFCC. India’s Intended Nationally Determined Contribution: Working towards Climate Justice. 2015. Available online: https://www4.unfccc.int/sites/ndcstaging/PublishedDocuments/India%20First/INDIA%20INDC%20TO%20UNFCCC.pdf (accessed on 24 September 2021).
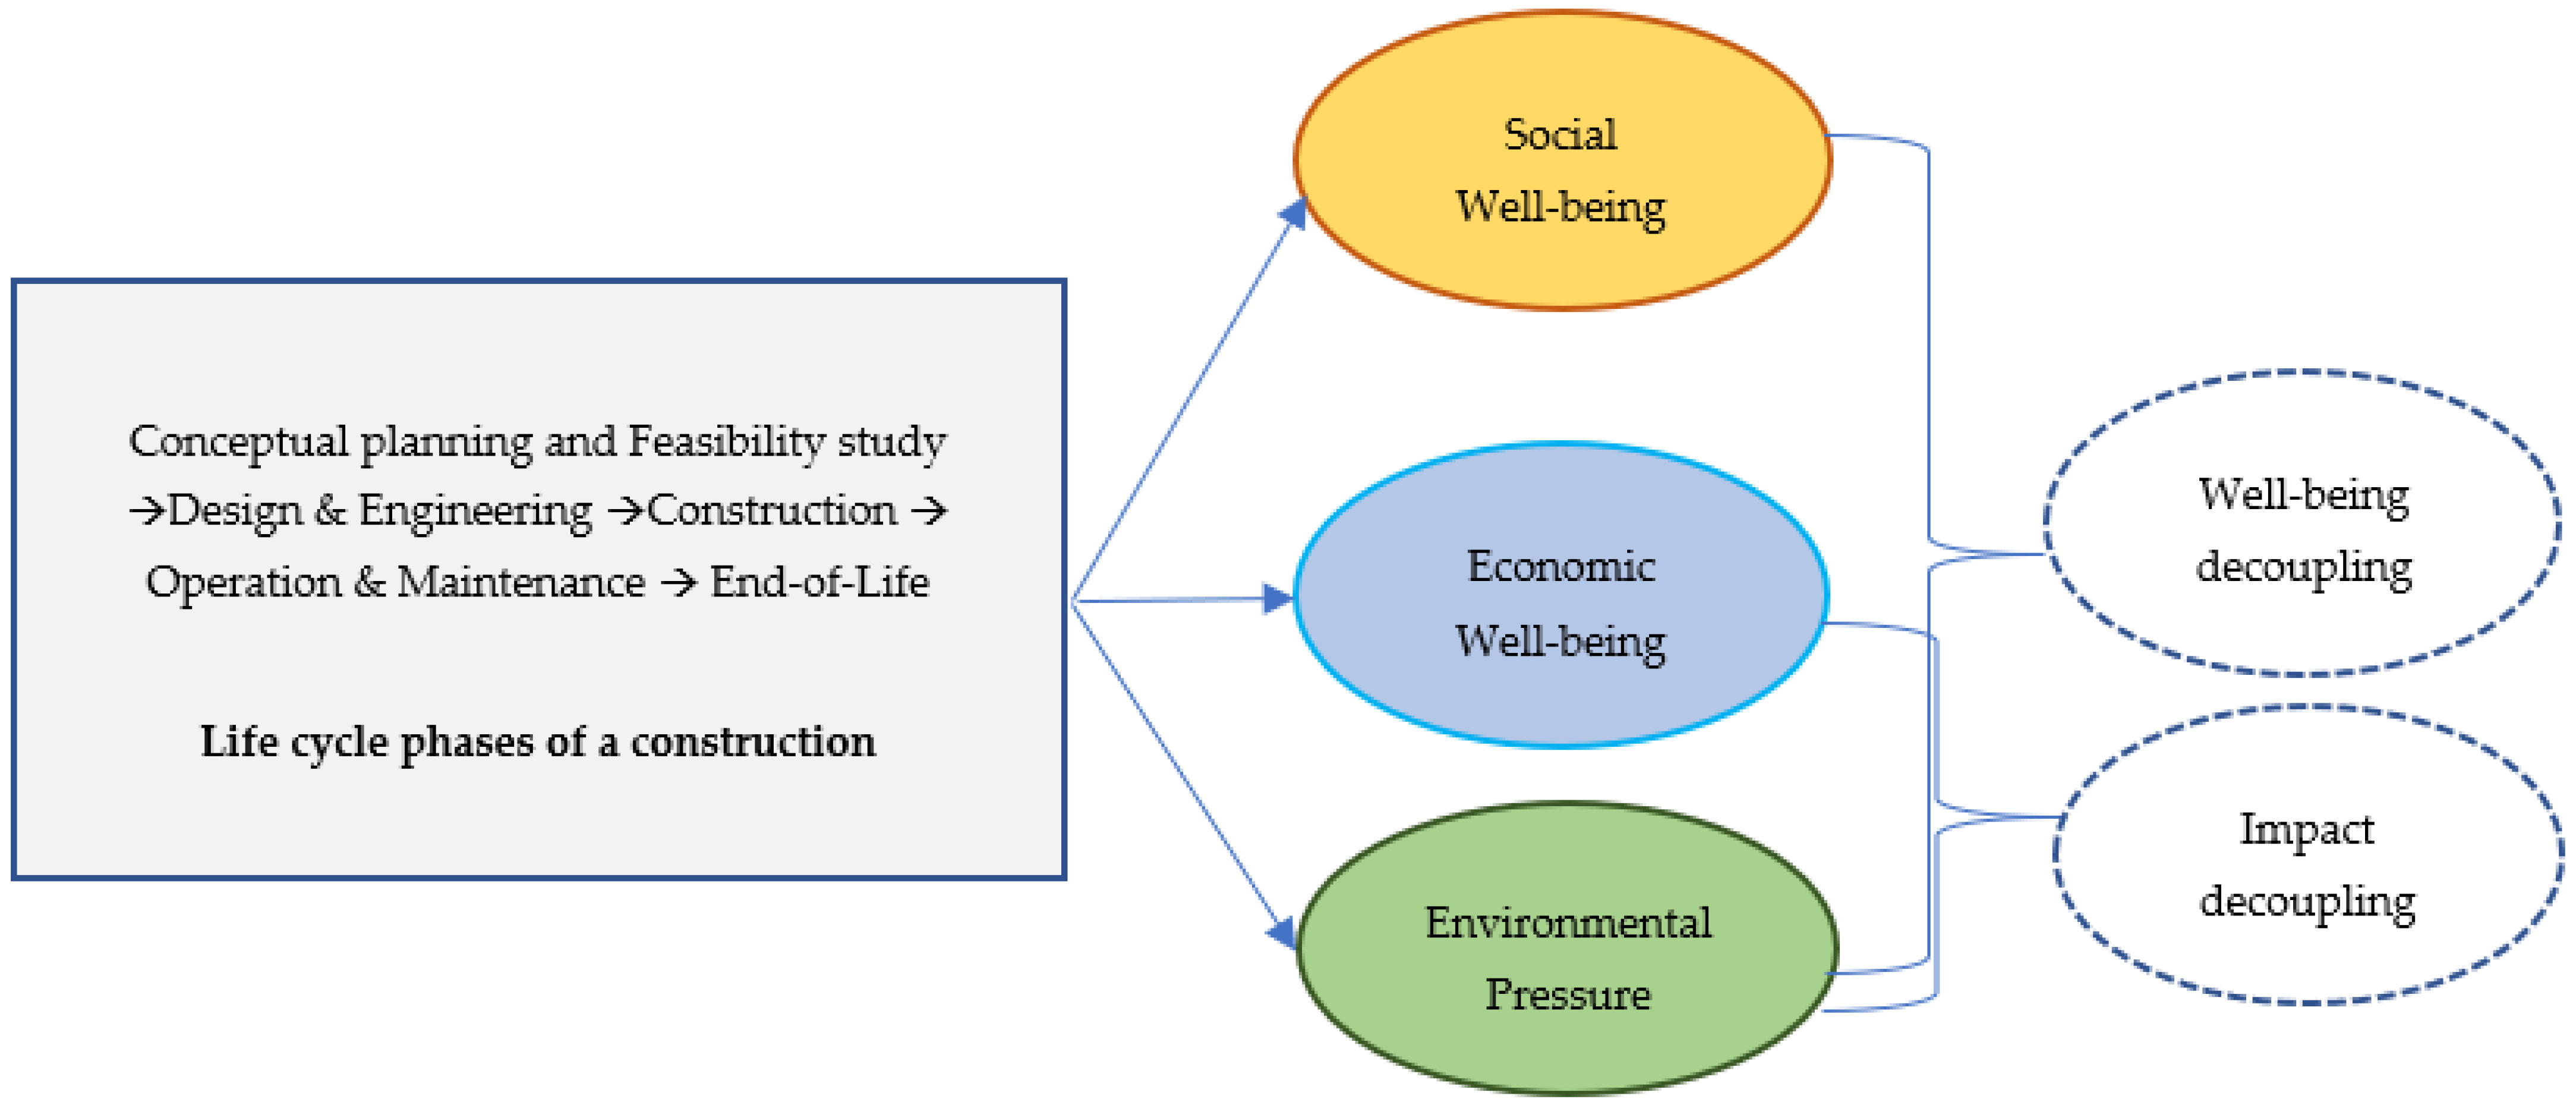


| Building Assessment Tools | Social | Economic | Environment |
|---|---|---|---|
| GRIHA (India) | 24 | 5 | 71 |
| LEED-IGBC (India) | 18 | --- | 82 |
| Green Star (Australia) | 31 | --- | 69 |
| Green Mark (Singapore) | 18.8 | --- | 81.2 |
| DGNB (Germany) | 30 | 30 | 40 |
| * CASBEE (Japan) | 28.8 | 6.2 | 65 |
| BREEAM (UK) | 26 | 12 | 62 |
| Green Globes (Canada) | 22 | --- | 78 |
| GBI (Malaysia) | 28 | 1 | 71 |
| GSAS (Gulf) | 28 | 3 | 69 |
| Social Sustainability Parameters (Phase 1. Conceptual Planning and Feasibility Study) | |||
| Parameters | Description | Indicators | References |
| Stakeholders’ consultation and engagement | Consultation and engagement with stakeholders/affected communities to identify and monitor their concerns and opportunities in different phases of construction | Consultation/engagement report based on parameters such as: expectations, project constraints, partnership, safety, employment, training, accessibility, and others * | [48,49,50,51,52,53,54,55,56,57,58] |
| Health and safety considerations | Planning for health and safety issues related to workers (including female workers), users, and other stakeholders | Considerations of guidelines related to health and safety of the stakeholders, which can be documented in the form of Health Impact Assessment (HIA) * | [52,53,57,59,60,61] |
| Ethical considerations | Planning to promote and ensure professional ethics, avoiding ethical dilemmas, dealing with conflicts of interest, and others | Adopting a framework for monitoring and ensuring compliance to ethical practices * | [62,63,64,65,66,67] |
| Social Sustainability Parameters (Phase 2. Design and Engineering) | |||
| Parameters | Description | Indicators | References |
| Decent work and economic growth | Incorporate policies for creating job opportunities in neighborhood communities, maintaining social and demographic equity in the design team, construction workers, and others involved in different life cycle phases | Adopting/implementing framework for assessing the trends in the stocks of natural resources, emissions, and discharges in the environment resulting from economic activities; accounting of environmental preservation cost and conservation cost | [1,68,69] |
| Health, well-being, and the environment | Design for better health, outdoor/indoor environments that promotes better lifestyle practices, nutrition, social connectivity, minimized infectious disease transmission, and others | Adopting design considerations such as: universal accessibility and sustainable transportation, resilient buildings and infrastructure, high quality public and green spaces, good mental health, and others * | [68,69,70] |
| Design with socioeconomic consideration | Design for promoting culture of occupational health (physical and mental), safety, social inclusion of workers, and include labor provisions in tendering process and supplier contracts | Adopting design considerations such as: design for safety and sanitation for construction workers, design for dedicated facilities for service staff, design for the positive social impact, which include provisions for promoting gender equality, protecting labour rights, and others | [68,71] |
| Long term value to the society and enhancing local quality of life | Designs considering physical and environmental impacts on the local area, taking community input for improving community’s health | Adopting a framework for evaluating social value to the society | [68,69] |
| Prioritizing occupant’s comfort | Designs with considerations for environment that is comfortable to occupant | Adopting guidelines of ASHRAE standards for the design of high performance green buildings, which include: thermal comfort, natural and energy efficient lighting, acoustic comfort, olafactory, ergonomics, and visual comforts in designs | [68,72] |
| Social Sustainability Parameters (Phase 3. Construction) | |||
| Parameters | Description | Indicators | References |
| Socioeconomic strategies for workers | Avoidance of unsafe acts/conditions, promoting gender equality, labor rights, habitable living conditions, grievance redressal mechanism, sustainability awareness, training, skills, and others for workers during construction | Adopting a framework for defining and delivering socioeconomic benefits to the construction workforce * | [68,73,74,75,76,77] |
| Long term value to the society and local quality of life | Environmental practices at construction sites | Adopting guidelines for mitigation of air pollution, noise pollution, traffic, congestion, waste, and other pollution created on site and in surrounding areas | [68,78,79] |
| Social Sustainability Parameters (Phase 4. Operation and Maintenance) | |||
| Parameters | Description | Indicators | References |
| Prioritizing occupant’s comfort | Creating an environment that enhances occupant’s comfort during operational phase | Adopting a framework for measuring and enhancing occupant’s comfort * | [68,80,81,82,83] |
| Operations for protecting and improving health | Support and enhancement of physical/mental health, minimization of infectious disease transmission, accessibility to public transport, space for physical activities, healthy food options, access to clean water, and others | Conducting postoccupancy evaluation survey results and adopting mitigation measures for infectious disease and improving health in a built environment | [68,84,85,86] |
| Socioeconomic strategies during the operational phase | Creating wider social and economic benefits to relevant stakeholders | Adopting a framework for assessing and promoting diversity, equity, and inclusions among stakeholders | [68,87,88] |
| Social Sustainability Parameters (Phase 5. End of life) | |||
| Parameters | Description | Indicators | References |
| Effective project communication | Disclosure/digital dissemination of information to the public about dismantling process, and other related issues | Evaluate the level of communication among stakeholders * | [89,90] |
| Security | Work and safety plan for the contaminated/noncontaminated area, and other related issues | Considerations of guidelines related to health, safety, and security of the stakeholders * | [90,91,92] |
| Economic Sustainability Parameters (Phase 1. Conceptual Planning and Feasibility Study) | |||
| Parameters | Description | Indicators | References |
| System of environmental–economic accounting | Integrating economic and environmental data for analysing the interrelationship between economy and environmental stock changes | Adopting/implementing framework for assessing the trends in the stocks of natural resources, emissions, and discharges in the environment resulting from economic activities; accounting of environmental preservation cost and conservation cost | [93,94] |
| Financial and economic feasibility | Estimating the return on investment, creditworthiness, viability, and cash flow during the entire life cycle of a project | Financial and economic feasibility assessment report of construction projects | [76,95,96] |
| Cost management plan | Concerning different processes and planning for controlling the cost of resources and other costs of the construction | Adopting framework to avoid time and cost overrun during different phases of a construction | [96,97,98,99] |
| Human resource planning | Concerning the capacities and capabilities of an individual worker in contributing towards sustainability | Adopting a framework for human resource management (HRM), focusing on aspects such as defined task domain of an employee, recruitment, remuneration, working conditions, training of the workforce, etc. | [100,101,102,103,104] |
| Supply chain collaboration | Strategies for collaborative practices, ensuring selection of order winners for improved business case | Measuring level of collaboration in the supply chain, i.e., collaboration index | [105,106,107,108,109,110] |
| Targeted incentives | Strategies for incentivizing to increase worker’s motivation and improving work productivity | Adopting a framework for targeted incentive schemes during different project phases | [111,112,113] |
| Ability to pay and affordability | Cost bearing ability of users during construction, operation, and maintenance of a project | Adopting framework to evaluate/facilitate the cost reduction of the constructed facility | [47,114] |
| Economic Sustainability Parameters (Phase 2. Design and Engineering) | |||
| Parameters | Description | Indicators | References |
| Design for quality of service | Design with considerations and promoting resource efficiency by adopting principle shift from linearity to circularity in construction | Adopting design principles such as: functionality and usability, durability and reliability, design for maintenance consideration, flexibility and adaptability for future changes, design for assembly and disassembly (DfD), design for extended life, and reuse/remanufacturing/recycling, specifying reclaimed/recycled materials, and others | [6,23,115] |
| Life cycle costing for alternative designs | Estimate the costing of the entire life cycle of the construction project, which includes acquisition cost, facility management (operational) cost, and disposal cost | Adopting framework that assists in different design/specifications alternatives with different cash flows over life cycle of construction project | [70,116,117] |
| Economic Sustainability Parameters (Phase 3. Construction) | |||
| Parameters | Description | Indicators | References |
| Cost, quality, and schedule management | Ensure reduction in the cost of poor quality work and avoid time–cost overruns in building/construction projects | Adopting a framework for performance management in construction projects | [118,119,120,121,122] |
| Innovation and productivity | Enhance growth through innovation and productivity in building/construction projects | Adopting a framework for promoting innovation and productivity in construction processes | [123,124,125] |
| Economic Sustainability Parameters (Phase 4. Operation and Maintenance) | |||
| Parameters | Description | Indicators | References |
| Operational costs | Estimating operational and maintenance cost of built nvironment | Adopting models for predicting life cycle costing that includes the cost for periodic inspections, facility’s operational cost, preventive maintenance cost, replacement and repairs cost, and reactive maintenance cost | [126,127,128] |
| Risk management and long term asset value | Ensure resilience of the built assets by managing risks proactively | Adopting a framework for built asset management with indicators such as responsible building operations, maintenance of built assets, managing environmental risks, analysing potential risks, and preparation for climate action | [128,129] |
| Sustainable operations and procurement | Ensure sustainable conscious operations and procurement with acknowledged social and environmental standards | Adopting guidelines for sustainable building operations, selecting suppliers and service providers, technical monitoring, maintenance, and construction measures | [128,130,131] |
| Economic Sustainability Parameters (Phase 5. End-of-life) | |||
| Parameters | Description | Indicators | References |
| Risk assessment and cost security | To assess and mitigate the economic/financial risks associated with decommissioning of project | Adopting a framework for risk management, which includes: estimating cost of the dismantling process, assessing the uncertainties and financial risks with the estimates of dismantling cost | [90,132,133] |
| Values of expandable resources | Devise strategies for estimating the flow of building stocks | Maintaining account of building stocks that are potential expandable components * | [90,134] |
| Separation, recycling, and disposal | Prudent and circular use of materials and products | Adopting framework for circular use of C&D waste * | [90,135,136,137] |
| Tendering Process | Contract award based on parameters such as separate collection rate, sorting rate, recycling rate, hazardous substance plan, site equipment plan, and others | Adopting a conceptual framework for assessing the contractor’s eligibility and performance | [90,138] |
| Environmental Sustainability Parameters (Phase 1. Conceptual Planning and Feasibility Study) | |||
| Parameters | Description | Indicators | References |
| System of environmental–economic accounting | Integrating economic and environmental data for analysing the interrelationship between economy and environmental stock changes | Adopting/implementing framework for assessing the trends in the stocks of natural resources, emissions, and discharges in the environment resulting from economic activities; accounting of environmental preservation cost and conservation cost | [93,94] |
| Environmental feasibility report/environmental impact assessment | Potentials benefits and ecological risks associated with the proposed project | Evaluating air, water, noise, land, and other pollution monitoring, prevention, and control strategies | [76,139,140,141] |
| Environmental management plan | Plan for controlling the environmental cost associated with the life cycle phases of a construction | Adopting a framework for environmental cost management accounting | [47,142] |
| Environmental Sustainability Parameters (Phase 2. Design and Engineering) | |||
| Parameters | Description | Indicators | References |
| Design with safe, healthy, and circular building materials | Promoting the use of materials that can be salvaged and reused aimed at sustainable consumption and production | Adopting/implementing framework for assessing the trends in the stocks of natural resources, emissions, and discharges in the environment resulting from economic activities; accounting of environmental preservation cost and conservation cost | [37,68,70,143,144,145] |
| Design for harmony between nature and the built environment | Design with considerations such as access to nature, biophilic benefit to people, occupants’ access to nature outdoors, and encouraging biodiversity within site footprints and surroundings | Adopting assessment framework for assessing the value of habitat that includes estimating the quantity and quality of biodiversity gained or lost, comparing pre- and postconstruction phases | [68,146,147,148] |
| Design for protecting and improving health | Design for maintaining/improving indoor air quality, water quality in order to minimize health risks | Adopting WHO Air Quality Guidelines, ASHRAE set benchmarks and WHO Guidelines for drinking water quality | [68,149,150,151,152] |
| Design for tackling climate change | Design with a commitment to water efficiency, net zero life cycle emissions, resilience against climate change and extreme weather events across all life cycle phases | Adopting guidelines for net zero emissions and climate resilience with design strategies aimed at mitigation and adaptation | [153,154] |
| Environmental Sustainability Parameters (Phase 3. Construction) | |||
| Parameters | Description | Indicators | References |
| Water use efficiency and managing local shortage crisis | Commitment towards water reduction in material production and different construction phases | Adopting a strategic framework for adopting and promoting water saving across life cycle phases of a construction | [68,155,156,157,158,159] |
| Safe, healthy, and circular use of building materials | Avoid usage of hazardous building materials, promote recycling and circular use of building materials | Adopting monitoring framework towards material loop closing in construction processes with focus on: designing out the waste, using circular building products preferring refurbished, recycle, and remanufactured products | [160,161,162,163,164] |
| Environmental Sustainability Parameters (Phase 4. Operation and Maintenance) | |||
| Parameters | Description | Indicators | References |
| Water use efficiency and managing local shortage crisis | Ensure commitment towards water demand reduction, wastewater treatment, rainwater management, and preserving water qualities for minimizing health risks | Adopting a strategic framework for promoting water saving across life cycle phases of a construction | [68,165,166,167] |
| Solid waste management | Ensure waste management systems are in place aimed at waste elimination, waste minimization, and material reuse | Adopting decision support framework for solid waste management postoccupancy | [68,70,168,169,170] |
| Air quality management | Ensure ambient air quality indoors and outdoors by real time monitoring | Adopting a framework for integrating air quality impacts in life cycle assessment | [68,171,172] |
| Environmental Sustainability Parameters (Phase 5. End of life) | |||
| Parameters | Description | Indicators | References |
| Material flow balance | C&D waste generated during demolition/decommissioning phase | Adopting a framework for acounting of masses arising in demolition/dismantling process, maintaining inventory of massess incurred, estimationg the distance, and others | [90,173,174] |
| Life cycle assessment of material flows | Environmental impacts/risks because of output flows, waste generated, emissions, and others | Adopting a framework for estimating/preventinng environmental impact arising from demolition of the constructed facility | [90,175] |
| Hazardous substance remediation | Hazardous substances generated during demolition/decommissioning phase | Adopting hazardous substance remediation guidelines and accounting of hazardous substances separately | [90,176] |
Project Phase  | Conceptual Planning and Feasibility Study | Design and Engineering | Construction | Operation and Maintenance | End of Life | Life Cycle Benchmark TBL Score (LCBTS)  |
| Sustainability Pillars | ||||||
| Social | ||||||
| Economic | ||||||
| Environment | ||||||
| Project Phase Benchmark Sustainability Score (PPBSS) | ||||||
| Cumulative Benchmark Sustainability Score (CBSS) |
| Project Phase | Conceptual Planning and Feasibility Study | Design and Engineering | Construction | Operation and Maintenance | End of Life | Life Cycle TBL Score (LCTS) |
| Sustainability Pillars | ||||||
| Social | ||||||
| Economic | ||||||
| Environment | ||||||
| Project Phase Sustainability Score (PPSS) | ||||||
| Cumulative Sustainability Score (CSS) |
| Type of Coupling/Decoupling | Possible Cases | Remark | State of Sustainability | |
|---|---|---|---|---|
| PWBDI k > 1 | Absolute well-being decoupling | SOPn > 1, ENPn < 1 | Increase in social well-being but decrease in environmental pressure | Ideal state |
| Relative well-being decoupling | SOPn > 1, ENPn > 1 | Increase in social well-being exceeds increase in environmental pressure | ||
| Contract well-being decoupling | SOPn < 1, ENPn < 1 | Decrease in social well-being is less than the decrease in environmental pressure | Permitted state | |
| PWBDI k < 1 | Expansive well-being recoupling | SOPn > 1, ENPn > 1 | An increase in social well-being is coupled with increasing environmental pressure | Prohibited state |
| Absolute well-being recoupling | SOPn < 1, ENPn > 1 | Decrease in social well-being with increase in environmental pressure | ||
| Relative well-being recoupling | SOPn < 1, ENPn < 1 | Decrease in social well-being is more than the decrease in environmental pressure | ||
| PIDI k > 1 | Absolute impact decoupling | ECPn > 1, ENPn < 1 | An increase in economic well-being but decrease in environmental pressure | Ideal state |
| Relative impact decoupling | ECPn > 1, ENPn > 1 | An increase in economic well-being exceeds increase in environmental pressure | ||
| Contract impact decoupling | ECPn < 1, ENPn < 1 | Decrease in economic well-being is less than the decrease in environmental pressure | Permitted state | |
| PIDI k < 1 | Expansive impact recoupling | ECPn > 1, ENPn > 1 | An increase in economic well-being is coupled with increasing environmental pressure | Prohibited state |
| Absolute impact recoupling | ECPn < 1, ENPn > 1 | Decrease in economic well-being with increase in environmental pressure | ||
| Relative impact recoupling | ECPn < 1, ENPn < 1 | Decrease in economic well-being is less than the decrease in environmental pressure | ||
| Sustainability Assessment Parameters | Pre-Construction Phase | Construction Phase | ||||||
|---|---|---|---|---|---|---|---|---|
| Assessment Criteria | Benchmark Score | Performance Score | Benchmark Score | Performance Score | ||||
| Case-1 | Case-2 | Case-3 | Case-1 | Case-2 | Case-3 | |||
| So-1: Sustainable Site Planning—Green Infrastructure | 3 | 2 | 3 | 3 | 3 | 2 | 3 | 2 |
| So-2: Occupant Comfort—Visual Comfort | 4 | 3 | 3 | 4 | 4 | 3 | 2 | 2 |
| So-3: Occupant Comfort—Thermal and Acoustic Comfort | 2 | 1 | 0 | 2 | 2 | 1 | 1 | 2 |
| So-4: Occupant Comfort—Indoor Air Quality | 6 | 4 | 2 | 5 | 6 | 4 | 3 | 3 |
| So-5: Socio-Economic Strategies—Safety and Sanitation for Construction Workers | 1 | 1 | 1 | 1 | 1 | 1 | 1 | 1 |
| So-5: Socioeconomic Strategies—Universal Accessibility | 2 | 1 | 1 | 2 | 2 | 1 | 1 | 2 |
| So-6: Socioeconomic Strategies—Dedicated Facilities for Service Staff | 2 | 1 | 1 | 2 | 2 | 1 | 1 | 2 |
| So-7: Socioeconomic Strategies—Positive Social Impact | 4 | 2 | 3 | 3 | 4 | 2 | 3 | 3 |
| Ec-1: Life Cycle Costing—Life Cycle Costing Analysis | 5 | 3 | 4 | 5 | 5 | 2 | 4 | 3 |
| En-1: Sustainable Site Planning—Green Infrastructure | 2 | 2 | 1 | 2 | 2 | 2 | 2 | 1 |
| En-2: Sustainable Site Planning—Low-Impact Design Strategies | 5 | 3 | 2 | 4 | 5 | 3 | 3 | 4 |
| En-3: Sustainable Site Planning—Low-Impact Design Strategies | 2 | 1 | 1 | 2 | 2 | 1 | 1 | 1 |
| En-4: Construction Management—Air and Soil Pollution Control | 1 | 1 | 1 | 1 | 1 | 1 | 0 | 1 |
| En-5: Construction Management—Topsoil Preservation | 1 | 0 | 1 | 1 | 1 | 1 | 0 | 1 |
| En-6: Construction Management—Construction Management Practices | 2 | 1 | 2 | 2 | 2 | 1 | 1 | 2 |
| En-7: Energy Optimization—Energy Optimization | 12 | 8 | 10 | 10 | 12 | 7 | 8 | 4 |
| Energy Optimization—Renewable Energy Utilization | 5 | 4 | 3 | 4 | 5 | 2 | 2 | 3 |
| En-8: Energy Optimization—Low ODP and GWP Materials | 1 | 0 | 0 | 1 | 1 | 0 | 1 | 1 |
| En-9: Water Management—Water Demand Reduction | 3 | 2 | 2 | 3 | 3 | 2 | 3 | 2 |
| En-10: Water Management—Wastewater Treatment | 3 | 1 | 2 | 3 | 3 | 2 | 2 | 2 |
| En-11: Water Management—Rainwater Management | 5 | 4 | 3 | 3 | 5 | 2 | 4 | 3 |
| En-12: Water Management—Water Quality and Self-sufficiency | 5 | 3 | 2 | 2 | 5 | 1 | 3 | 2 |
| En-13: Solid Waste Management—Waste Management-Post Occupancy | 4 | 4 | 3 | 3 | 4 | 3 | 4 | 4 |
| En-14: Solid Waste Management—Organic Waste Treatment On-site | 2 | 2 | 2 | 2 | 2 | 1 | 2 | 2 |
| En-15: Sustainable Building Materials—Utilization of Alternative Materials in Building | 5 | 3 | 4 | 4 | 5 | 3 | 4 | 3 |
| En-16: Sustainable Building Materials—eduction in GWP through Life Cycle Assessment | 5 | 3 | 2 | 3 | 5 | 3 | 2 | 3 |
| En-17: Sustainable Building Materials—Alternative Materials for External Site Development | 2 | 1 | 0 | 1 | 2 | 1 | 1 | 1 |
| En-18: Performance Metering and Monitoring—Commissioning for Final Rating | 0 | 0 | 0 | 0 | 0 | 0 | 0 | 0 |
| En-19: Performance Metering and Monitoring—Smart Metering and Monitoring | 6 | 4 | 3 | 5 | 6 | 4 | 4 | 4 |
| En-20: Performance Metering and Monitoring—Operation and Maintenance Protocol | 0 | 0 | 0 | 0 | 0 | 0 | 0 | 0 |
| Case-1 | Case-2 | Case-3 | ||||
|---|---|---|---|---|---|---|
| Pre-Construction Phase | Construction Phase | Pre-Construction Phase | Construction Phase | Pre-Construction Phase | Construction Phase | |
| Social Score | 15 | 14 | 22 | 15 | 15 | 17 |
| Economic Score | 3 | 4 | 5 | 2 | 4 | 3 |
| Environment Score | 47 | 44 | 56 | 38 | 47 | 44 |
| Normalized Social Score | 0.625 | 0.583 | 0.92 | 0.625 | 0.625 | 0.71 |
| Chain Index (SOPn) | 1.00 | 0.93 | 1.00 | 0.68 | 1.00 | 1.14 |
| Normalized Economic Score | 0.60 | 0.80 | 1.00 | 0.40 | 0.80 | 0.60 |
| Chain Index (ECPn) | 1.00 | 1.33 | 1.00 | 0.40 | 1.00 | 0.75 |
| Normalized Environment Score | 0.66 | 0.62 | 0.79 | 0.54 | 0.66 | 0.62 |
| Normalized Environmental Pressure Score | 0.34 | 0.38 | 0.21 | 0.46 | 0.34 | 0.38 |
| Chain Index (ENPn) | 1.00 | 1.12 | 1.00 | 2.19 | 1.00 | 1.12 |
| Cumulative Score | 65 | 62 | 83 | 55 | 66 | 64 |
| # GRIHA rating | *** | *** | **** | ** | *** | *** |
| Chain Number | 1.00 | 0.95 | 1.00 | 0.66 | 1.00 | 0.64 |
| PWBDI | 0.83 | 0.31 | 1.02 | |||
| Remark | Decrease in social well-being with the increase in environmental pressure | Decrease in social well-being with the increase in environmental pressure | An increase in social well-being exceeds the increase in environmental pressure | |||
| PIDI | 1.19 | 0.18 | 0.67 | |||
| Remark | An increase in economic well-being exceeds the increase in environmental pressure | Decrease in economic well-being with the increase in environmental pressure | Decrease in economic well-being with the increase in environmental pressure | |||
| Categorization | Acceptable region | Prohibited region | Acceptable region | |||
Publisher’s Note: MDPI stays neutral with regard to jurisdictional claims in published maps and institutional affiliations. |
© 2021 by the authors. Licensee MDPI, Basel, Switzerland. This article is an open access article distributed under the terms and conditions of the Creative Commons Attribution (CC BY) license (https://creativecommons.org/licenses/by/4.0/).
Share and Cite
Srivastava, S.; Raniga, U.I.; Misra, S. A Methodological Framework for Life Cycle Sustainability Assessment of Construction Projects Incorporating TBL and Decoupling Principles. Sustainability 2022, 14, 197. https://doi.org/10.3390/su14010197
Srivastava S, Raniga UI, Misra S. A Methodological Framework for Life Cycle Sustainability Assessment of Construction Projects Incorporating TBL and Decoupling Principles. Sustainability. 2022; 14(1):197. https://doi.org/10.3390/su14010197
Chicago/Turabian StyleSrivastava, Shivam, Usha Iyer Raniga, and Sudhir Misra. 2022. "A Methodological Framework for Life Cycle Sustainability Assessment of Construction Projects Incorporating TBL and Decoupling Principles" Sustainability 14, no. 1: 197. https://doi.org/10.3390/su14010197
APA StyleSrivastava, S., Raniga, U. I., & Misra, S. (2022). A Methodological Framework for Life Cycle Sustainability Assessment of Construction Projects Incorporating TBL and Decoupling Principles. Sustainability, 14(1), 197. https://doi.org/10.3390/su14010197