Abstract
A variety of policy types are available to foster the transition to a low-carbon economy. In every sector, including transportation, heat and power production, policymakers face the choice of what type of policy to adopt. For this choice, it is crucial to understand how different mechanisms incentivize investments in terms of improving their profitability, shaping the flexibility available for investors, and how they are affected by the surrounding uncertainty. This paper focuses on transportation-biofuel policies, particularly on the financial incentives put on the bio-component of fuel and the combination of using penalties and tax-relief. Delivery of vital policymaking insights by using two modern simple-to-use profitability analysis methods, the pay-off method and the simulation decomposition method, is illustrated. Both methods enable the incorporation of uncertainty into the profitability analyses, and thus generate insight about the flexibilities involved, and the factors affecting the results. The results show that the combination of penalties and tax-relief is a way to steer fuel-production towards sustainability. The two methods used for analysis complement each other and provide important insights for analysis and decision-making beyond what the commonly used profitability analysis methods typically provide.
1. Introduction
In the fight against climate change, multiple environmental policies arise to guide the markets towards a sustainable future [1]. Such policies aim to steer new investments towards cleaner technology choices. Better energy efficiency, greener heat and power production, electric vehicles and biofuels in the transportation sector-are among the means to reduce emissions [2]. In this paper we concentrate on biofuel-related support policies and how the profitability effect of these policies can be analyzed ex-ante with modern analysis methods.
Green investments are still generally characterized by high costs relative to older technologies and high uncertainty is involved [3,4] (in the power sector many types of renewables are already cheaper than conventional generation [5], but extra costs arise due to their intermittency when the system reliability issues are taken into account [6,7,8]). For these reasons support mechanisms that are meant to incentivize green investments have been put in place. Many of the support mechanisms are based on simple policies that guarantee profitability by way of providing extra revenue to the investment [1]. Simply providing extra revenue however often leads to a too high subsidy level and consequently may cause policy changes [9,10]. As predictability and a low political-risk environment is crucial in attracting long-term investments, it is important to design policies that address investment risks and uncertainties [11,12] in a way that does not require unexpected and dramatic adjustments. Pre-analysis of the policy effects is important for succeeding in the creation of such policies, thus the issue of using proper analysis-techniques is highlighted.
The ex-ante analysis of the profitability of complex investment projects and the ex-ante analysis of the profitability effects of specific policies often includes the use of methods that allow for a comprehensive inclusion of the risks and uncertainties that surround the studied cases [13,14]. Methods that underlie modern real option analysis are such methods and real option thinking is a framework that supports the inclusion of uncertainty in the ex-ante profitability analysis context. Real options thinking recognizes and acknowledges the value of flexibility in the face of uncertainty and embraces the thinking that flexibility that is, the ability to steer/change an investment when change takes place, should be built into investments when it can be done in a cost-effective way. This observation has instigated a whole new “world” in investment design, where flexibility is pre-planned into investments in cases where the investment has a high likelihood of facing dramatic enough changes in its environment (markets). These analyses combine the study of uncertainty and flexibility simultaneously. To mention a few typical types of flexibility that allow investment managers to steer investments towards better outcomes when change takes place, we mention an option to delay investment, options related to scaling the size of investments up and down, option to temporarily shut down an investment, and options to change inputs and outputs to/from (typically production) investments [15,16,17,18]. Pre-investment planning and testing the effect of construction of flexibility into investments is something that can still be said to be “young” in terms of how widespread it is in the industry, some academic research on the topic exists, see, for example, [19].
Taking this thinking of combining the study of uncertainty and policy-induced flexibility into the world of ex-ante policy evaluation is also new and in the context of supporting policies for green investments it is very new. Some previous academic work, concentrating on renewable energy support mechanisms exists, see, e.g., [10,17,20]. In other words, the “concept” of what we are looking at here is the study of how policies and support mechanisms created to incentivize green investments may be constructed in a way that they include flexibility and thus change, when changes in the “environment in which the policy exists” take place. Furthermore, how the flexibility within the policies affects the investments which the policies are aimed at incentivizing is focal here. It seems rational to expect that similar methods that work for real option analysis (ex-ante analysis of effects of flexibility) for investments work also for ex-ante policy evaluation.
In this vein, in this paper we select two modern analysis techniques used in the analysis and the valuation of flexibility, the pay-off method [21] and (Monte Carlo) simulation based analysis, called “simulation decomposition” [22] and use them to study incentive-policies in the context of biofuels. The reason for selecting these two methods is the fit of these methods to the type of uncertainty that surrounds the context of biofuel-policies [23]. These methods have also previously been used in the analysis of environmental policies [24,25,26].
To the best of our knowledge this is the first time these techniques are applied in the context of biofuel-policy evaluation. The application of the methods, the analyses, and the obtained results are illustrative, yet helpful in understanding the benefits brought about by using modern analysis methods in the context of ex-ante policy evaluation.
The remainder of the paper is structured as follows. First, we provide a brief overview of the biofuel-policies to introduce the context of the case study. Then we introduce the two methods, the pay-off method and simulation decomposition. We illustrate the use of the methods in the analysis of a biofuel-policy. The discussion and conclusion section summarizes and discusses the results, looks into the comparative performance of the used methods, and outlines implications for policy analysis.
Biofuel Promotion Schemes
In the context of the transportation sector, there are two main directions in the overall policy efforts directed at the fuels used, to make the sector more environmentally conscious [1,27]. One policy-direction aims at the electrification of traffic and another pursues the substitution of fossil fuels with biofuels. As discussed above, here we concentrate on the second-mentioned policy focus.
As with the widely spread tariff-based support instruments in the power sector, some countries opt for financial incentives to promote biofuels. Thailand directly subsidizes the retail price of biofuel, while the US and Brazil chose tax-relief [1]. Nevertheless, such financial incentives remain an unpopular policy choice in the world.
One of the most common policies is the biofuel blending mandate [1]. Such a policy imposes a requirement on fuel-suppliers to supply a certain minimum share of biofuels in the fuel mix. The European Union has adopted this policy. The EU 32% renewable energy target in the overall energy consumption by 2030 has been supplemented with a sub-target for the transport sector equaling a 14% share of renewables in the supplied fuel mix [28]. Member states are free to set higher targets. Finland, for example, imposes a mandate on fuel suppliers to introduce a gradually growing share of renewable fuels in road transport, reaching 30% by 2029 [29]. Overall, 70 countries around the world have a biofuel blending mandate, however, if left without enforcement achieving the set goals may be jeopardized [1].
Many countries use penalties to enforce biofuel mandates, the list includes Germany, Finland, Italy, and Sweden [30]. In Finland, if the fuel supplier fails to ensure the required volume of biofuels on that specific year of gradual mandate increase, the fuel supplier must pay penalties for each excess liter of fossil fuel produced [29]. The Finnish Government sets the amount of penalty to be 0.04 EUR/MJ, which corresponds to 1355 EUR/liters of diesel equivalent [31]. In addition to penalties, Finland employs tax-relief for renewable fuels. Overall, the biofuel gets a 0.30 EUR/l tax discount if produced purely, and 0.26 EUR/l if in the mix with fossil fuel [32].
Considering the world experience with different policies to support biofuels, we choose to comparatively analyze direct financial incentive, and the combination of penalties and tax-relief, contrasting their policy effects with the benchmark case of no policy support in place.
2. Methods and Data
Both methods presented here are based on the fundamental concept of the time value of money and discounted cash-flows [33]. Both methods require constructing a cash-flow model of the investment project and computing its net present value (NPV). Both methods are based on constructing a distribution of possible project NPVs to present and handle the uncertainty that surrounds the investment. The fuzzy pay-off method operates partly in the possibilistic framework and builds a possibilistic NPV distribution or, put simply, a fuzzy number NPV. Simulation decomposition is based on probabilistic Monte Carlo simulation and utilizes the resulting probability distribution of NPVs further to decompose it into input-output analysis-based cohorts. The two methods are described in more detail below.
2.1. Pay-Off Method
The fuzzy pay-off method [21,34] approaches building the distribution through setting scenarios. Usually, three scenarios are defined, pessimistic, realistic, and optimistic, although more can be created if reasonable. First, managers are asked to provide estimates of input values, like costs, prices, production volumes, etc., for every scenario. The idea is to generate the estimates for the worst possible scenario (pessimistic) such that nothing worse can happen, for the best possible scenario (optimistic) such that nothing “better” can be expected to happen, and the one with the most realistic estimates (realistic or best estimate). Second, net present value is calculated for each scenario. Third, the three NPVs are used to form a triangular pay-off distribution for the project NPVs are mapped on the value (x) axis, while the y-axis depicts the membership degree within the set of possible outcomes. Full membership (equal to 1) is assigned to the “realistic” scenario value, and limit to zero membership to the pessimistic and the optimistic scenario NPVs, implying that anything worse or better correspondingly is not expected to take place. The relationship between the positive and the negative and the realistic scenario value is assumed to be linear. Thus, in the final stage, a triangle is formed that represents the possibilistic range of the project’s NPVs and that is treated as a triangular fuzzy number, for details see [13,26].
Descriptive statistics can be calculated directly from the pay-off distribution and accompany the material provided for decision-making. For example, the mean value of the distribution and the variance can be calculated. Furthermore, the real option value can be computed based on the expected mean of the positive part of the distribution [34,35]. The main steps of the method are visualized in Figure 1.
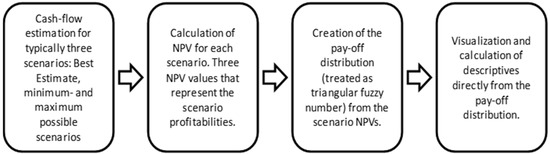
Figure 1.
The fuzzy pay-off method in four steps.
The fuzzy pay-off method has been used in many application areas, including energy and oil investments [26,36,37,38], screening and selection of research and development projects [39,40], and management of a patent portfolios [41].
2.2. Simulation-Based Profitability Analysis and Simulation Decomposition
Simulation-based analysis is based on two parts, one part is a (computer) model that contains stylized (often much-simplified) structure of the studied system that nevertheless carries a strong resemblance with reality. The system model includes a number of inputs and outputs to and from the system that can be studied to understand what the system “does”. The best system models have a high requisite variety (requisite complexity) [42] and thus offer relatively high credibility by way of fidelity with the real world. System-models may also be dynamic and change as a function of (simulation) time. The second part is simulation, which is typically arranged by means of automated software inputting a large number of input variable-combinations (vectors, input scenarios) into the system and collecting the corresponding output values. The input value-combinations are selected from input-value distributions that are pre-determined for each input (and may also be single values, crisp). The output-values are typically presented as histograms or frequency distributions and it is common to assume that the distribution is a probabilistic representation of the occurrence frequency of the outputs from the system. A Monte Carlo simulation is a simulation, where the input value selection is made randomly by the simulation software from the input-value distributions for a typically pre-set number of times [43,44].
In the context of ex-ante profitability analysis or policy-effect analysis the system underlying the simulation analysis is the profitability analysis cash-flow model of the investment that is facing the policy, and the cash-flows that are received by the investment are regulated by the policy as a function of the environment that the investment is facing, described in terms of the input-variable value-combinations. This means that the system used includes both the profitability analysis model and the policy-model. The simulation software is then used to reveal the outputs from the system under various (randomly drawn) real-world scenarios [45,46].
Simulation decomposition is based on the Monte Carlo simulation framework and thus, in contrast with the pay-off method, belongs to the probabilistic framework. Simulation Decomposition decomposes the results of the simulated output probability distribution into sub-distributions that are matched with the input variable value range combinations from which they result. The input range combinations can be understood as scenarios. This input-output matching reveals important information about cause and effect and allows decision-makers to better understand what effect the various scenarios will have on the output. The procedure is based on (i) identifying the relevant variables that can be affected by the project owner, their relevant “states”, and boundaries for each state; (ii) forming “groups” or scenarios by combining the states; (iii) running the simulation, while keeping track on the input-output “inference”; (iv) visualizing the results such that the outcome resulting from each input group (scenario) is separately visualized and allows better understanding of “what leads to what”. The procedure is depicted in Figure 2. The detailed description of the procedure, how the results from it are visualized, and available implementation tools can be found in [22,47].
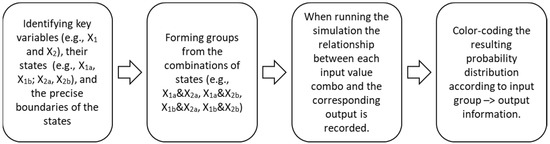
Figure 2.
Schematic visualization of the simulation decomposition procedure.
If simulation decomposition is performed by using a single variable, one can see the influence of this variable on the outcome in the presence of other uncertainties. The two extremes would be zero (low) influence, if all the scenarios are “lying” on top of each other (share same output values on the x-axis), and strong influence, if the scenarios are vertically separated from each other (do not share same output values on the x-axis). If the decomposition is performed by using two or more variables, one can observe the interplay of variables and possible synergies, if any are hidden in the system. The more nonlinearities and various what-if rules the system has, the more valuable the decomposition potentially becomes.
Simulation decomposition has demonstrated its value in renewable energy policy analysis [22,48], in other environmental policy issues [25,49], and can be generally applied to any problem modeled with Monte Carlo simulation independent of the context [47].
A similar scenario decomposition can be made within the possibilistic framework, by framing an input-output system by using a fuzzy inference system (FIS), see [24]. This approach has benefits and drawbacks. Using FIS avoids simulation and thus requires less computational time, however, the necessity of manual construction of the many scenarios typically overrides the time savings. In the simulation decomposition method, scenarios are created and valued automatically, based on the user-specified partitions of the input variables.
2.3. Numerical Assumptions
This study makes numerical assumptions based on publicly available literature and following the practice presented in [50]. The economic life of a biorefinery plant typically varies between 20–25 years, and in this study, the lifetime of 20 years is used. The corporate tax-rate is assumed to be 20% and the discount is set at 10%. The numerical assumptions about the biofuel production-plant investment are estimates taken from [51]. These estimates include the investment cost of a 500 million liters per year of renewable diesel production 430 M€ and operating cost of 0.86 EUR/liter. The assumptions related to policies supporting the use of biofuels are related to the Finnish biofuel policy. Tax-rates used in this study are retrieved from the Finnish Tax Administration (2021), and the amount of penalty for not achieving the required share of biofuels is retrieved from the decisions of the Finnish Parliament (2018). All numerical assumptions made in this study are listed in Table 1.

Table 1.
Numerical assumptions for the studied system.
3. Results
To analyze the effects of different policies, we take an investor’s perspective. We assume a fuel producer already has facilities for producing fossil fuel. The producer has a choice to invest in biodiesel production to produce fuel blend, or to leave the business as is. The profitability of the operations with and without biofuel investment is analyzed under different policy types. In particular, we consider the cases with (i) no support (benchmark), (ii) a financial incentive, and (iii) a biofuel mandate reinforced by tax-relief and penalties.
3.1. The Pay-Off Method Based Analysis
For the pay-off method case, instead of assuming variations in many input parameters of the investment, we elect to let only the biofuel blend vary. This means that we calculate, ceteris paribus, the net present value of an investment with three different biofuel blend scenarios.
We assign the “30% biofuel blend” as be the base case scenario and consider two extreme scenarios, “standalone conventional fuel production”, and “pure biofuel production”. This way, we isolate the effect of different policies on the decision with respect to the fuel blend only. The resulting fuzzy NPV distribution demonstrates the effect of different fuel blends on the NPV. In the case of no policy support, Figure 3, only fossil fuel production is profitable. Investment in biofuel facilities deteriorates the profitability compared to only fossil fuel production. Already 30% share of biofuel makes the operations unprofitable, whereas pure biofuel production is in deeply negative territory.
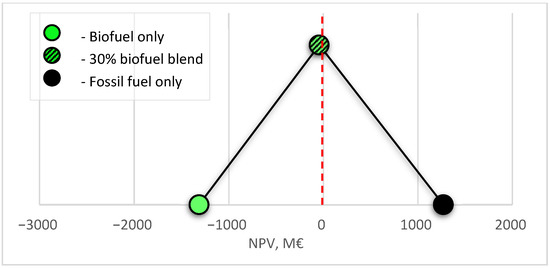
Figure 3.
Pay-off net present value (NPV) distribution of fuel production with different fuel blends under no support.
Paying a financial subsidy for every liter of biofuel produced shifts the profitability of the 30% blend scenario and the biofuel only scenario, Figure 4. The 30% blend scenario becomes profitable. Pure biofuel production lags behind and still remains unprofitable, due to the heavier cost structure. Profitability of the fossil fuel production remains unchanged and remains the most profitable option.
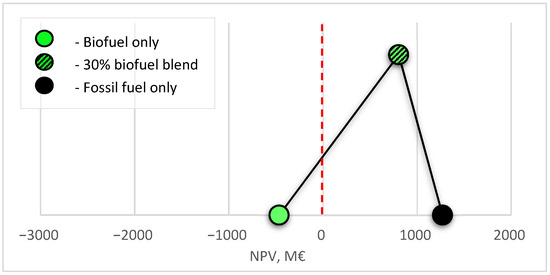
Figure 4.
Pay-off net present value (NPV) distribution of fuel production with different fuel blends under financial incentive.
The combination of tax-relief for biofuel and penalties for not reaching the blending target creates a very different picture, Figure 5. The tax-relief has a similar effect on the 30% blend scenario and the biofuel only scenario, as financial incentives. The 30% blend scenario is profitable, while the biofuel-only production remains in the negative profitability zone. In contrast to financial benefits, the fossil fuel only scenario becomes deeply unprofitable due to the penalties. Only penalties create this effect since in the previous policy situations (Figure 3 and Figure 4) the fossil fuel production is profitable. Thus, the combination of penalties and tax-relief generates a two-fold effect, making biofuel blend production attractive to the investors, while discouraging fossil fuel only production.
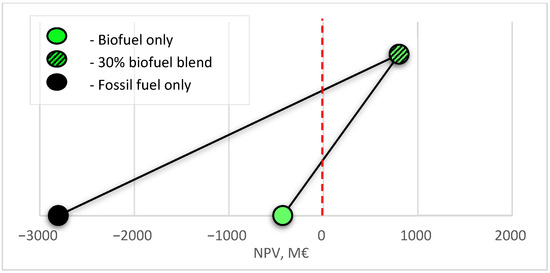
Figure 5.
Pay-off net present value (NPV) distribution of fuel production with different fuel blends under a combination of penalties and tax-relief.
Overall, use of the fuzzy pay-off method, when only the change in the critical parameter is analyzed, enables a clear demonstration of the effects of different policies.
However, the system studied is surrounded by uncertainties, and the critical one is the fuel-price uncertainty that, according to [50], has a major influence on the profitability of the operations compared to all other factors. Therefore, to further analyze the policy effects, we should have a method that is able to capture the interplay of several sources of uncertainty simultaneously, for this we turn to Monte Carlo simulation and the simulation decomposition method.
3.2. Simulation Decomposition Based Analysis
Simulation decomposition is based on the Monte Carlo simulation. The same underlying assumptions and NPV cash-flow model that is used for the pay-off method-based analysis is utilized for the simulation. The variation of input variables is allowed for multiple variables simultaneously.
The fossil fuel production is assumed to be preexistent, and its size is now considered fixed, while the size of the biofuel production is relaxed and ranges from 0 to 1000 million liters per year that corresponds to the variation of the share of the biofuel in the fuel blend from 0 to 46%. For simplicity, the investment cost is assumed to be a linear function of the production quantity. Thus, we are not looking at a separate pure biofuel production anymore, but at the fossil fuel production supplemented with biofuel.
The second source of uncertainty is the price of the final product. We assume it to be independent of the fuel-mix sold and to vary in the upper range from the current level from 1.0 to 1.5 EUR/liter. Clearly, the biofuel blends are expected to be sold at a premium compared to fully fossil fuel, however, a natural fuel-price variation exists among countries [54] and fuel-producers might be willing to consider different price-levels independently of their production-blend. Both sources of uncertainty are modeled with a uniform distribution. The uniform distribution, compared to, e.g., a normal distribution, places more weight on the extreme values and thus, creates a more detailed picture of the extent of policy effects.
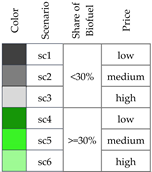
For the decomposition, we break down the biofuel production-size into two ranges–below the 30% share blend (0–500 million liters per year) and to equal or above 30% (500–1000 million liters per year). The price-range is divided into three equally “wide” pieces, see Table 2. The overall number of all possible combinations of these two variables’ states or scenarios is six.
Table 2.
Assumptions for Monte Carlo simulation and simulation decomposition.
In the absence of support (Figure 6) fossil fuel production with less than 30% of biofuel (sc1–3) is profitable in the high price region and partially profitable in the medium price region. Producing higher shares of biofuel in the blend becomes unprofitable in the low-price region (sc4) and only slightly less profitable in the medium and high price regions (sc5,6). This happens, because at these high prices the standalone biofuel production becomes less unprofitable and therefore adding more production facilities does not harm the profitability of the current fossil-fuel production that much.
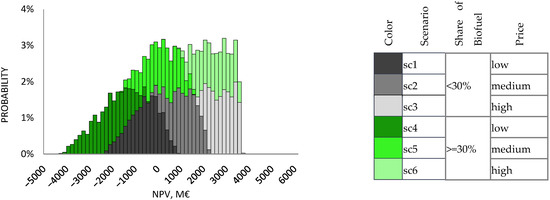
Figure 6.
Simulation decomposition for fuel production net present value (NPV) with different fuel blends and price uncertainty under no support.
Under the financial incentive, we can see a shift of the higher-share biofuel production (sc4–6) into a more profitable range, while the less share biofuel production (sc1–3) remains relatively unchanged (Figure 7), a similar phenomenon to what was seen with the fuzzy pay-off method (Figure 2) is revealed. This happens, because the financial incentive is paid per liter of biofuel produced in the blend and affects more the higher-share operations. Nevertheless, the overall picture has not changed much. The price variation dilutes the effect of the subsidy. Scenarios with high prices (sc3,6) are profitable in both, the no-support situation and with the financial subsidy, which translates into a deteriorated incentive to increase the share of biofuel production, when the future price development is uncertain.
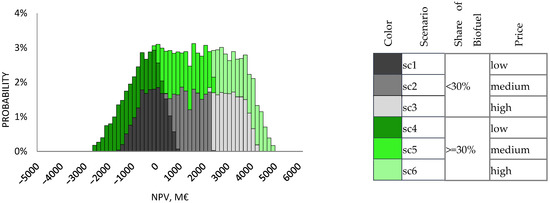
Figure 7.
Simulation decomposition for fuel production net present value (NPV) with different fuel blends and price uncertainty under financial incentive.
Figure 8 demonstrates how different the profitability of fuel-blend production looks like under the combination of penalties and tax-relief. The lower bounds of low-share biofuel production (sc1–3), which represent the standalone conventional fuel production, are all pushed into the negative profitability zone. of the cases within these scenarios that are closer to the 30% biofuel requirement still stay in the positive profitability zone. The high biofuel share operations are almost entirely found to be in the positive profitability range due to the tax-relief and the absence of penalties. The difference remains sharp even under the vast price uncertainty. This contrast between the green (sc4–6) and the fossil scenarios (sc1–3) is an embodiment of the incentive to switch to the production of a high share of biofuel blend.
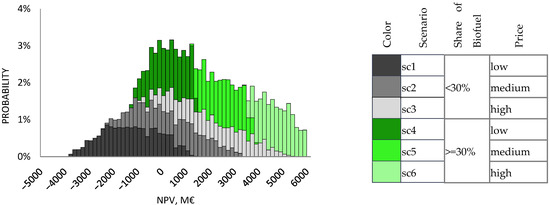
Figure 8.
Simulation decomposition for fuel production net present value (NPV) with different fuel blends and price uncertainty under a combination of penalties and tax-relief.
The above-described differences between the effects the different policies become even more evident, if the graphs are presented together, see Table 3.
Table 3.
Summary of the results.
4. Discussion
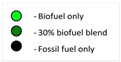
All obtained graphical results are demonstrated side by side in Table 3. The pay-off method (column 2) shows the distributions with only fuel mix variations between the extremes of standalone fossil fuel and pure biofuel production scenarios. The simulation decomposition technique (column 3) is applied to a case with fixed fossil fuel production size, variable biofuel addition, and price uncertainty. The important difference is that the pay-off distribution is constructed out of discreet scenarios, whereas probability distributions display the continuous change of the size of the biofuel production. For the simplicity of representation, the graphs are stripped from axes and titles, however, the scale is kept consistent within the columns and the zero profitability is marked with the red dashed line and aligned within each column. Different policy types are shown in rows, and the final row presents the legends for the graphs for convenience.
The general pattern that can be observed is that no matter which analysis technique we are using, the first two rows in Table 3 look similar. Financial incentive (B) improves the profitability of the biofuel blends production, but does not change the entire picture especially, when considering different price levels (E). It can be concluded that this policy-type introduces more flexibility for investors by enabling other profitable options in addition to the conventional ones. Tax-relief alone would have the same effect as the financial incentive. One can observe that biofuel only and 30% biofuel blend scenarios have the same NPV with the pay-off method under the financial incentive (B) and the combination of penalties and tax-relief (C). The price-variation accounted for in the simulation decomposition method, pushes the profitability of high-share of biofuel scenarios (sc4–6) upwards in the “penalties & tax-relief” policy (F) in comparison to the financial incentive only policy (E). In addition, the penalties change the profitability outlook for fossil fuel as well. Both methods show that fossil fuel production becomes deeply unprofitable when penalized (C, F). Such an effect translates into shrinking flexibility for investors. Under this policy type the only profitable choice is the biofuel blend.
Biofuel production is more costly than conventional fuel production, and therefore, requires subsidies. Production of biofuel alone seems to be too expensive under any policy. However, co-production becomes profitable in the case of the combined penalties and tax-relief policy and the financial incentive. Financial incentives alone do not discourage offering 100% fossil fuel, whereas the combined policy does by means of penalties. A policy that is a mix of penalties and incentives may help the industry navigate efficiently towards a desired outcome. These conclusions are shown to be “obtainable” with the pay-off method and the simulation decomposition method. This is in line with the previous use of the pay-off method in comparing different projects [40,55] or scenarios of the same project [56]. Here the use of the method was not exactly what has been seen before as the variation was in terms of policies, which makes this research novel in that respect also from the methodological point of view.
To complement the analysis with the pay-off method, we have used the simulation decomposition method. As a standalone technique, simulation decomposition has often been used for policy analysis [25,57]. In this research we have combined market, fuel price, and investment factors. Such a combination has allowed us to observe possible preferences of investors that depend on market development. The results allow us to see the effect of both uncertainty and the joint effect of these factors simultaneously.
While the pay-off method exposes the policy effects on a key decision of how much biofuel to introduce to the blend, simulation decomposition complements the analysis by incorporating market uncertainty into the investment profitability profile.
Previous academic literature has pointed out the possibility of adopting complex and sophisticated methods for the ex-ante study of policy effects and a quasi-unanimous conclusion found in the literature is that ex-ante policy decision-making support is crucial also in the shift towards more renewable fuels. Araujo Enciso et al. [58] arrive at this conclusion by using a sophisticated stochastic recursive-dynamic multi-commodity model. Moncada et al. [59] employ a complex multi-agent model to show that a combination of penalties for fossil fuel with incentives for biofuel provides the best biofuel adoption results. In this paper, we demonstrate that novel, but simple-to-implement and understand methods are able to keep up with more complex techniques in terms of analytical richness both in the inclusion of multiple variables and especially in the provision of visual and in-depth insights for decision-making.
Based on what has been seen here we are ready to recommend the combined use of the fuzzy pay-off method and the simulation decomposition for ex-ante policy analysis and more generally for gaining better understanding of profitability analysis problems with several key factors the interplay of which have an effect on the end result.
5. Conclusions
This paper showcases the use of the two modern profitability analysis techniques, the fuzzy pay-off method, and simulation decomposition, in the environmental policy analysis. Both methods are able to depict uncertainty, and when used in conjunction, provide important insights for ex-ante analysis of policy effects. Both methods are relatively easy to implement, and their results are easy to visualize and interpret, which, coupled with their analytical power, make them appealing candidates for tools used for policy analysis. We analyzed policies to incentivize investments in biofuel production in the transportation sector. The illustrative conclusion reached is that a combination of penalties and tax-relief is a realistic policy alternative for sustainability transition.
Our conclusions are based on a stylized investment case and numerical assumptions available for Finland. If the analysis is performed for another country, the numerical assumptions need to be modified. However, we are employing methods that can handle uncertainty, data variation and imprecision. Wide ranges of input factors are considered. Therefore, we believe that our conclusions hold under a variety of circumstances and are generalizable.
Extending the range of applications and exploring complementarity of the considered techniques with other approaches are possible directions for future research.
Author Contributions
I.R.: conceptualization, data curation, methodology, writing—original draft preparation, and visualization; M.K.: conceptualization, data curation, methodology, writing—original draft preparation, writing—review and editing, and visualization; M.C.: conceptualization, methodology, and writing—review and editing. All authors have read and agreed to the published version of the manuscript.
Funding
The authors acknowledge funding received from the Foundation of Economic Education, grant number 200153, and the support from the Finnish Strategic Research Council (SRC) at the Academy of Finland through the Manufacturing 4.0-project, grant number 335980 and grant number 335990.
Institutional Review Board Statement
Not applicable.
Informed Consent Statement
Not applicable.
Data Availability Statement
All used data is presented in the manuscript.
Conflicts of Interest
The authors declare no conflict of interest.
References
- REN21 Renewables 2020 Global Status Report. 2020. Available online: http://www.ren21.net/wp-content/uploads/2018/06/17-8652_GSR2018_FullReport_web_final_.pdf (accessed on 13 December 2021).
- European Environmental Agency Urban Sustainability: How Can Cities Become Sustainable? Available online: https://www.eea.europa.eu/themes/sustainability-transitions/urban-environment (accessed on 13 December 2021).
- IEA Global EV Outlook 2021. Available online: https://www.iea.org/reports/global-ev-outlook-2021 (accessed on 13 December 2021).
- IEA Transport Biofuels. Available online: https://www.iea.org/reports/transport-biofuels (accessed on 13 December 2021).
- IEA Projected Costs of Generating Electricity 2020. Available online: https://www.iea.org/reports/projected-costs-of-generating-electricity-2020 (accessed on 13 December 2021).
- Kozlova, M.; Lohrmann, A. Steering Renewable Energy Investments in Favor of Energy System Reliability: A Call for a Hybrid Model. Sustainability 2021, 13, 13510. [Google Scholar] [CrossRef]
- Kozlova, M.; Overland, I. Combining capacity mechanisms and renewable energy support: A review of the international experience. Renew. Sustain. Energy Rev. 2021; 111878, in press. [Google Scholar] [CrossRef]
- Jakob, P.; Wagner, J. Optimal Allocation of Variable Renewable Energy Considering Contributions to Security of Supply. Energy J. 2021, 42, 1–35. [Google Scholar]
- Sendstad, L.H.; Hagspiel, V.; Mikkelsen, W.J.; Ravndal, R.; Tveitstøl, M. The impact of subsidy retraction on European renewable energy investments. Energy Policy 2022, 160, 112675. [Google Scholar] [CrossRef]
- Boomsma, T.K.; Linnerud, K. Market and policy risk under different renewable electricity support schemes. Energy 2015, 89, 435–448. [Google Scholar] [CrossRef]
- Kitzing, L.; Fitch-Roy, O.; Islam, M.; Mitchell, C. An evolving risk perspective for policy instrument choice in sustainability transitions. Environ. Innov. Soc. Transit. 2020, 35, 369–382. [Google Scholar] [CrossRef]
- Habermacher, F.; Lehmann, P. Commitment Versus Discretion in Climate and Energy Policy. Environ. Resour. Econ. 2020, 76, 39–67. [Google Scholar] [CrossRef] [Green Version]
- Trigeorgis, L.; Tsekrekos, A.E. Real Options in Operations Research: A Review. Eur. J. Oper. Res. 2018, 270, 1–24. [Google Scholar] [CrossRef] [Green Version]
- Kozlova, M. Real option valuation in renewable energy literature: Research focus, trends and design. Renew. Sustain. Energy Rev. 2017, 80, 180–196. [Google Scholar] [CrossRef]
- Savolainen, J.; Collan, M.; Luukka, P. Analyzing operational real options in metal mining investments with a system dynamic model. Eng. Econ. 2016, 62, 54–72. [Google Scholar] [CrossRef]
- De Oliveira, D.L.; Brandao, L.E.; Igrejas, R.; Gomes, L.L. Switching outputs in a bioenergy cogeneration project: A real options approach. Renew. Sustain. Energy Rev. 2014, 36, 74–82. [Google Scholar] [CrossRef]
- Kozlova, M.; Fleten, S.; Hagspiel, V. Investment timing and capacity choice under rate-of-return regulation for renewable energy support. Energy 2019, 174, 591–601. [Google Scholar] [CrossRef]
- Fleten, S.; Fram, B.; Ledsaak, M.; Mehl, S.; Røstum, O.E.; Ullrich, C.J. The Effect of Capacity Payments on Peaking Generator Availability in PJM; Local Energy, Global Markets. In Proceedings of the 42nd IAEE International Conference, Montreal, QC, Canada, 29 May–1 June 2019. [Google Scholar]
- Savolainen, J.; Pedretti, D.; Collan, M. Incorporating Hydrologic Uncertainty in Industrial Economic Models: Implications of Extreme Rainfall Variability on Metal Mining Investments. Mine Water Environ. 2019, 38, 447–462. [Google Scholar] [CrossRef] [Green Version]
- Kitzing, L.; Juul, N.; Drud, M.; Boomsma, T.K. A real options approach to analyse wind energy investments under different support schemes. Appl. Energy 2017, 188, 83–96. [Google Scholar] [CrossRef]
- Collan, M. The Pay-off Method: Re-Inventing Investment Analysis; CreateSpace Inc.: Charleston, NC, USA, 2012. [Google Scholar]
- Kozlova, M.; Collan, M.; Luukka, P. Simulation decomposition: New approach for better simulation analysis of multi-variable investment projects. Fuzzy Econ. Rev. 2016, 21, 3. [Google Scholar] [CrossRef]
- Collan, M.; Haahtela, T.; Kyläheiko, K. On the usability of real option valuation model types under different types of uncertainty. Int. J. Bus. Innov. Res. 2016, 11, 18–37. [Google Scholar] [CrossRef]
- Kozlova, M.; Collan, M.; Luukka, P. New investment decision-making tool that combines a fuzzy inference system with real option analysis. Fuzzy Econ. Rev. 2018, 23, 63–92. [Google Scholar] [CrossRef]
- Kozlova, M.; Yeomans, J.S. Multi-Variable Simulation Decomposition in Environmental Planning: An Application to Carbon Capture and Storage. J. Environ. Inform. Lett. 2019, 1, 20–26. [Google Scholar] [CrossRef] [Green Version]
- Hietanen, L.; Kozlova, M.; Collan, M. Analyzing Renewable Energy Policies–Using the Pay-off Method to Study the Finnish Auction-Based Renewable Energy Policy. J. Environ. Inform. Lett. 2020, 4, 50–56. [Google Scholar] [CrossRef]
- European Commission European Green Deal. Available online: https://ec.europa.eu/info/strategy/priorities-2019-2024/european-green-deal_en (accessed on 15 June 2021).
- European Commission Renewable Energy—Recast to 2030 (RED II). Available online: https://ec.europa.eu/jrc/en/jec/renewable-energy-recast-2030-red-ii (accessed on 15 June 2021).
- Finnish Parliament Act on the Use of Biofuels in Transport 2007/446 [in Finnish]. 2007. Available online: https://finlex.fi/fi/laki/ajantasa/2007/20070446 (accessed on 19 December 2021).
- International Council on Clean Transportation Advanced Biofuel Policies in Select EU Member States. 2018. Available online: https://theicct.org/sites/default/files/publications/Advanced_biofuel_policy_eu_update_20181130.pdf (accessed on 19 December 2021).
- Finnish Parliament Government Proposal HE 199 /2018 to the Parliament for Laws to Promote the Use of Biofuel [in Finnish]. 2018. Available online: https://www.eduskunta.fi/FI/vaski/HallituksenEsitys/Sivut/HE_199+2018.aspx (accessed on 19 December 2021).
- Finnish Tax Administration Tax Rates on Liquid Fuels. Available online: https://www.vero.fi/yritykset-ja-yhteisot/verot-ja-maksut/valmisteverotus/nestemaiset-polttoaineet/verotaulukot/ (accessed on 15 June 2021).
- Fisher, I. The Rate of Interest: Its Nature, Determination and Relation to Economic Phenomena; Macmillan: New York, NY, USA, 1907. [Google Scholar]
- Collan, M.; Fullér, R.; Mezei, J. A fuzzy pay-off method for real option valuation. J. Appl. Math. Decis. Sci. 2009, 2009, 165–169. [Google Scholar] [CrossRef] [Green Version]
- Stoklasa, J.; Luukka, P.; Collan, M. Possibilistic fuzzy pay-off method for real option valuation with application to research and development investment analysis. Fuzzy Sets Syst. 2021, 409, 153–169. [Google Scholar] [CrossRef]
- Bednyagin, D.; Gnansounou, E. Real options valuation of fusion energy R&D programme. Energy Policy 2011, 39, 116–130. [Google Scholar]
- Borges, R.E.P.; Dias, M.A.G.; Neto, A.D.D.; Meier, A. Fuzzy pay-off method for real options: The center of gravity approach with application in oilfield abandonment. Fuzzy Sets Syst. 2018, 353, 111–123. [Google Scholar] [CrossRef]
- Kozlova, M.; Collan, M.; Luukka, P. Comparison of the Datar-Mathews Method and the Fuzzy Pay-Off Method through Numerical Results. Adv. Decis. Sci. 2016, 2016, 7836784. [Google Scholar] [CrossRef] [Green Version]
- Hassanzadeh, F.; Collan, M.; Modarres, M. A practical approach to R&D portfolio selection using the fuzzy pay-off method. Fuzzy Syst. IEEE Trans. 2012, 20, 615–622. [Google Scholar]
- Collan, M.; Luukka, P. Evaluating R&D projects as investments by using an overall ranking from four new fuzzy similarity measure-based TOPSIS variants. Fuzzy Syst. IEEE Trans. 2014, 22, 505–515. [Google Scholar]
- Collan, M.; Kyläheiko, K. Forward-looking valuation of strategic patent portfolios under structural uncertainty. J. Intellect. Prop. Rights 2013, 18, 230–241. [Google Scholar]
- Ashby, W.R. Requisite variety and its implications for the control of complex systems. In Facets of Systems Science; Springer: Berlin/Heidelberg, Germany, 1991; pp. 405–417. [Google Scholar]
- Mooney, C.Z. Monte Carlo Simulation; Sage Publications: New York, NY, USA, 1997; Volume 116. [Google Scholar]
- Rubinstein, R.Y.; Kroese, D.P. Simulation and the Monte Carlo Method; John Wiley & Sons: Hoboken, NJ, USA, 2016; Volume 10. [Google Scholar]
- Platon, V.; Constantinescu, A. Monte Carlo Method in risk analysis for investment projects. Procedia Econ. Financ. 2014, 15, 393–400. [Google Scholar] [CrossRef] [Green Version]
- Kwak, Y.H.; Ingall, L. Exploring Monte Carlo simulation applications for project management. Risk Manag. 2007, 9, 44–57. [Google Scholar] [CrossRef]
- Kozlova, M.; Yeomans, J.S. Monte Carlo Enhancement via Simulation Decomposition: A “Must-Have” Inclusion for Many Disciplines. In INFORMS Transactions on Education; Institute for Operations Research and the Management Sciences (INFORMS): Catonsville, MD, USA, 2020. [Google Scholar] [CrossRef]
- Hietanen, L. Comparative Analysis of Renewable Energy Policy Schemes of Finland; LUT University: Lappeenranta, Finland, 2020. [Google Scholar]
- Deviatkin, I.; Kozlova, M.; Yeomans, J.S. Simulation decomposition for environmental sustainability: Enhanced decision-making in carbon footprint analysis. Socioecon. Plann. Sci. 2021, 75, 100837. [Google Scholar] [CrossRef]
- Ruponen, I. Profitability Analysis of Biofuels and the Impact of Biofuel Policies in Finland; LUT University: Lappeenranta, Finland, 2021. [Google Scholar]
- Festel, G.; Würmseher, M.; Rammer, C.; Boles, E.; Bellof, M. Modelling production cost scenarios for biofuels and fossil fuels in Europe. J. Clean. Prod. 2014, 66, 242–253. [Google Scholar] [CrossRef] [Green Version]
- Brown, T.R.; Thilakaratne, R.; Brown, R.C.; Hu, G. Regional differences in the economic feasibility of advanced biorefineries: Fast pyrolysis and hydroprocessing. Energy Policy 2013, 57, 234–243. [Google Scholar] [CrossRef] [Green Version]
- Landälv, I.; Waldheim, L.; van den Heuvel, E.; Kalligeros, S. Building Up the Future Cost of Biofuel; European Commission, Sub Group on Advanced Biofuels: Brussels, Belgium, 2017. [Google Scholar]
- IEA Fuel Price Distribution. Available online: https://www.iea.org/data-and-statistics/charts/fuel-price-distribution-2019 (accessed on 19 December 2021).
- Collan, M.; Fedrizzi, M.; Luukka, P. A multi-expert system for ranking patents: An approach based on fuzzy pay-off distributions and a TOPSIS–AHP framework. Expert Syst. Appl. 2013, 40, 4749–4759. [Google Scholar] [CrossRef]
- Kozlova, M.; Collan, M.; Luukka, P. Renewable Energy in Emerging Economies: Shortly Analyzing the Russian Incentive Mechanisms for Renewable Energy Investments. In Proceedings of the International Research Conference “GSOM Emerging Markets Conference-2015: Business and Government Perspectives”, New York, NY, USA, 15–17 October 2015. [Google Scholar]
- Kozlova, M.; Yeomans, J. Visual Analytics in Environmental Decision-Making: A Comparison of Overlay Charts versus Simulation Decomposition. J. Environ. Inform. Lett. 2021, 4, 93–100. [Google Scholar] [CrossRef]
- Enciso, S.R.A.; Fellmann, T.; Dominguez, I.P.; Santini, F. Abolishing biofuel policies: Possible impacts on agricultural price levels, price variability and global food security. Food Policy 2016, 61, 9–26. [Google Scholar] [CrossRef]
- Moncada, J.A.; Verstegen, J.A.; Posada, J.A.; Junginger, M.; Lukszo, Z.; Faaij, A.; Weijnen, M. Exploring policy options to spur the expansion of ethanol production and consumption in Brazil: An agent-based modeling approach. Energy Policy 2018, 123, 619–641. [Google Scholar] [CrossRef]


Publisher’s Note: MDPI stays neutral with regard to jurisdictional claims in published maps and institutional affiliations. |
© 2021 by the authors. Licensee MDPI, Basel, Switzerland. This article is an open access article distributed under the terms and conditions of the Creative Commons Attribution (CC BY) license (https://creativecommons.org/licenses/by/4.0/).