Article

Socio-Economic Drivers of Fish Species Consumption Preferences in Kenya’s Urban Informal Food System

1
Department of Agricultural Economics and Agribusiness Management, Egerton University, P.O. Box 536-20115 Egerton, Kenya
2
Wageningen Economic Research, Wageningen University & Research (WUR), Droevendaalsesteeg 4, 6708 PB Wageningen, The Netherlands
3
Department of Biological and Biomedical Sciences Technology, Laikipia University, P.O. Box 1100-20300 Nyahururu, Kenya
*
Author to whom correspondence should be addressed.
Sustainability 2021, 13(9), 5278; https://doi.org/10.3390/su13095278
Submission received: 25 February 2021 / Revised: 29 April 2021 / Accepted: 3 May 2021 / Published: 8 May 2021

Abstract

:
In an effort to contribute to resilient food and nutritional security in urban slums, a food system approach was applied to understand the key socio-economic factors driving fish species consumption in Kibera, the largest informal settlement in Africa located in Nairobi, Kenya. Data were collected from 385 randomly selected households using a structured questionnaire. A multivariate probit model was applied to estimate the relationship between the variables in order to determine the socio-economic drivers of preferences for different fish species. The results indicated that Lake Victoria sardine (Rastrineobola argentea) had the highest preference (73%) among the respondents, followed by Nile tilapia (Oreochromis niloticus) (70%) and Nile perch (Lates niloticus) (23%), respectively, with other fish species at 12%, including African catfish, marbled lungfish, common carp, fulu and tuna (Clarias gariepinus, Protopterus aethiopicus, Cyprinus carpio, Haplochromine cichlids and Thunnus sp., respectively). Large household size showed an increase in preference for the Lake Victoria sardine, while higher income influenced preference for Nile tilapia and Nile perch positively, implying that when more income is available, Nile tilapia is the preferred fish over other fish species. Increased fish prices positively influenced preference for Nile tilapia, which is explained by the willingness to pay extra for quality and origin, for instance, to avoid the cheaply cultivated Chinese fish. In the case of the Lake Victoria sardine, lower prices positively affected the preferences. Religious and cultural practices and beliefs influenced preference for species and consumption of fish. Residents who migrated from western Kenya had a higher preference for the Lake Victoria sardine, while residents born and raised in Kibera had a higher preference for Nile tilapia. Neighbourhood effects reduced the preference for consuming Nile perch. These findings provide insights into future market opportunities for specific target groups. For instance, given that small-sized fish like the Lake Victoria sardine is highly demanded, in order to increase resiliency in food and nutrition security, small-sized cheap Nile tilapia will have a large potential in the future, with ever higher demand specifically from the residents born and raised in Kibera.

1. Introduction

Cities around the world are increasing in size and complexity. Migration is an important driver in that it places increased pressure on population dynamics in urban areas [1]. Due to growing global urbanisation, urban slums or informal settlements are expanding specifically in developing countries, generally with large numbers of informal residents, insecure land tenure, dense population, poor quality housing and a lack of adequate living space and public services [2,3,4]. Studies show that of about one-quarter of the global population, which translates to about one billion dwellers, live in slums, 90% of whom are located in developing countries [3]. It is noted that the African continent is urbanising faster than other continents, and studies have predicted that more than half of the sub-Saharan Africa (SSA) population will live in urban areas by 2030 [3,5,6]. It is estimated that more than 70% of urban residents in sub-Saharan Africa live in informal settlements or slums [6,7].
Kenya is an example of the countries with an increasing level of urbanisation [3,8] where about 60–80% of its population is living in informal settlements [3,9,10]. The capital city Nairobi has the highest population living in informal settlements, where approximately half of its population lives in at least 100 slums and squatter settlements [10]. The main slum settlements in Nairobi include Kibera, Mathare, Korogocho, Kangemi, Kawangware, Mukuru and Kiambio [10]. Kibera is among the largest informal settlements in Nairobi, and the largest urban slum in Africa, with an estimated population of between 185,777 [11] and 700,000 residents [12]. Kibera provides cheap housing, which is attractive to people with low incomes. However, it has been noted that there is endemic poverty in Kibera with over half of the households living below the official poverty line of USD 1 per day. Poverty levels may even be higher given that the income level for which the poverty lines are set in Kenya ignores the cost of non-food essentials in the urban areas, such as water, healthcare and education [13]. Poverty manifests itself in the lack of access to basic requirements, including water, electricity and sanitation [13,14]. It is further reported that as many as 63% of slum households feel unsafe due to major crime occurrences within the settlement [15]. Furthermore, the complexities of landlordship and tenancy are always a source of strife, specifically during election periods, when ethnic identities, socio-economic status and political patronage are at stake [13].
There is a huge lack of understanding of the complexities of slums in Nairobi. Food insecurity and safety are serious issues in Kibera and are compounded with challenges related to climate change, job insecurity, crime, changes in food prices, insecurity of the land tenure system, health issues and orphaned children. The lack of proteins in the diet, despite them being a key component, is one of the key challenges facing such groups. Fish consumption has the potential of reducing protein nutrient deficiency, where children and women are the most affected. Fish consumption provides consumers with important micronutrients and fatty acids that are not readily available in other foods [16,17,18]. The fish consumption in Kibera actually depends on the vendors—the female traders who under critically and challenging circumstances buy whole fish early in the morning and dry, salt and cook it before selling it to households and people coming back from work in the evenings. To overcome the existing informal unique challenges settlements face, there is a need to enhance the resiliency of the food systems by transforming them to offer consumers affordable, healthy food choices.
Based on the above, the main aim of this study is to investigate how resiliency in food and nutrition security in Kibera can be enhanced by means of exploring socio-economic drivers, such as income, prices, income, employment, and religion, of household fish species preferences in informal settlements in Kenya, applying a rural–urban food system approach, as defined by van Berkum et al. [19]. A food system approach comprehends all the activities related to the provision and utilisation of food and investigates how to ensure resiliency in outcomes of these activities in terms of food security (including nutrition, that is, the extent to which healthy and safe foods are available and accessible), socio-economics (income and employment) and the environment (biodiversity, minerals, water, climate and soils).
The contribution of this study is threefold: First, we analyse the urban informal food systems by narrowing down to the socio-economic drivers of household fish species consumption. The study is contextualised in one of the largest informal settlements in Africa that is faced with a myriad of challenges and vulnerabilities, food insecurity being key among them. Second, we include policy variables that are important in explaining food preferences and that include the assessment of food environment, the role of culture, religion, market structure (number of retail outlets) and neighbourhood effect in influencing food choices in urban informal food systems. Third, we use a multivariate probit model to isolate the drivers, which accounts for potential substitutabilities and/or complementarities of fish species by consumers, thereby providing a more rigorous and comprehensive analysis of the socio-economic drivers of consumer preferences. The findings obtained from the study will be useful in designing market-related interventions that could enhance the consumption of fish in informal settlements, thereby enhancing the resiliency of food security and malnutrition status. Furthermore, the information from the study will help marketing managers and sellers of fish to understand consumer needs and modify their fish species offered in the market to meet consumer needs.

2. Materials and Methods

2.1. Study Area

Kibera is located in Nairobi county, which is about 6 kilometres southwest from the city centre of Nairobi, Kenya’s capital city. In the Kibera slum, which is the largest in Nairobi, most inhabitants migrated from the western part of the country. Despite the consumption of fish in Kenya being the lowest in the region and globally (at 3–5 kg/person annually) [20], fish is an important food item to communities from the western part of the country, and, lately, there has been an increase in fish consumption by non-traditional fish-eating communities. Most of the fish consumed by the residents in the slums comes from the Lake Victoria fisheries and is transported to Nairobi, followed by fish cultivated in cages in Lake Naivasha—see Figure 1. In addition to the fish from the Lake Victoria fisheries, aquaculture also contributes to the fish consumed in the slum. Victory Farms is an example of cage culture farming of Nile tilapia (Oreochromis niloticus) that has fish outlet points in Kibera, and, since August 2020, the Nyeri Fish Farmer Cooperative has been supplying small-sized farmed fish from pond production systems in an outlet in Kibera [20]. The supply of fish for these two cases is transported by refrigerator tracks that transport fish from their farms in Homa Bay and Nyeri to Kibera in Nairobi.
The composition of Kibera residents depicts a wide representation of the Kenyan ethnic composition and some minority groups of foreign origin. The breakdown of ethnic groups inhabiting Kibera and their gender-specific representation are presented in Table 1.
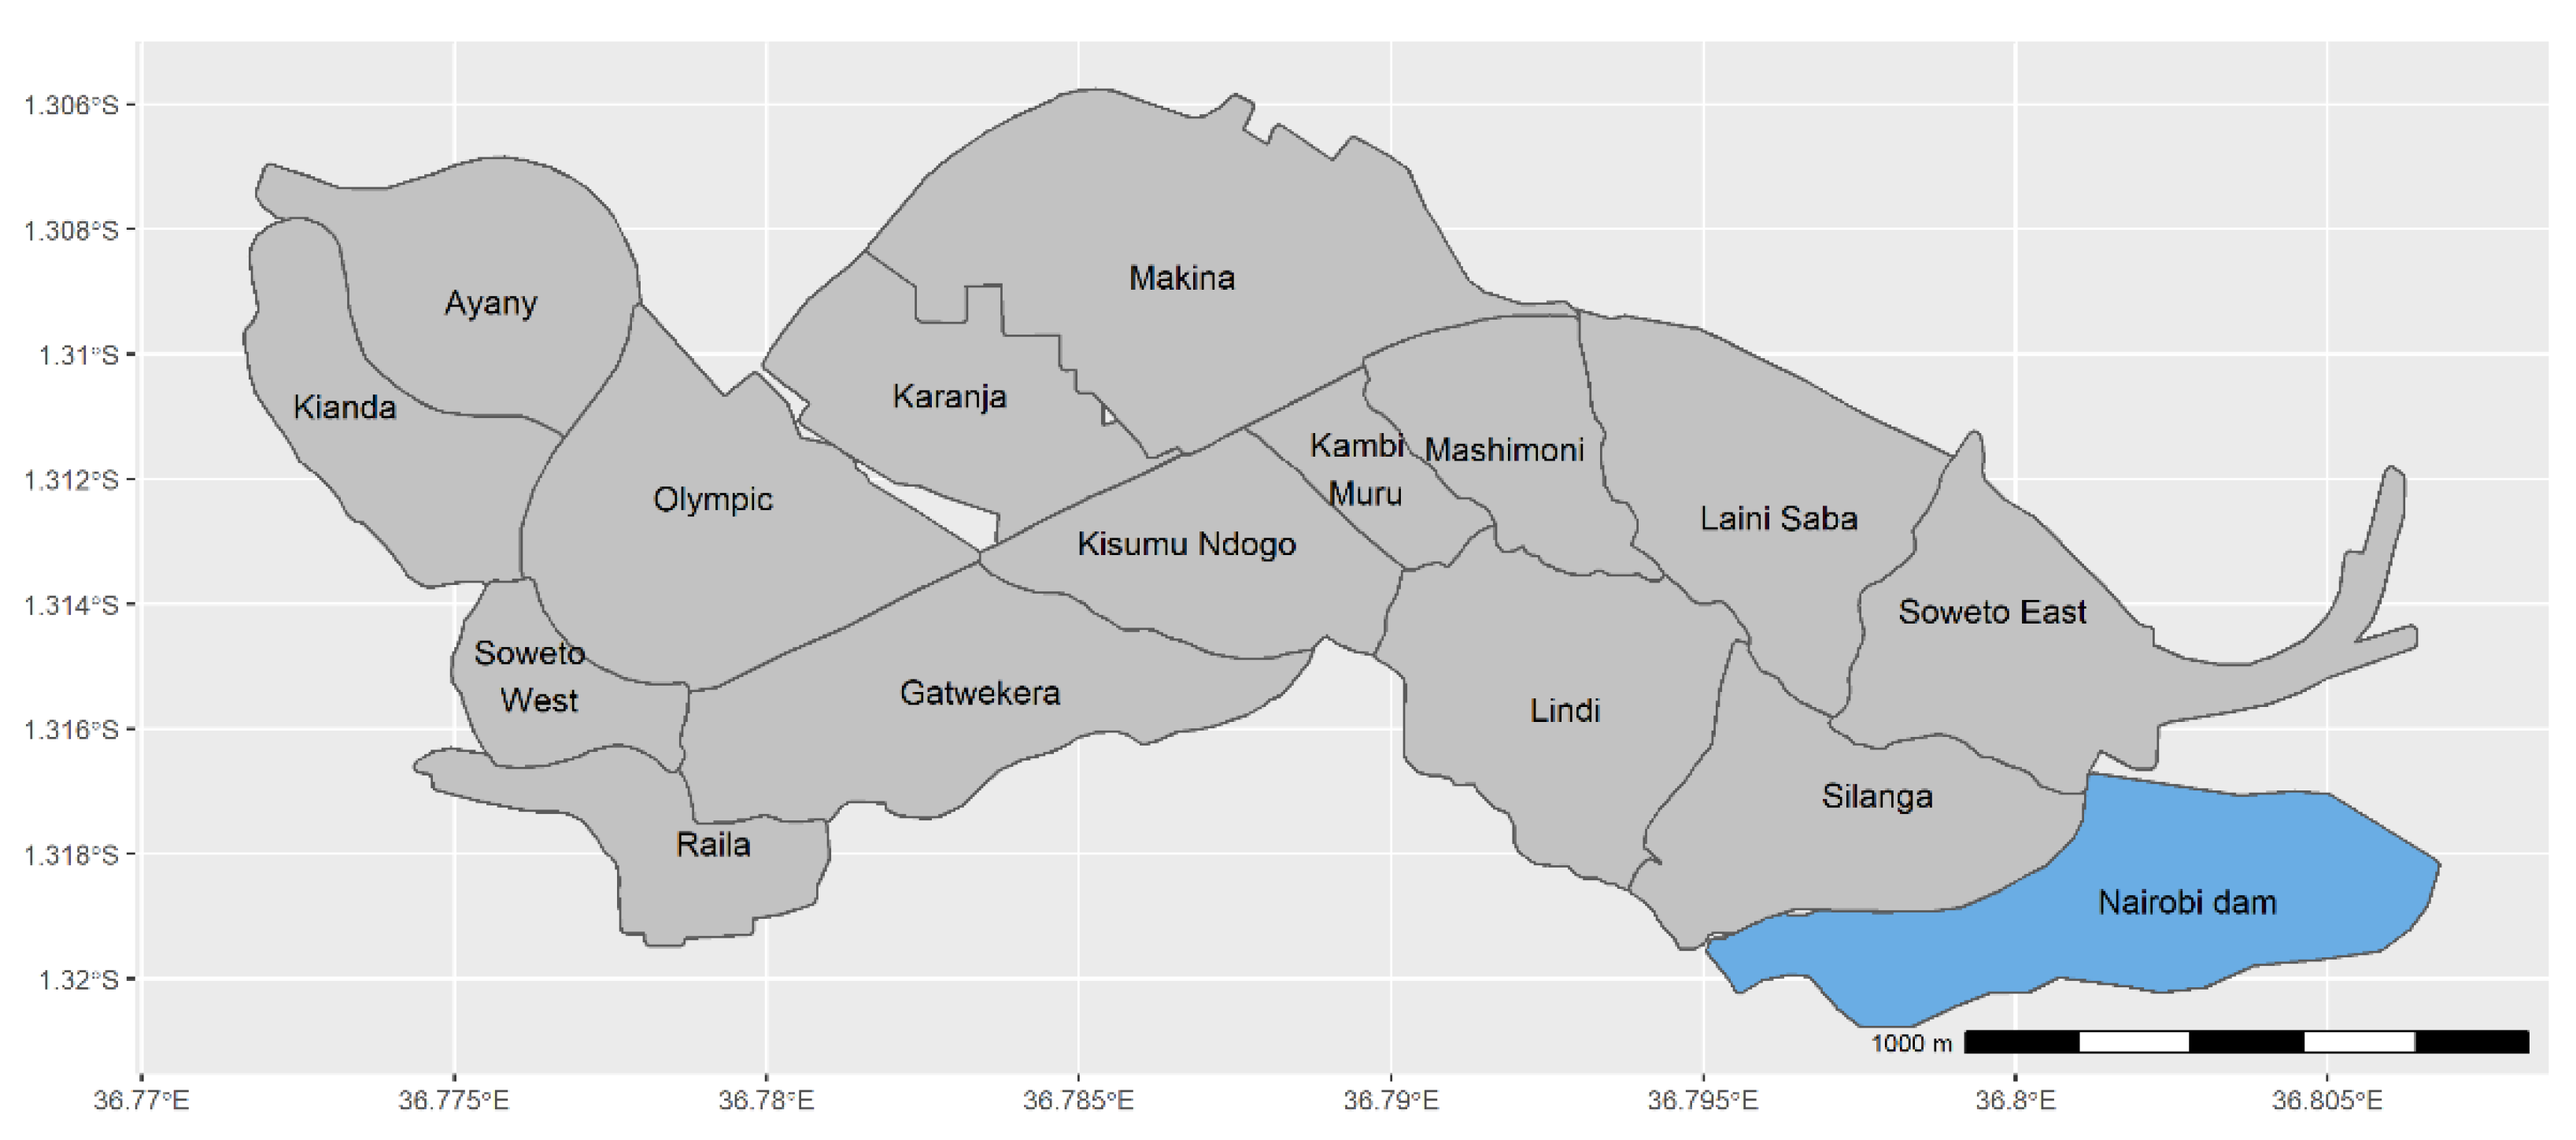
The Kibera informal settlement is divided into 15 villages, as presented in Figure 2. The village of Mashimoni was not covered by the study because of security reasons.

2.2. Sample Size Determination and Sampling

Since the population size is unknown and, to determine the sample size, the [21] following formula (1) for calculating sample size was employed:
n = p q z 2 E 2 = 0.5 × 0.5 × 1.96 2 0.05 2 = 385
where n = size of sample;
  • p = share of population of interest ( p = 0.5 ) ;
  • q = weighting variable ( q = 1 p = 0.5 ) ;
  • z = confidence level ( α = 0.05 ) ;
  • E = acceptable error ( E = 5 % ) .
Usually, in statistics, p is assumed to be 0.5 to yield a sample size that is said to be statistically sufficient, especially when the size of the population is unknown. An acceptable error of 5% was used because of the given sample size of approximately 385 respondents.
The target population in the study comprised households in Kibera. A two-stage cluster sample design was adopted for the survey involving the selection of clusters, households, and eligible individuals. In the first stage, Kibera was clustered into 13 villages. One village was excluded because of security reasons at the time of the study, and the remaining 12 villages were allocated an equal sample size. The last stage of sampling involved the use of personal digital assistants, where respondents were randomly selected from the whole eligible target population. The selection of the respondents was achieved through the use of random walks. The field supervisor selected the starting point by identifying important landmarks in the cluster, e.g., schools, churches/mosques, health facilities, and markets. The minimum landmark in a village was 10, and the script selected the starting point randomly. After identifying the starting point, the script selected the direction from it and the sampling interval in selecting the respondent.

2.3. Data Collection and Analysis

Data were collected through personal interviews with the household head using a structured questionnaire administered in August 2020 using the ODK mobile phone platform. The structured questionnaire, which refers to a questionnaire with standardised questions and a fixed scheme, had both open- and closed-ended questions. The questionnaire had sub-themes covering socio-economic characteristics of the household head and household, institutional factors, fish consumption preferences and consumption habits, food security and livelihood, among others. The structured questionnaire was administered by trained enumerators after pre-testing on 16 respondents. After the questionnaire pre-test, appropriate modifications were implemented to the structured questionnaire. After data collection, Stata software was used for data processing and analysis.

2.4. Econometric Model

A multivariate probit was used to determine the socio-economic drivers of preference for different fish species in informal settlements since the households may simultaneously prefer more than one fish species. The model permits simultaneous choices for situations where consumers concurrently prefer more than one fish species [22]. The multinomial logistic model would have been the most appropriate model to estimate the nominal effects of unordered categories [23]; however, this model is appropriate when consumers only choose a single outcome from the established set of mutually exclusive alternatives. This model also assumes independence of each choice; hence, this model does not allow for substitution or correlation between them. A household choice to select a fish species or not is grounded in the context of utility [24]. In this case, we assume that the households’ preference is determined after evaluating the utility associated with the given fish species.
The household utility from consuming a particular fish species ( γ i ) is a latent variable determined by an observed explanatory variable ( χ i ) and the error term that represents an observed utility ( ε i );
γ i k * = β k χ i k + ε i κ = γ 1 , γ 2 , γ 3
Here, β k is the coefficient of the parameter reflecting the impact of change in the explanatory variable. χ i k represents the explanatory variables, such as socio-economic and institutional factors whose descriptive statistics are presented in Table 1. ε i signifies the random errors dispersed by the multivariate normal distribution. k symbolises the varied levels of utility obtained from the dissimilar fish type ( γ i ). By using the indicator function, the unseen preferences in Equation (2) are converted into the observed binary effect equation for all of the preferences as follows:
γ i k = 1   i f   γ i k * > 0   0   o t h e r w i s e k = γ 1 , γ 2 , γ 3 , γ 4
In Equation (3), γ i 1 = 1 if a household prefers Nile tilapia, 0 otherwise; γ i 2 =1 if a household prefers the Lake Victoria sardine (Rastrineobola argentea), 0 otherwise; γ i 3 = 1 if a household prefers Nile Perch (Lates niloticus), 0 otherwise;   γ i 4 = 1 if a household prefers a composite of other fish species, such as African catfish (Clarias gariepinus), common carp (Cyprinus carpio), marbled lungfish (Protopterus aethiopicus), fulu (Haplochromine cichlids) and tuna (Thunnus sp.), 0 otherwise.
Where the selection of various fish species is possible, the multivariate probit estimates the parameters β k and the variance–covariance matrix of the multivariate normal distribution (MVN) of the error term [25]. ε represents random errors spread as a multivariate normal distribution with zero conditional mean and variance standardised to unity, where ε~N; (0, Ω), and the covariance matrix Ω is given by
Ω = 1 P y 1 y 2 P y 1 y 3 P y 1 y 4 P y 2 y 1 1 P y 2 y 3 P y 2 y 4 P y 3 y 1 P y 3 y 2 1 P y 3 y 4 P y 4 y 1 P y 4 y 2 P y 4 y 3 1
The descriptive statistics of independent variables used in the model are presented in Table 2.

3. Results

3.1. Consumer Preferences for Fish Species

Out of the 385 respondents, 92.5% were fish consumers. Figure 3 presents the household preferences for fish species, which, through the findings, indicate that consumers prefer more than one variety of fish. The most preferred (73%) fish species is the Lake Victoria sardine because of its availability and lower price compared with other fish. This is convenient for low-income households in informal settlements, where the majority of households fall into the low-income category. Lake Victoria sardine is closely followed by Nile tilapia (70%), which is noted for its acceptable taste. Nile perch is preferred by 23% of the households, while other fish species, such as African catfish, common carp, marbled lungfish, fulu and tuna, are preferred by 12%.
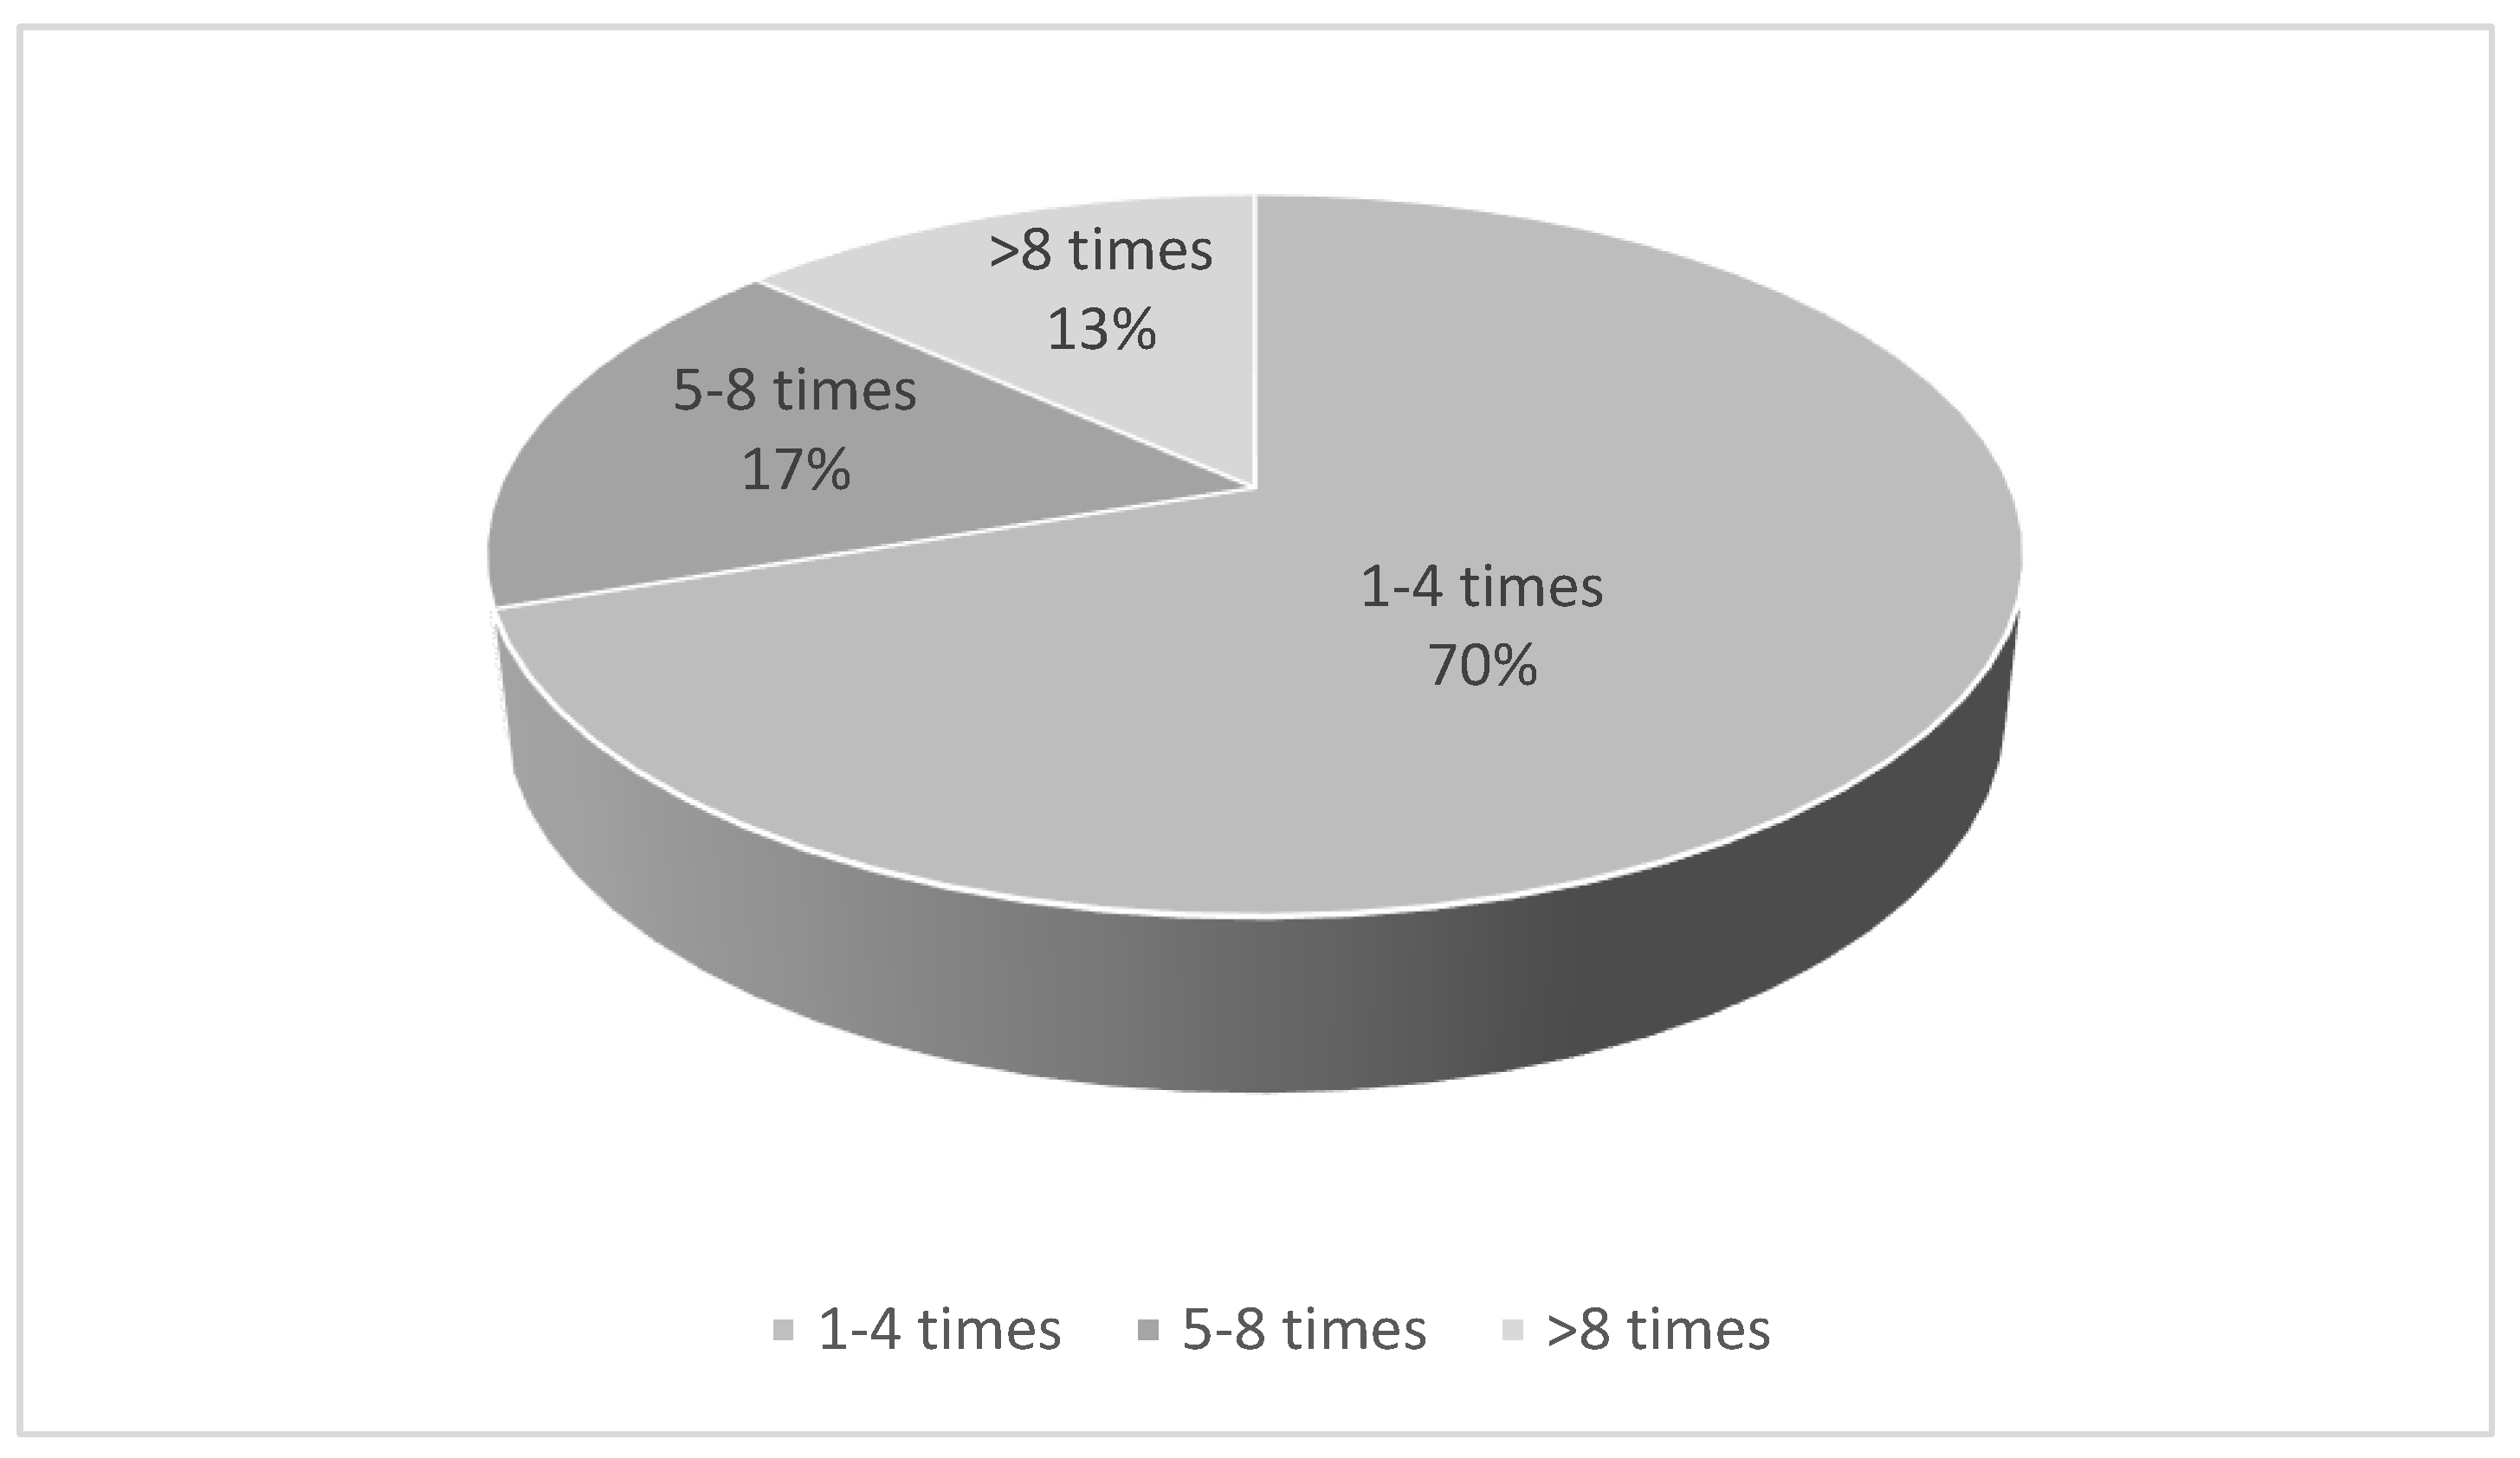
In terms of average consumption frequency in a month for the households in Kibera (Figure 4), most (70%) consumers consumed fish 1–4 times in a month, which illustrates that fish is relatively expensive. While 17% of the households consumed fish 5–8 times per month, about 13% consumed it more than the 10 times in a month.
Price is an important determinant in the consumption of food products, especially in informal settlements where income is low with relatively high competing needs. The prices of different fish species are presented in Table 3. The Lake Victoria sardine was the cheapest fish species with a price of about EUR 1.58. The highest fish species was Nile tilapia at EUR 3.77. Nile tilapia is preferred more by consumers because of the favourable taste, despite it being relatively expensive.
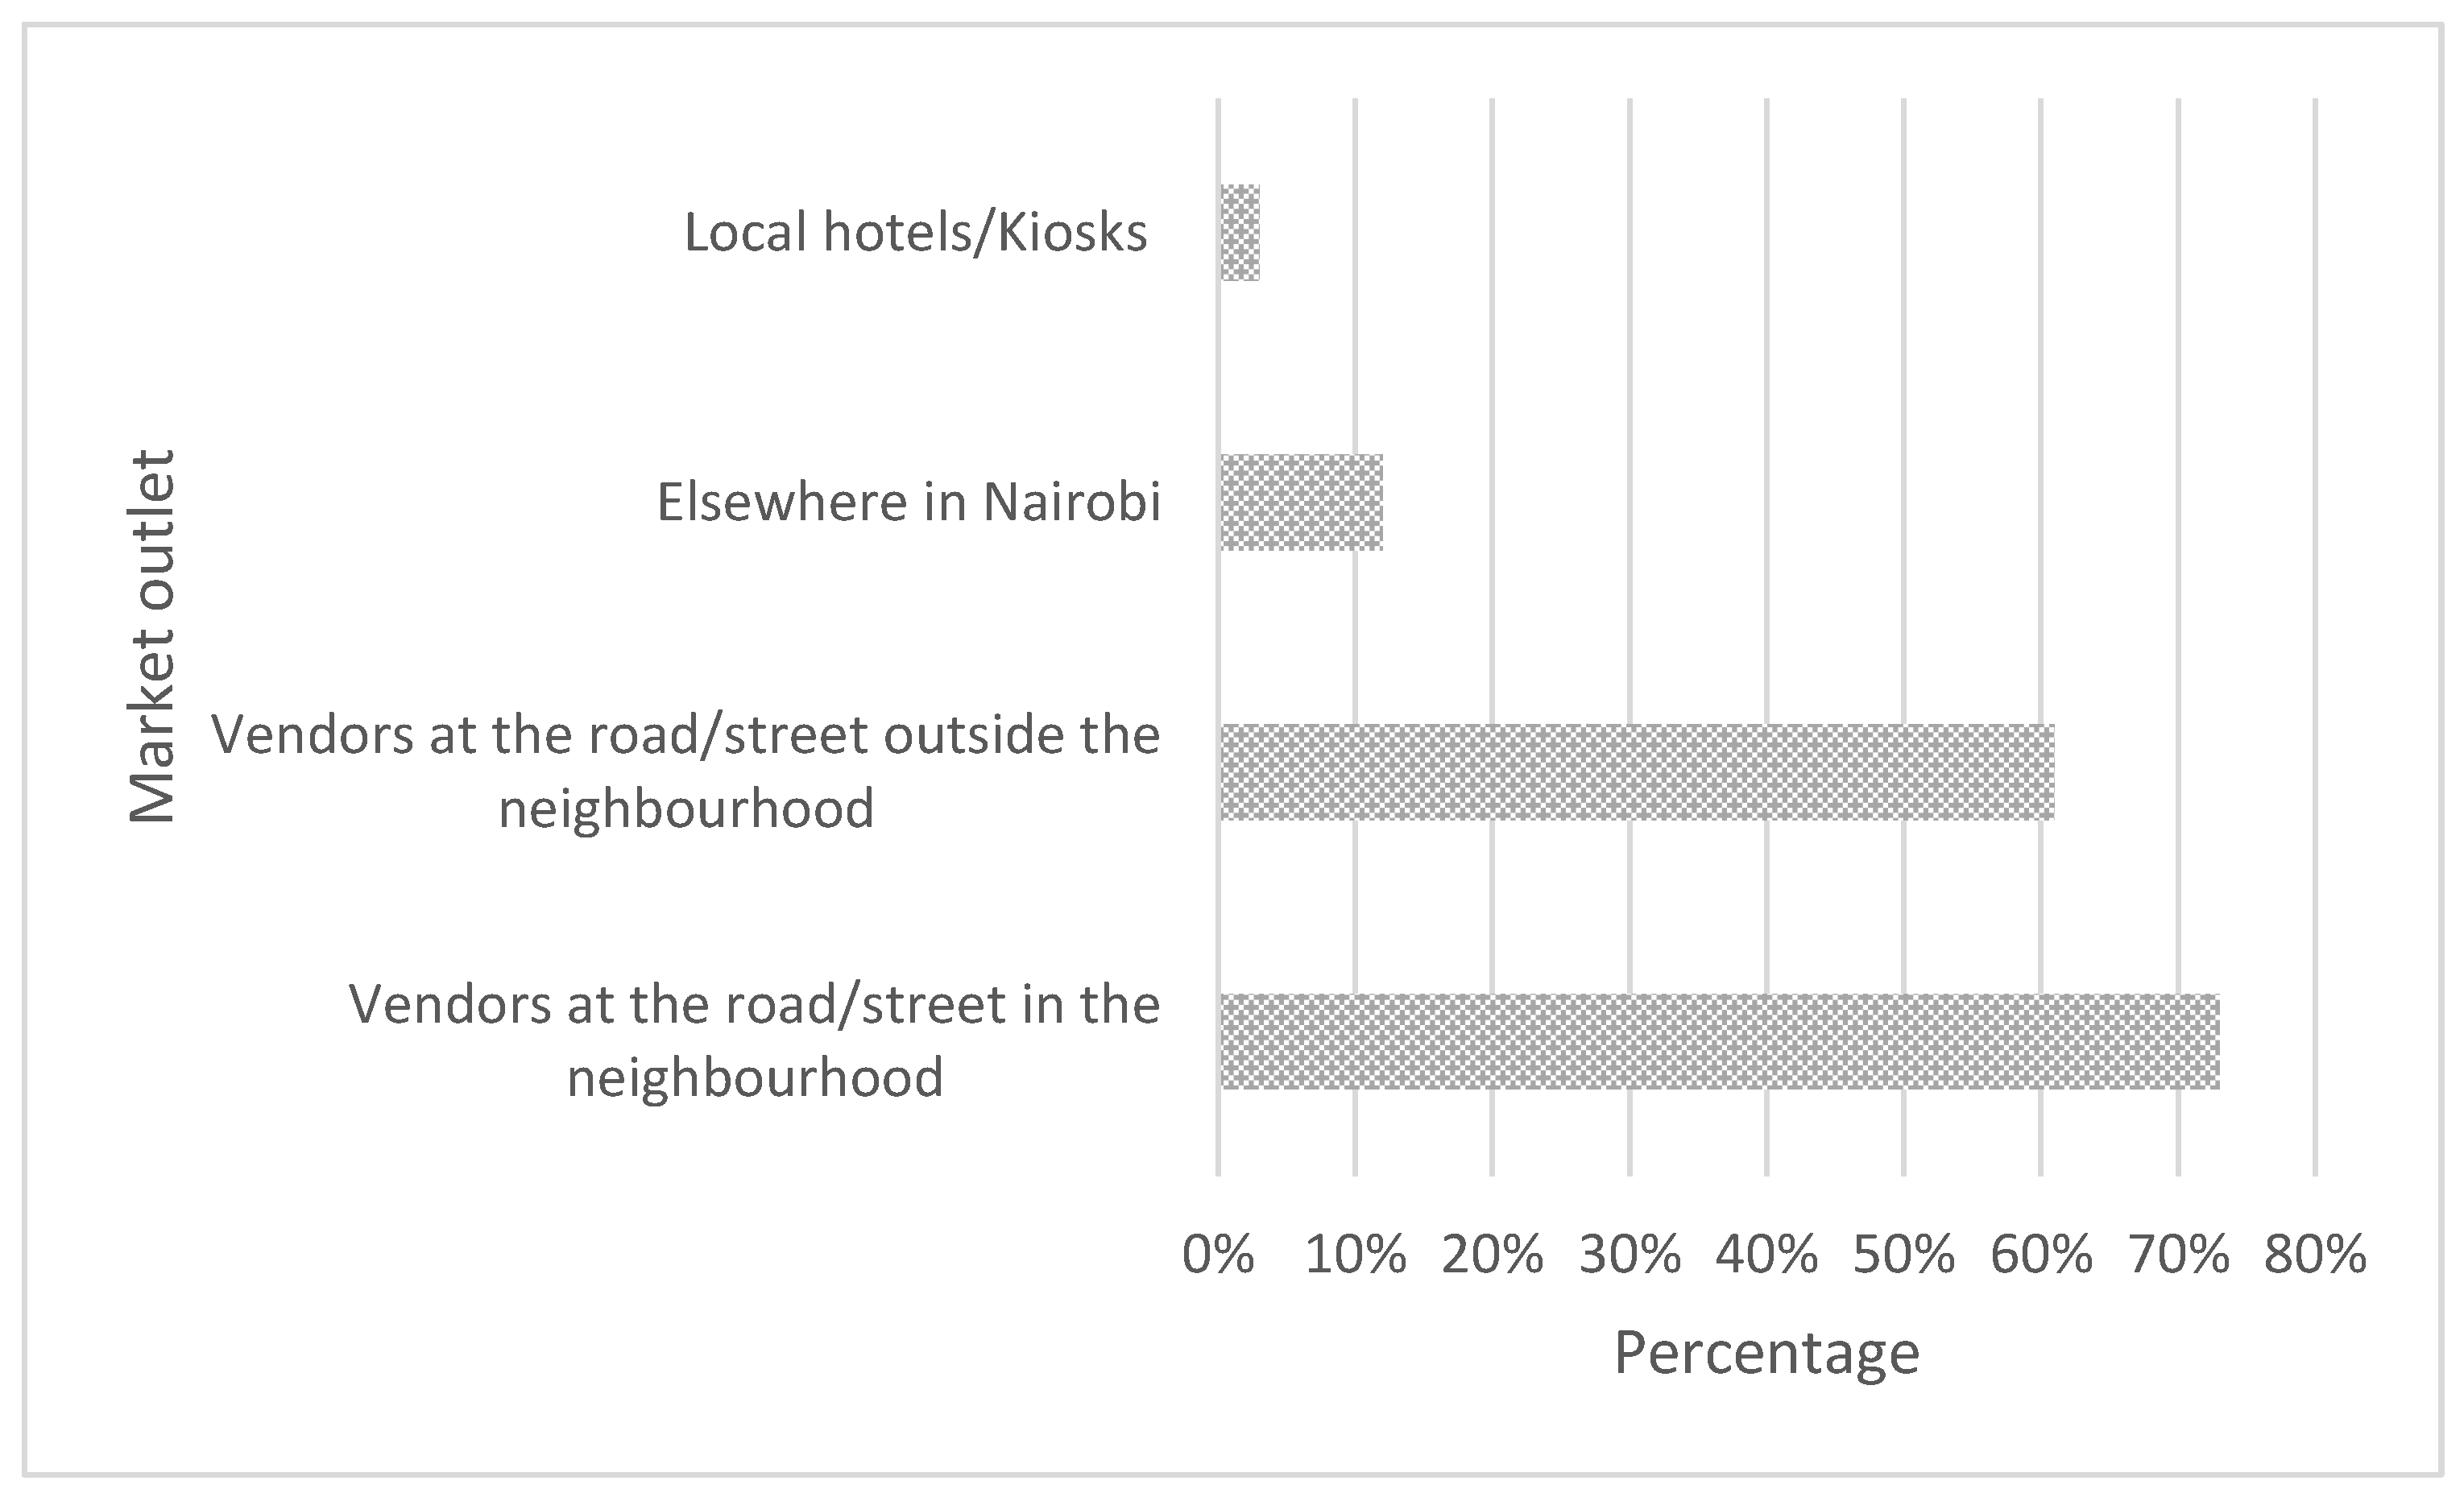
Figure 5 presents the findings related to the location where the households purchase their fish. Mainly, consumers have multiple sources of fish, but our findings reveal that consumers purchase most of their fish from the street/roadside, where vendors sell the prepared fish either in or outside the neighbourhood.
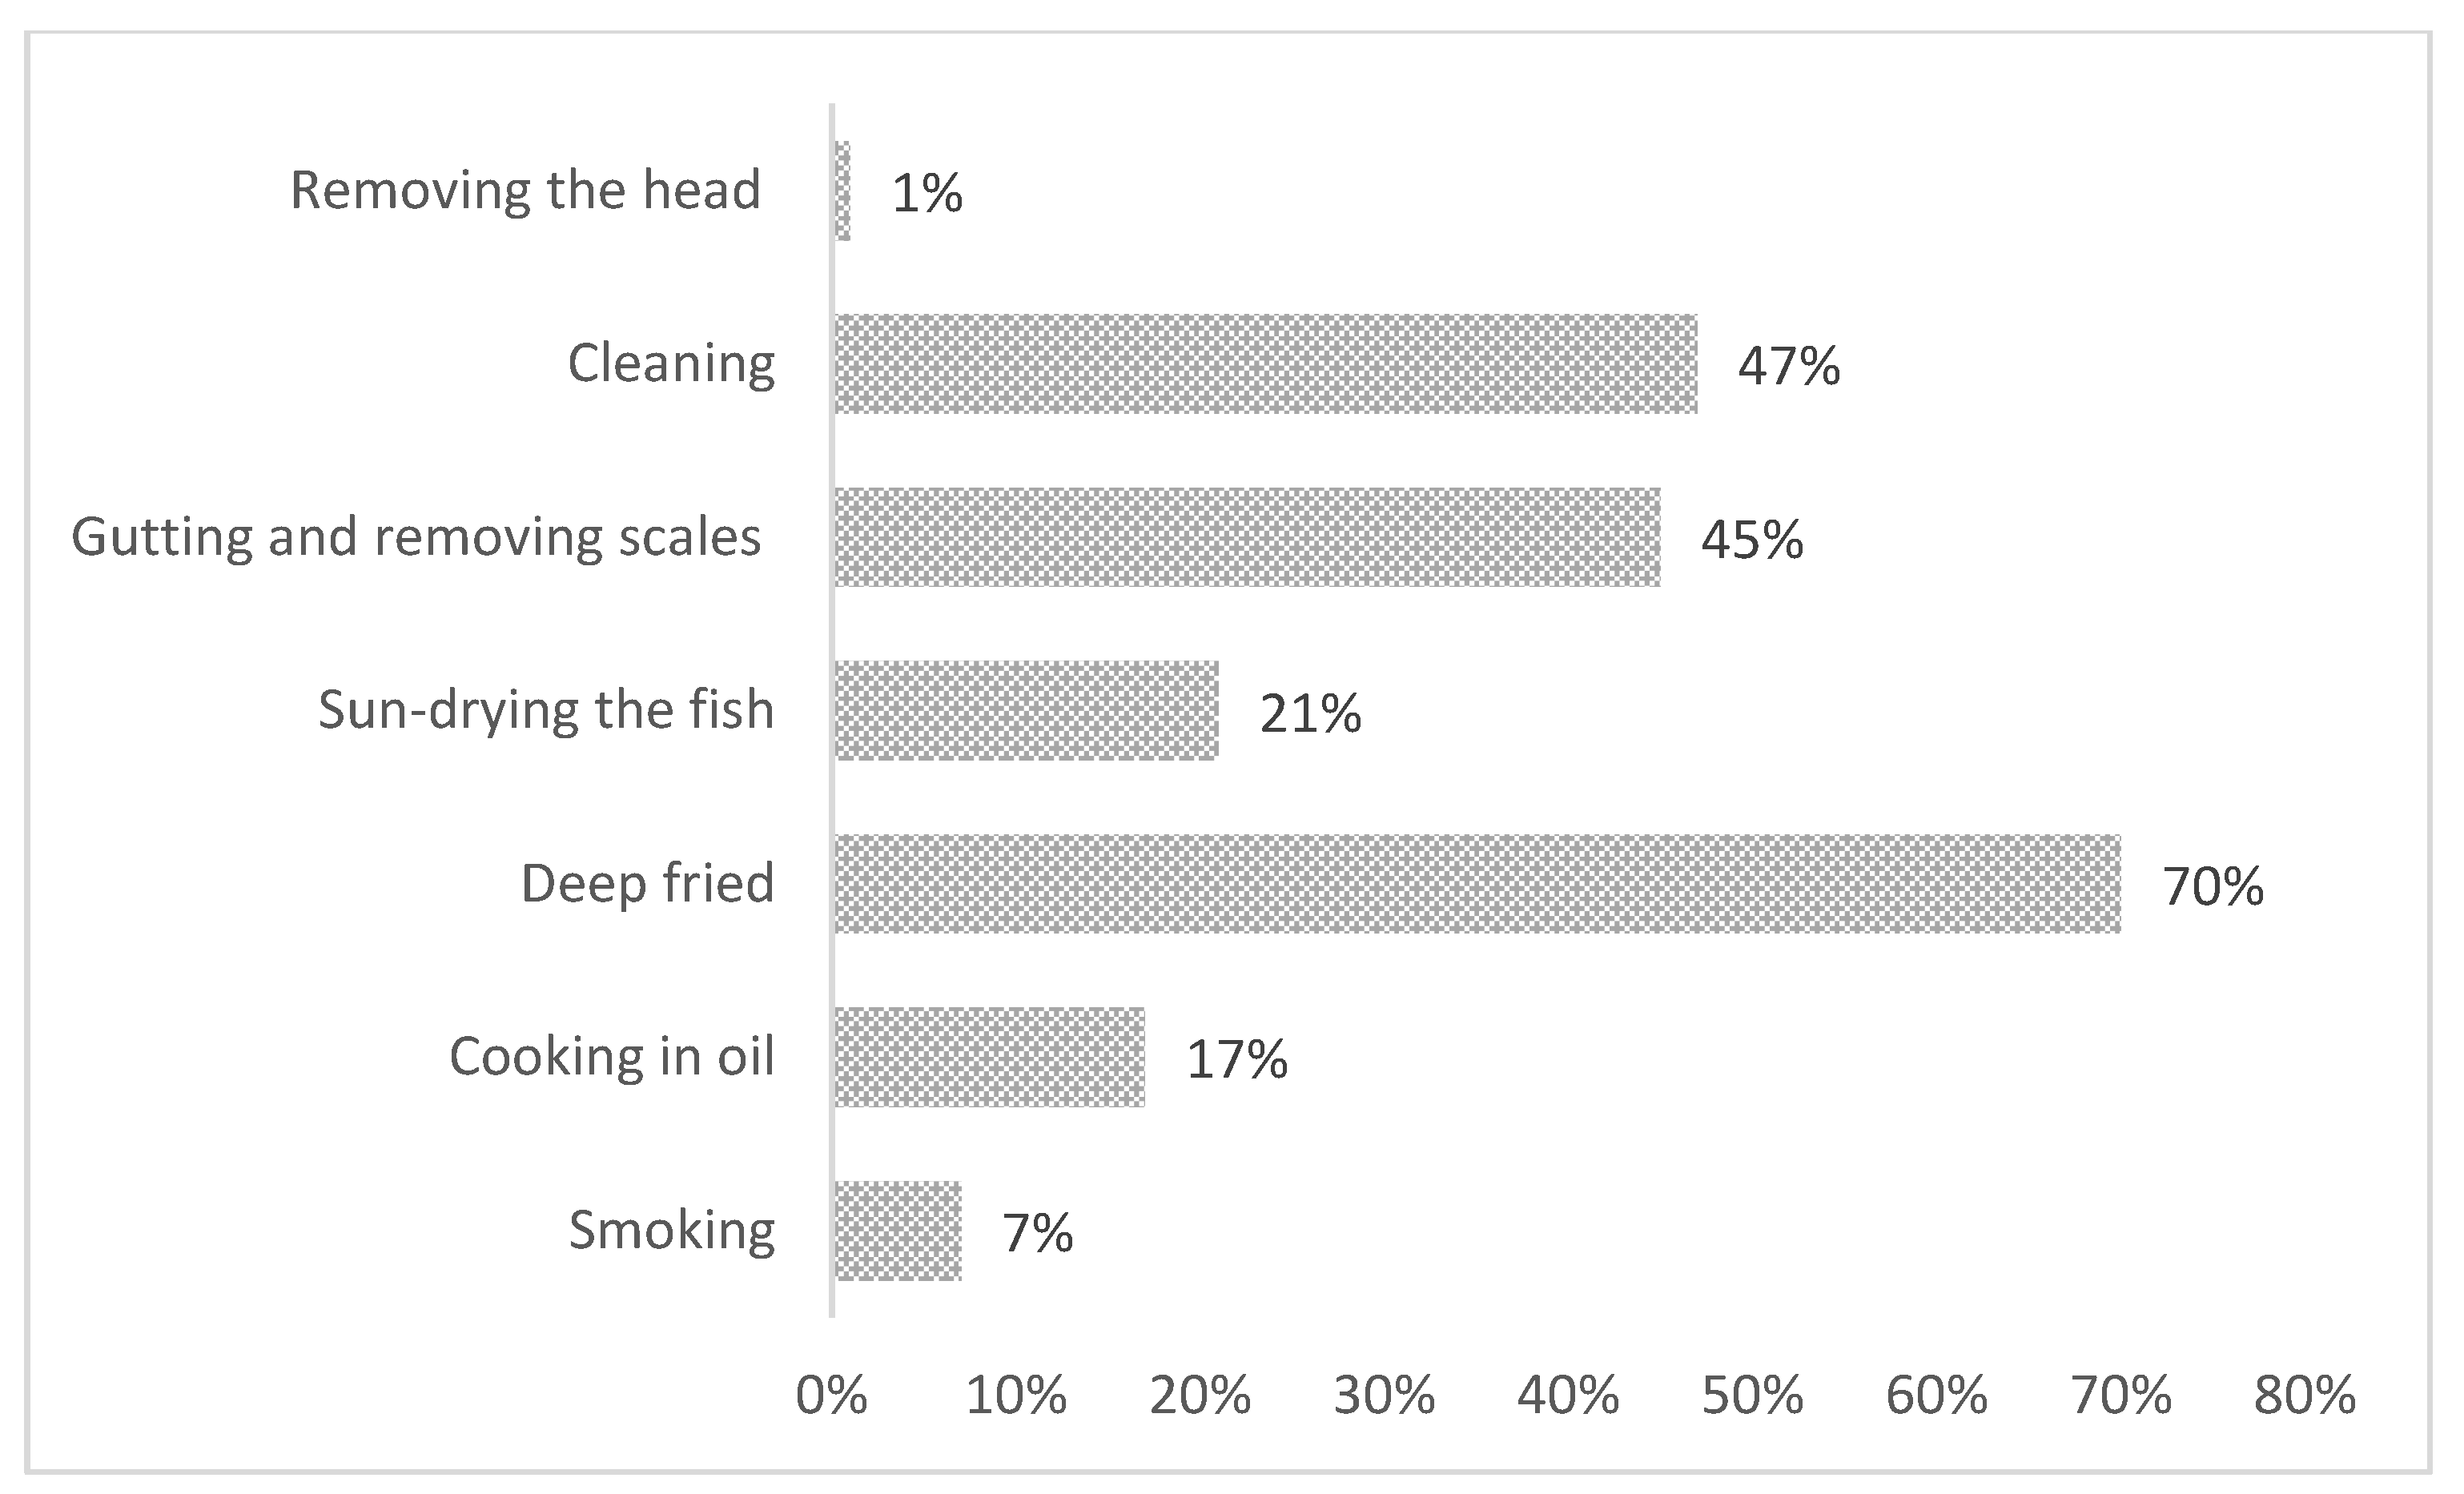
Consumers purchased fish that has been processed in different manners (Figure 6). Deep frying was the main process used (70%), which most often was performed by the fish vendors along the roads and streets in the informal settlement. Other processes used frequently included cleaning (47%) and gutting and removing of scales (45%).

3.2. Determinants of Household Preference for Fish Species

The estimated multivariate probit model test statistics are presented in Table 4, where the Wald test ( x 2 (60) = 109.99, p-value =0.0001) was significant at 1% level. This implies that the model is appropriate for the data collected since the independent variables included in the model have satisfactory explanatory power and the coefficient of the model demonstrates joint significance. The likelihood ratio tests (LR x 2 (6) = 39.0199 where x 2 > p = 0.0000 ) inferred the rejection of the null independence between the fish species preferences at a 1% significant level. Therefore, estimating individual probit models for fish species preferences produces unbiased estimators, as household preferences for fish species are interdependent. This is confirmed by the correlation matrix of the fish species in the upper panel of Table 4.
The estimates of the multivariate probit model are presented in Table 5, where some variables are found to significantly affect household preferences for fish species.

4. Socio-Economic Factors Influencing Fish Consumption in Kibera

Our results show that as the number of dependents in a household increase, there is a higher preference for Lake Victoria sardine consumption at a 1% significance level. The Lake Victoria sardine is preferred by large households because it can be served in small portions, hence having the potential to feed many members, and it is relatively affordable. In the Kenyan fish market, Lake Victoria sardine always trades at a lower price per unit as compared to other species of fish [25], yet it has comparable nutritional benefits. This explains why large households in the pursuit of nutritional security with respect to proteins will always opt for Lake Victoria sardine. Kiritu et al. [26] found that the cost element of Lake Victoria sardine is the main attribute that influences its choice among Kenyan consumers. Furthermore, Kibera is a low-income settlement; thus, feeding larger households with relatively expensive fish species will be unaffordable.
The preference to consume Nile tilapia and Nile perch was positively influenced by household income at a 10% and 5% significance level, respectively. Nile tilapia and Nile perch are relatively expensive fish in informal settlements; hence, higher household income increases the likelihood of households to consume Nile tilapia and Nile perch. This is attributed to the increase in purchasing power triggering preference for Nile tilapia and Nile perch. The finding is consistent with that of Chikowi et al. [27], who found that increased household income enhanced the preference for expensive fish species like Nile tilapia.
The neighbourhood effect percentage reduces the preference for consuming Nile perch at a 10% significance. The neighbourhood effect was measured as the percentage of the immediate neighbours who share the same cultural background. The results imply that neighbours influence consumption decisions against preference for Nile perch. Being from Western Kenya, the majority of Kibera residents are culturally inclined towards consumption of Nile tilapia and the Lake Victoria sardine due to their widespread acceptable tastes compared to Nile perch. Co-ethnic concentration can influence food consumption decisions based on neighbour–social ties and the transmission of food eating habits through the existing social networks, as members have the opportunity to share sociocultural norms. Thus, household preference for fish species is influenced by their neighbours’ appraisal, where the majority will opt for fish that is positively appraised by neighbours [26].
The number of fish outlets within a 100 m radius significantly influences consumer preference for Lake Victoria sardine. Most fish outlets in informal settlements sell Victoria Lake sardine, which is relatively affordable in the market, where demand is high. Additionally, Victoria Lake sardine is often sold by traders who are not exclusively fish vendors, ranging from small to big retail outlets. This implies that the availability and affordability of Lake Victoria sardine influence household preference towards its consumption. Kariuki [28] found that consumer preferences for Lake Victoria sardine were influenced by its good availability making it convenient for households. Brunsø et al. [29] emphasises convenience in consumer food decision making being influenced by factors such as saving time, physical or mental energy and ease of purchase.
Being a local (born in Kibera) of informal settlements increases preference for Nile tilapia and reduces the preference for Lake Victoria sardine. Furthermore, consumers from Western Kenya and with a strong cultural attachment had a higher preference for Lake Victoria sardine. The results suggests that residents who were born and raised in informal settlements are positively inclined towards the consumption of Nile tilapia, while migrants have a higher acceptability of Lake Victoria sardine. The locals prefer Nile tilapia because of its taste, which is relatively acceptable to many consumers. The majority of Kibera migrants trace their origins from western Kenya where Lake Victoria sardine has always been a staple food. Alonso et al. [30] notes that culture shapes household meals and eating patterns and further stipulates the composition of a “proper” meal and how, when and where one should eat.
Religious belief was reflected by the extent in which it affected food consumption. Different religious teachings have varying effects on food consumption patterns, sometimes leading to reduced preferences for other fish species. Cultural practices and beliefs have been noted to influence dietary practices in Kenya. For instance, some communities like the Maasai consider fish a taboo food. Moreover, the followers of the Seventh Day Adventist Church identify the African catfish as one of the food items that they do not consume [31,32,33].
Decision makers other than the head and spouse within a household, such as cousins, grandmother and teenagers, positively affected preferences for other fish species, such as African catfish, common carp, marbled lungfish, fulu and tuna at a 10% significance level. Other household members from different cultural backgrounds could also influence the preference for the consumption of other fish species. Our findings suggest that given an opportunity to make fish consumptions decisions, other household members would introduce their fish species preferences to households. Chikowi et al. [27] found that fish consumed in a household is dependent on the decision maker’s taste and preferences.
Higher levels of dietary knowledge reduce preference for Nile perch at a 10% significance level. Estimates of dietary knowledge according to Shimokawa [34] and Min et al. [35] gave higher scores, implying a higher level of dietary knowledge. Nile perch being a predatory fish and hence at the top of the food/energy pyramid would have significantly less nutritive value than its prey, including Lake Victoria sardine and Nile tilapia. Studies show that consumers with an awareness of the nutritive value of fish consider Lake Victoria sardine to have a high nutritive value, followed by Nile tilapia Oreochromis niloticus, Nile perch and marbled lungfish [36].
A price increase positively affected the preference for Nile tilapia and negatively affected the preference for Lake Victoria sardine at a 10% significance level. Higher prices of Nile tilapia are associated with quality attributes such as freshness and origin. Recently, there has been influx of Nile tilapia from China, with the majority of fish consumers perceiving them to be of low quality, less tasty and relatively cheaper. Therefore, consumers tend to buy fish that are of higher prices, which are believed to originate from Lake Victoria in East Africa and have good taste. Most of the Lake Victoria sardines consumed are sourced locally within the East African region, so price increases reduce the preference for their consumption. Lake Victoria sardines are perceived by consumers as an inferior product when compared with other fish species.

5. Conclusions

The main aim of this study was to investigate how resiliency in food and nutrition security in Kibera can be enhanced by means of exploring the socio-economic drivers of household fish species preferences in informal settlements in Kenya, applying a rural–urban food system approach and conducting a household survey. The findings obtained from this survey explain some of the varieties of the consumers within Kibera and specify different niches that are useful in designing market-related interventions for enhancing the consumption of fish in informal settlements, thereby enhancing the resiliency of food security and malnutrition status.
Based on analyses of data that were derived from a survey of 385 households in August 2020, this study found that Lake Victoria sardine had the highest preference, followed by Nile tilapia and Nile perch. Other fish consumed in the Kibera, though in smaller quantities, include African catfish, common carp, marbled lungfish, fulu and tuna. The socio-economic drivers investigated showed, among others, that Lake Victoria sardine is preferred by larger households, which is explained by the fact that it allows for large households to be fed with nutritious, affordable fish, because this fish in particular is served in small portions. Moreover, people who migrated from the western part of the country into Kibera have a higher affinity for Lake Victoria sardine compared with people who were born and raised in Kibera, who have a higher preference for Nile tilapia and Nile perch. There is thus a link between fish-eating patterns in Kibera and fish-eating habits that residents have brought with them from their rural homes into Kibera. In addition to links with rural homes, religious and cultural beliefs and practices also affect the choice of species and level of fish consumption; a high consumer dietary knowledge positively affects this choice and consumption of fish. Moreover, the neighbourhood effect reduces the preference for Nile perch, which may be explained by the currently poor resilience of this fish stock. Furthermore, the consumption of Nile tilapia and Nile perch is associated with a higher income. It was also found that fish prices positively influence preference for Nile tilapia, which is explained by households being willing to pay more for quality and origin of fish. For instance, cheaply produced Chinese fish is not highly demanded in Kibera. The price negatively influences the preference for Lake Victoria sardine, implying a higher demand with lower prices.
Applying a rural–urban food system approach to the investigation of socio-economic factors, we found that there is a high potential to increase the supply of fish given existing and future demands for fish in Kibera. While affordable fish such as Lake Victoria sardine is in high demand among traditional fish-eating communities, non-traditional fish-eating communities are increasingly eating fish, foremost Nile tilapia, and the demand for fish is expected to increase in the future. This will, on the one hand, strengthen the rural–urban fish trade relationships by including the traditional but also new fish-producing rural areas (e.g., Nyeri County), and it will create not only increased opportunities for fish production but also employment across the whole value chain (e.g., in the production of fingerlings and feed, logistics and transport, trade and sale). On the other hand, in Kibera, the vendors—women who often have large families to support—play a key role in this fish food system. With more fish available, the vendors who buy, prepare and sell the fish in Kibera will, in different ways, be able to upscale the numbers of viable businesses and include a larger number of women in Kibera to work as vendors for a variety of fish demanded at different prices by different people and communities in Kibera. Enhancing fish vendor businesses will strengthen the livelihood of consumers demanding affordable fish prepared by the fish vendors in Kibera, but it will also ensure their own families, including vulnerable children, will have stable incomes and nutritious food. The information from this study is also available to external marketing managers and sellers of fish to understand consumer needs in order to ensure modifications of supply to offer fish species and fish prices that meet consumer needs.
Still, the evaluation of sub-Saharan African markets, including those in Kibera, and their capacity to change towards increased resiliency, viability and sustainability have not been completed [37]. For instance, with the limited access to clean water and opportunities for good hygiene, it is unclear how food safety in Kibera is ensured although we know that fish is frozen or fried, which means it is disinfected. While this survey recommends that small-sized, cheap fish contribute to increased resiliency of food security and enhance the livelihood of poor people in Kibera in the future by, among others, strengthening the rural–urban fish value chain and securing vendors’ fish businesses in Kibera, information about the Kibera population is still lacking, and urgent food system challenges remain. As such, a series of upcoming analyses related with this one will investigate the urgent relationships to ensure resiliency in future food systems, including the analyses of (1) food security factors and livelihood in Kibera more generally; (2) social capital, gender, security and risk explaining food security issues in Kibera; (3) environmental factors such as water and use of fuel for cooking and lighting in Kibera, and the relation with environmental capital at larger scales; and (4) food safety and food security relationships. With these insights, effective investments in the food system in Kibera will be validated not only to enhance food security and fish consumption but also to ensure high-quality water supply, sustainable use of water and nature resources (electricity and forests) and inclusiveness of people with high potential to contribute through work and the community to ensure resilient urban food systems for the vulnerable people in Kibera in the future.

Author Contributions

This paper was compiled by O.I.A., with input from all co-authors. All authors were involved in the research design and paper conceptualisation. All authors read and approved the final manuscript.

Funding

This research was carried out within the motif ‘Feeding cities and migration settlements’ (2282700540), as part of the programme Food Security and Valuing Water (KB-35-002-001) of Wageningen University & Research and was subsidised by the Dutch Ministry of Agriculture, Nature and Food Quality.

Institutional Review Board Statement

Ethical review and approval were waived for this study, based on the Research Ethical guidelines of Egerton University in Kenya, who conducted all the interviews.

Informed Consent Statement

Informed consent was obtained from all subjects involved in the study.

Data Availability Statement

The original dataset is not public at this stage, following the Egerton University data policy in Kenya.

Acknowledgments

The authors would like to acknowledge the Wageningen University & Research Programme on “Food Security and Valuing Water” that is supported by the Dutch Ministry of Agriculture, Nature and Food Security, in a project called “Feeding cities and migration settlements” (2282700540). The authors would also like to sincerely thank Tinka Koster of Wageningen Economic Research (WUR), who assisted in preparing the household survey, and Valerie Janssen and Wil Hennen (WUR), who made the maps. Special appreciation also goes to the enumerators who played a big role in data collection. Special thanks go to Gabriel Francis Mwangi, who invited us to Kibera, set up the logistics of interviews and introduced us to the households to be interviewed. Finally, the authors would like to thank all the households who contributed to the interviews.

Conflicts of Interest

The authors declare no conflict of interest.

References

  1. Parnell, S.; Walawege, R. Sub-Saharan African urbanisation and global environmental change. Glob. Environ. Chang. 2011, 21, S12–S20. [Google Scholar] [CrossRef]
  2. Leon, D.A. Cities, urbanization and health. Int. J. Epidemiol. 2008, 37, 4–8. [Google Scholar] [CrossRef] [Green Version]
  3. Gallaher, C.M. Livelihoods, Food Security and Environmental Risk: Sack Gardening in the Kibera Slums of Nairobi, Kenya. Ph.D. Thesis, Michigan State University, East Lansing, MI, USA, 2012. [Google Scholar]
  4. Talukdar, D. Cost of being a slum dweller in Nairobi: Living under dismal conditions but still paying a housing rent premium. World Dev. 2018, 109, 42–56. [Google Scholar] [CrossRef] [Green Version]
  5. Archambault, C.S.; De Laat, J.; Zulu, E.M. Urban services and child migration to the slums of Nairobi. World Dev. 2012, 40, 1854–1869. [Google Scholar] [CrossRef]
  6. Olack, B.; Feikin, D.R.; Cosmas, L.O.; Odero, K.O.; Okoth, G.O.; Montgomery, J.M.; Breiman, R.F. Mortality trends observed in population.-based surveillance of an urban slum settlement, Kibera, Kenya, 2007–2010. PLoS ONE 2014, 9, e85913. [Google Scholar] [CrossRef] [PubMed]
  7. Beyer, L.I.; Chaudhuri, J.; Kagima, B. Kenya’s focus on urban vulnerability and resilience in the midst of urban transitions in Nairobi. Dev. S. Afr. 2016, 33, 3–22. [Google Scholar] [CrossRef]
  8. Gallaher, C.M.; Kerr, J.M.; Njenga, M.; Karanja, N.K.; WinklerPrins, A.M. Urban agriculture, social capital, and food security in the Kibera slums of Nairobi, Kenya. Agric. Hum. Values 2013, 30, 389–404. [Google Scholar] [CrossRef]
  9. Crow, B.; Odaba, E. Access to water in a Nairobi slum: Women’s work and institutional learning. Water Int. 2010, 35, 733–747. [Google Scholar] [CrossRef]
  10. Achungo, B.C. The Social Transformation of the People Living in Kibera Slum in Nairobi County Following the Kenya Slum Upgrading Programme. Master’s Thesis, Institute of Anthropology, Gender and African Studies, University of Nairobi, Nairobi, Kenya, 2014. [Google Scholar]
  11. KNBS. (Kenya National Bureau of Statistics 2019). Kenya Population and Housing Census: Volume 1: Population by County and Sub-County 2019; Kenya National Bureau of Statistics: Nairobi, Kenya, 2019.
  12. Desgroppes, A.; Taupin, S. Kibera: The Biggest Slum in Africa? East Afr. Rev. 2011, 44, 23–33. [Google Scholar]
  13. Gallaher, C.M.; WinklerPrins, A.M.; Njenga, M.; Karanja, N.K. Creating space: Sack gardening as a livelihood strategy in the Kibera slums of Nairobi, Kenya. J. Agric. Food Syst. Community Dev. 2015. [Google Scholar] [CrossRef] [Green Version]
  14. Kibere, F.N. The Capability of Mobility in Kibera’Slum’, Kenya: An Ethnographic Study of How Young People Use and Appropriate New Media and ICTS. Ph.D. Thesis, Department of Media and Communication, University of Leicester, Leicester, UK, 2016. [Google Scholar]
  15. Gulyani, S.; Talukdar, D. Informal rental markets: The low-quality, high-price puzzle in Nairobi’s slums. In Urban Land Markets; Springer: Dordrecht, The Netherlands, 2009; pp. 191–223. [Google Scholar]
  16. Tacon, A.G.; Metian, M. Fish matters: Importance of aquatic foods in human nutrition and global food supply. Rev. Fish. Sci. 2013, 21, 22–38. [Google Scholar] [CrossRef]
  17. Béné, C.; Barange, M.; Subasinghe, R.; Pinstrup-Andersen, P.; Merino, G.; Hemre, G.I.; Williams, M. Feeding 9 billion by 2050–Putting fish back on the menu. Food Secur. 2015, 7, 261–274. [Google Scholar] [CrossRef] [Green Version]
  18. Béné, C.; Mehta, L.; McGranahan, G.; Cannon, T.; Gupte, J.; Tanner, T. Resilience as a policy narrative: Potentials and limits in the context of urban planning. Clim. Dev. 2018, 10, 116–133. [Google Scholar] [CrossRef]
  19. van Berkum, S.; Broeze, S.; Herens, M.; Bertram de Rooij, B.; Soma, K.; Roosendaal, L. Urbanisation, Migration and Food System Transformations: Concepts and Methodologies for a Better Understanding of the Dynamics of Urban Food Systems and Migration Settlements; report no 2020-46; Wageningen Economic Research: Hague, The Netherlands, 2020; 29p. [Google Scholar]
  20. Obwanga, B.; Lewo, M.R. From Aid to Responsible Trade: Driving Competitive Aquaculture Sector Development in Kenya; Quick Scan of Robustness, Reliability and Resilience of the Aquaculture Sector; Report 2017-092 3R Kenya; Wageningen University & Research: Wageningen, The Netherlands, 2017; 68p. [Google Scholar]
  21. Yamane, T. Statistics, an Introductory Analysis, 2nd ed.; Harper and Row: New York, NY, USA, 1967; pp. 89–94. [Google Scholar]
  22. Baskaran, R.; Managi, S.; Bendig, M. A public perspective on the adoption of microgeneration technologies in New Zealand: A multivariate probit approach. Energy Policy 2013, 58, 177–188. [Google Scholar] [CrossRef]
  23. Wooldridge, J.M. Basic Econometrics, 2nd ed.; Massachusetts Institute of Technology: Cambridge, MA, USA, 2008. [Google Scholar]
  24. Tarekegn, K.; Haji, J.; Tegegne, B. Determinants of honey producer market outlet choice in Chena District, southern Ethiopia: A multivariate probit regression analysis. Agric. Food Econ. 2017, 5, 1–14. [Google Scholar] [CrossRef] [Green Version]
  25. Suhaimi, M.; Aisyah, N.; de Mey, Y.; Oude Lansink, A. A Transaction Cost Analysis of Malaysian Dairy Farmers’ Marketing Channel Selection. In Proceedings of the European Association of Agricultural Economists (EAAE) International Congress, Parma, Italy, 28 August–1 September 2017. [Google Scholar]
  26. Kiritu, H.; Wanyingi, A.; Gathii, L. East Africa Fish Market Assessment; Prepared for: Msingi East Africa; IPSOS Limited: Nairobi, Kenya, 2018. [Google Scholar]
  27. Chikowi, C.T.; Ochieng, D.O.; Jumbe, C.B. Consumer choices and demand for tilapia in urban Malawi: What are the complementarities and trade-offs? Aquaculture 2020, 530, 735755. [Google Scholar] [CrossRef]
  28. Kariuki, M.B.J. Analysis of Market Performance: A Case of ‘Omena’ Fish in Selected Outlets in Kenya; No. 634-2016-41486; Egerton University Graduate School: Egerton, Kenya, 2011. [Google Scholar]
  29. Brunsø, K.; Verbeke, W.; Olsen, S.O.; Jeppesen, L.F. Motives, barriers and quality evaluation in fish consumption situations: A comparison between heavy and light users in Spain and Belgium. Br. Food J. 2009, 111, 699–716. [Google Scholar] [CrossRef]
  30. Alonso, E.B.; Cockx, L.; Swinnen, J. Culture and food security. Glob. Food Secur. 2018, 17, 113–127. [Google Scholar] [CrossRef] [Green Version]
  31. Obiero, K.O.; Opiyo, M.A.; Munguti, J.M.; Orina, P.S.; Kyule, D.; Yongo, E.; Karisa, C.H. Consumer preference and marketing of farmed Nile Tilapia (Oreochromis niloticus) and African Catfish (Clarias gariepinus) in Kenya: Case study of Kirinyaga and Vihiga Counties. Int. J. Fish. Sci. Aquat. Stud. 2014, 1, 67–76. [Google Scholar]
  32. Chege, P.M.; Kimiywe, J.O.; Ndungu, Z.W. Influence of culture on dietary practices of children under five years among Maasai pastoralists in Kajiado, Kenya. Int. J. Behav. Nutr. Phys. Act. 2015, 12, 131. [Google Scholar] [CrossRef] [PubMed] [Green Version]
  33. Obwanga, B.; Mbauni, C.; Mwangi, C.F.; Soma, K. Food System Value-Chain Adaptability-Can New Opportunities Increase Food Security and Food Safety in Kibera? Linking Aquaculture to Urban Food Systems. Workshop Report-Discussing New Opportunities with the Aquaculture Value-Chains between Nyeri-Kibera; no 2020-066; Wageningen Economic Research: Hague, The Netherlands, 2020; 14p. [Google Scholar]
  34. Shimokawa, S. When does dietary knowledge matter to obesity and overweight prevention? Food Policy 2013, 38, 35–46. [Google Scholar] [CrossRef]
  35. Min, S.; Wang, X.; Yu, X. Does dietary knowledge affect household food waste in the developing economy of China? Food Policy 2020, 98, 101896. [Google Scholar] [CrossRef]
  36. Esilaba, F.A.; Moturi, W.N.; Mokua, M.A. Urban consumers’ fish preferences and the determinants influencing fish selection and consumption: Case study of Nakuru Town, Kenya. Int. J. Fish. Aquat. Stud. 2017, 5, 356–360. [Google Scholar]
  37. Blekking, J.; Tuholske, C.; Evans, C. Adaptive Governance and Market Heterogeneity: An Institutional Analysis of an Urban Food System in Sub-Saharan Africa. Sustainability 2017, 9, 2191. [Google Scholar] [CrossRef] [Green Version]
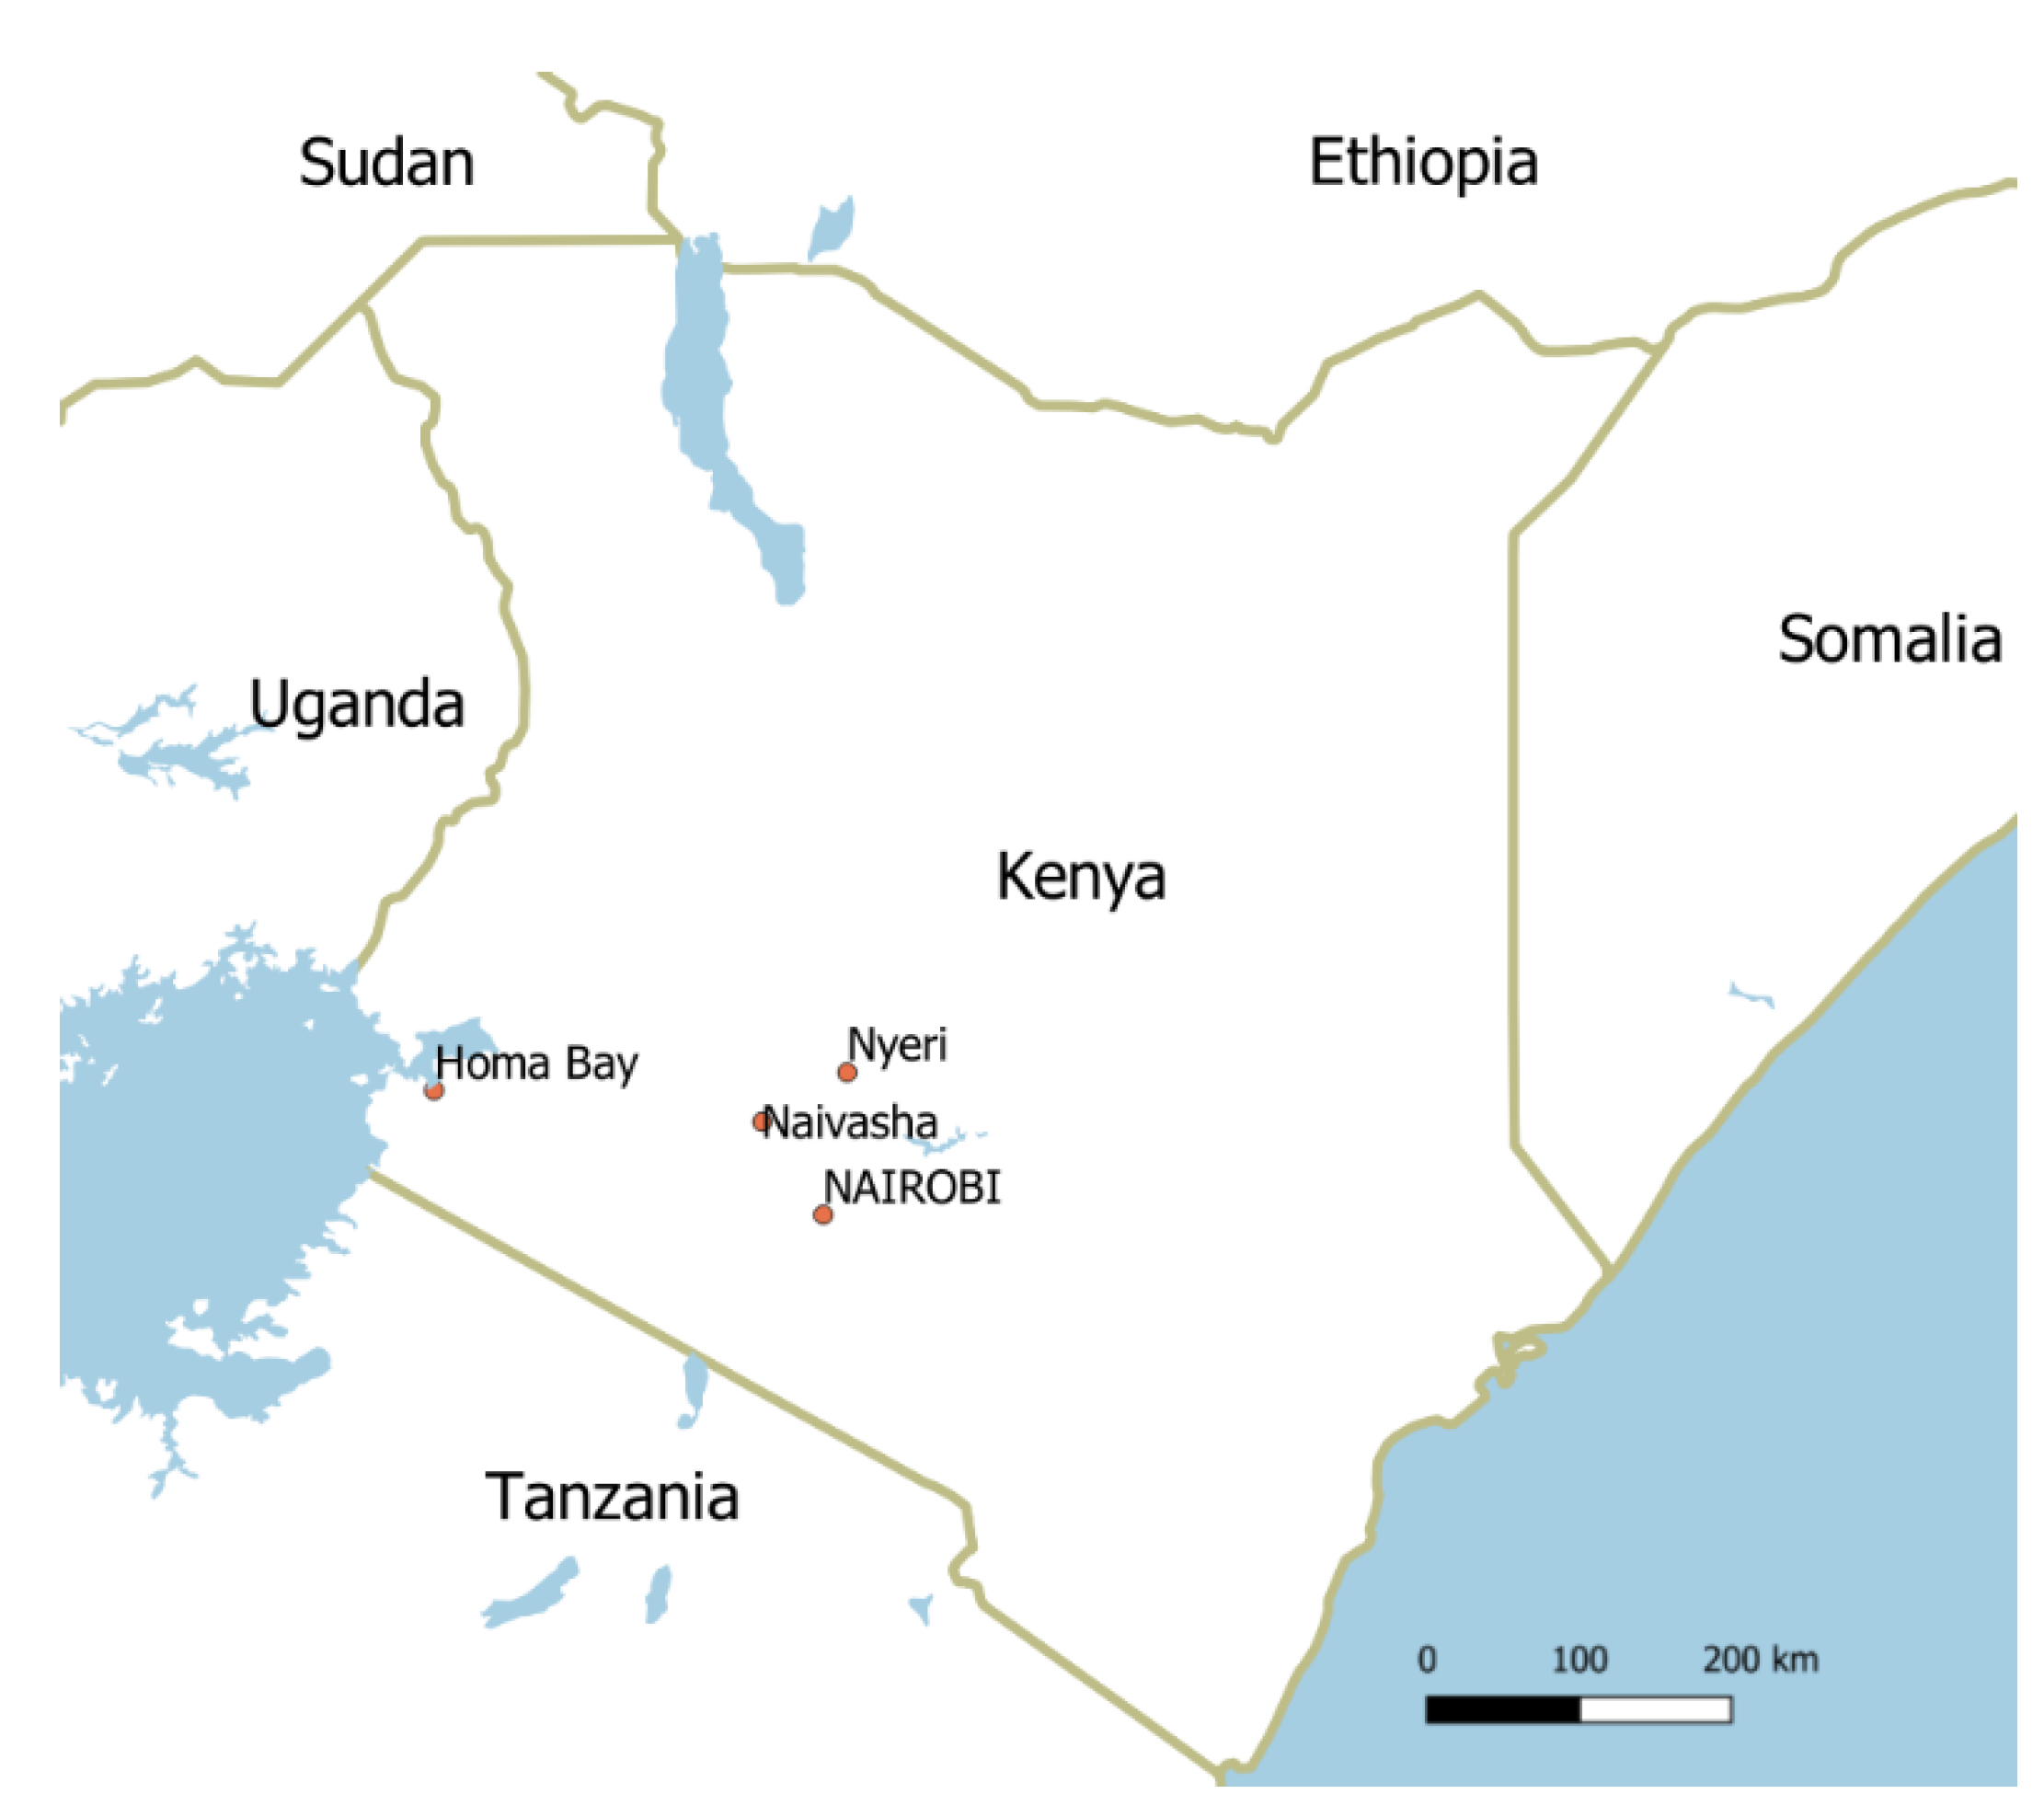
Figure 1. Map of Kenya, including Lake Victoria (including Homa Bay), Lake Naivasha and Nyeri, which are the core fish farming locations supplying fish to Kibera at present.
Sustainability 13 05278 g001
Figure 2. Map of Kibera indicating the 15 villages.
Sustainability 13 05278 g002
Figure 3. Household preferences for fish species (%).
Sustainability 13 05278 g003
Figure 4. Consumption frequency of fish in a month.
Sustainability 13 05278 g004
Figure 5. Location of purchase of fish by consumers.
Sustainability 13 05278 g005
Figure 6. Fish processing demands of by Kibera consumers.
Sustainability 13 05278 g006
Table 1. Ethnic composition of the Kibera population.
Tribe% Composition by Gender
MaleFemale
Luo34.935.4
Luyia26.532.5
Nubian11.69.1
Kikuyu7.96.4
Kamba7.510.3
Kisii6.42.2
Other tribes5.24.1
Total100100
Table 2. Descriptive statistics of variables included in the multivariate probit model.
Socio-Economic CharacteristicsMeanStandard Deviation
Gender of household head (1 = male)0.30060.4591
Education level of household head (0 = none to 5 = college/ university)3.28651.2297
Age of household head (years)41.216312.6721
Number of dependent in a household5.04492.2236
Total monthly household income (in KES (Kenya shillings))13,219.210010,356.5800
Institutional characteristics
Neighbourhood effect (% of neighbours from the same tribe)46.311826.8734
Number of fish outlet with 100 m radius5.74164.7886
Migration to Kibera (1 = lived in Kibera since birth)0.17130.3773
Tribal origin (1 = western Kenya, 0 = others)0.77530.4180
Culture influence of food choices (%)43.679830.2607
Religion influence on food choices (%)9.132019.8869
Decision makers on fish (female household head)0.73880.4399
Decision makers on fish (male household head)0.20790.4064
Decision makers on fish (other household members)0.05340.2251
Dietary knowledge index (composite score of between 1 and 45)30.06183.4619
Price sensitivity (Likert 1 = not important to 5 = very important)4.46350.9619
Table 3. Mean prices/kilogram for different fish species.
Fish SpeciesMean Price EUR (KES) *Standard Deviation
Nile tilapia3.77 (374.11)106.29
African catfish3.11 (308.33)78.54
Lake Victoria sardine1.58 (157.36)41.73
Common carp2.76 (274.29)80.59)
Nile perch3.42 (339.02)131.91
Other fish2.51 (249.09)89.49
* Exchange rate: 0.01007725.
Table 4. Correlation matrix of fish species and model fit statistics.
Nile TilapiaLake Victoria SardineNile Perch
Lake Victoria sardine−0.2435 *** (0.0985)
Nile perch−0.3674 *** (0.0950)−0.1626 (0.09778) *
Other fish species0.2453 * (0.01260)0.0843 (0.1378)0.1290 (0.1171)
Likelihood ratio test 39.0199 Prob x2 > p = (0.0000)
Number of observations 356
Log likelihood −658.8552
Wald x2 (60) = 109.99, p-value = (0.0001)
Note: *** and * represent significance at 1% and 10% significance levels, respectively.
Table 5. Determinants of household preference for different fish species based on probit model estimates.
Nile TilapiaLake Victoria SardineNile PerchOther Fish Species
Coef.Std. Err.Coef.Std. Err.Coef.Std. Err.Coef.Std. Err.
Socio-economic characteristics
Gender of household head (1 = male)−0.26030.17850.14980.19100.16980.1878−0.05240.2531
Education level of household head0.06760.07020.00870.07410.04260.07230.00050.1065
Age of household head0.00180.0073−0.01090.0078−0.00850.0078−0.01440.0106
Number of dependent in a household−0.03640.03670.1047 ***0.03970.04460.0376−0.02680.0510
Total household income0.1986 *0.1069−0.17630.11240.2281 **0.11350.09020.1507
Institutional characteristics
Neighbourhood effect0.00240.00290.00400.0030−0.0050 *0.00290.00180.0040
Number of fish outlet with 100 m radius−0.00340.01640.0472 **0.02060.00760.01620.02820.0209
Migration to Kibera (1 = lived in Kibera since birth)0.54280.2249−0.46020.20610.04560.2103−0.05990.2838
Tribal origin (1 = western Kenya, 0 = others)0.2922 **0.18970.3388 **0.19330.00830.20170.23690.2803
Culture influence of food choices0.00080.00270.0059 **0.00280.00010.0028−0.00560.0041
Religion influence on food choices0.00700.00420.00450.0041−0.00580.0043−0.0168 ***0.0045
Decision makers on fish (Female = base category)
Male decision makers0.17700.19810.18870.2064−0.15020.19870.15830.2500
Other household members decision makers0.47920.3390−0.17740.3301−0.39650.38050.7113 *0.3893
Dietary knowledge index−0.00380.02140.00740.0220−0.0394 *0.02190.03760.0334
Price sensitivity0.1386 *0.0757−0.1409 *0.08520.00780.0764−0.02940.1019
Constant−2.38171.28771.59541.3210−1.47921.3175−2.94481.9043
Note: ***, ** and * represent significance at 1%, 5% and 10 % significance levels, respectively.
Publisher’s Note: MDPI stays neutral with regard to jurisdictional claims in published maps and institutional affiliations.