
Energy Efficiency Measures in Bakeries toward Competitiveness and Sustainability—Case Studies in Quito, Ecuador

 ,
, 
 and
and 
Abstract
1. Introduction
2. Background
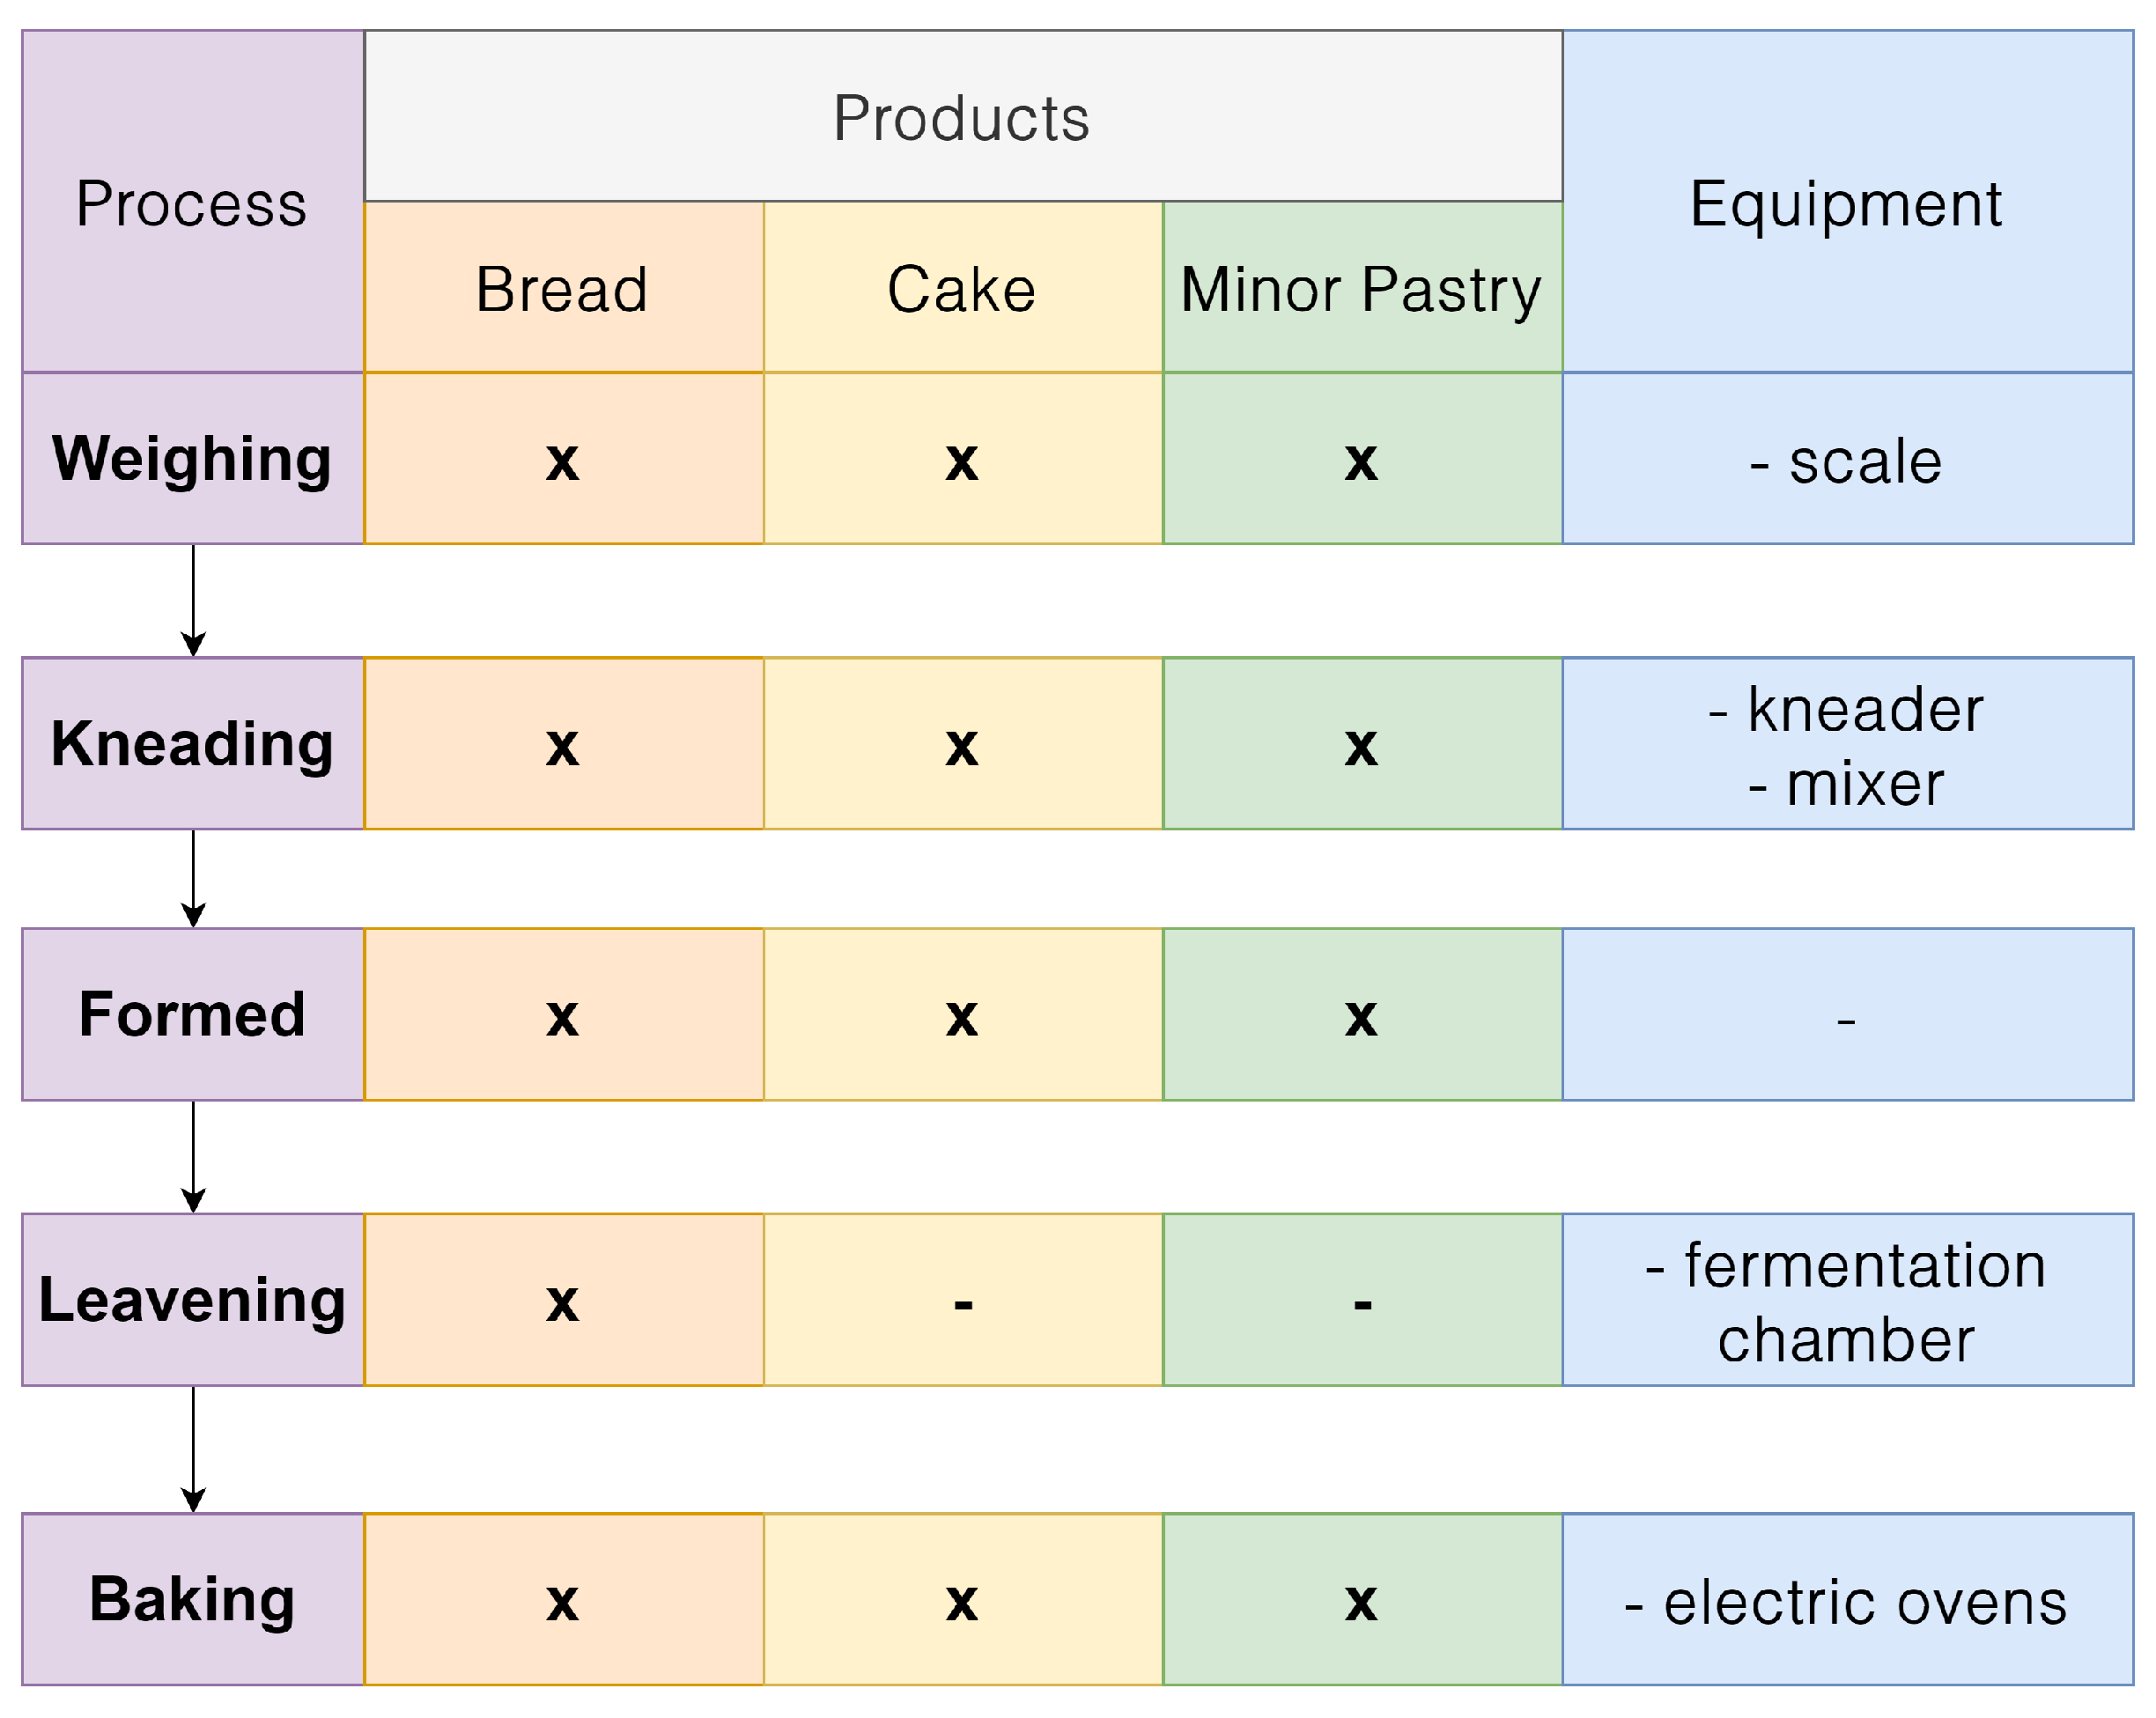
2.1. Bakeries
- Weighing: The first stage of production uses a scale to weigh all solid ingredients such as flour and yeast. After that, the eggs, salt, sugar, and butter are added to a container. Afterward, liquids, such as water, are measured. Finally, all of the ingredients are placed in a container.
- Kneading: With the ingredients already weighed, it is deposited inside the kneading equipment. They are combined for around 5 to 10 min., depending on the quantity. In the end, the mixture is collected from the kneader. Subsequently, the final mixture is deposited in a container to rest for a time of 10 min.
- Forming: Once the dough rests, we proceed to make cuts with previously indicated dimensions and then shape the dough. Besides, to add some other necessary detail for the bread, cake or little bakery. They are then placed in cans or molds, so that, in this way, they can enter the oven.
- Leavening: This stage is specifically for bread preparation. Here the cake or minor bakery is not included. With the help of cars, the loaves are entered into the fermentation chamber. They will remain for about 45 min., so that the bread takes the necessary size before baking. After the loaves come out of the chamber, let it rest for about 5 min.
- Baking: In this stage, electric ovens with a maximum temperature of 250 C are used, regular cooking is from 190 C to 250 C; this depends on the size and quantity of the smaller bread, cake, or bakery, and this will be for a time of 20 to 45 min.
2.2. Energy Efficiency Policies: ISO Standard 50001
- Pre-Audit: It is the beginning of the contact between the two parties whose purpose is to inspect the establishment, in addition to previously verifying the requirements of the standard. During this period, a team is usually established with part of the consulting firm and company personnel.
- First Phase of the Audit: All of the data concerning energy consumption in the establishment are collected, such as natural gas, fuel, and electricity consumption bills. The staff in charge of this work will reveal the establishment’s location and the area with the highest energy consumption.
2.3. Energy Baseline
2.4. State of the Facilities
2.5. Energy Audit
2.6. Energy Indicator
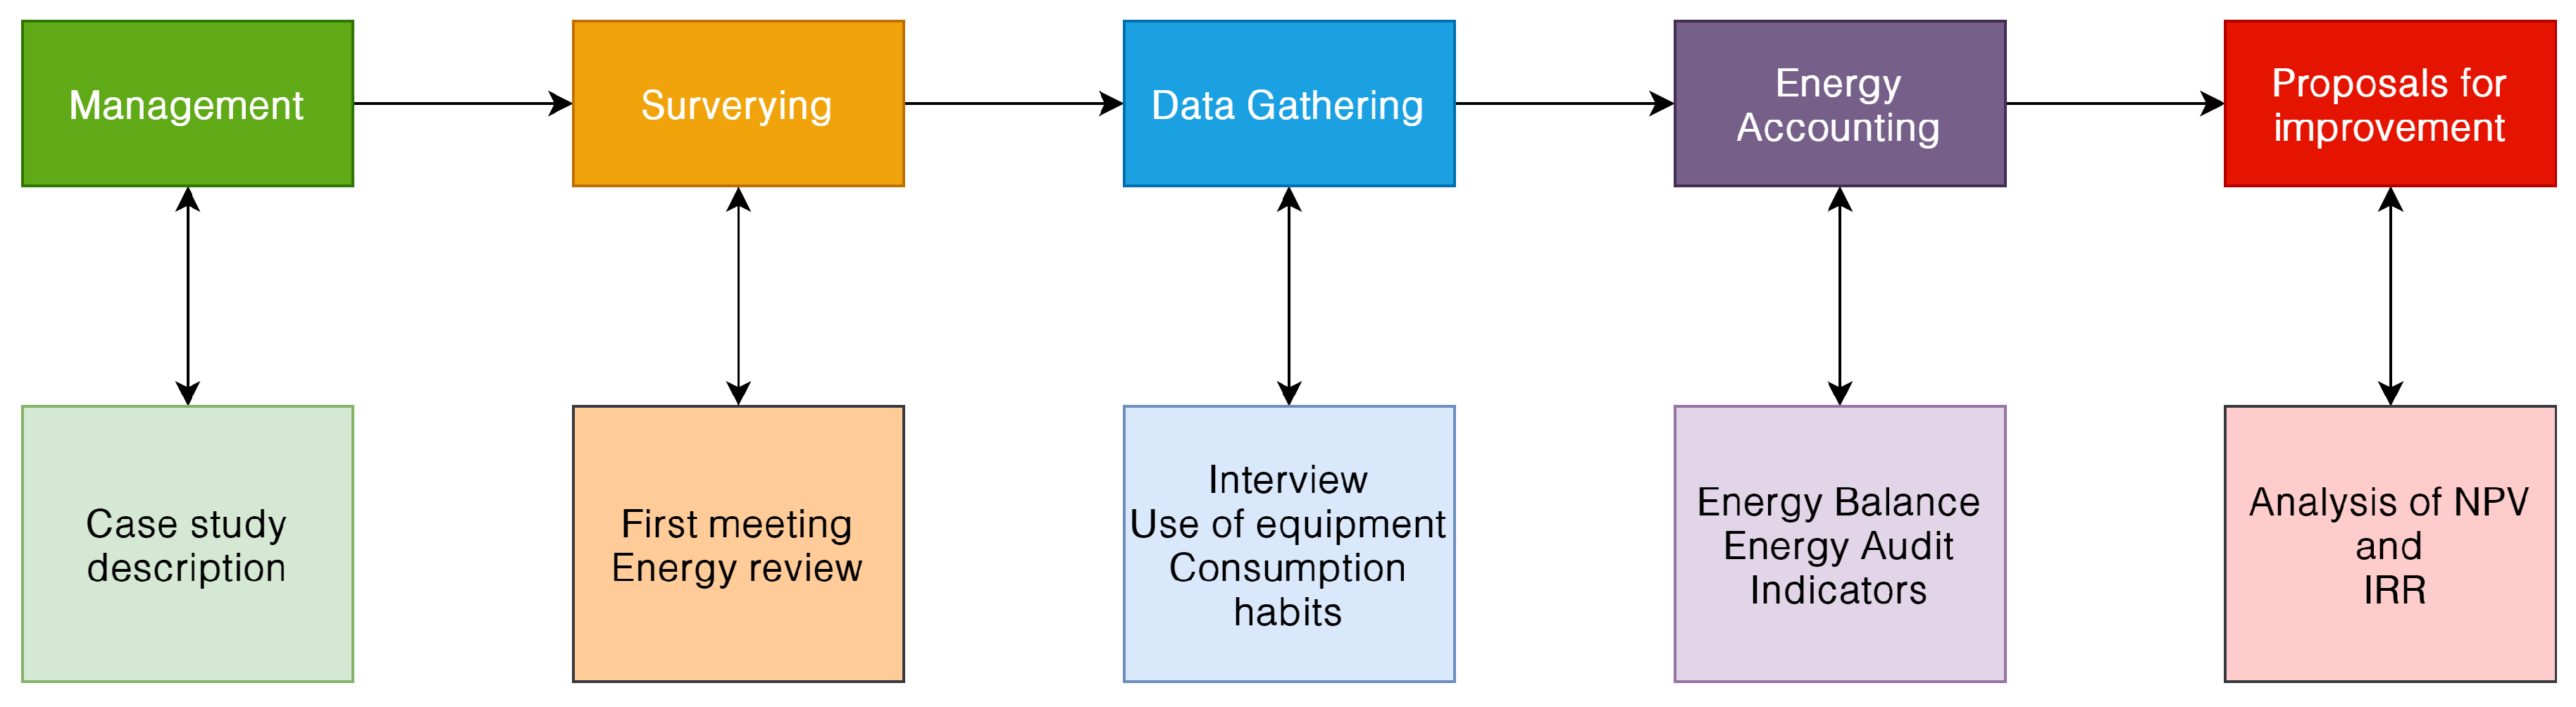
3. Methodology
3.1. Management
Case Study Description
3.2. Surveying
- First Meeting: At this stage, a confidentiality agreement was established for the project data with the bakeries and communication with those responsible for the industry, and how the information from the establishment will be collected. Finally, an appointment was scheduled for a technical and visual examination of the equipment.
- Energy Review: A visit was made to all areas of the bakeries, for both sale and production, to record the status of the equipment and electrical appliances present in the facilities to obtain all of the characteristics of the equipment and the tasks that are carried out in the place. This was done with the help of a weekly schedule.
3.3. Data Gathering
- Interviews: Information was collected through interviews with those in charge of energy consumption data for April 2020 and measures related to production equipment consumption. Furthermore, the review of essential documents and records to determine energy consumption and management was performed. Likewise, whether the devices or equipment are in good condition was analyzed. The questions considered in the interviews carried out were divided based on the different activities and processes (see Appendix A, Appendix B, Appendix C, Appendix D and Appendix E).
- Use of equipment: Information was collected regarding the use of the equipment and working hours; the lighting system and lower consumption electrical equipment were verified during the week and weekends to determine the consumption during the month.
- Consumption habits: Information was collected about the employees’ consumption habits within the establishment through personnel surveys to obtain data on hours of consumption and the use of electrical equipment during their recess or end of their hours of workdays. Awareness and proper energy management by management and employees were also taken into account.
3.4. Energy Accounting
3.4.1. Energy Balance
3.4.2. Energy Audit
3.4.3. Indicators
4. Results and Discussion
4.1. Energy Audit
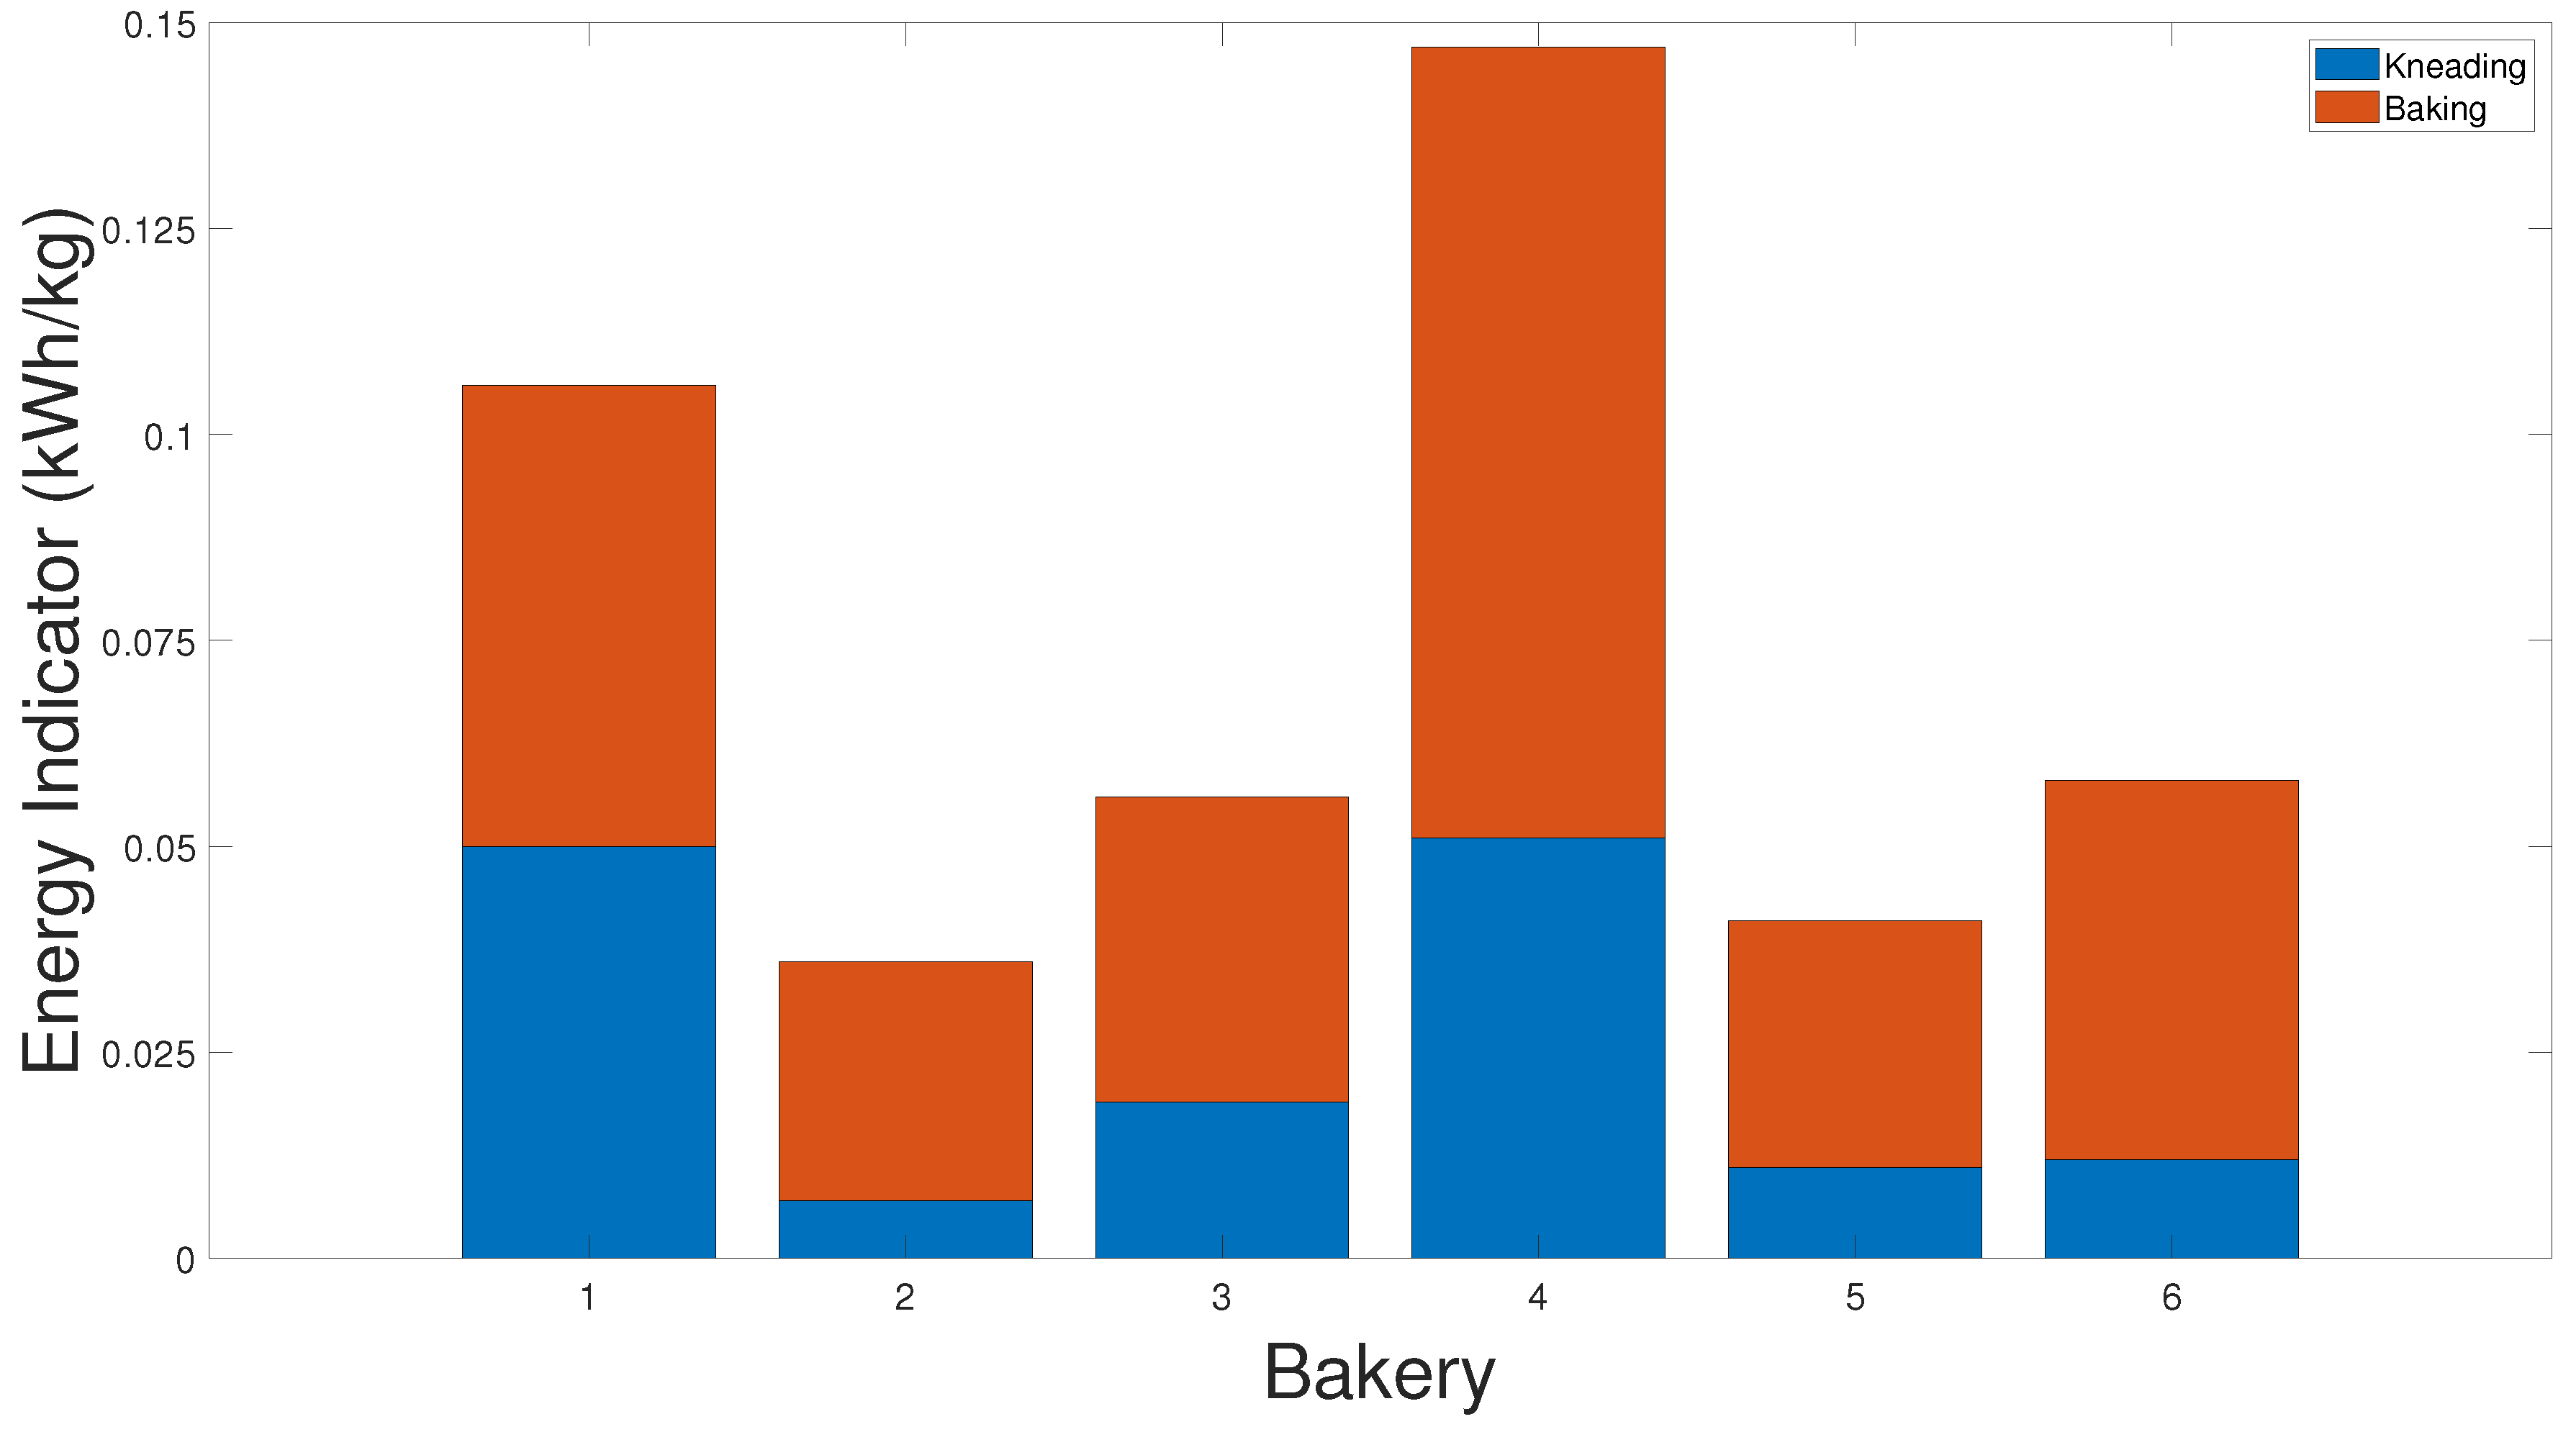
4.2. Indicators
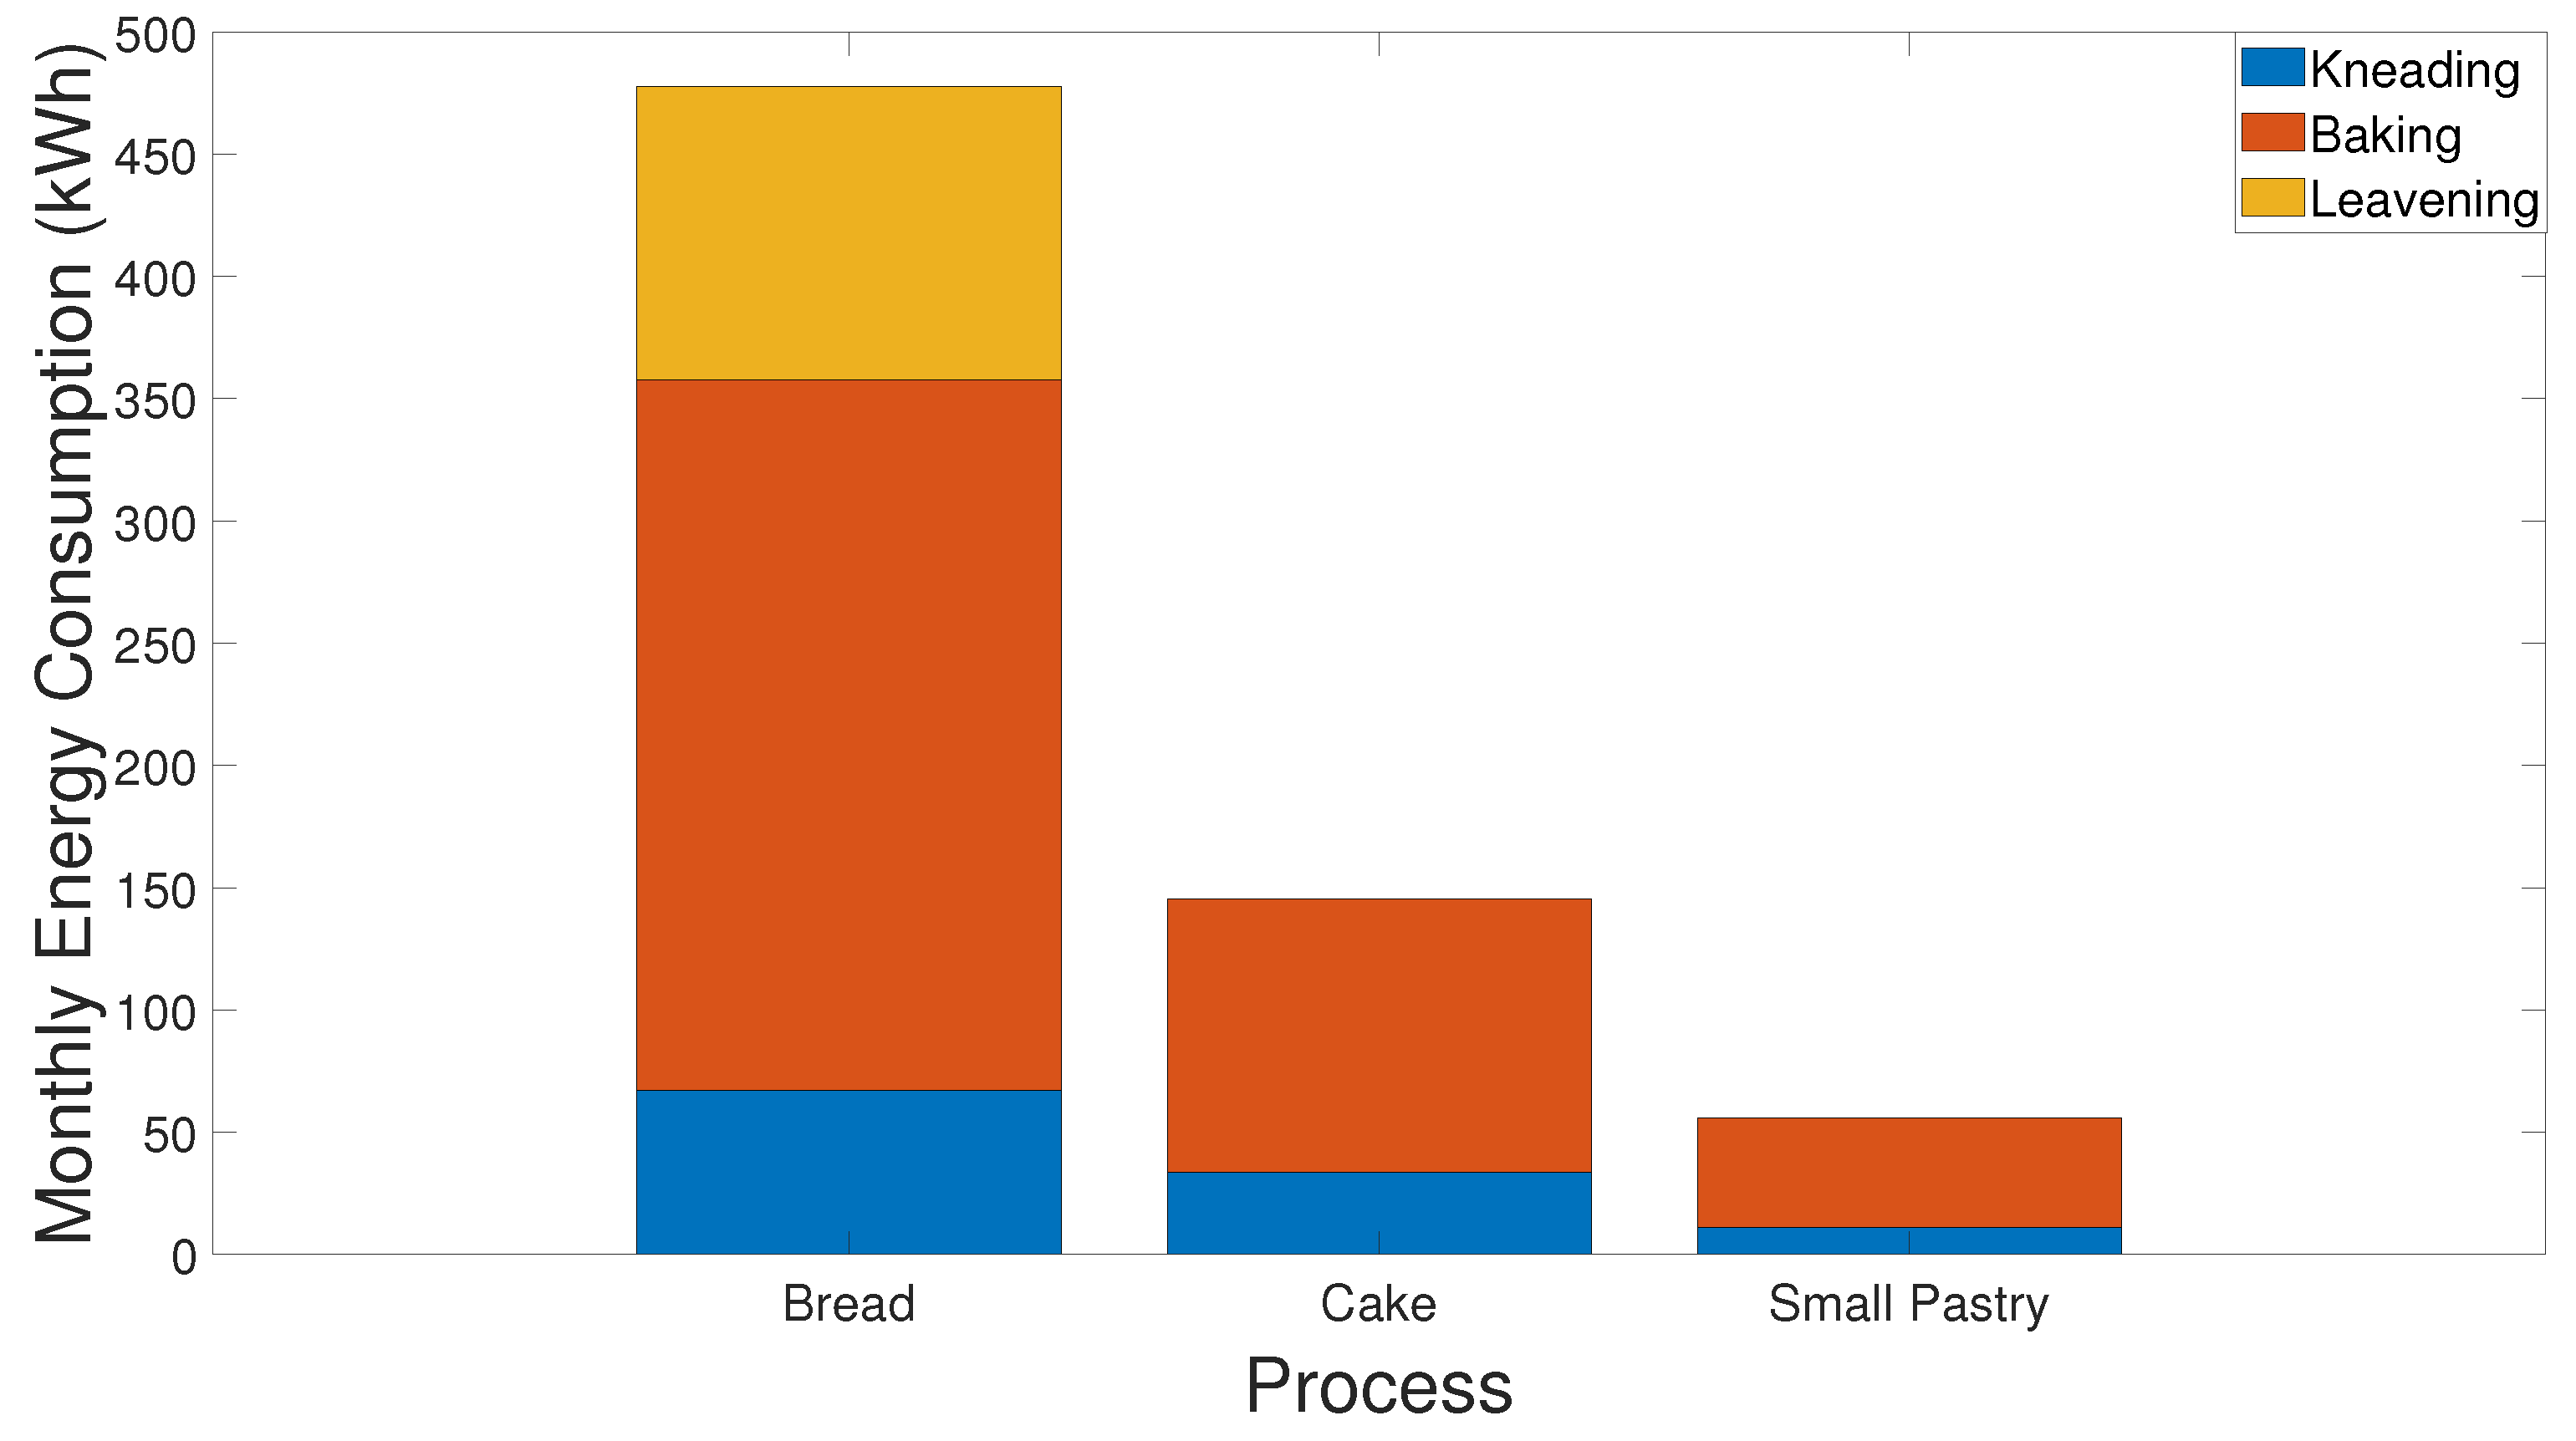
4.3. Higher Consumption Processes
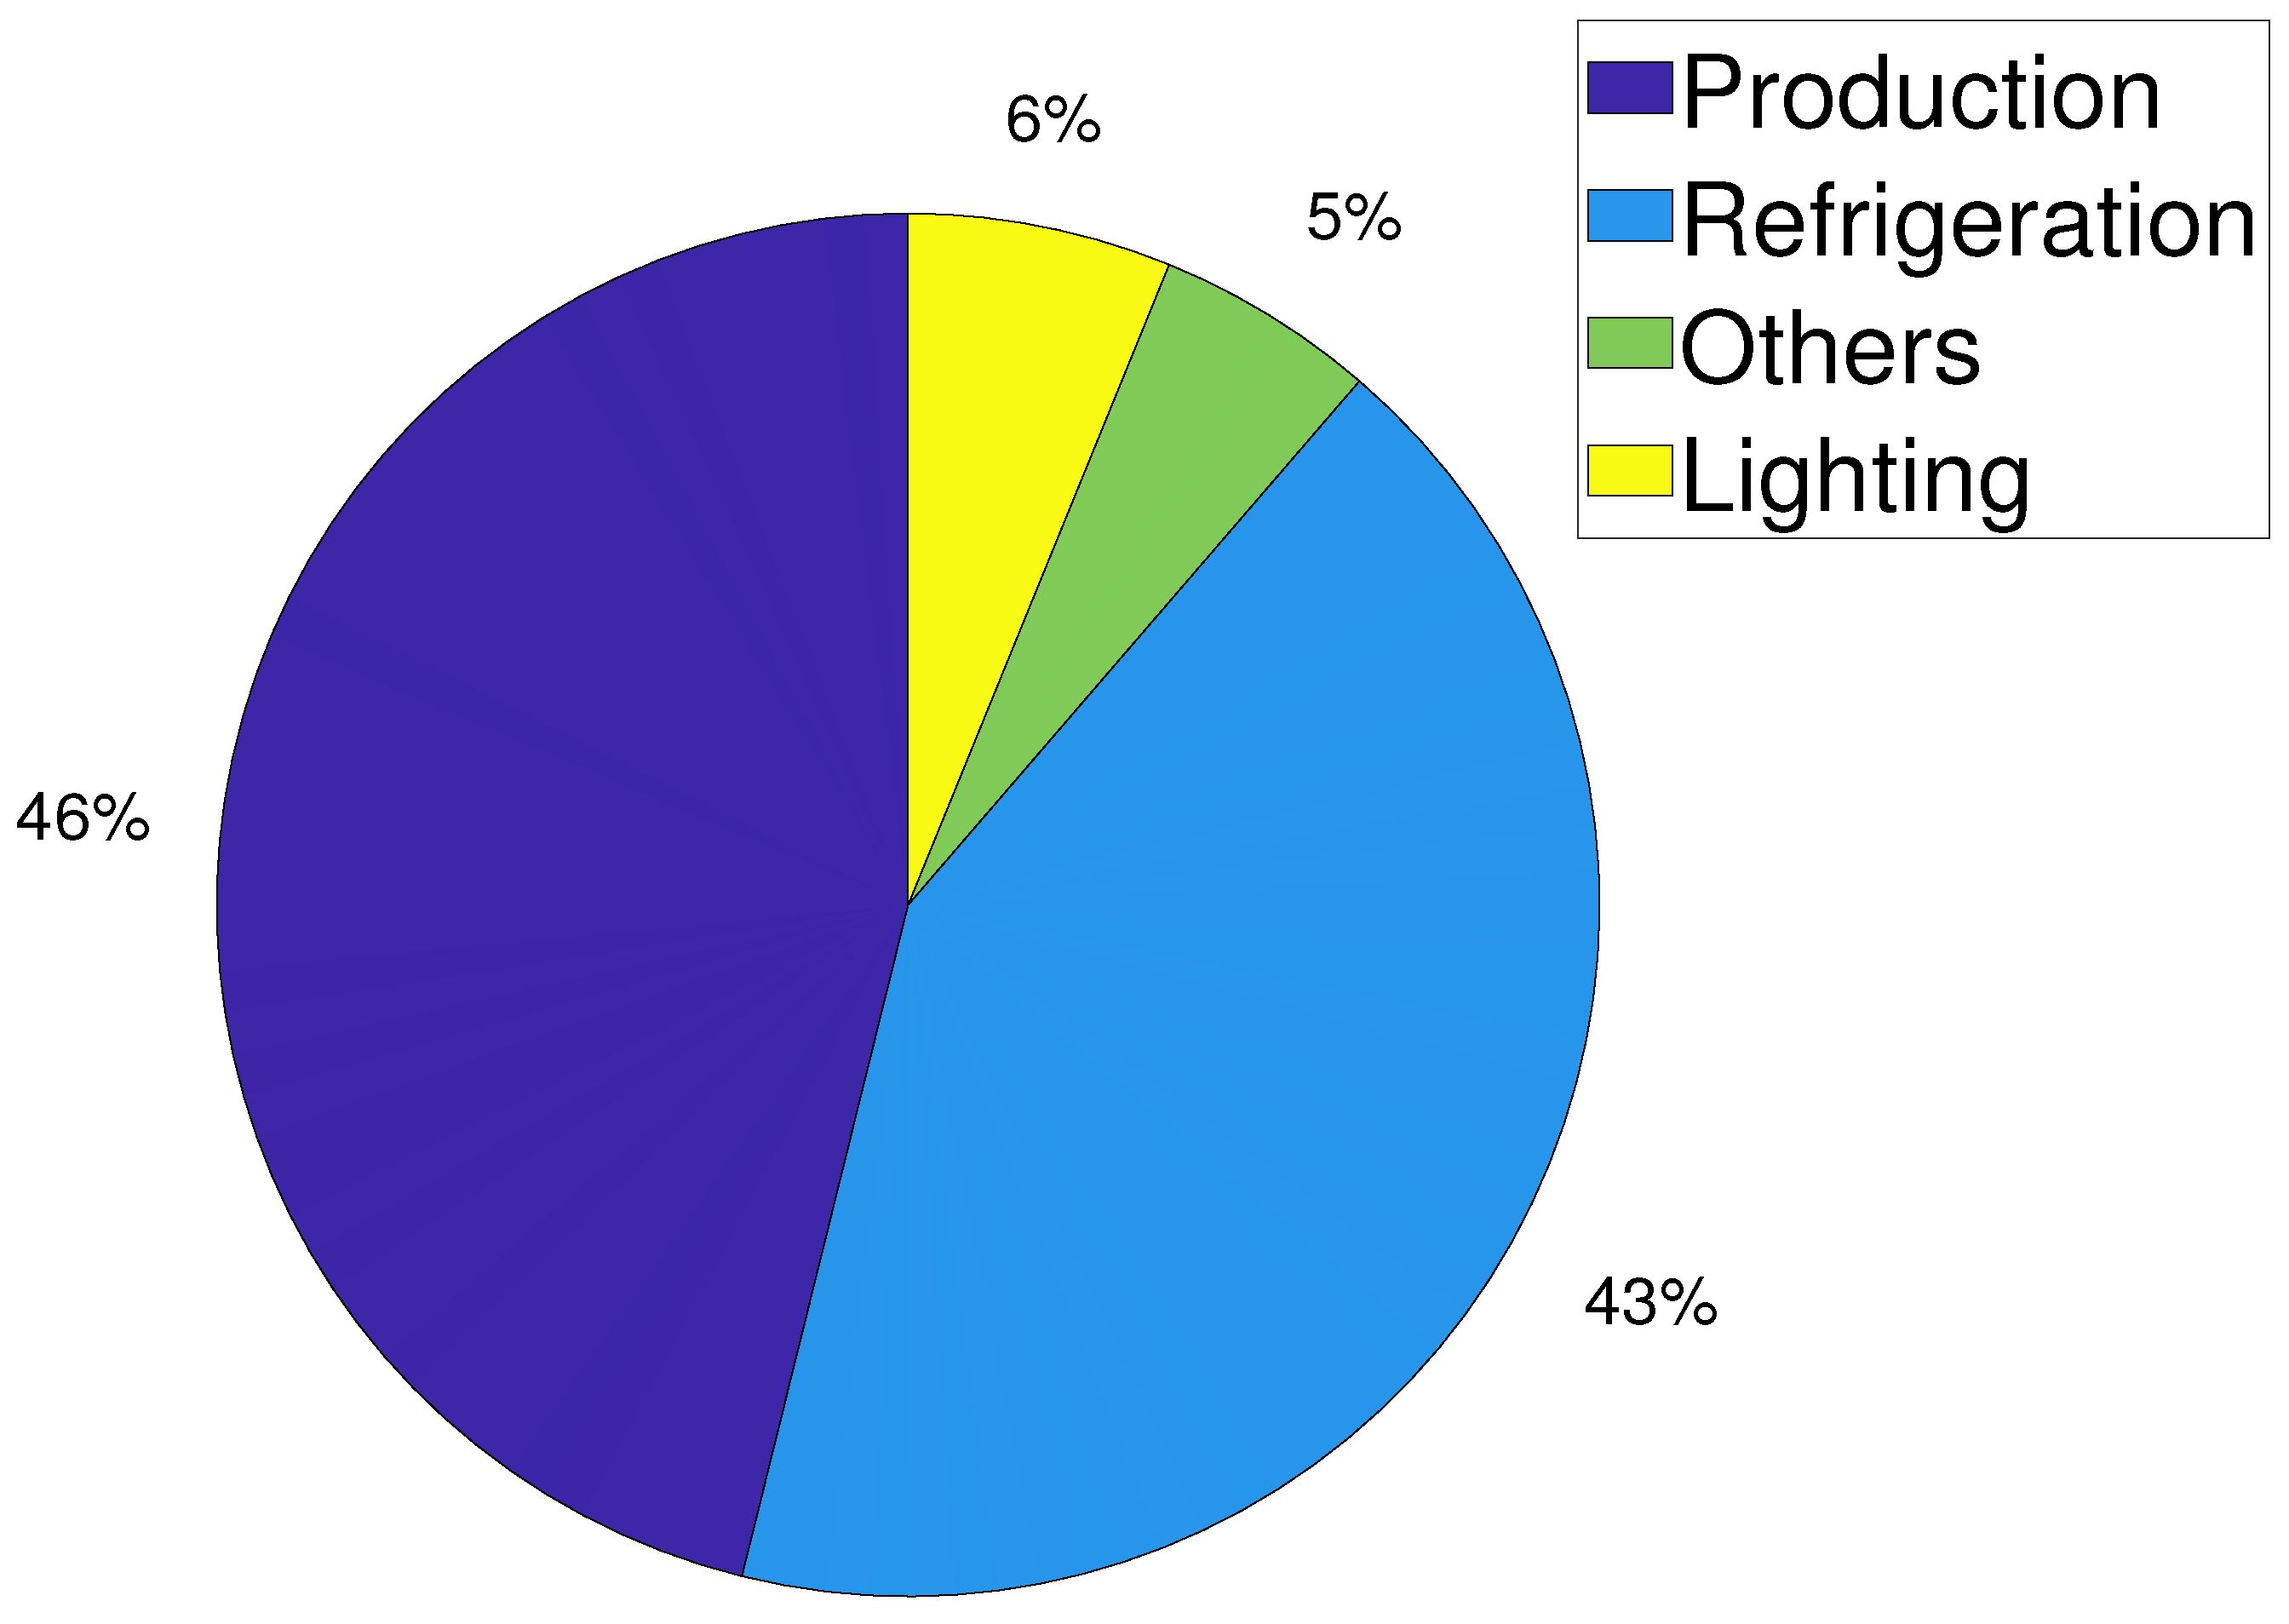
4.4. Higher Consumption Activities
4.5. Proposals for the Improvement of Energy Efficiency
- A change of equipment was proposed for the kneading process. Table 3 shows data of old and new proposal. The proposed equipment has a higher capacity for dough processing, with 10 kg per cycle, which will reduce the processing time from 120 h in a month to 36 h. Moreover, the proposed equipment has less power with 750 W, and the energy-saving will be 105 kWh/month. NPV and IRR were calculated with a rate of discount of 6.94% taken from the Central Bank of Ecuador, and an average cost of investment of $636.96 for the kneader after analyzing three different models with the same characteristics, and an annual profit of $ 163.8 for the reduction in the energy bill. The NPV for this proposal after ten years was $555.04 and IRR of 22%.
- For the fermentation chamber, better process management was proposed since the fermentation chamber was partially used due to the limitations of the kneading process. This action will reduce the time of use from 300 h in a month to 96 h, with an energy saving of 102 kWh/month.
- The oven was also partially used due to constraints in the kneading process, and better process management will reduce the time of use with savings of 200 kWh/month.
- The refrigeration activity has a poor performance since the heat emission from ovens is quickly gained by refrigerators. It is recommended to improve thermal isolation in all bakeries. The heat gained by refrigerators was not measured, since it is a secondary bakeries activity, and it should be analyzed in future studies.
- Lighting and minor equipment were not analyzed in detail, since they represent 11% of the whole energy consumption. However, the time of use of this equipment could be reduced with staff training.
5. Conclusions
Author Contributions
Funding
Institutional Review Board Statement
Informed Consent Statement
Data Availability Statement
Acknowledgments
Conflicts of Interest
Abbreviations
| HVAC | Heating Ventilation and Air-Conditioning |
| IRR | Internal Rate of Return |
| NPV | Net Present Value |
Appendix A. Survey of Behavior
| Questions | Answers | |||||
| Bakery 1 | Bakery 2 | Bakery 3 | Bakery 4 | Bakery 5 | Bakery 6 | |
| Monday through Friday, how many hours does the facility operate daily? | 15 | 12 | 12 | 12 | 13 | 12 |
| How many hours does the facility operate daily on weekends? | 15 | 12 | 12 | 12 | 13 | 12 |
| What kind of activities does he fulfill? You can choose from several options. | kneading baking decoration sales - | kneading baking decoration sales administration | kneading baking decoration sales - | kneading baking decoration sales - | kneading baking decoration sales administration | kneading baking decoration sales - |
| In the course of your workday do you have a break? | yes | yes | yes | yes | yes | yes |
| How long is your break? | 30 min | 30 min | 30 min | 30 min | 30 min | 30 min |
| When you leave your workday or break, do you leave electrical equipment or appliances on? | yes | yes | yes | no | yes | no |
| Which appliances or equipment remain on? | refrigeration equipment | oven | refrigerator cash register machine | none | refrigeration equipment | none |
| Do you unplug the cables of electrical equipment or appliances that you do not use? | yes | yes | yes | no | yes | no |
| What are the electrical equipment or appliances that you disconnect? | fan television radio baking machine | mixer oven hand mixer | refrigerator cash register machine | none | mixer oven hand mixer | none |
| How do you consider the operation and condition of the electrical equipment? | regular | good | good | regular | good | good |
Appendix B. Survey of Equipment
| Questions | Answers | |||||
| Bakery 1 | Bakery 2 | Bakery 3 | Bakery 4 | Bakery 5 | Bakery 6 | |
| How many mixers or kneaders does the facility have? | 1 | 1 | 1 | 1 | 1 | 1 |
| What is the brand of the equipment? | Bomman KM | 6010 CB Imepa CF-16500 | Eisenbach1 200 | Eisenbach1 200 | Kneader AR-50 | Hornipan |
| What is the nominal power in (W)? | 1100 | 500 | 1200 | 1200 | 1100 | 745.7 |
| Time of daily use between week? | 4 | 10 | 4 | 4 | 5 | 3 |
| Time of daily use on weekend? | 4 | 10 | 3 | 4 | 5 | 3 |
| How many leavening chambers does the facility have? | 1 | 1 | 1 | 1 | 1 | 1 |
| What is the brand of the equipment? | Imepa CF-16 | Sopan 2C2P | Nova | Imepa | Nova | Adeucarpi |
| What is the nominal power in (W)? | 500 | 500 | 450 | 500 | 500 | 1100 |
| Time of daily use between week? | 10 | 8 | 8 | 9 | 7 | 5 |
| Time of daily use on weekend? | 10 | 8 | 8 | 9 | 7 | 5 |
| How many electric oven do you have in the facility? | 1 | 2 | 1 | 1 | 2 | 1 |
| What is the brand of the equipment? | Ecua hornos | (a) Hornipan (b) Hornipan | Inox (Harpia H pro-10) | Hornipan | (a) Ecua hornos (b) Ecua hornos | Inox |
| What is the nominal power in (W)? | 745.7 | (a) 745.7 (b) 745.7 | 1000 | 745.7 | (a) 745.7 (b) 745.7 | 850 |
| Time of daily use between week? | 15 | (a) 10 (b) 10 | 12 | 13 | (a) 9 (b) 9 | 12 |
| Time of daily use on weekend? | 15 | (a) 10 (b) 10 | 12 | 13 | (a) 9 (b) 9 | 12 |
| How many refrigerators does the facility have? | 2 | 3 | 2 | 2 | 3 | 2 |
| What is the brand of the equipment? | (a) IMBERA | (a) IM6 | (a) Midea HS 5C13707 | (a) MABE | (a) MABE | (a) Midea HS 5C13707 |
| (b) Midea HS-411SN | (b) IM6 | (b) Induram VFV-520 | (b) IMBERA VR-19 | (b) WAL 1F15759171 | (b) Induram VFV-520 | |
| - | (c) MABE | - | - | (c) Midea HS-411SN | - | |
| What is the nominal power in (W)? | (a) 380 | (a) 745.7 | (a) 450 | (a) 372.85 | (a) 372,85 | (a) 450 |
| (b) 450 | (b) 745.7 | (b) 670 | (b) 559.27 | (b) 80 | (b) 670 | |
| - | (c) 372,85 | - | - | (c) 450 | - | |
| Time of daily use between week? | (a) 24 | (a) 7 | (a) 24 | (a) 24 | (a) 24 | (a) 24 |
| (b) 6 | (b) 7 | (b) 8 | (b) 8 | (b) 24 | (b) 8 | |
| - | (c) 24 | - | - | (c) 13 | - | |
| Time of daily use on weekend? | (a) 24 | (a) 7 | (a) 24 | (a) 24 | (a) 24 | (a) 24 |
| (b) 6 | (b) 7 | (b) 8 | (b) 8 | (b) 24 | (b) 8 | |
| - | (c) 24 | - | - | (c) 13 | - | |
| Have any changes been made to appliances or equipment in the last year? | no | no | yes | yes | no | yes |
| What devices or equipment have been changed? | - | - | refrigerator | oven | - | mixer |
| Approximately how long ago was the change in the last year? | - | - | 12 months | 6 months | - | 12 months |
| What equipment or/ appliances do you run on a daily ? | refrigeration equipment | refrigerator | refrigerator | refrigerator | refrigerator and cooler | refrigeration equipment |
| How many hours are turn on this equipment? | 24 | 24 | 24 | 24 | 24 | 24 |
Appendix C. Survey of Lighting
| Questions | Answers | |||||
| Bakery 1 | Bakery 2 | Bakery 3 | Bakery 4 | Bakery 5 | Bakery 6 | |
| How many hours per day are the luminaires on, by area? | Production: 15 h | Production: 12 h | Production: 12h | Production: 13 h | Production: 13 h | Production: 12 h |
| Sales: 15 h | Sales: 12 h | Sales: 12 h | Sales: 13 h | Sales: 13 h | Sales: 12 h | |
| Do you turn off the lights you are not occupying? | yes | yes | yes | yes | yes | yes |
| How many lights do you have in the facility? | 5 | 9 | 7 | 6 | 7 | 7 |
| What is the nominal power in (W)? | 10 | 28 | 60 | 18 | 32 | 32 |
Appendix D. Survey of Production
| Questions | Answers | |||||
| Bakery 1 | Bakery 2 | Bakery 3 | Bakery 4 | Bakery 5 | Bakery 6 | |
| Approximately how much flour is used daily in (kg)? | 80 | 400 | 300 | 120 | 350 | 170 |
| Approximately how much flour is used Monday through Friday in (kg)? | 400 | 2000 | 1500 | 600 | 1750 | 850 |
| Approximately how much flour is used on weekends? | 200 | 800 | 600 | 220 | 600 | 320 |
| Approximately how many loaves of bread are produced daily? | 2500 | 6000 | 5000 | 4000 | 5000 | 3000 |
| Approximately how many loaves are produced from Monday to Friday? | 12,500 | 30,000 | 25,000 | 20,000 | 25,000 | 15,000 |
| Approximately how many loaves are produced on weekends? | 5000 | 12,000 | 10,000 | 8000 | 8000 | 6000 |
| Approximately how many cakes are produced from Monday to Friday? | 15 | 100 | 50 | 40 | 40 | 30 |
| Approximately how many cakes are produced on weekends? | 6 | 40 | 20 | 16 | 10 | 15 |
| How many (cookies, chocolates, nougats, truffles, alfajores, brownies, etc.) approximately are produced daily? | 50 | 200 | 150 | 130 | 180 | 150 |
| How many (cookies, chocolates, nougats, truffles, alfajores, brownies, etc.) approximately are produced from Monday to Friday? | 250 | 1000 | 750 | 650 | 900 | 750 |
| How many (cookies, chocolates, nougats, truffles, alfajores, brownies, etc.) approximately are produced on weekends? | 100 | 400 | 300 | 260 | 360 | 300 |
Appendix E. Survey of Maintenance
| Questions | Answers | |||||
| Bakery 1 | Bakery 2 | Bakery 3 | Bakery 4 | Bakery 5 | Bakery 6 | |
| Have you performed maintenance on electrical installations and equipment? | yes | yes | yes | yes | yes | no |
| What electrical facilities or equipment have been maintained? | oven | - | mixer | oven | oven | oven and refrigerator |
| How often is the maintenance or renewal of the machines performed? | 1–2 years | - | 1–2 years | 1–2 years | 1–2 years | 1–2 years |
| Do you know about the energy consumption used by electrical installations and equipment? | yes | yes | yes | no | yes | no |
| Does the facility have an energy plan? | no | no | no | no | no | no |
| Have you ever performed an energy consumption diagnosis of the facilities? | no | no | no | no | no | no |
| Have you ever implemented any energy saving measures? | no | unknown | no | no | no | unknown |
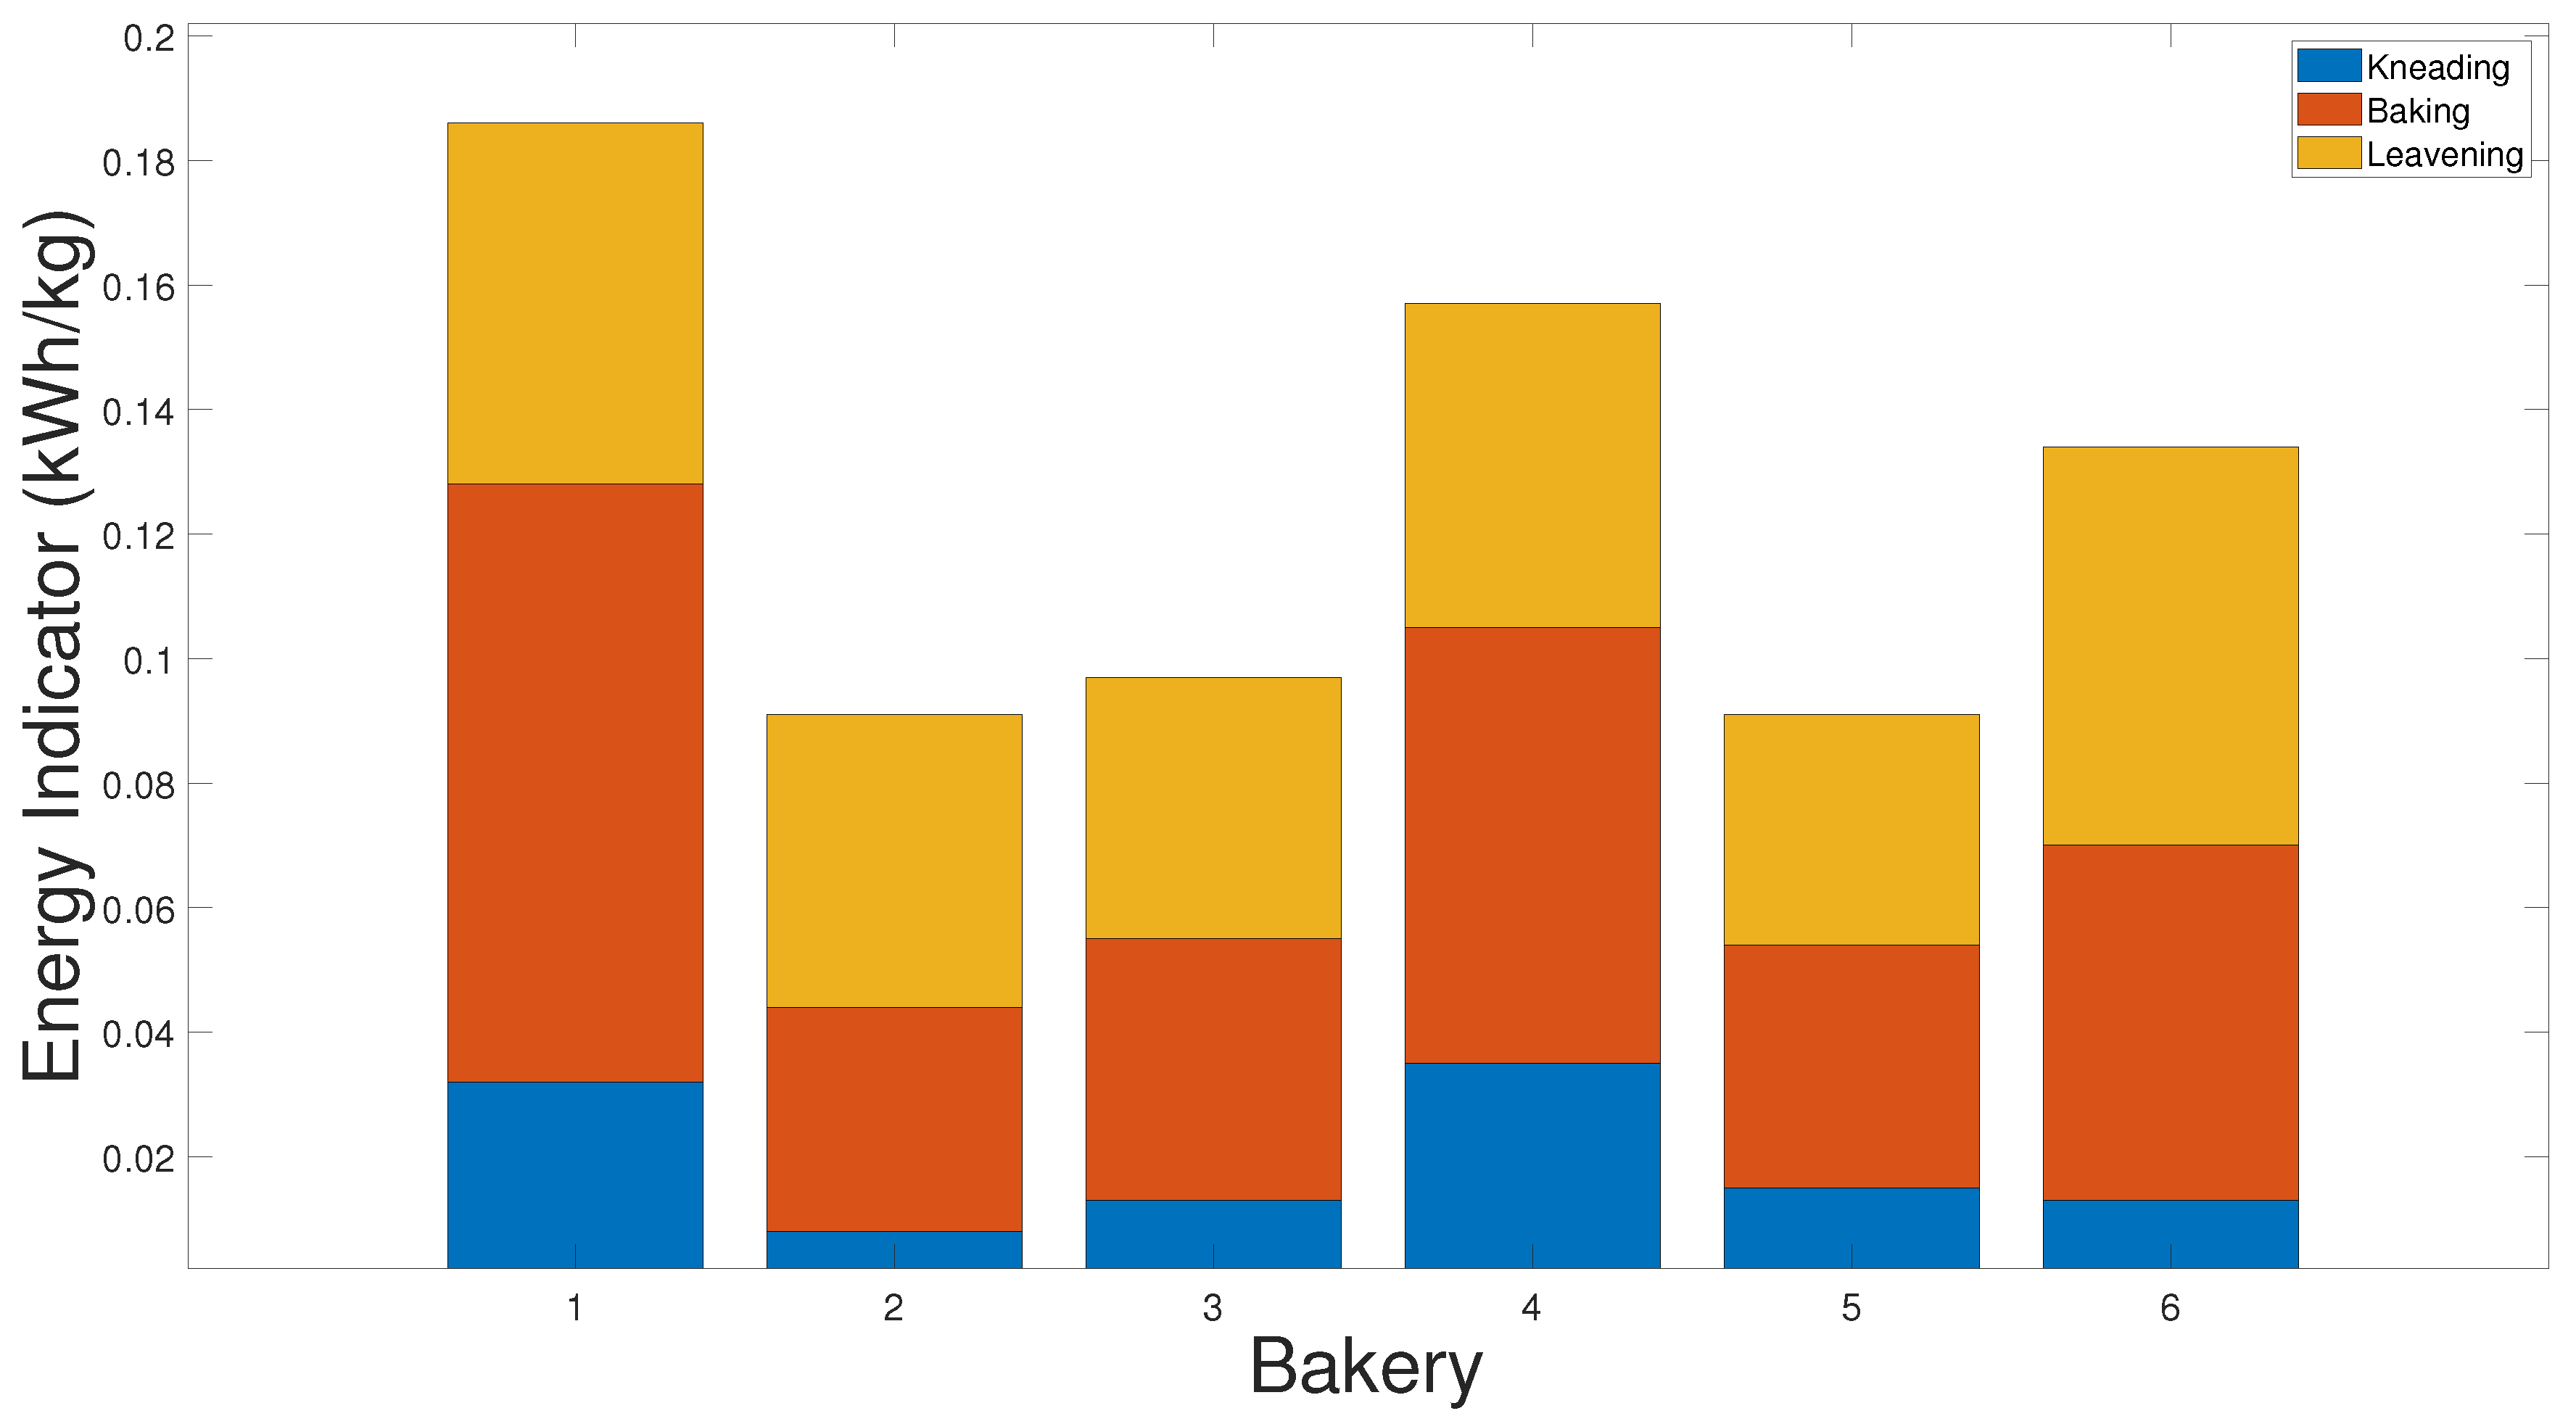
Appendix F. Energy Indicator for Bread Production by Bakery
| Process | Bakery 1 | Bakery 2 | Bakery 3 | Bakery 4 | Bakery 5 | Bakery 6 |
| [kWh/kg] | [kWh/kg] | [kWh/kg] | [kWh/kg] | [kWh/kg] | [kWh/kg] | |
| Kneading | 0.032 | 0.008 | 0.013 | 0.035 | 0.015 | 0.013 |
| Leavening | 0.058 | 0.047 | 0.042 | 0.052 | 0.037 | 0.064 |
| Baking | 0.096 | 0.036 | 0.042 | 0.070 | 0.039 | 0.057 |
| Total | 0.186 | 0.091 | 0.096 | 0.158 | 0.091 | 0.134 |
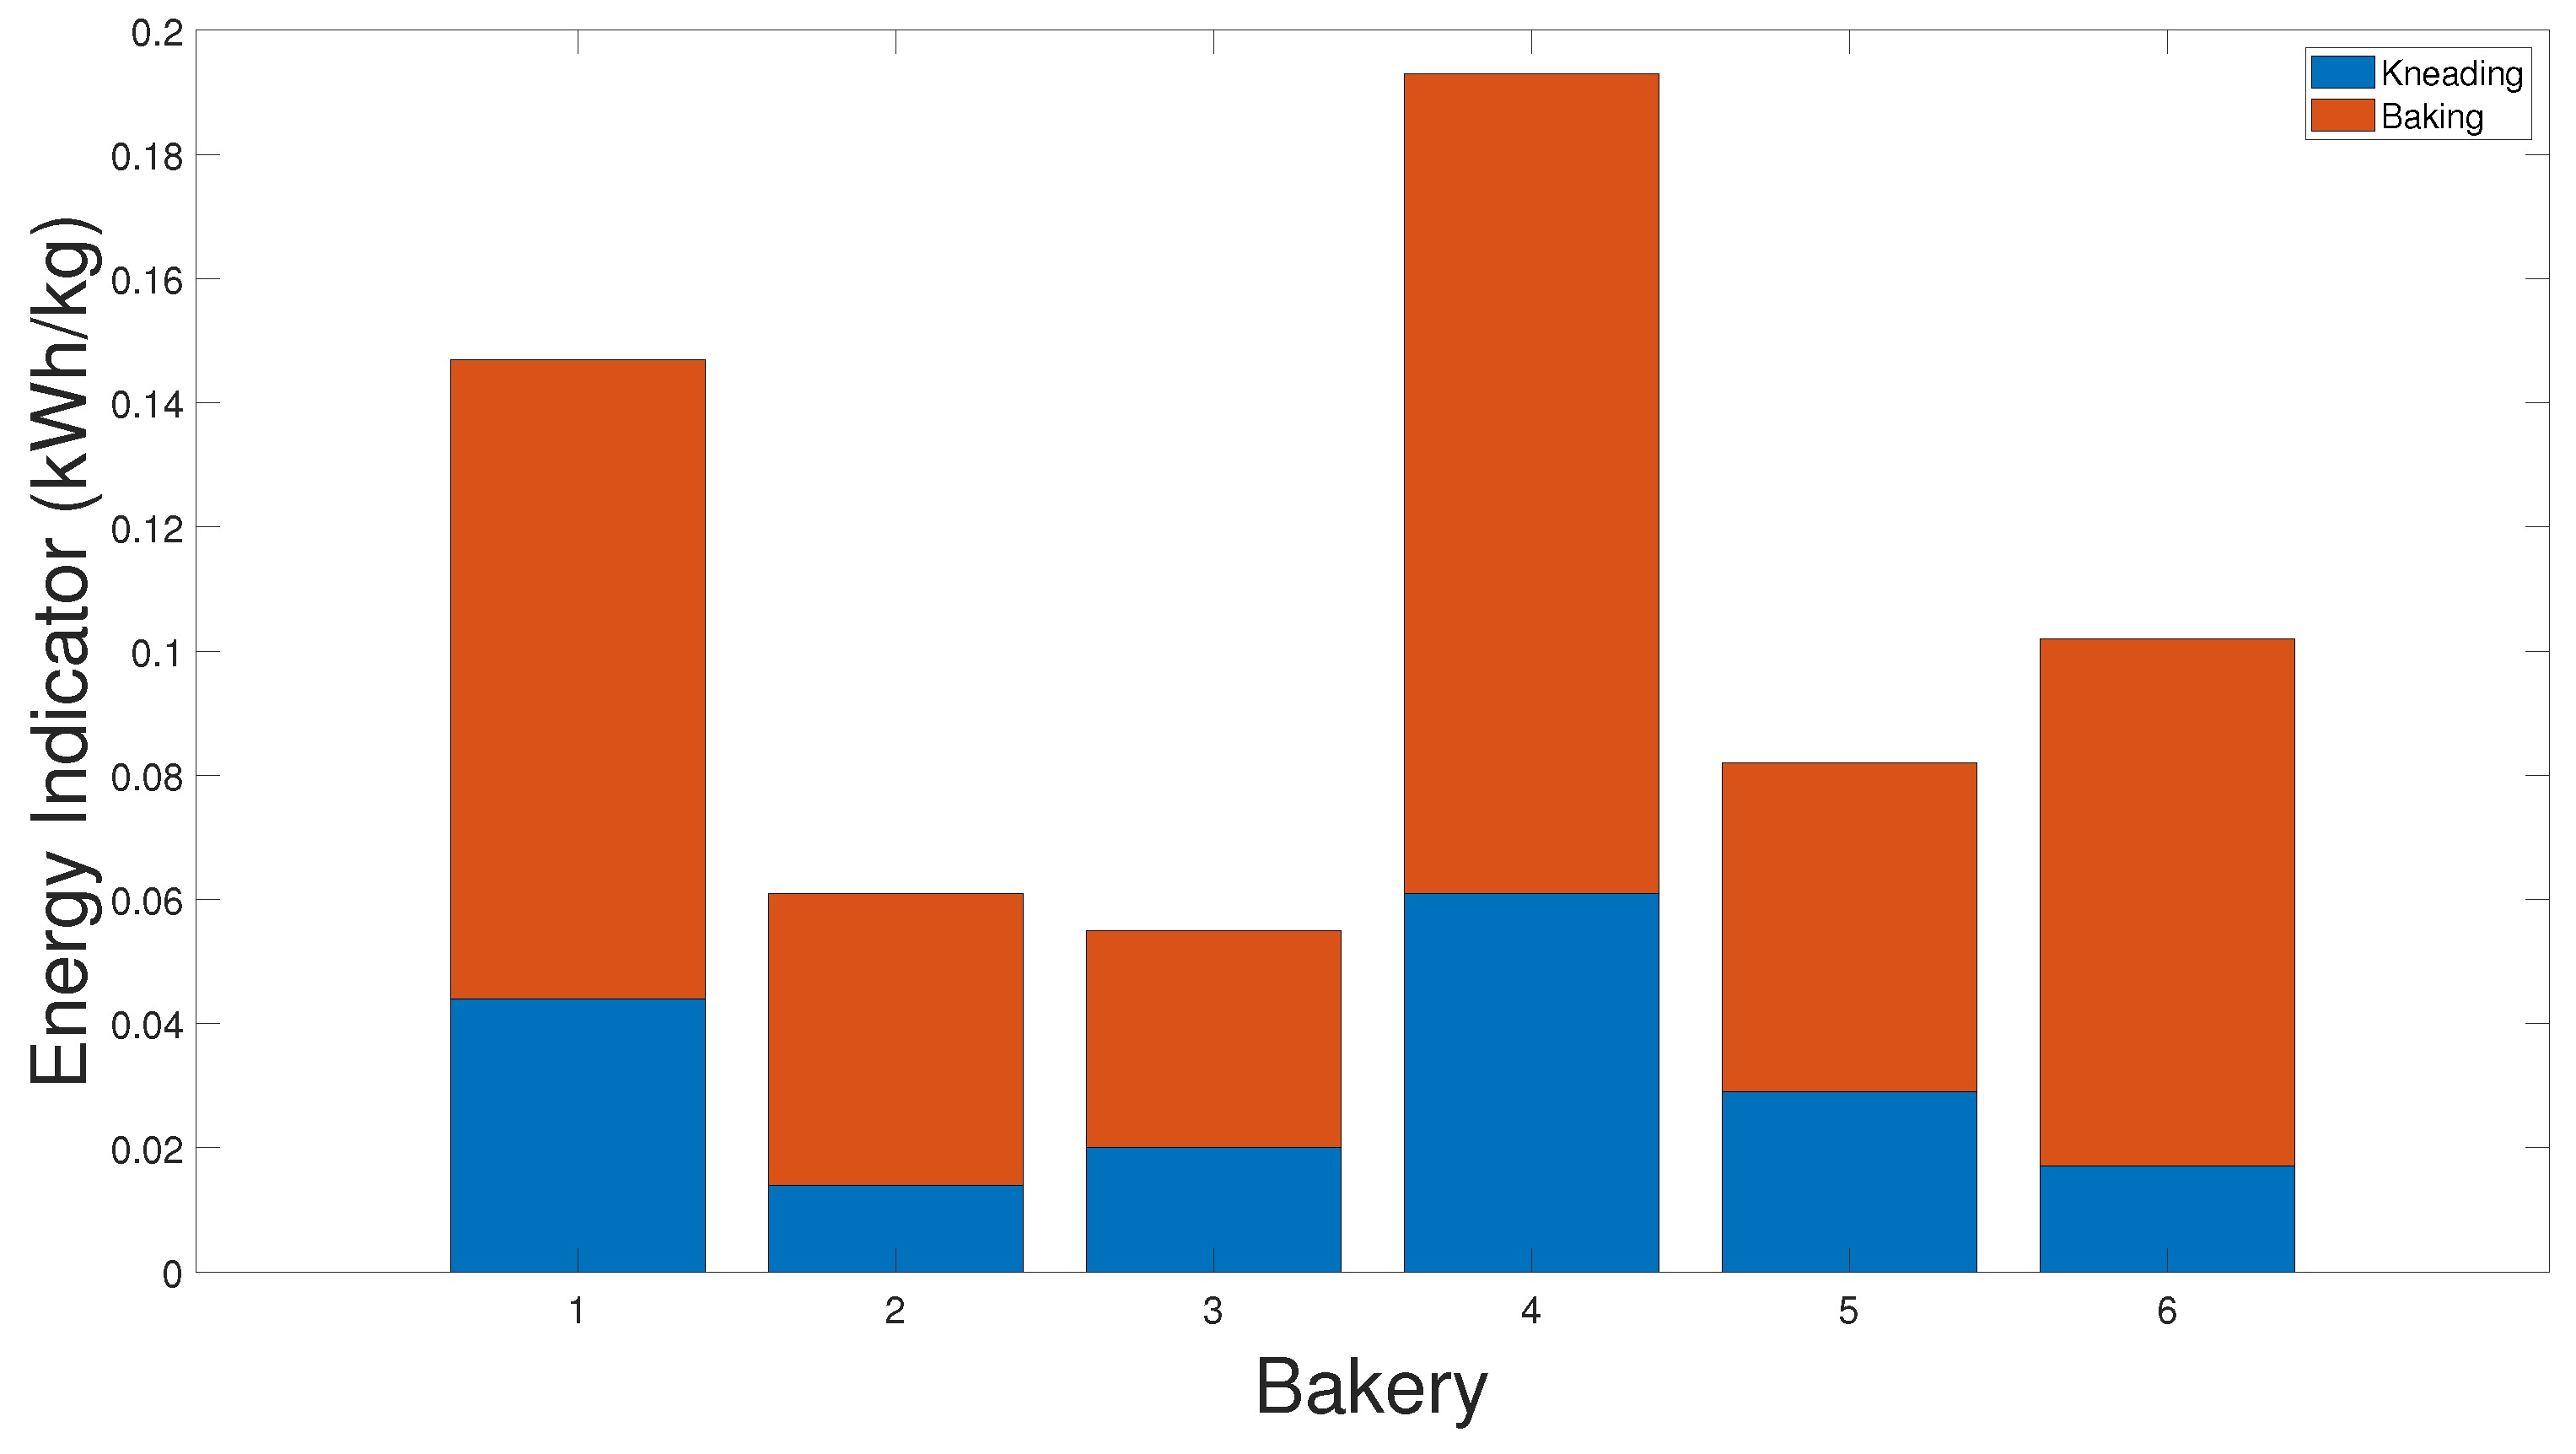
Appendix G. Energy Indicator for Cake Production by Bakery
| Process | Bakery 1 | Bakery 2 | Bakery 3 | Bakery 4 | Bakery 5 | Bakery 6 |
| [kWh/kg] | [kWh/kg] | [kWh/kg] | [kWh/kg] | [kWh/kg] | [kWh/kg] | |
| Kneading | 0.044 | 0.014 | 0.020 | 0.061 | 0.029 | 0.017 |
| Baking | 0.103 | 0.047 | 0.035 | 0.132 | 0.053 | 0.085 |
| Total | 0.147 | 0.061 | 0.055 | 0.192 | 0.082 | 0.102 |
Appendix H. Energy Indicator for Minor Pastry production by bakery
| Process | Bakery 1 | Bakery 2 | Bakery 3 | Bakery 4 | Bakery 5 | Bakery 6 |
| [kWh/kg] | [kWh/kg] | [kWh/kg] | [kWh/kg] | [kWh/kg] | [kWh/kg] | |
| Kneading | 0.050 | 0.007 | 0.019 | 0.051 | 0.011 | 0.012 |
| Baking | 0.056 | 0.029 | 0.037 | 0.096 | 0.030 | 0.046 |
| Total | 0.106 | 0.036 | 0.056 | 0.147 | 0.041 | 0.058 |
Appendix I. Energy Use by Activities
| Process | Bakery 1 | Bakery 2 | Bakery 3 | Bakery 4 | Bakery 5 | Bakery 6 |
| [kWh/kg] | [kWh/kg] | [kWh/kg] | [kWh/kg] | [kWh/kg] | [kWh/kg] | |
| Production | 618 | 679 | 600 | 570 | 662 | 538 |
| Refrigeration | 382 | 626 | 485 | 403 | 382 | 485 |
| Others | 28 | 76 | 59 | 49 | 66 | 51 |
| Lighting | 23 | 91 | 151 | 42 | 87 | 81 |
| Total | 1050 | 1472 | 1295 | 1063 | 1197 | 1155 |
References
- Li, M.J.; Tao, W.Q. Review of methodologies and polices for evaluation of energy efficiency in high energy-consuming industry. Appl. Energy 2017, 187, 203–215. [Google Scholar] [CrossRef]
- Clairand, J.M.; Briceño-León, M.; Escrivá-Escrivá, G.; Pantaleo, A.M. Review of Energy Efficiency Technologies in the Food Industry: Trends, Barriers, and Opportunities. IEEE Access 2020, 8, 48015–48029. [Google Scholar] [CrossRef]
- Cai, W.; Liu, C.; Lai, K.h.; Li, L.; Cunha, J.; Hu, L. Energy performance certification in mechanical manufacturing industry: A review and analysis. Energy Conver. Manag. 2019, 186, 415–432. [Google Scholar] [CrossRef]
- Malinauskaite, J.; Jouhara, H.; Ahmad, L.; Milani, M.; Montorsi, L.; Venturelli, M. Energy efficiency in industry: EU and national policies in Italy and the UK. Energy 2019, 172, 255–269. [Google Scholar] [CrossRef]
- Millán, G.; Llano, E.; Globisch, J.; Durand, A.; Hettesheimer, T.; Alcalde, E. Increasing energy efficiency in the food and beverage industry: A human-centered design approach. Sustainability 2020, 12, 7037. [Google Scholar] [CrossRef]
- Xie, X.; Lin, B. Understanding the energy intensity change in China’s food industry: A comprehensive decomposition method. Energy Policy 2019, 129, 53–68. [Google Scholar] [CrossRef]
- Sola, A.V.; Mota, C.M. Influencing factors on energy management in industries. J. Clean. Prod. 2020, 248. [Google Scholar] [CrossRef]
- Kong, L.; Price, L.; Hasanbeigi, A.; Liu, H.; Li, J. Potential for reducing paper mill energy use and carbon dioxide emissions through plant-wide energy audits: A case study in China. Appl. Energy 2013, 102, 1334–1342. [Google Scholar] [CrossRef]
- Klugman, S.; Karlsson, M.; Moshfegh, B. A Scandinavian chemical wood pulp mill. Part 1. Energy audit aiming at efficiency measures. Appl. Energy 2007, 84, 326–339. [Google Scholar] [CrossRef]
- Kabir, G.; Abubakar, A.I.; El-Nafaty, U.A. Energy audit and conservation opportunities for pyroprocessing unit of a typical dry process cement plant. Energy 2010, 35, 1237–1243. [Google Scholar] [CrossRef]
- Kluczek, A.; Olszewski, P. Energy audits in industrial processes. J. Clean. Prod. 2017, 142, 3437–3453. [Google Scholar] [CrossRef]
- Chiaroni, D.; Chiesa, V.; Franzò, S.; Frattini, F.; Manfredi Latilla, V. Overcoming internal barriers to industrial energy efficiency through energy audit: A case study of a large manufacturing company in the home appliances industry. Clean Technol. Environ. Policy 2017, 19, 1031–1046. [Google Scholar] [CrossRef]
- Escrivá-Escrivá, G.; Segura-Heras, I.; Alcázar-Ortega, M. Application of an energy management and control system to assess the potential of different control strategies in HVAC systems. Energy Build. 2010, 42, 2258–2267. [Google Scholar] [CrossRef]
- Hin, M.; Chan, E.; Chu, K.k.; Chow, H.f.; Tsang, C.w.; Kuen, C.; Ho, D.; Ho, S.K. Improving the Energy E ffi ciency of Petrochemical Plant Operations: A Measurement and Verification Case Study Using a Balanced Wave Optimizer. Energies 2019, 12, 4136. [Google Scholar]
- Arriola-Medellín, A.M.; López-Cisneros, L.F.; Aragón-Aguilar, A.; Romo-Millares, C.A.; Fernández-Montiel, M.F. Energy efficiency to increase production and quality of products in industrial processes: Case study oil and gas processing center. Energy Effic. 2019, 12, 1619–1634. [Google Scholar] [CrossRef]
- Licharz, H.; Rösmann, P.; Krommweh, M.S.; Mostafa, E.; Büscher, W. Energy efficiency of a heat pump system: Case study in two pig houses. Energies 2020, 13, 662. [Google Scholar] [CrossRef]
- Schroeder, E. Global Bread and Rolls Market Approaching $200 Billion. Available online: https://www.bakingbusiness.com/articles/29484 (accessed on 16 February 2021).
- Federation of Bakers. European Bread Market. Available online: https://www.fob.uk.com/about-the-bread-industry/industry-facts/european-bread-market/ (accessed on 16 February 2021).
- Malovany, D. Latin American Baking Industry Undergoing Significant Transformation. Available online: https://www.bakingbusiness.com/articles/48886 (accessed on 16 February 2021).
- SUPERCIAS. Companies by Economic Activity. Available online: https://reporteria.supercias.gob.ec/portal (accessed on 16 February 2021).
- INEC. National Economic Census. Available online: http://redatam.inec.gob.ec/ (accessed on 16 February 2021).
- Kannan, R.; Boie, W. Energy management practices in SME-Case study of a bakery in Germany. Energy Convers. Manag. 2003, 44, 945–959. [Google Scholar] [CrossRef]
- Zisopoulos, F.K.; Moejes, S.N.; Rossier-Miranda, F.J.; Van Der Goot, A.J.; Boom, R.M. Exergetic comparison of food waste valorization in industrial bread production. Energy 2015, 82, 640–649. [Google Scholar] [CrossRef]
- Chhanwal, N.; Ezhilarasi, P.N.; Indrani, D.; Anandharamakrishnan, C. Influence of electrical and hybrid heating on bread quality during baking. J. Food Sci. Technol. 2015, 52, 4467–4474. [Google Scholar] [CrossRef]
- Wang, Y.; Li, K.; Gan, S.; Cameron, C. Analysis of energy saving potentials in intelligent manufacturing: A case study of bakery plants. Energy 2019, 172, 477–486. [Google Scholar] [CrossRef]
- Papasidero, D.; Pierucci, S.; Manenti, F. Energy optimization of bread baking process undergoing quality constraints. Energy 2016, 116, 1417–1422. [Google Scholar] [CrossRef]
- Ayub, I.; Nasir, M.S.; Liu, Y.; Munir, A.; Yang, F.; Zhang, Z. Performance improvement of solar bakery unit by integrating with metal hydride based solar thermal energy storage reactor. Renew. Energy 2020, 161, 1011–1024. [Google Scholar] [CrossRef]


| Electricity Bill Total Electricity Consumption (kWh/month) | Electricity Bill ($) | Estimated Electricity Consumption (kWh/month) | Error (%) | |
|---|---|---|---|---|
| Bakery 1 | 1043 | 137.18 | 1049.82 | 0.653 |
| Bakery 2 | 1492 | 171.43 | 1472.31 | 1.320 |
| Bakery 3 | 1303 | 165.69 | 1295.00 | 0.614 |
| Bakery 4 | 1101 | 138.52 | 1063.22 | 3.431 |
| Bakery 5 | 1324 | 168.57 | 1316.69 | 0.552 |
| Bakery 6 | 1176 | 148.26 | 1154.85 | 1.798 |
| Energy Use | Mass of Flour Processed | Energy Indicator | |
|---|---|---|---|
| (kWh/month) | (kg/month) | (kWh/kg) | |
| Bakery 1 | 1043.00 | 3628 | 0.287 |
| Bakery 2 | 1491.22 | 12,000 | 0.124 |
| Bakery 3 | 1303.00 | 9000 | 0.145 |
| Bakery 4 | 1101.00 | 3500 | 0.315 |
| Bakery 5 | 1325.00 | 10,000 | 0.133 |
| Bakery 6 | 1173.00 | 5000 | 0.235 |
| Kneaders | Power | Capacity | Cost |
|---|---|---|---|
| W | kg/cycle | $ | |
| Old | 1100 | 3 | 121.03 |
| New Option | 750 | 10 | 636.96 |
Publisher’s Note: MDPI stays neutral with regard to jurisdictional claims in published maps and institutional affiliations. |
© 2021 by the authors. Licensee MDPI, Basel, Switzerland. This article is an open access article distributed under the terms and conditions of the Creative Commons Attribution (CC BY) license (https://creativecommons.org/licenses/by/4.0/).
Share and Cite
Briceño-León, M.; Pazmiño-Quishpe, D.; Clairand, J.-M.; Escrivá-Escrivá, G. Energy Efficiency Measures in Bakeries toward Competitiveness and Sustainability—Case Studies in Quito, Ecuador. Sustainability 2021, 13, 5209. https://doi.org/10.3390/su13095209
Briceño-León M, Pazmiño-Quishpe D, Clairand J-M, Escrivá-Escrivá G. Energy Efficiency Measures in Bakeries toward Competitiveness and Sustainability—Case Studies in Quito, Ecuador. Sustainability. 2021; 13(9):5209. https://doi.org/10.3390/su13095209
Chicago/Turabian StyleBriceño-León, Marco, Dennys Pazmiño-Quishpe, Jean-Michel Clairand, and Guillermo Escrivá-Escrivá. 2021. "Energy Efficiency Measures in Bakeries toward Competitiveness and Sustainability—Case Studies in Quito, Ecuador" Sustainability 13, no. 9: 5209. https://doi.org/10.3390/su13095209
APA StyleBriceño-León, M., Pazmiño-Quishpe, D., Clairand, J.-M., & Escrivá-Escrivá, G. (2021). Energy Efficiency Measures in Bakeries toward Competitiveness and Sustainability—Case Studies in Quito, Ecuador. Sustainability, 13(9), 5209. https://doi.org/10.3390/su13095209