Article

Design of a Building-Scale Space Solar Cooling System Using TRNSYS

1
School of Chemistry and Chemical Engineering, Queen’s University of Belfast, University Road, Belfast BT7 1NN, UK
2
College of Engineering, Design and Physical Sciences, Brunel University London, Uxbridge UB8 3PH, UK
3
Photovoltaic Unit, Solar Energy Physics Laboratory, National Research Institute of Astronomy and Geophysics, Helwan 11421, Egypt
4
Physics Department, College of Applied Science, Umm Al Qura University, Mecca 21955, Saudi Arabia
*
Author to whom correspondence should be addressed.
Sustainability 2022, 14(18), 11549; https://doi.org/10.3390/su141811549
Submission received: 13 May 2022 / Revised: 5 September 2022 / Accepted: 9 September 2022 / Published: 15 September 2022

Abstract

:
Research into solar absorption chillers despite their environmental benefits has been limited to date to mainly larger systems whilst ignoring smaller building-scale units, which can significantly benefit from the use of optimally designed, low concentrating, non-imaging optical reflectors. A solar absorption chiller system designed to provide year-round space cooling for a typical primary health care facility in Cairo, Egypt, was designed to match local ambient, solar, and occupancy conditions, its performance simulated and then optimized to minimize auxiliary power consumption using the TRNSYS18 software, TRNOPT. Different configurations of collector types, array areas, storage sizes and collector slopes were used to determine the optimum specifications for the system components. Non-concentrating Evacuated Tube Collectors (ETCs) were compared with the same Evacuated Tube Collectors but integrated with external Compound Parabolic Concentrators (CPCs) with a geometric concentration ratio of 1.5X for supplying thermal energy to the single-effect absorption chiller investigated. This paper describes a user-friendly methodology developed for the design of solar heat-powered absorption chillers for small buildings using TRNSYS18 employing the Hookes–Jeeves algorithm within the TRNOPT function. Clear steps to avoid convergence problems when using TRNSYS are articulated to make repeatability for different systems and locations more straightforward. Collector array areas were varied from 30 m2 to 160 m2 and the size of the water-based thermal storage from 1 m3 to 3 m3 to determine the configuration that can supply the maximum solar fraction of the building’s cooling requirements for the lowest lifetime cost. The optimum solar fraction for ETCs and CPCs was found to be 0.66 and 0.94, respectively. If the current air conditioning demand is met through adoption of the CPC-based solar absorption systems this can potentially save the emission of 3,966,247 tCO2 per annum.

1. Introduction

Vapour absorption chillers (VACs) convert heat supplied from solar thermal collector arrays into cooling, differing from vapour compression systems in that the electricity driven compressor is replaced by a thermal energy run generator and an absorber. Annually, out of the total electricity generated across the globe, 15% is used for space cooling of buildings mainly using vapour compression systems [1]. These systems use refrigerants such as water or ammonia that are well-known to be more environmentally benign than the chloro-fluoro-carbons and hydro-chlorofluorocarbons used in vapour compression cycles. Even the newer refrigerants hitherto believed as benign are reported to also be environmentally degrading [2], stressing the long-term risk associated with using vapour compression systems even if one uses renewable electricity to run them. Absorption-based systems also benefit from the fact that there is an increase in cooling demands as solar radiation levels increase, reducing the need for energy storage resulting in more cost-effective solar energy systems. The adoption of solar VAC systems is crucial in reducing air pollution for countries with a high annual solar resource such as Egypt, where the capital city Cairo is subject to 2030 kWh/m2/year of global solar irradiance, urban air quality is low and current reliance on fossil fuel inputs is high. Egypt has a population of almost 96 million and since 2007 has suffered from an energy deficit; annual consumption of electricity has more than doubled since 2000, and in 2017 consumption was 1.94 MWh/capita [3]. It was reported that total electricity consumed in 2017 in Egypt was 159,343 GWh with air conditioning consuming 5% of this [4]. The Grid Emission Factor (GEF) for Egypt in 2020 was measured as 0.533 tCO2/MWh [5].
In solar absorption systems, the cycle is primarily driven by thermal energy with only a small quantity of mechanical energy required. A secondary fluid in addition to the refrigerant, known as an absorbent, is needed to absorb refrigerant vapour, allowing pressure increases using a pump rather than a compressor which requires a greater work input. This means that low grade heat sources such as solar energy can be used to power the system and with suitable thermal energy storage, such systems can provide both heating and cooling for buildings. VAC systems require higher delivery temperatures compared with domestic hot water or space heating so solar Evacuated Tube Collectors (ETCs) and Compound Parabolic Concentrators (CPCs) are the best option.
A lot is known about ETCs which are commercially available. In 2020, 491.9 million m2 of Evacuated Tube Collectors were in operation, globally producing 344 GWth [6]. Researchers such as Winston [7], Rabl [8], and Singh and Eames [9] have been long investigating low concentrating solar collectors such as CPCs; however, these designs are not readily available commercially. Some prototype CPC systems have been tested and the results reported [10,11,12,13]. Specially designed CPC or similar collectors have been reported or under investigation by several public funded projects such as NoNSToP [14] and InSET4KTI [15]. Previous research [16,17] has shown CPCs are advantageous for installation onto buildings as these are more compact. The CPC described by [12] had an efficiency of 60% at an operating temperature of 100 °C.
Currently (2022) single, double, and triple effect VAC configurations are available commercially. The number of effects in an absorption chiller is the number of times that heat is reused to provide cooling, more effects increase COP, but require higher firing temperatures and increased cycle complexity.
A review of previous research concerning the use of concentrating solar collectors for driving absorption and adsorption cooling cycles was presented by [18]. Absorption chillers were described and classified by [19] on the basis of firing method, working fluid pair, and number of effects. An experimental investigation and lifecycle analysis of a 23 kW solar absorption cooling system driven by a 54 m2 array of external Compound Parabolic Concentrators (CPCs) solar collectors located in California, USA was presented by [10]. Mean collector daily efficiency and solar COP were reported as 37.5% and 0.374, respectively. This research considered two system configurations: The first sized the solar system based on the peak cooling load and the second using 50% of the peak load with additional cooling provided by a conventional vapour compression system. It was reported that the second configuration had a lower present worth cost over its projected lifespan compared with configuration 1 and a full capacity conventional vapour compression system in providing cooling. Xu and Wang [20] simulated the performance of a solar system using a variable effect lithium bromide absorption chiller using the Transient System Simulation Tool (TRNSYS) software; the mean chiller and solar COP were reported as 0.88 and 0.35, respectively. The cooling capacity of the absorption chiller was 50 kW, collector array area (AC) was 200 m2 and the hot water storage tank had a volume of 3 m3. TRNSYS is a graphics-based software environment using FORTRAN 90 as the source code to numerically model and integrate dynamic systems [21], particularly those powered from variable renewable energy sources [22].
Khan et al. [23] used TRNSYS to investigate a single-effect solar absorption cooling system (298 kW cooling capacity) using the type 107 subroutine of a single-effect absorption chiller which provided space cooling to an educational building in Islamabad, Pakistan, drawing heat from flat plate or evacuated tube solar collectors. The system simulation used simplifying assumptions ignoring energy losses from the pipework, had no cooling tower, and did not consider the impact of the working fluid boiling or freezing. The authors themselves stated that this would lead to artificially high predicted values. The energy usage patterns used did not consider the building configuration nor the impacts of human occupancy. This investigation artificially generated building energy demand profiles using the TRNSYS subroutine type 682, the authors claimed that calculating realistic building loads was too time consuming. The research presented here clearly shows that this is not the case, providing a list of the information required to develop accurate simulations including energy losses and using a cooling tower to improve the design process.
Ibrahim, et al. [24] undertook a parametric analysis of a double-effect solar absorption chiller reference system with a solar collector area of 1350 m2 and cooling capacity 1163 kW operating in Kuala Lumpur, Malaysia. A design tool was provided requiring a minimum incident radiation level of 500 W/m2.
Published research has primarily focused on VACs serving large buildings using assumed cooling loads. There is no research reporting the air conditioning of the smaller health centres that provide primary medical care to billions around the world and are critically important in the global fight against diseases such as COVID-19, Tuberculosis, and Malaria. These health care centres often have no access to a stable power supply; thus, this research describes an opportunity for the development of autonomous small scale solar vapour absorption chillers for delivering, the indoor thermal comfort and air quality conditions required. If the UN sustainability development goals of “no poverty”, “good health and wellbeing”, “gender equality”, “affordable and clean energy”, “industry innovation and infrastructure”, “reduced inequalities”, “sustainable cities and communities”, “responsible consumption and production”, and “climate action,” are to be met, it is critical to deliver zero carbon health care centres in all parts of the globe. The biggest energy load for these health care centres is the provision of space cooling [25]. The World Health Organisation (WHO), in 2021 found that increased provision of primary health care facilities to low- and middle-income countries has the potential to save 60 million lives by 2030. Currently, 930 million people globally face medical expenses equalling 10% of their household income [26]. A survey of 50 sub-Saharan countries reported that currently there are 98,745 health care centres [27]. Solar energy is the only renewable energy source that can provide a truly zero carbon energy source for use in remote health care centres catering to millions. Biofuel-based solutions such as that proposed by [28] providing heat at 121 °C for an autoclave face several environmental and other social challenges.
Before TRNSYS simulations are executed, more detailed background information is needed and described by the new research methodology proposed in this paper. This research differs from previously reported studies as the annual energy demands for space conditioning of a smaller building, i.e., a Primary Health Care Centre (PHCC) is modelled using the multi zone building subroutine (type 56) in TRNSYS employing representative occupancy patterns to provide a more accurate estimate of the cooling load required based on specific local climatic conditions and building properties. This method can then be readily adaptable for any geographic location enabling other TRNSYS users to more rapidly develop their own building integrated absorption chilling models.
Published research on VACs has mainly focused on larger buildings using assumed cooling loads. There is no research reporting the air conditioning requirements of the smaller health centres that provide primary medical care to billions around the world and are critically important in the global fight against diseases such as COVID-19, Tuberculosis, and Malaria. These health care centres often have no access to a stable power supply; thus, this research describes a procedure for developing more accurate simulations of autonomous small scale solar vapour absorption chillers for delivering minimum indoor thermal comfort and air quality conditions.
This research differs from previously reported studies as the annual energy demands for space conditioning of a smaller building, i.e., a Primary Health Care Centre (PHCC) is modelled using the multi zone building subroutine (type 56) in TRNSYS employing representative occupancy patterns to provide a more accurate estimate of the cooling load required based on local climatic conditions and building properties. This method can be readily adaptable for any geographic location enabling other TRNSYS users to more rapidly develop their own building integrated solar driven vapour absorption chilling models.
This manuscript provides new information on the optimisation of CPC and ETC-based solar thermal collector systems and storage tanks for driving a single-effect VAC under the climatic conditions of Egypt. Information of how linearly focussing, non-imaging, stationary systems operate for small-scale localised applications is needed by designers to develop accurate computer simulations using the type 56 multi zone building subroutine, for either new build or building retrofit applications to provide space cooling from solar energy using TRNSYS. Solar technology design is determined by location and building-use specific factors such as occupancy, building standards, and typical working hours; this research lists the additional data required to account for local variations describing each step of the proposed methodology. This would allow more rapid design of off grid PHCCs to achieve energy autonomy helping preserve medicines or vaccinations, which are essential health care products. Originally, an experimental prototype was to be installed in Cairo for real life data collection, which could not happen due to the COVID-19 pandemic. To overcome this seemingly insurmountable barrier, a building was designed in the virtual environment of TRNSYS using local building standards, materials, and energy profiles to make the simulation as accurate a representation as possible. This work shows that a highly detailed model can be developed in a simple straightforward way by using published data from scientific publications and technical manuals. Typical metrological year (TMY) data provided in TRNSYS representing local weather conditions used to enable a realistic and long-term technological performance and economic evaluation. By using an appropriately modified type 56 subroutine, TRNSYS can simulate down to 1 s time intervals the three-dimensional detailed interactions between the building elements (walls, roof, floor, and windows), inclement weather, occupancy, and energy demand patterns. TRNSYS optimisation tool (TRNOPT) was used to optimise the system components to determine the most cost-effective design which provides the highest solar fraction of the required cooling loads for the specified building.

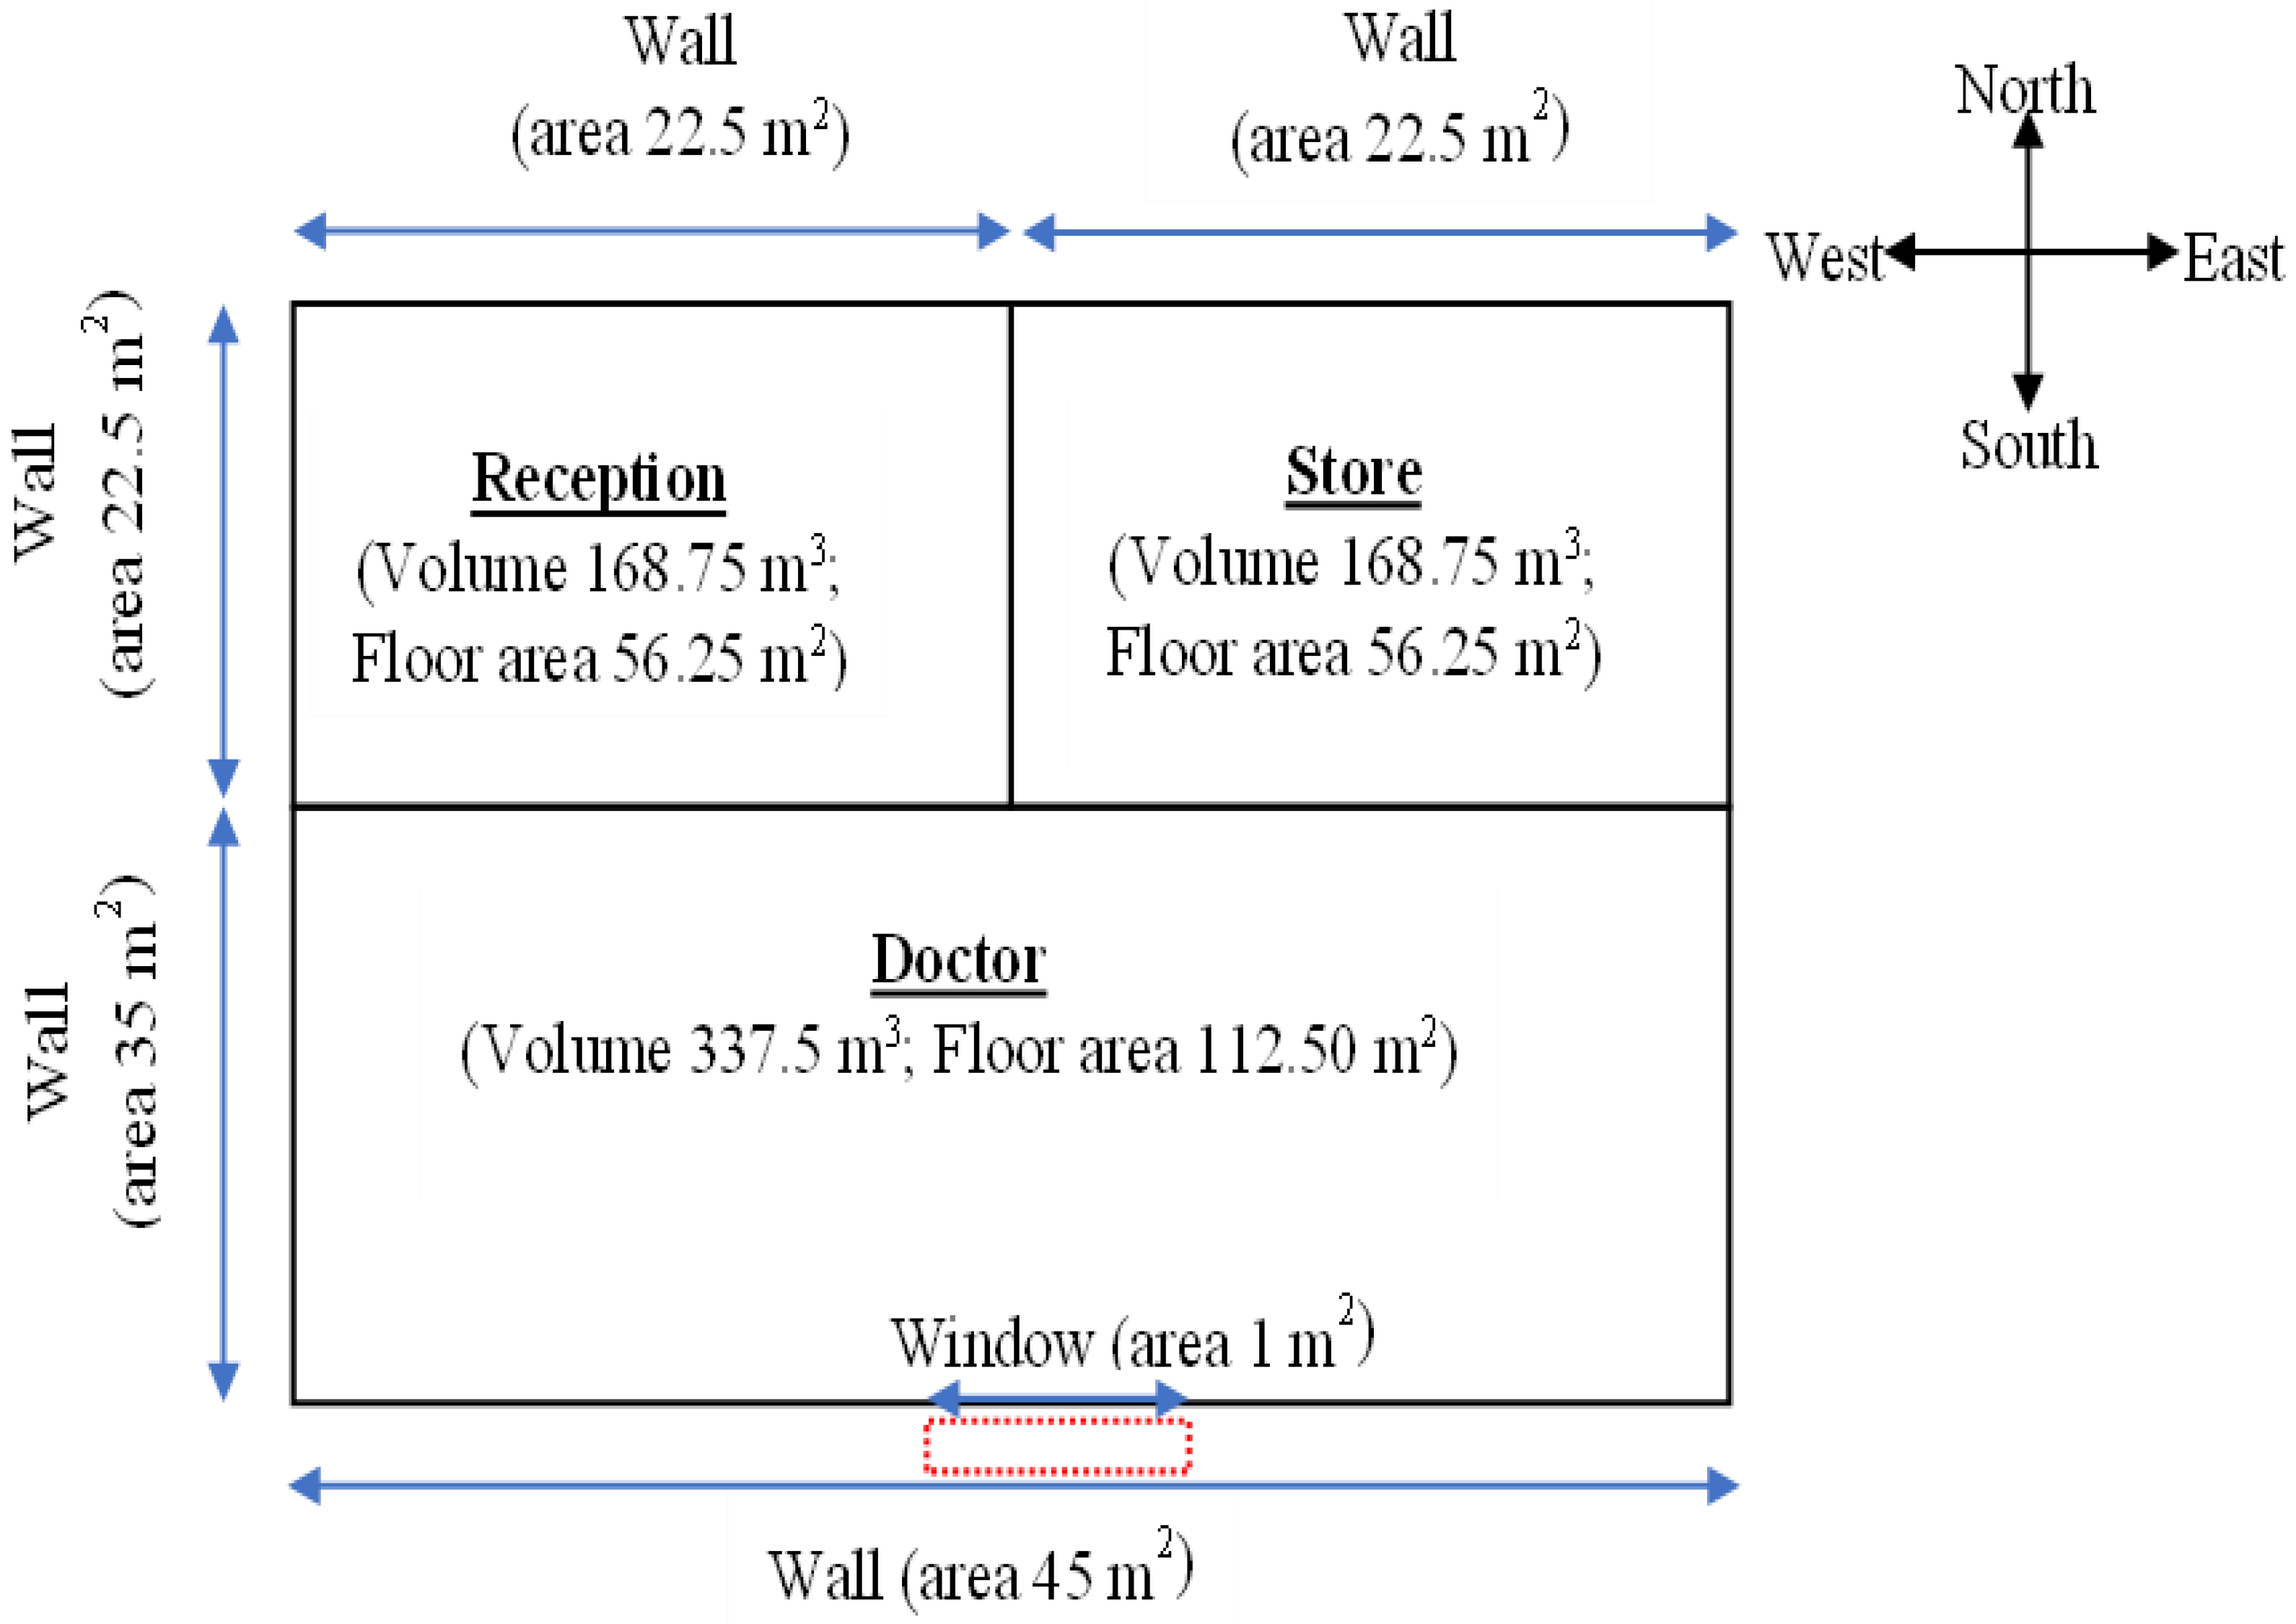
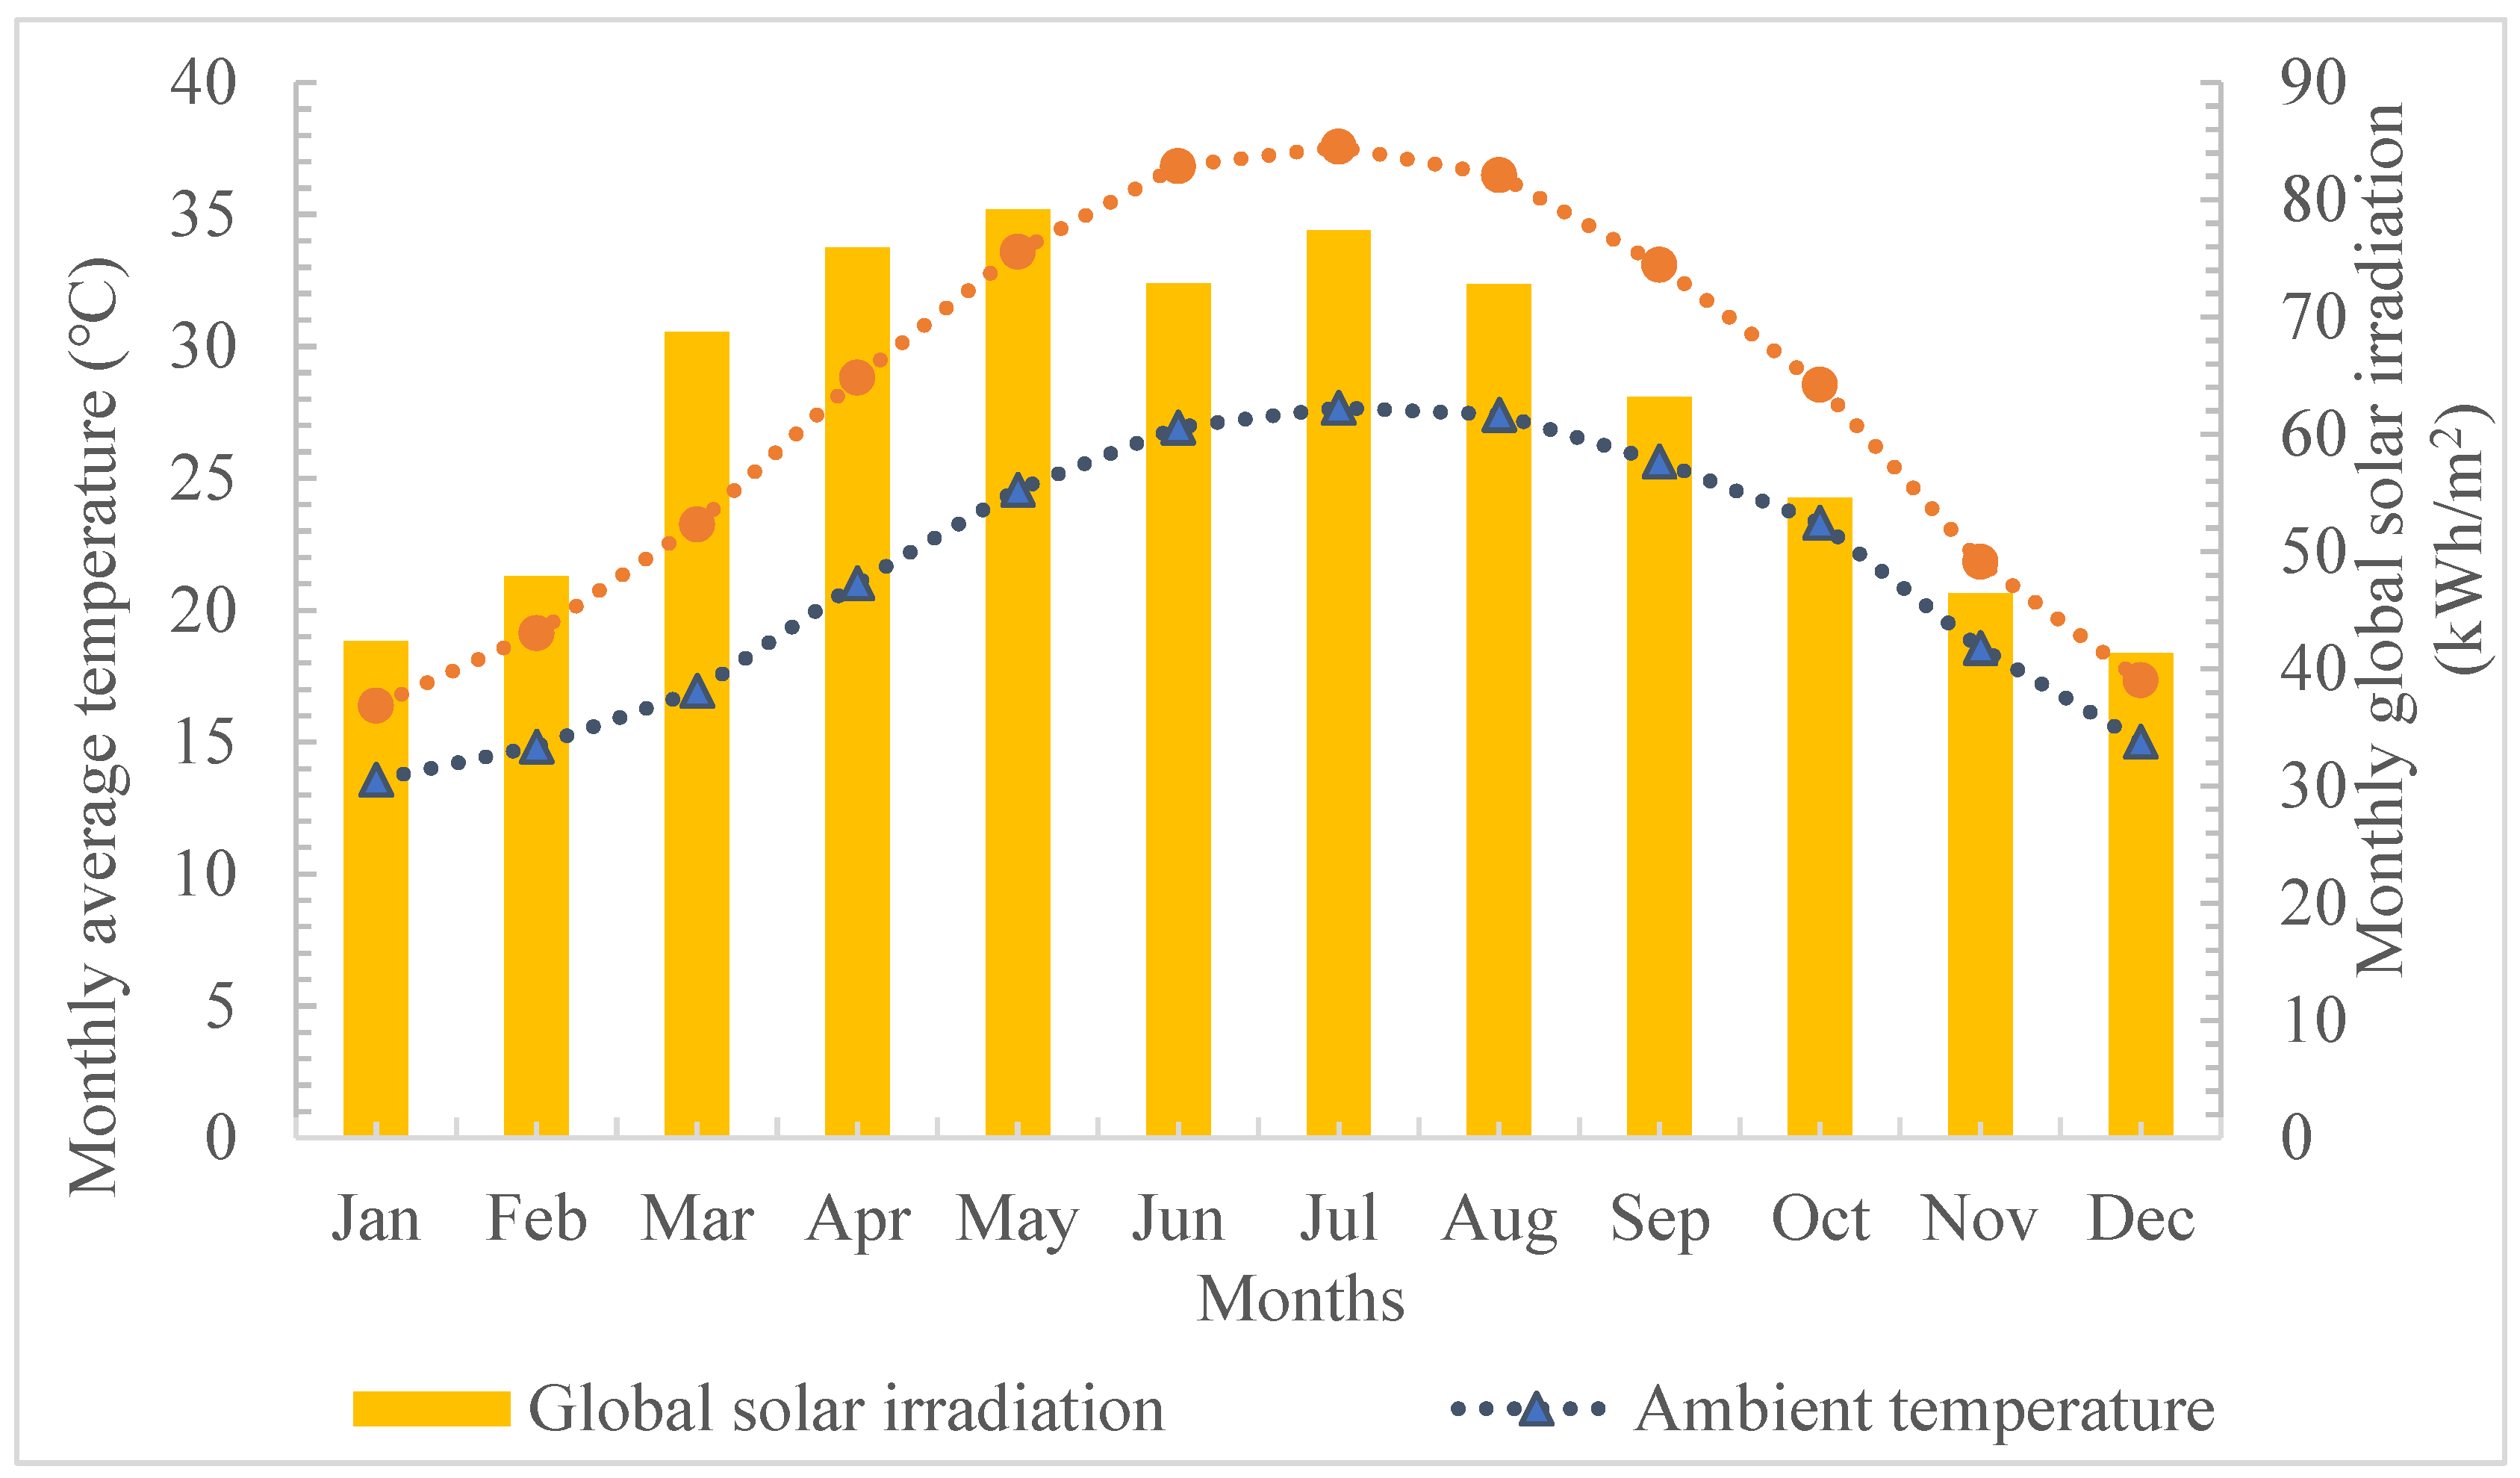
2. Description of the Building and Local Climate

PHCCs provide a first level of health care service and priority health interventions for low-income populations [29]. A building housing a three room PHCC was designed using data collected from several sources [29,30,31]. Figure 1 shows the layout of the proposed PHCC which has a reception, doctor’s surgery/treatment room, and a room for storing vaccines or other medical supplies.
Cairo (Egypt) has a hot desert climate where peak temperatures in summer reach 39.2 °C and in winter fall to 2.7 °C. TRNSYS has a weather file for Cairo which provided information on monthly solar radiation, ambient temperature, and can predict the likely roof surface temperature of the PHCC for a complete year as shown in Figure 2. As per CIBSE design recommendations a PHCC should have an internal temperature ranging from 19 °C to 24 °C depending on what the rooms are used for [32]. Using 22 °C as a standard indoor space temperature for the comfort of patients and staff, the PHCC in Cairo requires heating and/or cooling as shown.

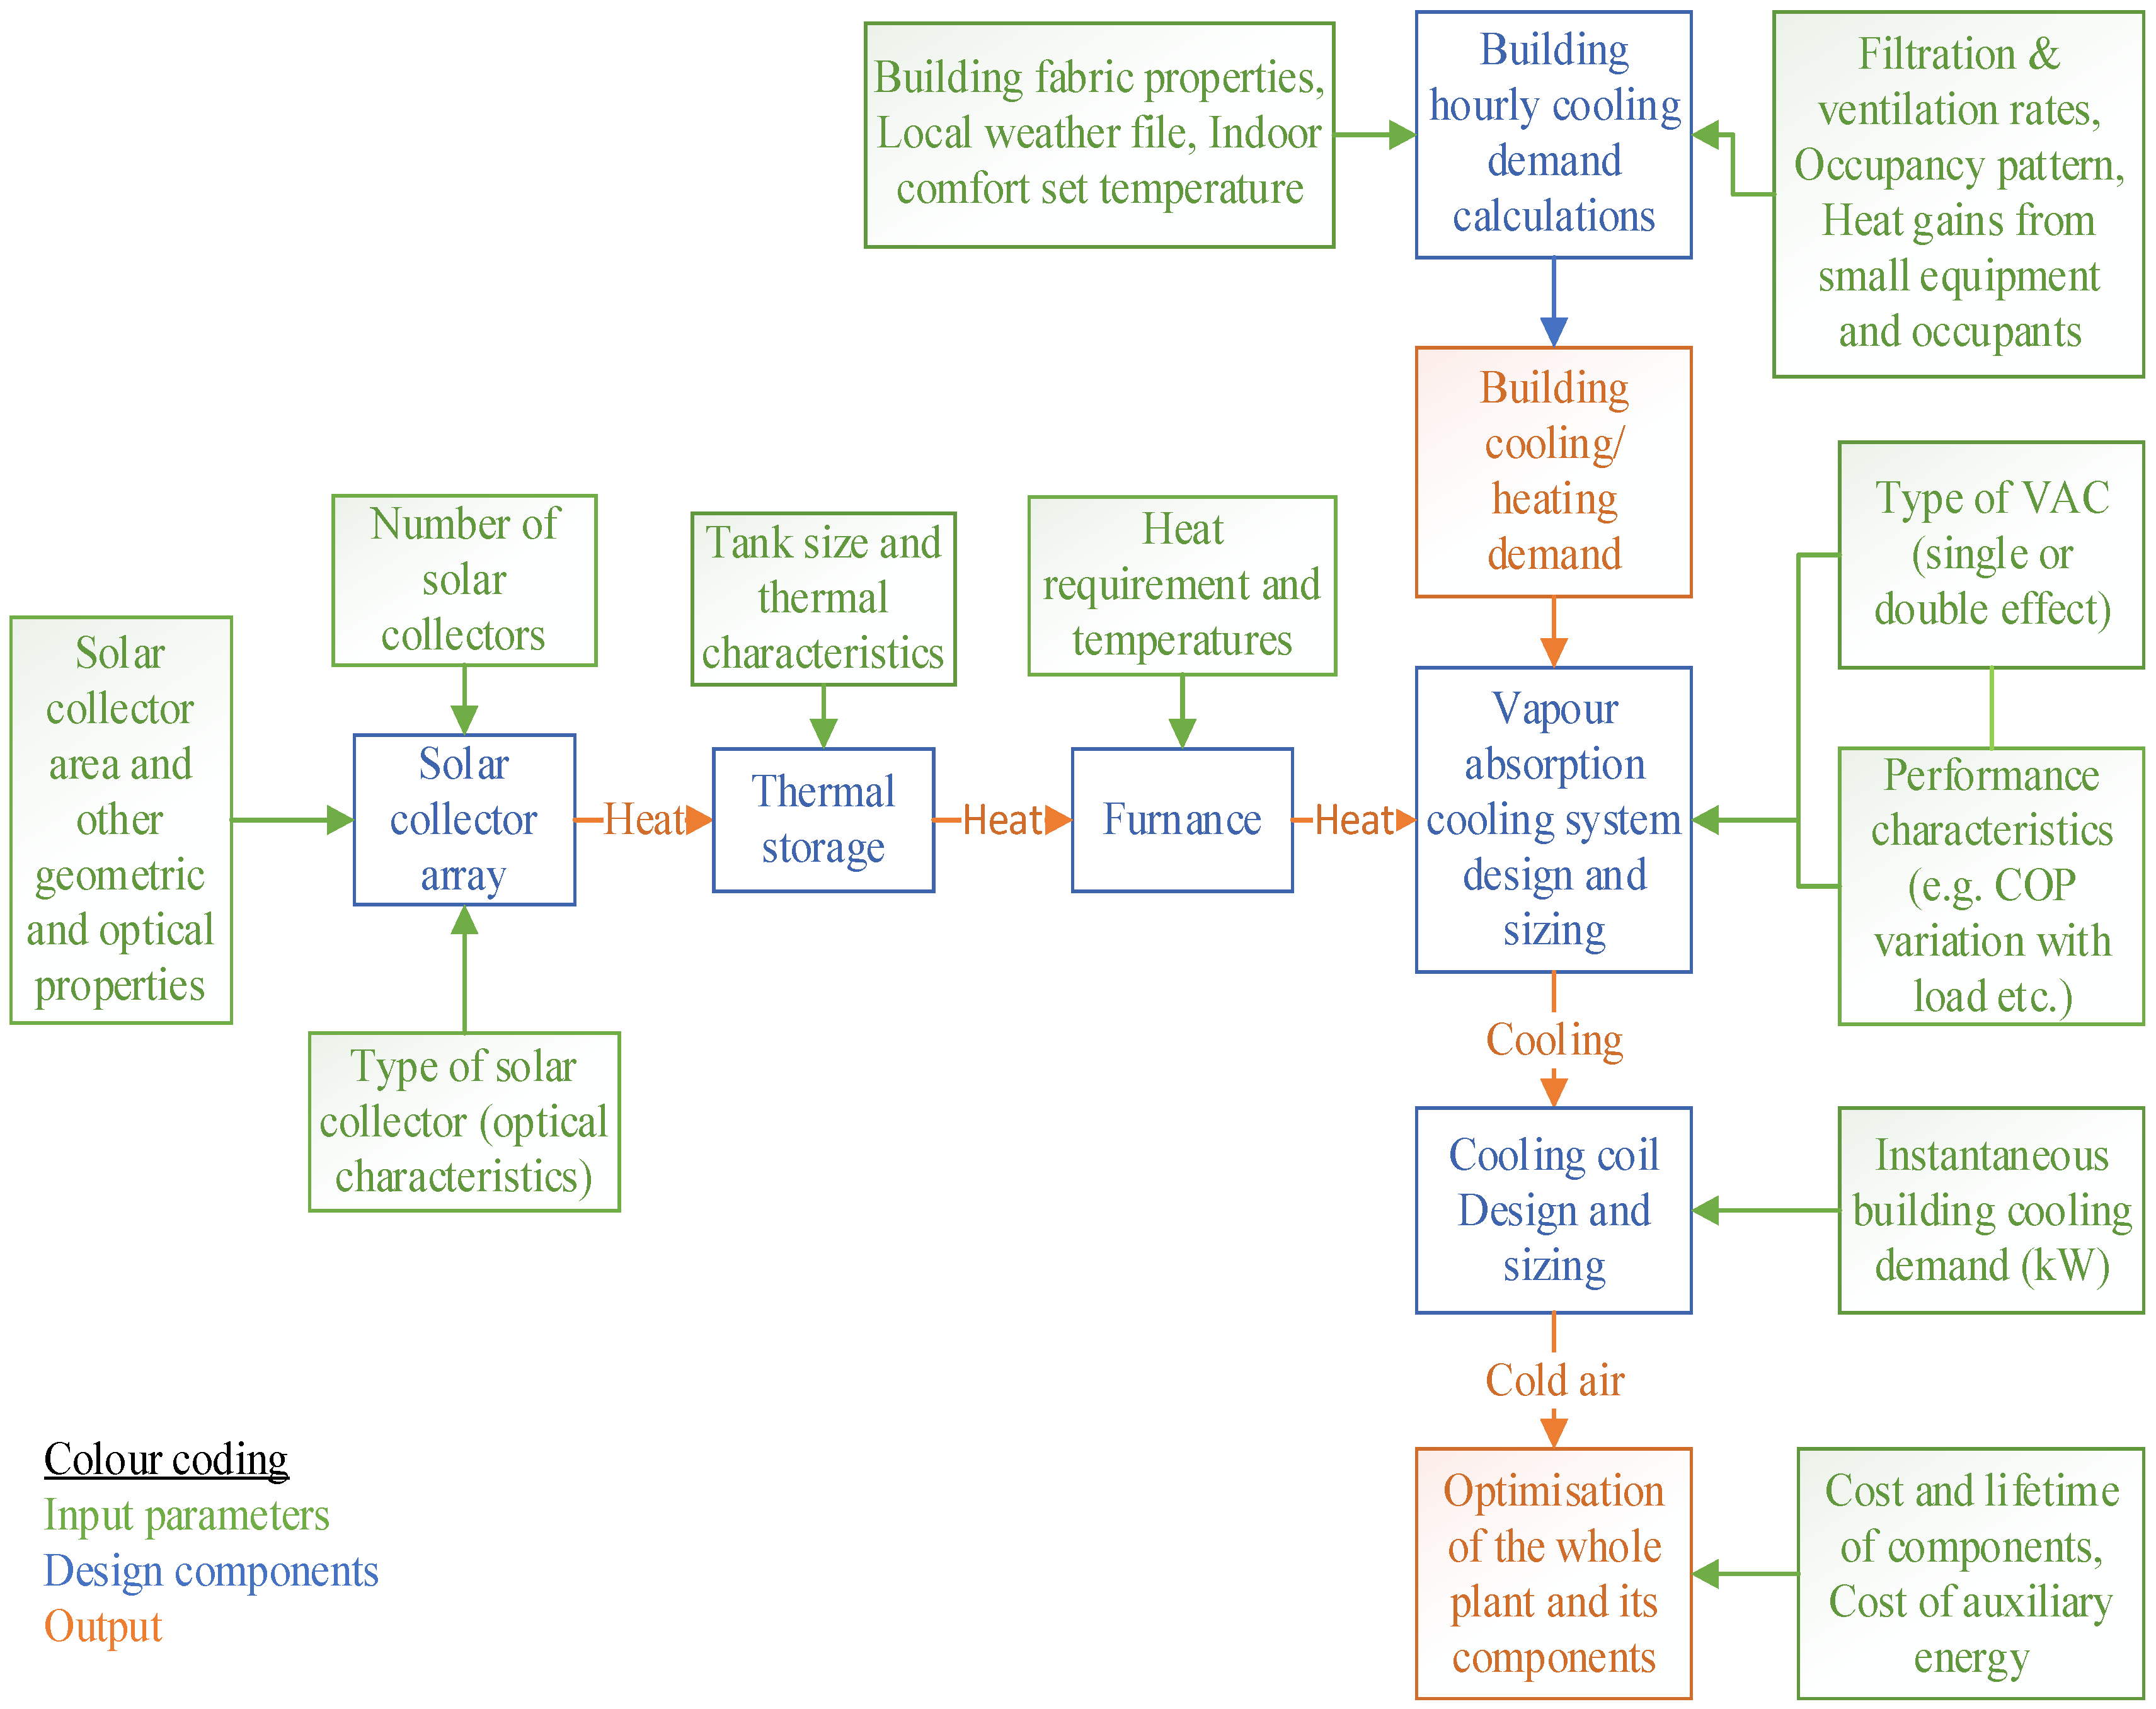
3. Methodology for Development

To investigate solar absorption cooling systems for PHCCs a building model in TRNbuild was developed and integrated in TRNSYS studio to calculate the buildings annual and peak cooling demands. This was required to size the proposed solar VAC system. The process followed, along with the system components used, are shown in Figure 3.

3.1. Building Model Type 56

The building model was developed using the multizone building subroutine type 56 which can be readily modified in TRNbuild where the building details can be edited to adopt specific building fabric characteristics and finally be integrated with other technologies within the TRNSYS studio. For the PHCC described by this research the building materials and construction details were adopted from typical Egyptian building structures and occupancy patterns. These are described by the work of Radwan et al. [28] and William et al. [30] and the values relevant to this investigation are shown in Appendix A Table A1 and Table A2.
The overall building heat loss coefficient ( H t ) was calculated using Equations (1) and (2) [31].
H t = A U
where A is the area (m2) and U the thermal transmittance (W/m2K) of the building element.
H t = A 1 U 1 + A 2 U 2 + A 3 U 3 + A 4 U 4
In Equation (2), subscripts 1, 2, 3, and 4 represent the external walls, windows, ground floor, and roof, respectively. Using the data from Table A1 and Table A2 in Appendix A, with Equations (1) and (2), H t was calculated as 768.7 W/K.
The type 56 module in TRNSYS can simulate differing rates of air leakages and ventilation in the building. The infiltration rates used in this study are shown in Appendix A, Table A3.
The infiltration rate of the doctor’s room accounts for two persons in addition to the doctor. TRNbuild calculates the heat gains/losses to the building from its occupants, inclement weather, building material characteristics, and machinery during the simulation. For the purposes of simulating occupancy, it was assumed that the PHCC was in operation 6 days a week. The heat gains that influenced the building cooling load are detailed in Appendix A Table A4.

Space Conditioning Demand for PHCC

The cooling/heating feature in TRNbuild allows the user to simulate a buildings energy demand to maintain the required indoor temperature. CIBSE recommends the temperature in health care centres is maintained between 19 °C and 24 °C depending on the usage pattern [31]. To accommodate rooms with different purposes 22 °C was used as the setpoint temperature to be maintained in the building in TRNbuild. Thus, in the health care centre, the building cooling switches on when the room temperature exceeds 22 °C and switches off at 20 °C, a dead band of 2 °C was used to prevent hysteresis. All simulations were carried out for one year using a one-minute time step. The parameters selected from TRNbuild were used in to develop a solar driven VAC meeting the cooling requirements of the PHCC.
Figure 4 shows the predicted monthly cooling and heating demand of the PHCC estimated using the TRNSYS, the data used for this is shown in Appendix A Table A4.
The energy demand is plotted with ambient temperature and surface temperature of the roof of the PHCC, which was also predicted during the study. During the months of December and January there was no cooling demand, February too was predicted to have a negligible cooling demand. This can be confirmed with the positive heating demand in the winter and spring seasons, i.e., from October to April. A significant cooling demand existed from April to October with little demand existing even in the months of March and November. The peak cooling demand of 11.6 kW for the PHCC investigated occurred in July.

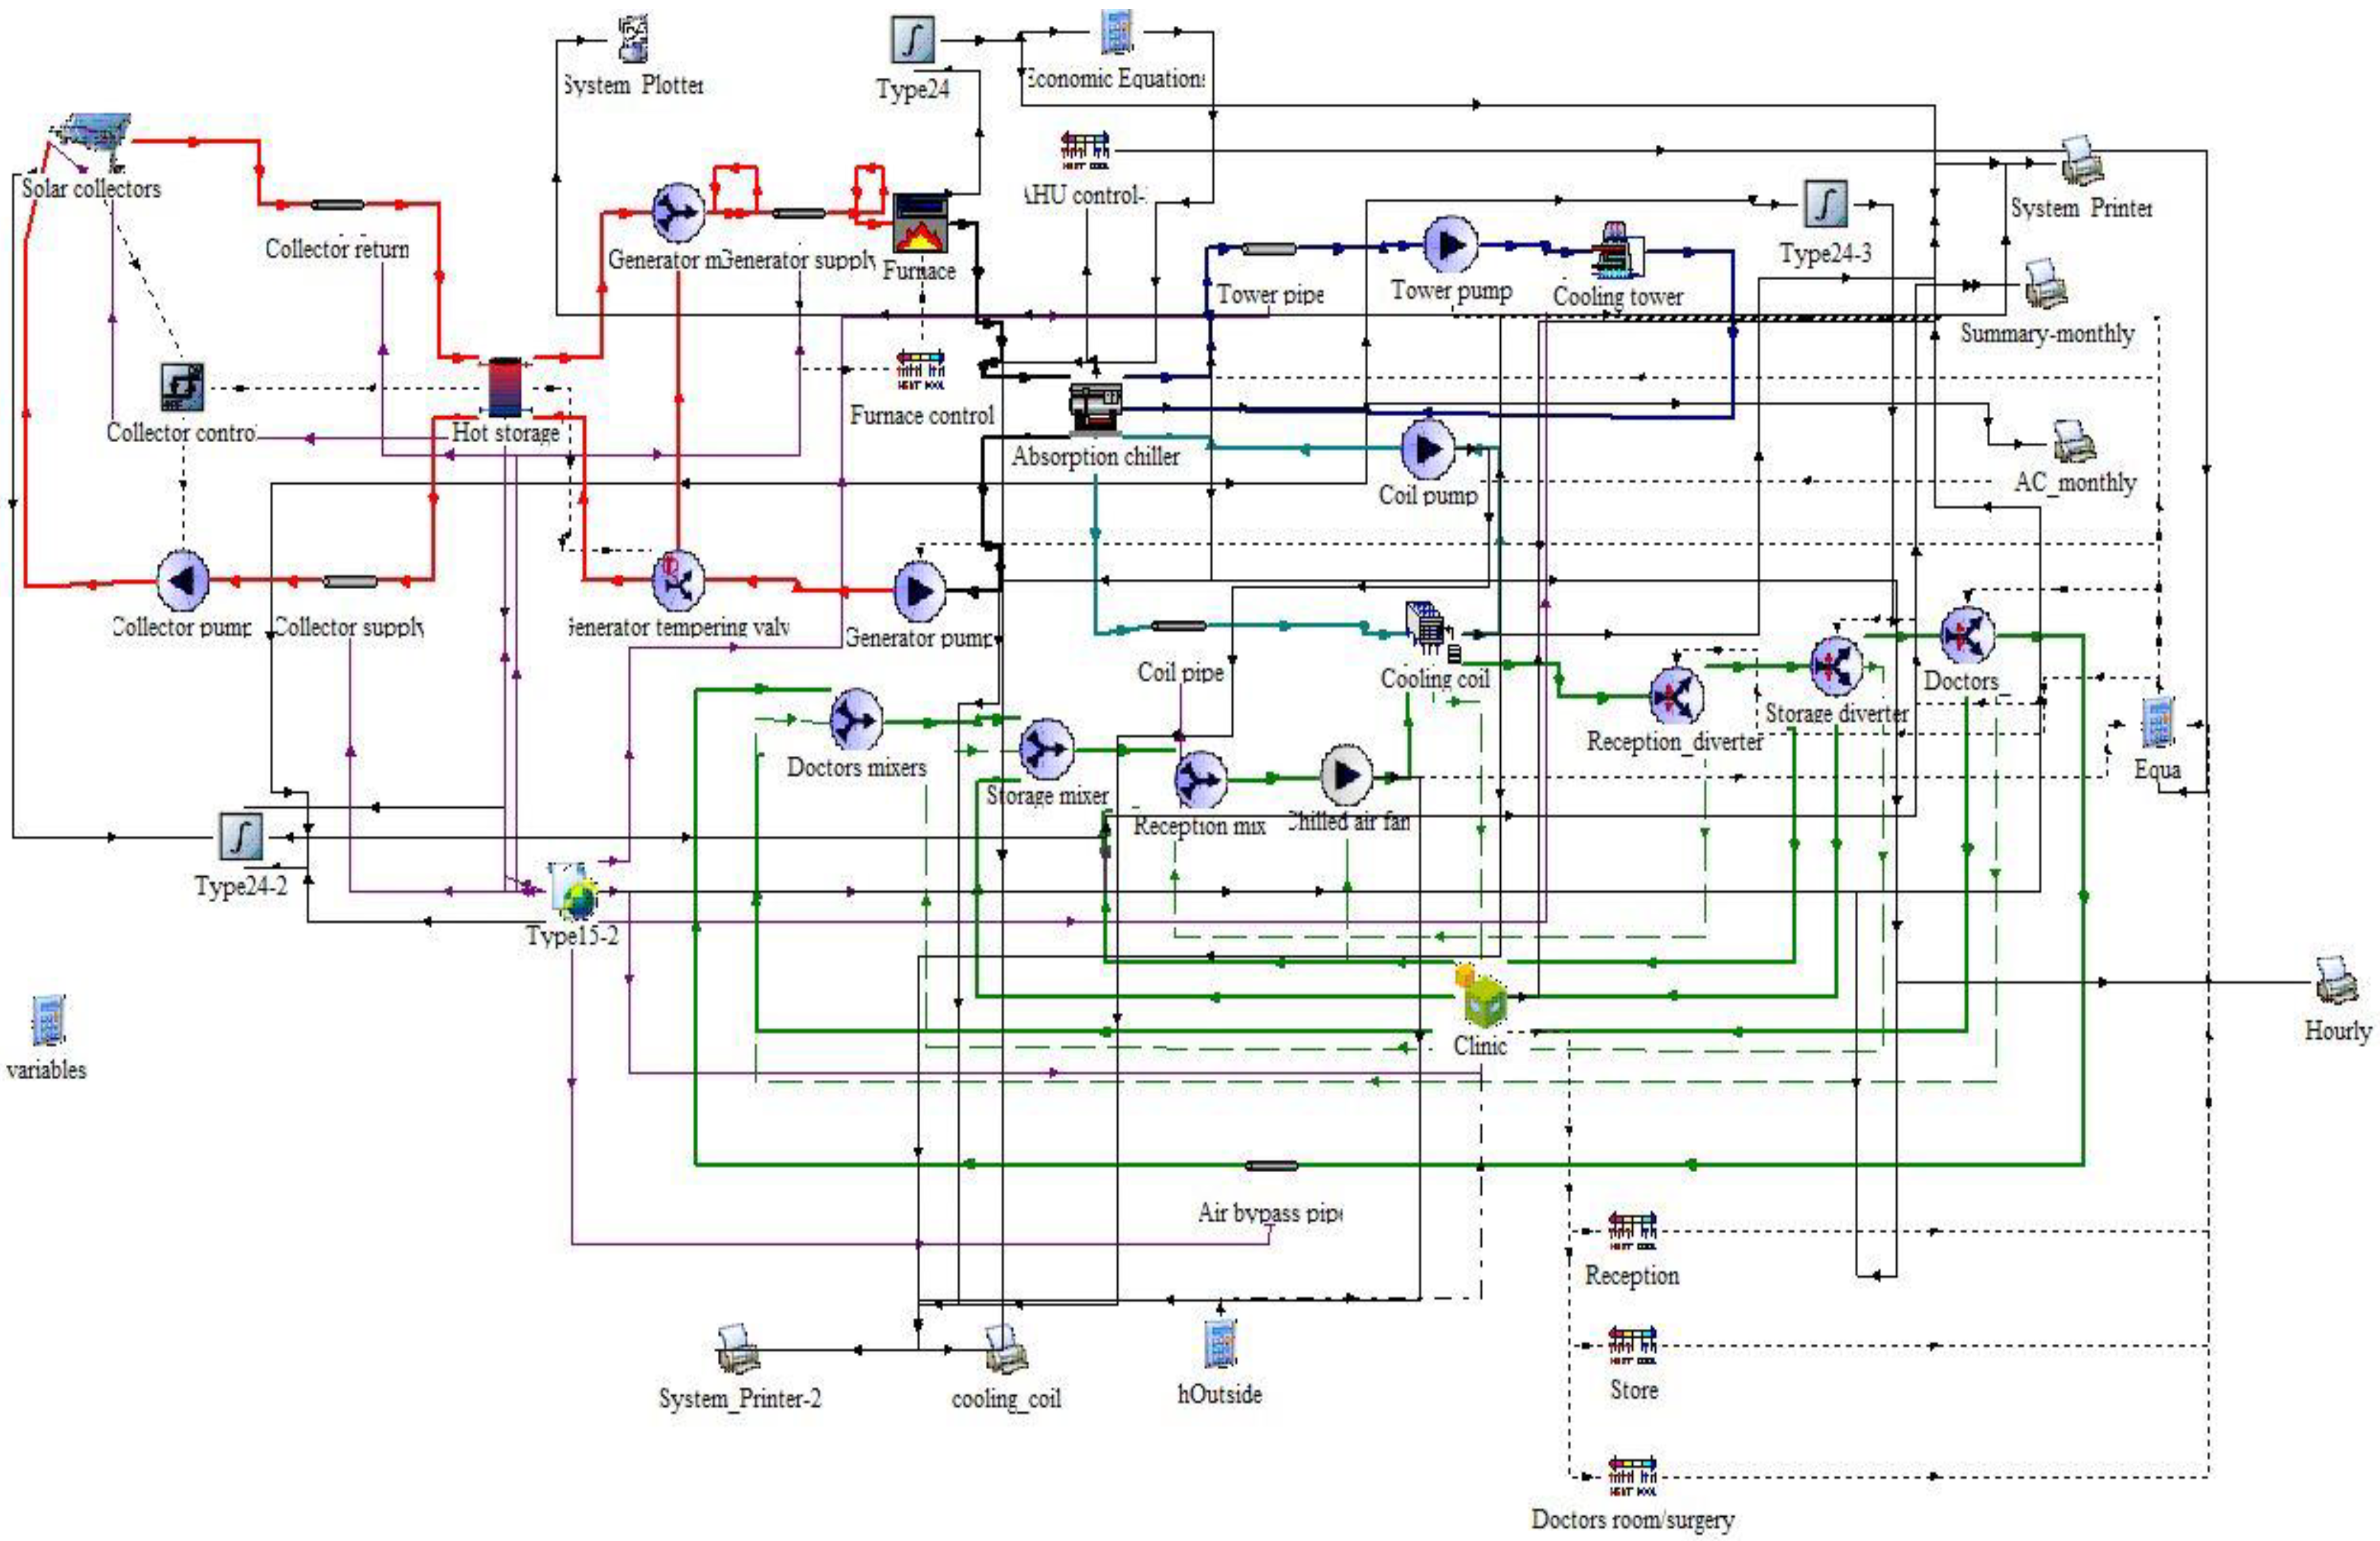
3.2. Solar Vapour Absorption Chiller Model

The solar absorption chiller system was then sized using the estimated cooling demand of the PHCC described in Section 2 using the TRNbuild feature of TRNSYS for one year under the climatic conditions of Cairo. A water-lithium bromide cycle-based chiller was used as previous research has reported that it is the most cost-effective cycle for solar absorption chillers. Commercial small-scale absorption chillers are not very common, the technical specifications for a commercially available lithium bromide single-effect absorption chiller (35.2 kW) are shown in Appendix A Table A5. The COP of the absorption chiller at its rated output was calculated as 0.674, the peak cooling demand of the building was shown to be 11.6 kW in Section 2 implying that a system to meet this demand would require a rating cooling capacity of at least 18 kW. The output of the absorption chiller shown in Appendix A Table A5 was scaled to meet the cooling demand of the PHCC building, an absorption chiller size of 20 kW was chosen to ensure a small safety margin of just over 10%. The TRNSYS type 107 hot water-fired single-effect absorption chiller was used. Table A6 in Appendix A shows the scaled values for chilled water, cooling water, and hot water inputted to the model. Knowledge of these figures allowed the major components of the system to be specified within the TRNSYS simulation.
Using the values from Appendix A in Table A6 the cooling coil (type 697), furnace (type 700) for auxiliary power, and cooling tower (type 510) were sized. The hot water storage tank volume (type 4), type of solar collector and area of collectors was varied as part of this research. Hot water storage was varied from 1 m3 to 3 m3, collector type was either ETC (type 71) or CPC (type 1245), collector area was varied from 20 m2 to 160 m2 for ETC and 30 m2 to 80 m2 for CPC. The TRNSYS simulation diagram is shown in Figure 5. The purpose of this was to determine the optimal area of solar collector needed in terms of highest solar fraction and lowest economic cost.
The other components used for this simulation were pumps (type 114), fans (type 112b), pipework (type 31), air flow divertors (types 148a), Tee piece air flow mixer (type 148b), Tee piece water flow mixer (type 11h), a temperature-controlled water flow divertor (type 11b), and associated heating controls. To avoid issues with capacitance, pipework must be sized to contain a sufficient volume of fluid over the timestep used in the simulation (1 minute). The annual energy supplied from the furnace, solar collector array and energy consumed by the absorption chiller for cooling was calculated using the integrator function (type 24) and print function (type 25). The solar fraction ( S F ), which represents the proportion of the total cooling demand met through solar energy, was calculated using Equation (3).
S F = s o l a r   e n e r g y   s u p p l i e d   d u r i n g   c o o l i n g   s e a s o n t o t a l   c o o l i n g   e n e r g y   r e q u i r e d
The total cost of solar cooling ( C T C ) was calculated from Equation (4).
C T C = A c × C s c + C S T × V S T + L × Q A X × C G E
where A c is the area of solar collector (m2), C S C the unit cost of the solar collector with respect to aperture area (GBP/m2), C A E the unit cost of auxiliary energy (GBP/kWh), C S T the cost of hot water storage tank per unit volume (GBP/m3), V S T the volume of hot water storage (m3), L the assumed lifespan of the system (year), Q A X the total annual auxiliary energy required (kWh/year), and C G E the unit cost of grid electricity (GBP/kWh). Table 1 shows the values used for determining the cost of solar cooling over the system lifespan.
The aim of estimating the cost of generating solar energy was to determine what solar fraction of the energy demand results in the lowest lifetime cost of the solar energy systems investigated. This was carried out by first determining the optimum volume of the hot water storage tank in terms of economic cost using Equation (4) following which the maximum solar fraction that could be attained for the minimum cost was calculated.

4. Results and Analyses

From the methodology described in Section 3 the optimal configuration of a single-effect hot water-fired lithium bromide-water VAC system was derived in terms of collector type, hot water storage volume, collector area, lifetime cost, and annual solar fraction using the results collected from TRNSYS simulations. The collector array for ETCs and CPCs was varied from 10 m2 to 160 m2, and 30 m2 to 100 m2, respectively. The volume of hot water storage was varied from 1 m3 to 3 m3 in steps of 0.5 m3.

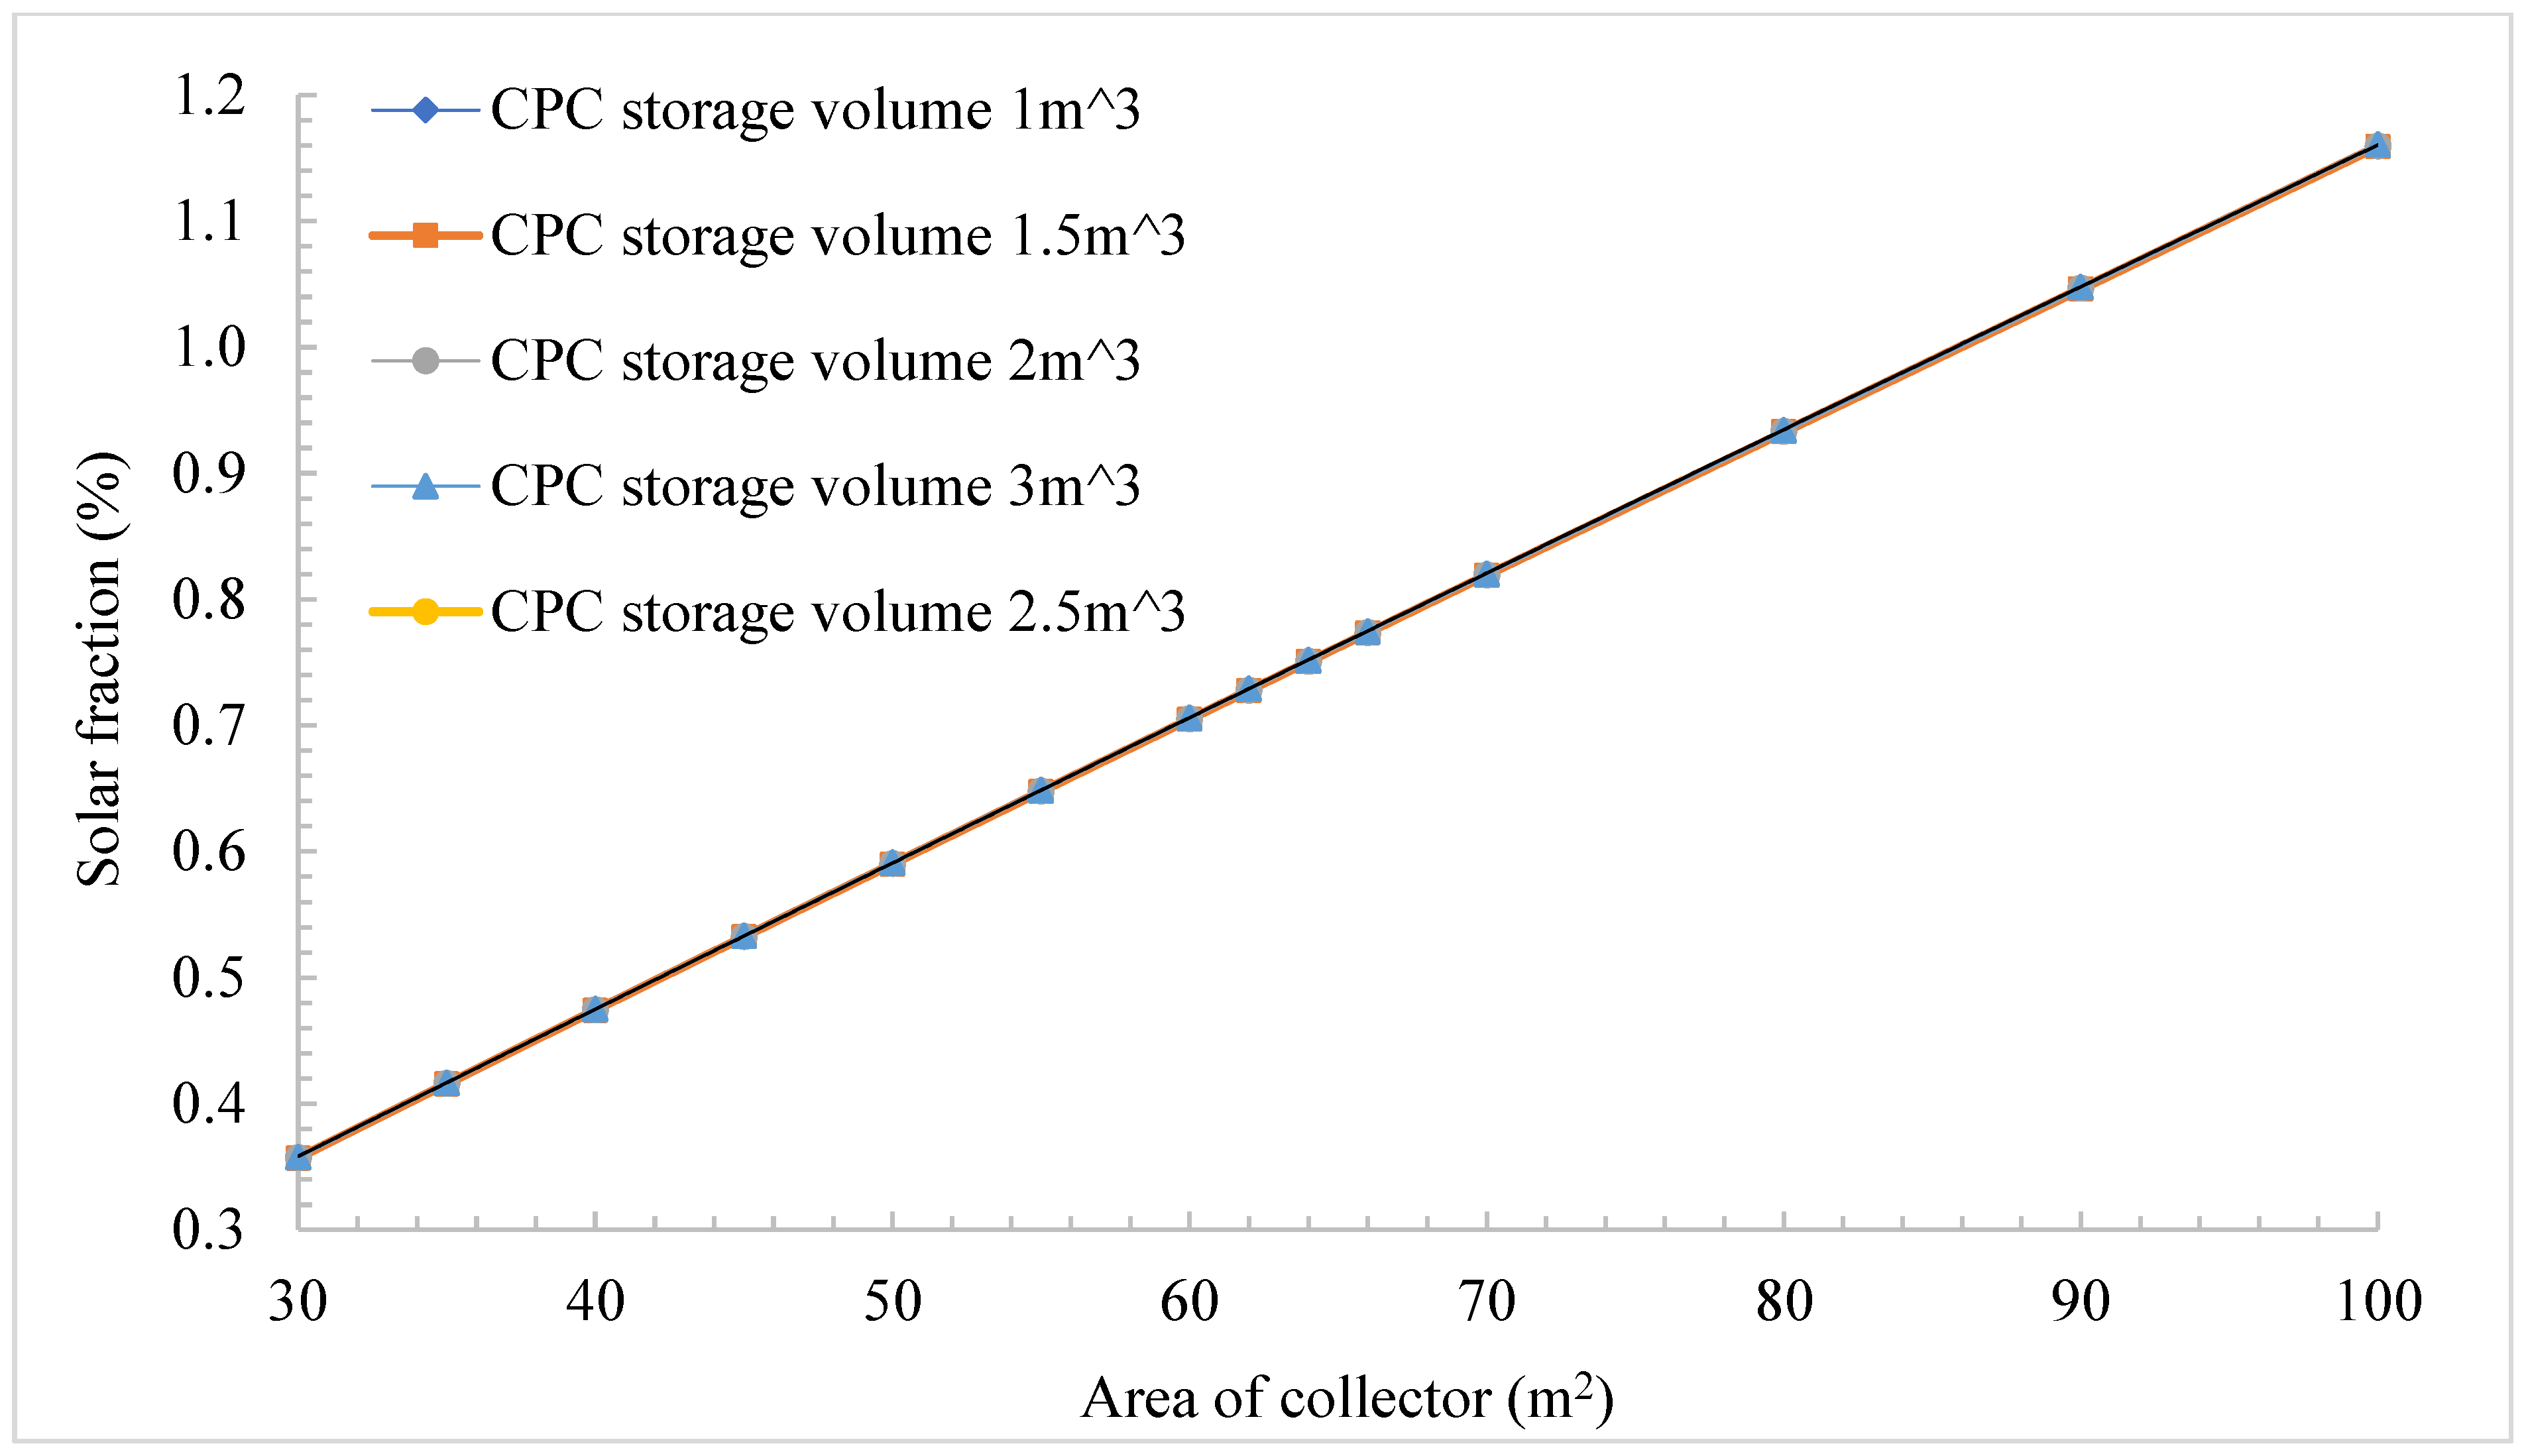
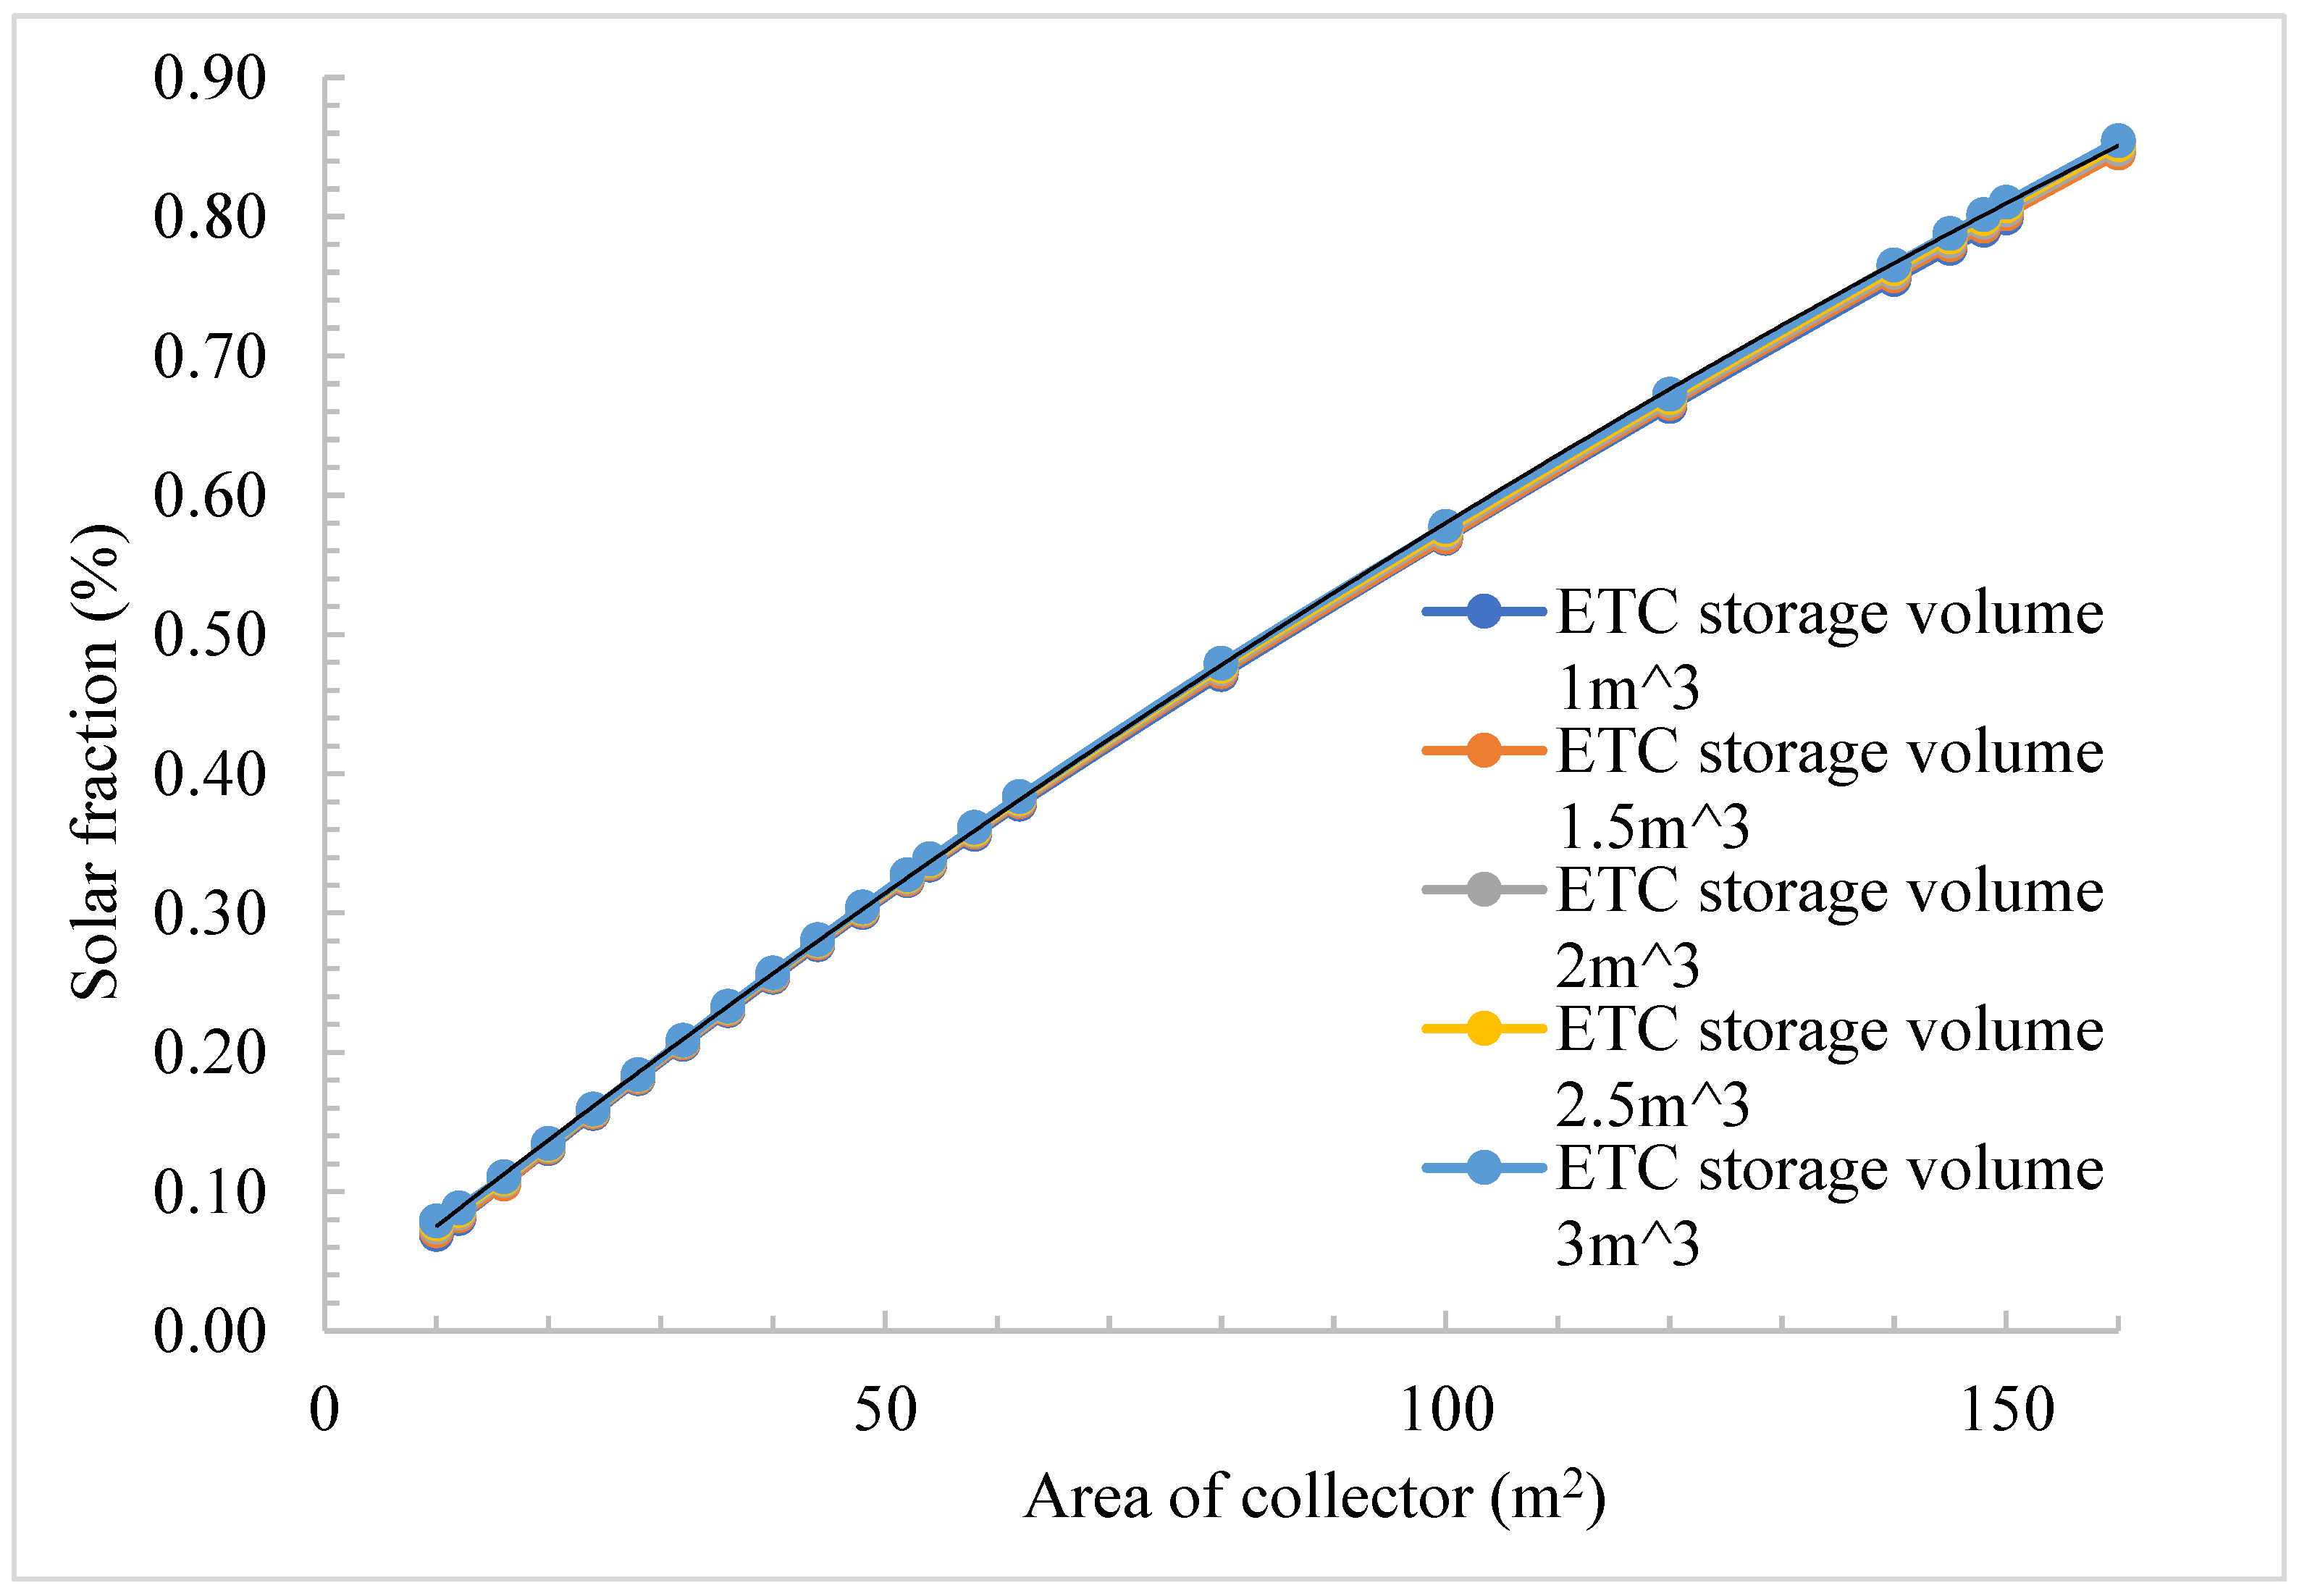
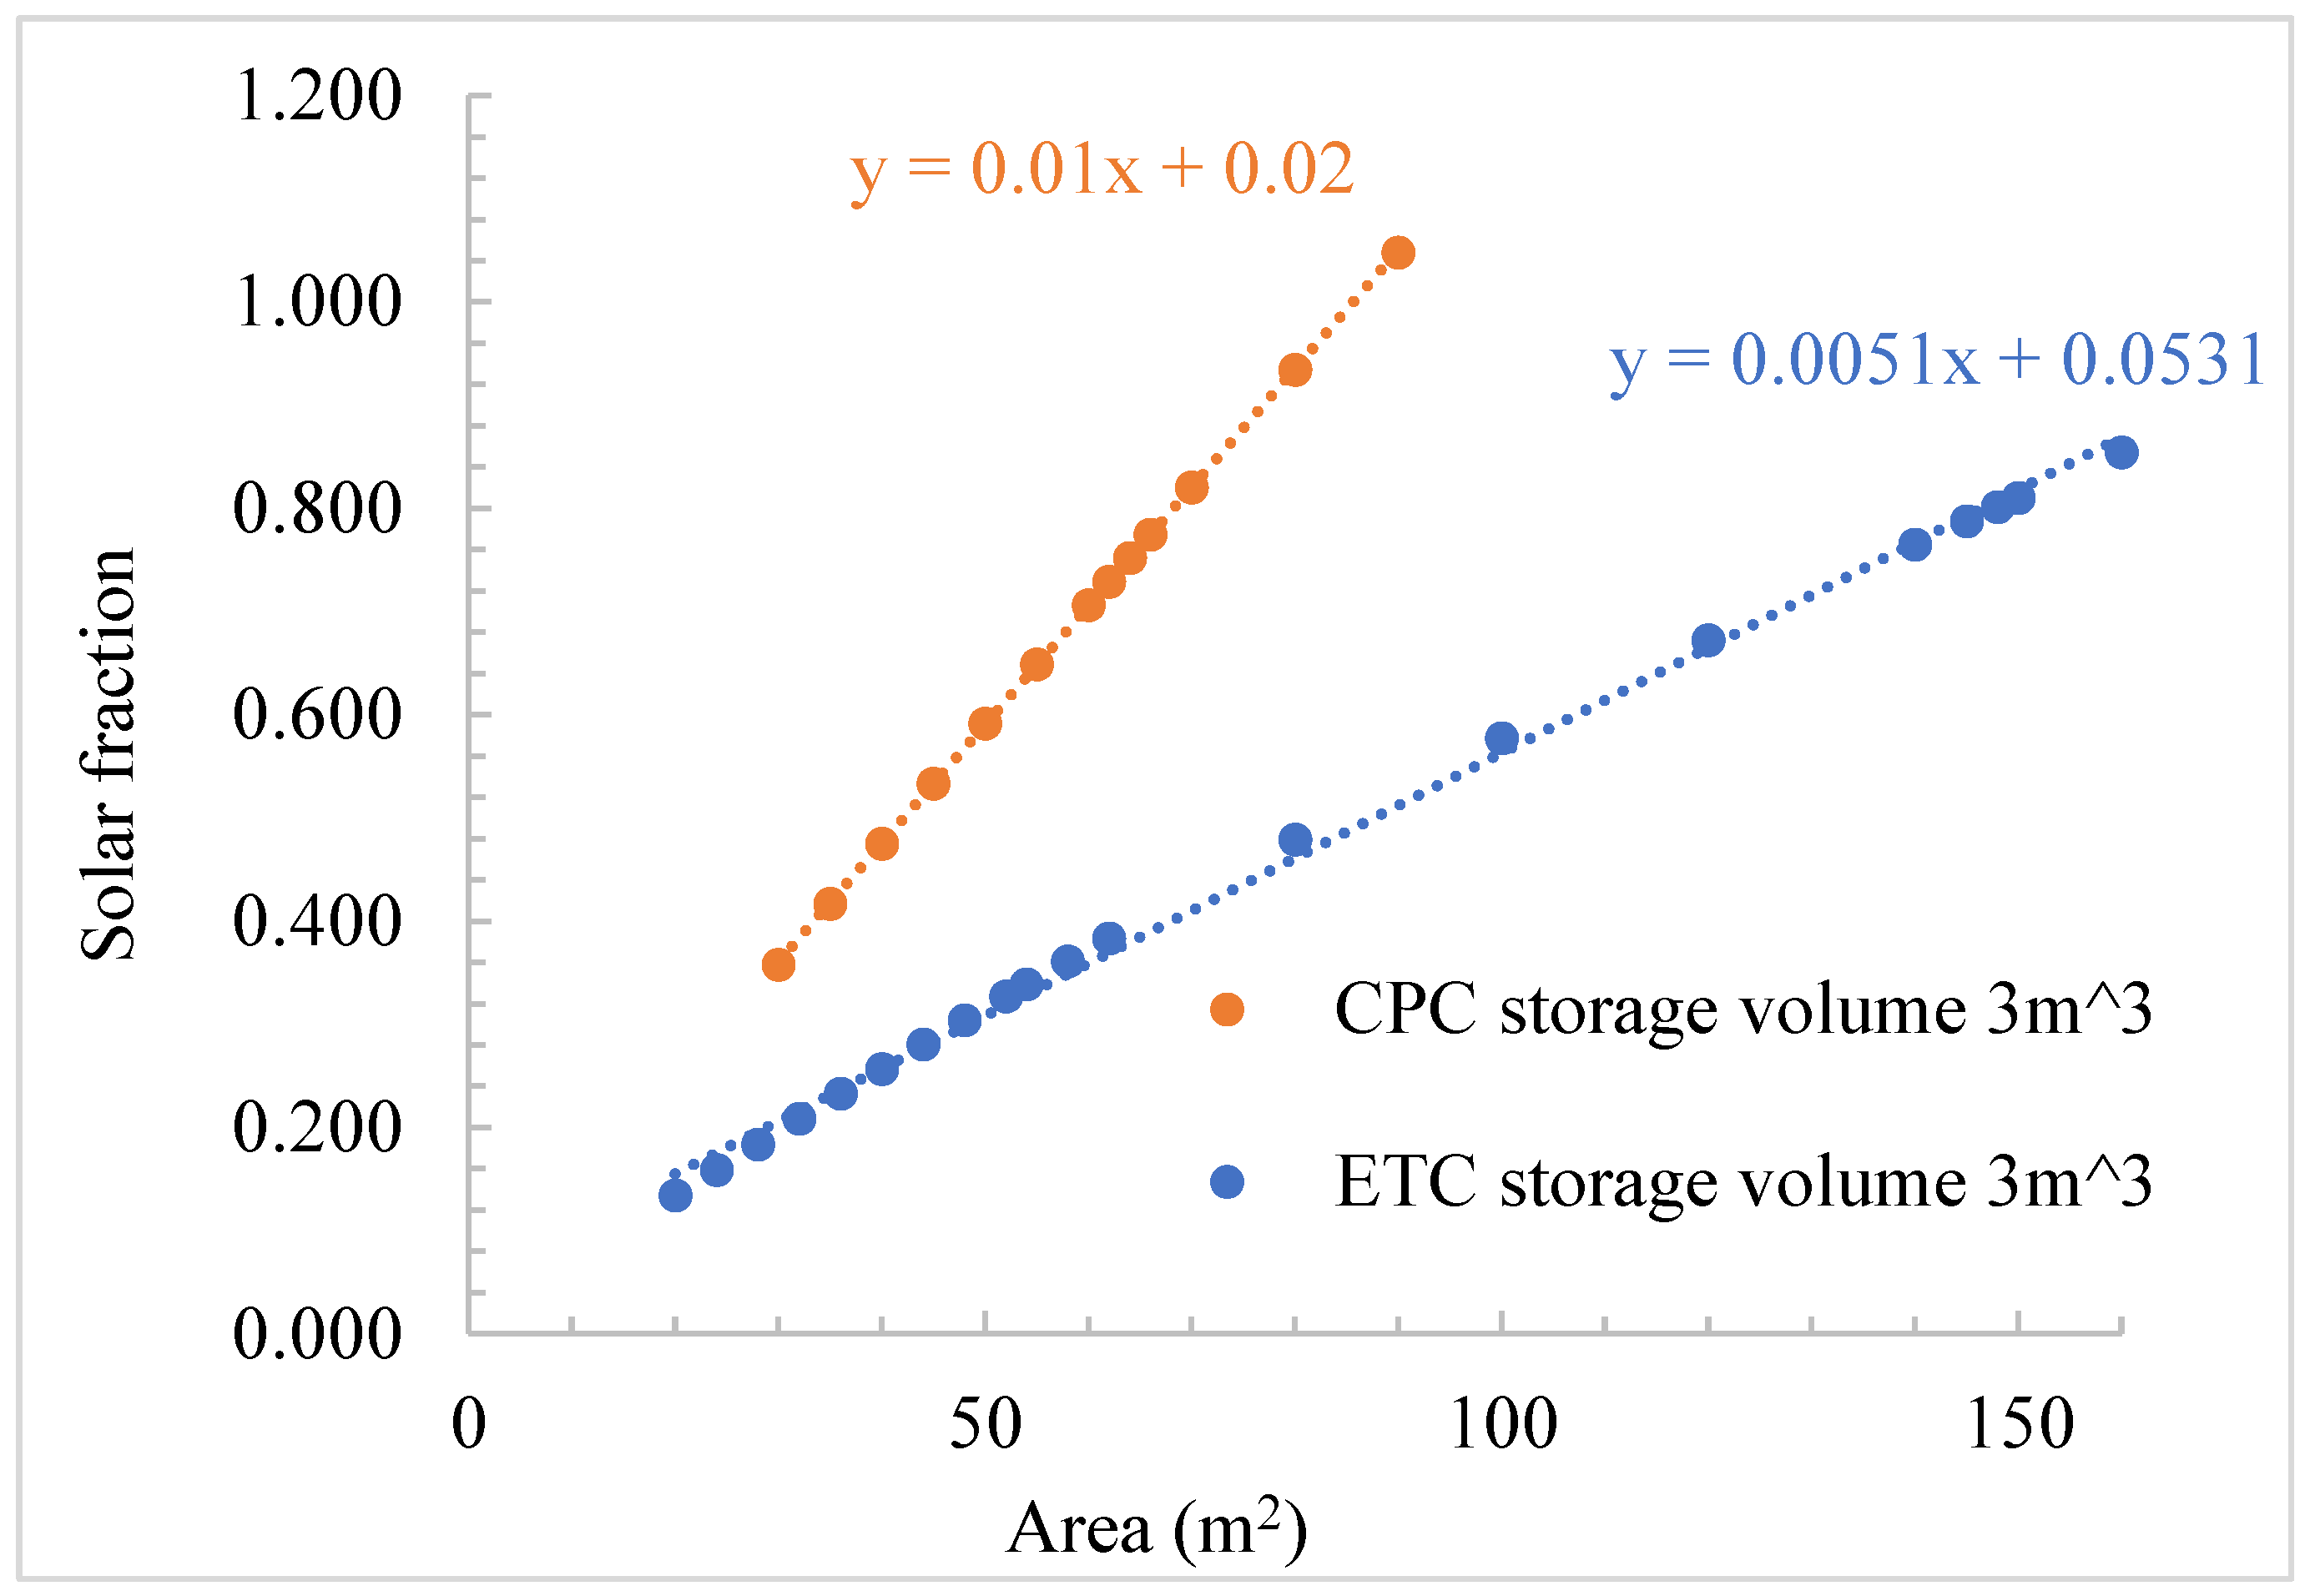
4.1. Design of the Solar Collector and the Chiller System Components

The relationship between collector area, volume of energy storage, and solar fraction for ETCs and CPCs is shown in Figure 6 and Figure 7, respectively.
From Figure 6 and Figure 7 the greatest influence on the annual solar fraction is the installed area of collector. The volume of energy storage has minimal effect on the annual solar fraction but does have an impact on the cost of solar energy over the system lifetime The peak load on the system coincides with the peak supply of solar radiation which explains why energy storage has a minimal effect on solar fraction supplied towards cooling. Figure 8 and Figure 9 show the relationship between installed collector area, volume of energy storage, and lifetime system calculated cost for ETCs and CPCs, respectively.
Figure 8 and Figure 9 clearly show that for both types of solar collectors an energy storage volume of 3 m3 is the more cost-effective choice for collector array areas greater than 62 m2 and 37 m2 for ETCs- and CPCs-based VACs, respectively.

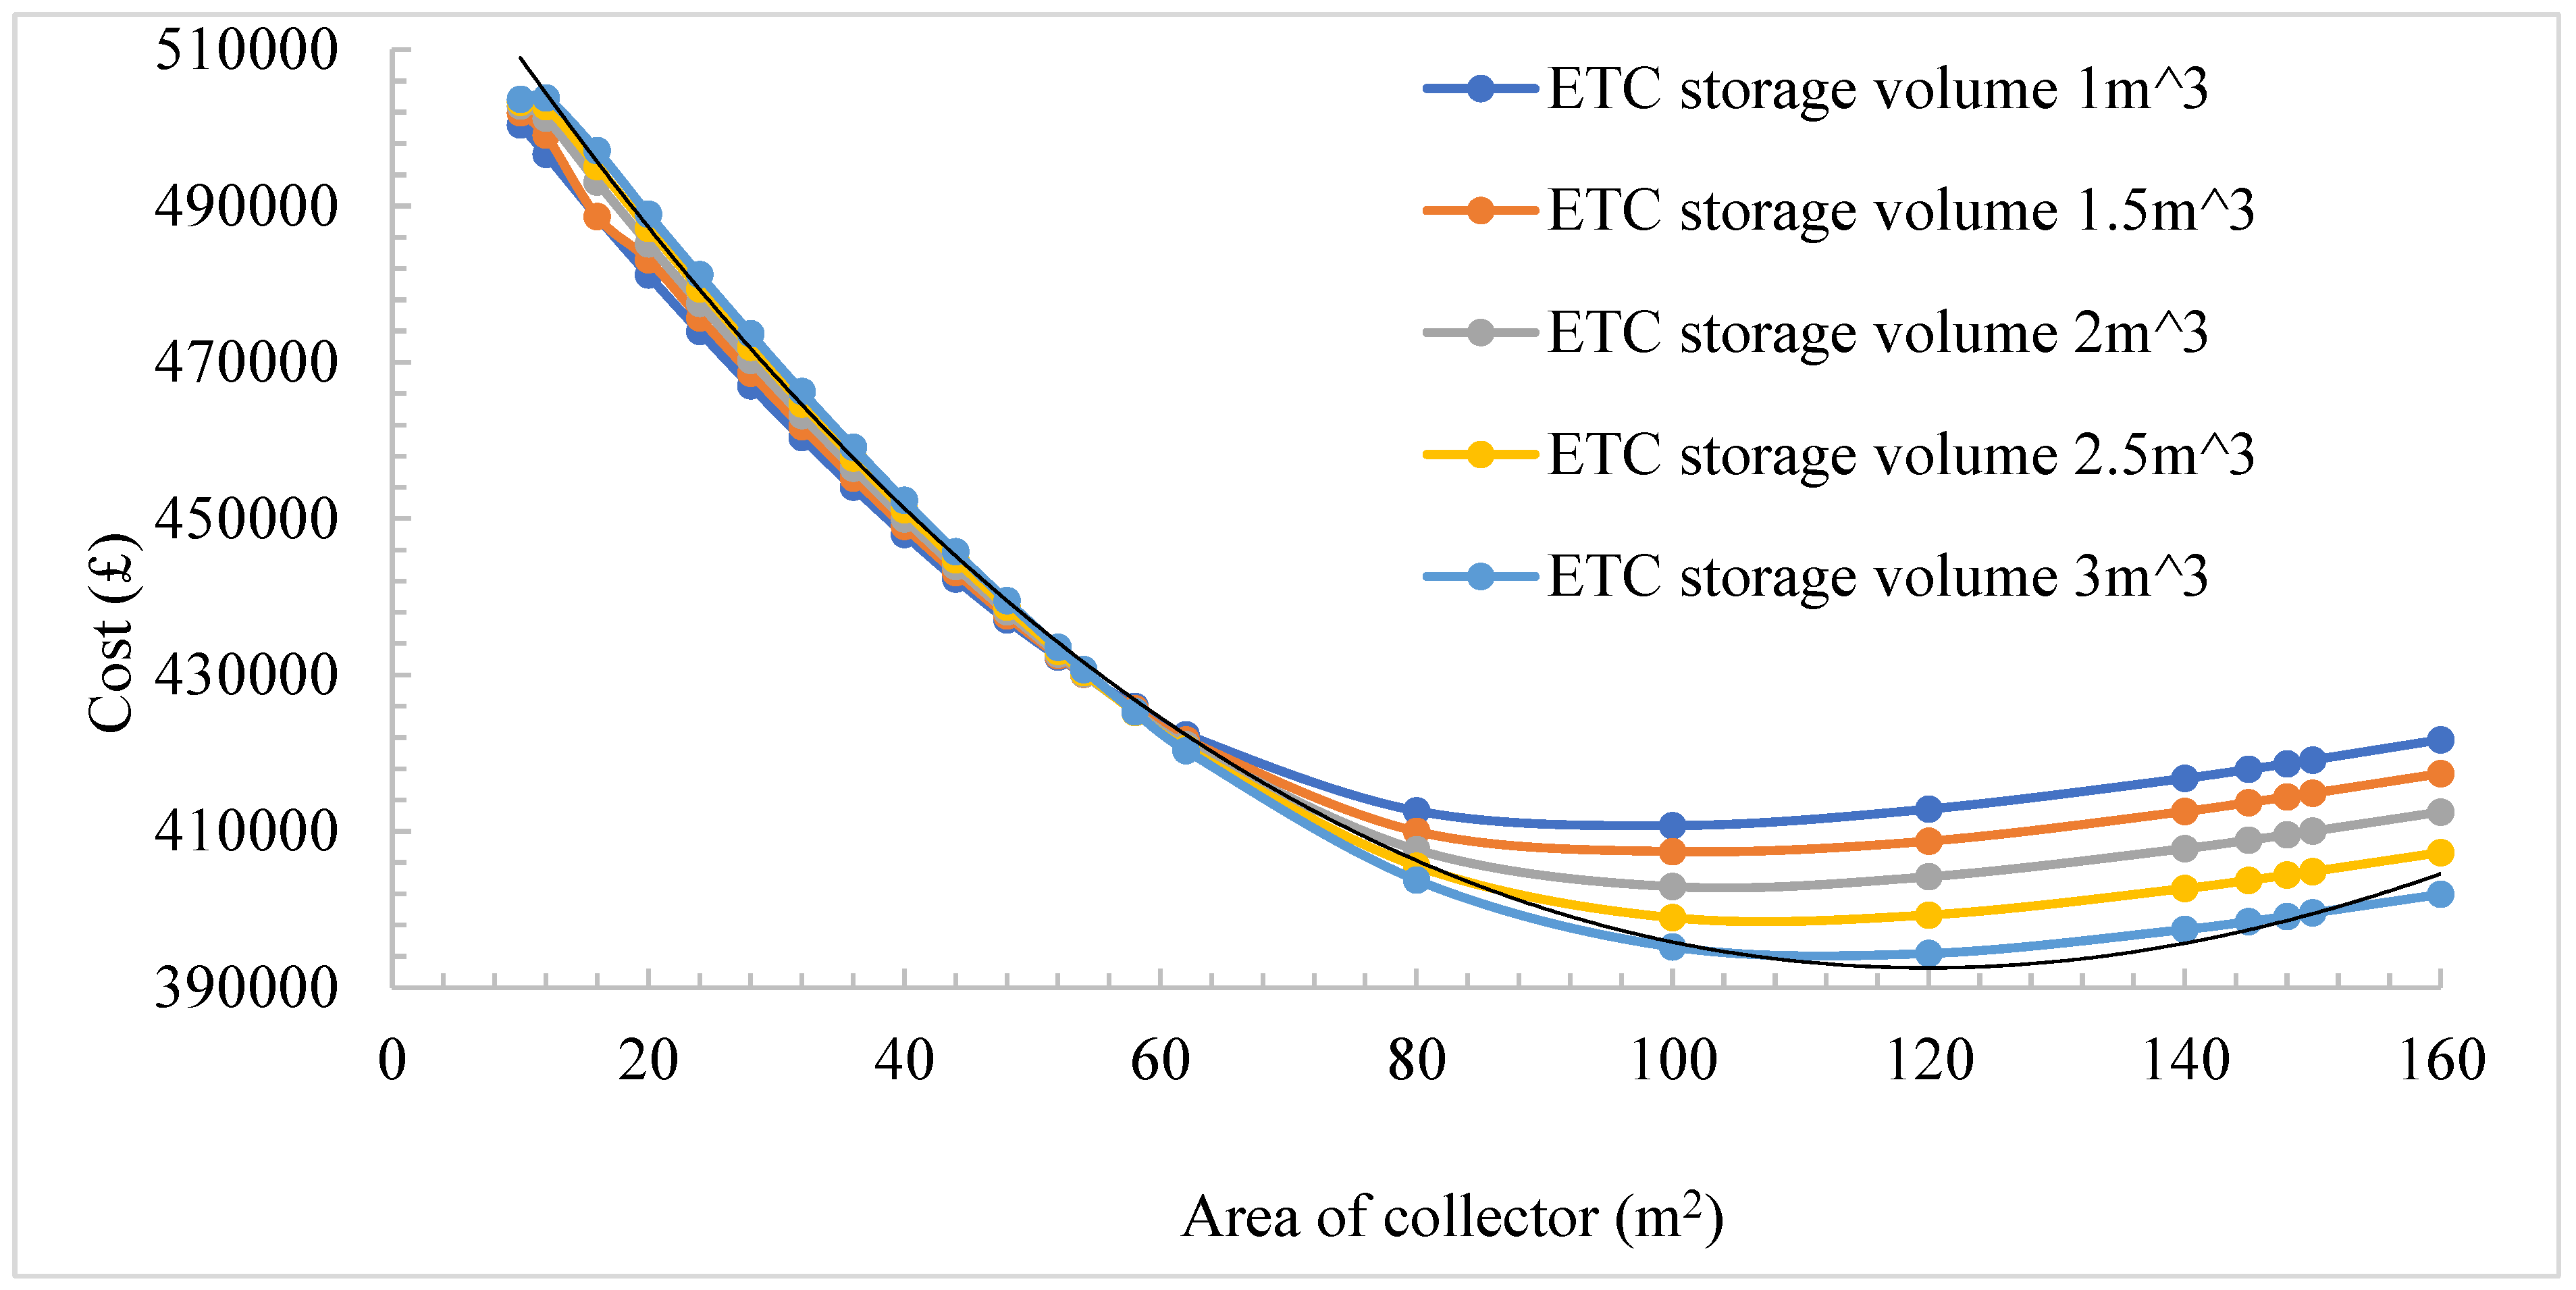
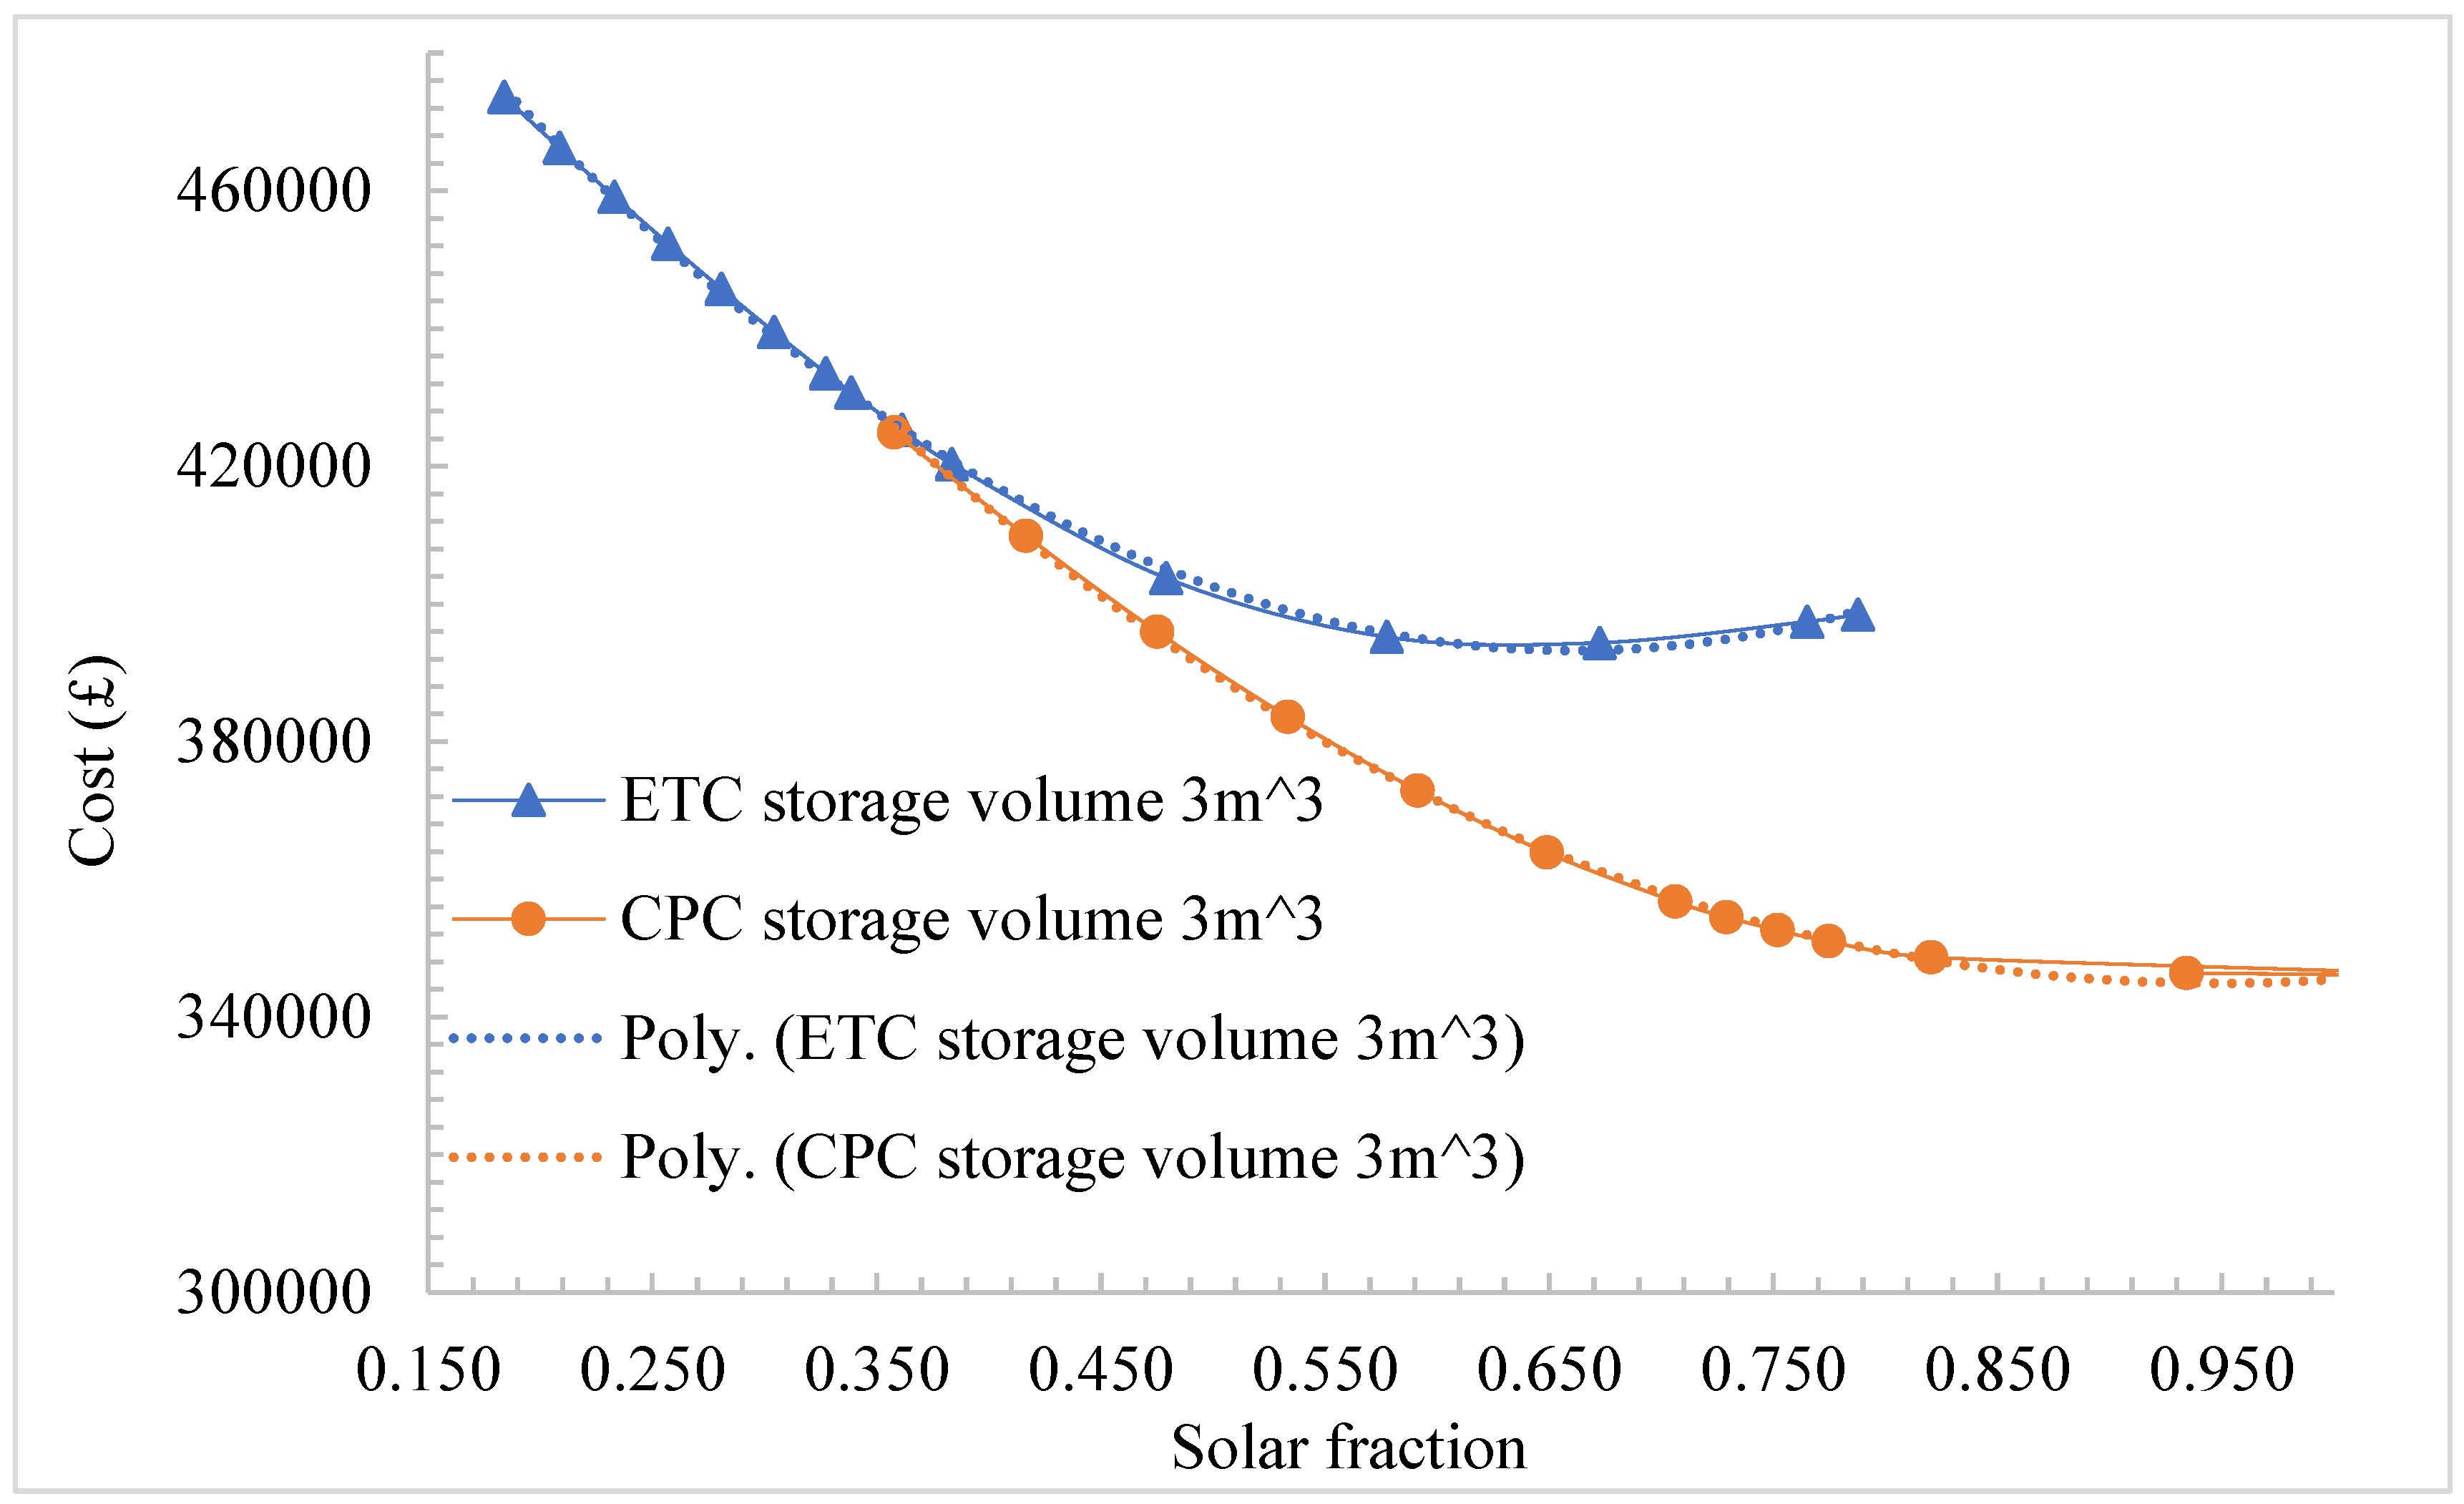
4.2. Cost and Savings from Optimal Solar Collector Configurations Investigated

To determine the optimal configuration (maximum solar fraction and minimum lifetime cost) for an ETC and CPC collector array integrated with a 3 m3 hot water storage tank the relationship between solar fraction and the lifetime cost was determined as shown in Figure 10.
From Figure 10 the data shown for the solar fractions and the lifetime cost of the solar energy systems was correlated using MS Excel. The derived second order polynomials were used to predict the optimal solar fractions for ETCs and CPCs as 0.661 and 0.938, respectively, these are shown in Equations (5) and (6), respectively.
C S C = 357910 x 2 473243 x + 549658
C S C = 239066 x 2 448371 x + 554770
Using the correlations between solar fraction and the lifetime costs of solar energy shown in Equations (5) and (6) the cost of an optimised ETC and CPC VAC system was calculated as 393,223 GBP, 344,539 GBP, respectively. The linear relationship between collector area and solar fraction is shown in Figure 11.
As observed in Figure 11 the required collector area for these optimal solar fractions exhibits a strong positive linear correlation between area and solar fraction.
From Figure 11 the relationship derived between area and solar fraction can be correlated with a certainty greater than 0.99 for both types of solar collectors. The area required to meet the solar fractions for ETCs and CPCs was calculated using Equations (7) and (8), respectively, where x is the area of collector, both of these were derived from the linear correlations shown in Figure 11.
S F E T C = 0.0051 x + 0.0531
S F C P C = 0.0115 x + 0.0154
For ETCs and CPCs the optimal area required was calculated using Equations (7) and (8) as 119 m2 and 80 m2, respectively. It is seen in Appendix A from Table A5, in the months of December, January, and February that there is a significant demand for heating energy. The thermal output of the solar collectors can be used to meet this demand to further augment the cost of the solar VAC system and increase the amount of CO2 emissions displaced. For the PHCC investigated, CPC solar collectors with an optimal area of 80 m2 were predicted to save 1756 GBP/year and reduce 4925 kgCO2/year.
The optimal system sizes for both ETC and CPC collector driven VAC systems were then employed to make some deductions on the likely energy and carbon impact of increased uptake of solar VAC systems in Egypt. The configuration, collector array area ( A c ), solar fraction ( S F ), annual useful energy output of the solar collector array ( Q u ), lifetime costs, and lifetime savings of the optimal solar VAC system calculated from the TRNSYS simulations are shown in Table 2.
The advantages of using CPC solar collectors to drive hot water-fired absorption cooling systems compared with ETCs is clearly observed in Table 2. The optimal CPC-based system requires an aperture area 32.7% lower than the ETC, has a solar fraction 26.6% higher, generates 1.4 times more useful energy per annum, has a lifetime cost 14.5% lower and a lifetime saving 28.5% higher than the optimal sized ETC-based system.

4.3. Carbon Reduction Impact of the Optimal System

Egypt has a GEF of 0.533 tCO2/MWh, and annually consumes 7967.2 GWh of electricity for air conditioning within buildings [5]. From Table 2 each square meter of aperture generates 1.21 MWh which results in a carbon saving of 0.645 tonnes so each similar sized system installed could save 51.6 tonnes per annum.

4.4. Results Summary

These results clearly show how weather, building materials, occupancy patterns, energy demand variations, and solar insolation affect the design specifications of the solar absorption chillers for small scale buildings. This indicates the inaccuracies caused by using the over simplifying assumptions described by previous studies. The effect of three-dimensional building elements’ orientations and sizes, building materials and the weather, as well as occupancy and energy demand patterns were determined and presented. The optimum design features of the system components required for this particular application were identified using the TRNOPT subroutine. The results are presented using visual tools, figures, graphs, and tables. Table 3 summarises the difference between this investigation with previous studies.

5. Conclusions

The proposed building design methodology using TRNSYS 18 software was described in more detail than the presently available published literature and training manuals. The optimal aperture area for ETC and CPC-based systems used to cool a building in Cairo, Egypt, was calculated using the TRNSYS simulation developed using the method described by this research as 119 m2 and 80 m2, respectively. With an annual consumption of 7967.2 GWh currently used for air conditioning in Egypt and presuming that 94% (maximum SF of optimised CPC-based absorption chiller) of this can be met using solar cooling, then 7441 GWh of grid electricity can be displaced, saving 3,966,247 tCO2/year. The design technique described by this research is easily adaptable and modified by selecting the appropriate weather file available in the TRNSYS database to design for countries with a similar solar resource such as those in North Africa, the Middle East, sub-Saharan Africa, South America, and South Asia.

Author Contributions

Conceptualization, H.S., D.R. and A.P.; Formal analysis, D.R., H.S.; Investigation, A.P.; Methodology, D.R. and A.P. and H.S.; Project administration, H.S., A.G. and M.S.; Resources, H.S.; Software, D.R., A.P.; Supervision, H.S.; Writing—D.R., A.P. and H.S. All authors have read and agreed to the published version of the manuscript.

Funding

This research was funded by the NoNSTOP project from Newton Fund Institutional Links Programme (grant number 352029736) and for the SolCoS project from Innovate UK (project number 48979).

Institutional Review Board Statement

Not applicable.

Informed Consent Statement

Not applicable.

Data Availability Statement

Any reported data is contained within the manuscript.

Acknowledgments

The authors thankfully acknowledge the funding received for the NoNSTOP project from Newton Fund Institutional Links Programme and for the SolCoS project from Innovate UK.

Conflicts of Interest

The authors declare no conflict of interest.

Appendix A

Table A1. Building materials and construction details employed.
Building ElementMaterial Equivalent in TRNbuildTotal Thickness
(m)
Total Area
(m2)
U Value (W/m2K)—TRNbuild Data
External Walls203 mm common brick + 13 mm plaster gypsum0.2162052.056
RoofConcrete 180 mm + Cement mortar 20 mm + Mineral wool 20 mm + Sand Gravel 50 mm + Gypsum mortar 25 mm + Tile 30 mm0.3252251.021
Floor25 mm Stone + Insulation 76 mm + Concrete 102 mm0.2032250.497
Glazing typeSingle pane window (6 mm, g-value 0.823)0.00615.69
Table A2. Air infiltration rates for each room.
RoomInfiltration TypeLitre/Hour
DoctorSouth0.56
ReceptionNorth0.5
StoreNorth0.5
Table A3. Gain types from human activities adapted from TRNbuild data.
Gain Type Name, Description, Category, and ModeRadiative (kJ/h)Convective (kJ/h)Absolute Humidity (kg/h)Room
Activity level IV (moderately active office work), 24 °C room dry bulb temperature, person, absolute gain156.6113.40.081Doctor
Activity level I (reclining), 22 °C room air temperature, person, absolute gain139.32139.320.035Doctor
Activity level IV (standing, medium activity), 22 °C room air temperature, person, absolute gain212.04212.040.1288Reception
Light_10 W/m2: Light source with heat flow 10 W/m2, 40% convective, electrical equipment, gain related to reference floor area21.614.40Doctor, Reception, Store
SIA_2024_Dev_32 office: Area related equipment heat gain7.228.80Doctor
SIA_2024_Occ_22reception: Area related heat and moisture gain by people25.225.20.016Reception
Freezer: Freezer to store vaccine, absolute gain015000Store
Table A4. Monthly cooling and heating demand for PHCC to maintain 22 °C.
MonthCooling Demand
(kWh)
Heating Demand
(kWh)
Monthly Global Solar Irradiation
(kWh/m2)
January0372342
February8245948
March250143369
April146118876
May32411679
June4601073
July5123077
August4865073
September3593063
October21095855
November166103946
December0309541
Table A5. Specifications of a typical 35.2 kW capacity commercial VAC.
Mass Flow
Rate (kg/s)
Inlet
Temperature (°C)
Outlet
Temperature (°C)
Energy
(kW)
Chilled water1.66712734.82
Cooling water7.222323590.52
Hot water2.472908551.64
Table A6. Scaled technical specifications for a 20kW chiller.
Mass Flow Rate
(kg/s)
Inlet Temperature
(°C)
Outlet Temperature
(°C)
Output
(kW)
Chilled water0.95712720.01
Cooling water4.148323552.02
Hot water1.420908529.68

References

  1. Alahmer, A.; Ajib, S. Solar Cooling Technologies: State of Art and Perspectives. Energy Convers. Manag. 2020, 214, 112896. [Google Scholar] [CrossRef]
  2. Pickard, H.M.; Criscitiello, A.S.; Persaud, D.; Spencer, C.; Muir, D.C.G.; Lehnherr, I.; Sharp, M.J.; De Silva, A.O.; Young, C.J. Ice Core Record of Persistent Short-Chain Fluorinated Alkyl Acids: Evidence of the Impact From Global Environmental Regulations. Geophys. Res. Lett. 2020, 47, e2020GL087535. [Google Scholar] [CrossRef]
  3. The Socio-Economic Impacts of Renewable Energy and Energy Efficiency in Egypt Local Value and Employment. Available online: https://www.rcreee.org/sites/default/files/report-final_rcreee_website-_13-02.pdf (accessed on 17 January 2021).
  4. Energy Efficiency for Appliances with a Focus on Air Conditioning. Available online: https://rcreee.org/publications/energy-efficiency-appliances-focus-air-conditioning/?language=ar (accessed on 18 January 2020).
  5. Takahashi, K.; Louhisuo, M. IGES List of Grid Emission Factors. Available online: https://www.iges.or.jp/en/pub/list-grid-emission-factor/en (accessed on 18 January 2021).
  6. Weiss, W.; Spörk-Dür, M. Solar Heat Worldwide Edition 2022; The Solar Heating and Cooling Programme International Energy Agency: Cedar, MI, USA, 2022. [Google Scholar]
  7. Winston, R. Principles of Solar Concentrators of a Novel Design. Sol. Energy 1974, 16, 89–95. [Google Scholar] [CrossRef]
  8. Rabl, A. Optical and Thermal Properties of Compound Parabolic Concentrators. Sol. Energy 1976, 18, 497–511. [Google Scholar] [CrossRef]
  9. Singh, H.; Eames, P.C. Correlations for Natural Convective Heat Exchange in CPC Solar Collector Cavities Determined from Experimental Measurements. Sol. Energy 2012, 86, 2443–2457. [Google Scholar] [CrossRef]
  10. Hang, Y.; Qu, M.; Winston, R.; Jiang, L.; Widyolar, B.; Poiry, H. Experimental Based Energy Performance Analysis and Life Cycle Assessment for Solar Absorption Cooling System at University of Californian, Merced. Energy Build. 2014, 82, 746–757. [Google Scholar] [CrossRef]
  11. Winston, R.; Jiang, L.; Widyolar, B. Performance of a 23KW Solar Thermal Cooling System Employing a Double Effect Absorption Chiller and Thermodynamically Efficient Non-Tracking Concentrators. Energy Procedia 2014, 48, 1036–1046. [Google Scholar] [CrossRef]
  12. Widyolar, B.; Jiang, L.; Ferry, J.; Winston, R. Non-Tracking East-West XCPC Solar Thermal Collector for 200 Celsius Applications. Appl. Energy 2018, 216, 521–533. [Google Scholar] [CrossRef]
  13. Bhusal, Y.; Hassanzadeh, A.; Jiang, L.; Winston, R. Technical and Economic Analysis of a Novel Low-Cost Concentrated Medium-Temperature Solar Collector. Renew. Energy 2020, 146, 968–985. [Google Scholar] [CrossRef]
  14. Novel Nano-LiBr Based Solar PVT Technology for Poly-Generation (NoNSToP) 2019–2021. Available online: https://www.brunel.ac.uk/people/project/227218 (accessed on 10 July 2022).
  15. Innovative Solar Energy Technology for Kenyan Tea Industry 2019–2021. Available online: https://www.brunel.ac.uk/research/Projects/Innovative-solar-energy-technology-for-Kenyan-tea-industry (accessed on 10 July 2022).
  16. Parupudi, R.V.; Singh, H.; Kolokotroni, M. Low Concentrating Photovoltaics (LCPV) for Buildings and Their Performance Analyses. Appl. Energy 2020, 279, 115839. [Google Scholar] [CrossRef]
  17. Hadavinia, H.; Singh, H. Modelling and Experimental Analysis of Low Concentrating Solar Panels for Use in Building Integrated and Applied Photovoltaic (BIPV/BAPV) Systems. Renew. Energy 2019, 139, 815–829. [Google Scholar] [CrossRef]
  18. Alsagri, A.S.; Alrobaian, A.A.; Almohaimeed, S.A. Concentrating Solar Collectors in Absorption and Adsorption Cooling Cycles: An Overview. Energy Convers. Manag. 2020, 223, 113420. [Google Scholar] [CrossRef]
  19. Shirazi, A.; Taylor, R.A.; Morrison, G.L.; White, S.D. Solar-Powered Absorption Chillers: A Comprehensive and Critical Review. Energy Convers. Manag. 2018, 171, 59–81. [Google Scholar] [CrossRef]
  20. Xu, Z.Y.; Wang, R.Z. Simulation of Solar Cooling System Based on Variable Effect LiBr-Water Absorption Chiller. Renew. Energy 2017, 113, 907–914. [Google Scholar] [CrossRef]
  21. Klein, S.A.; Cooper, P.I.; Freeman, T.L.; Beekman, D.M.; Beckman, W.A.; Duffie, J.A. A Method of Simulation of Solar Processes and Its Application. Sol. Energy 1975, 17, 29–37. [Google Scholar] [CrossRef]
  22. Klein, S.A. TRNSYS Users Manual; Version 14.1; University of Wisconsin Solar Energy Lab: Madison, WI, USA, 1994. [Google Scholar]
  23. Khan, M.S.A.; Badar, A.W.; Talha, T.; Khan, M.W.; Butt, F.S. Configuration Based Modeling and Performance Analysis of Single Effect Solar Absorption Cooling System in TRNSYS. Energy Convers. Manag. 2018, 157, 351–363. [Google Scholar] [CrossRef]
  24. Ibrahim, N.I.; Al-Sulaiman, F.A.; Ani, F.N. A Detailed Parametric Study of a Solar Driven Double-Effect Absorption Chiller under Various Solar Radiation Data. J. Clean. Prod. 2020, 251, 119750. [Google Scholar] [CrossRef]
  25. García-Sanz-Calcedo, J.; de Sousa Neves, N.; Almeida Fernandes, J.P. Measurement of Embodied Carbon and Energy of HVAC Facilities in Healthcare Centers. J. Clean. Prod. 2021, 289, 125151. [Google Scholar] [CrossRef]
  26. Maina, J.; Ouma, P.O.; Macharia, P.M.; Alegana, V.A.; Mitto, B.; Fall, I.S.; Noor, A.M.; Snow, R.W.; Okiro, E.A. A Spatial Database of Health Facilities Managed by the Public Health Sector in Sub Saharan Africa. Sci. Data 2019, 6, 134. [Google Scholar] [CrossRef]
  27. Ahmed, Y.K.; Ibitoye, M.O.; Zubair, A.R.; Oladejo, J.M.; Yahaya, S.A.; Abdulsalam, S.O.; Ajibola, R.O. Low-Cost Biofuel-Powered Autoclaving Machine for Use in Rural Health Care Centres. J. Med. Eng. Technol. 2020, 44, 489–497. [Google Scholar] [CrossRef]
  28. Radwan, A.F.; Hanafy, A.A.; Elhelw, M.; El-Sayed, A.E.-H.A. Retrofitting of Existing Buildings to Achieve Better Energy-Efficiency in Commercial Building Case Study: Hospital in Egypt. Alex. Eng. J. 2016, 55, 3061–3071. [Google Scholar] [CrossRef]
  29. WHO, Primary Health Care. Available online: https://www.who.int/news-room/fact-sheets/detail/primary-health-care (accessed on 2 February 2021).
  30. William, M.; El-Haridi, A.; Hanafy, A.; El-Sayed, A. Assessing the Energy Efficiency and Environmental Impact of an Egyptian Hospital Building. IOP Conf. Ser. Earth Environ. Sci. 2019, 397, 012006. [Google Scholar] [CrossRef]
  31. Butcher, K.; Craig, B. (Eds.) Environmental Design: CIBSE Guide A., 8th ed.; Chartered Institution of Building Services Engineers: London, UK, 2015; ISBN 978-1-906846-54-1. [Google Scholar]
  32. Yu, J.; Li, Z.; Chen, E.; Xu, Y.; Chen, H.; Wang, L. Experimental Assessment of Solar Absorption-Subcooled Compression Hybrid Cooling System. Sol. Energy 2019, 185, 245–254. [Google Scholar] [CrossRef]
Figure 1. Layout and geometric details of the PHCC studied.
Sustainability 14 11549 g001
Figure 2. Total monthly average global solar irradiation, average ambient and roof surface temperatures of the modelled building in Cairo; adapted from the Metronome dataset available within TRNSYS.
Sustainability 14 11549 g002
Figure 3. Overall solar VAC system design and sizing methodology adopted.
Sustainability 14 11549 g003
Figure 4. Monthly heating and cooling energy demand predicted for PHCC.
Sustainability 14 11549 g004
Figure 5. TRNSYS absorption chiller system diagram.
Sustainability 14 11549 g005
Figure 6. Installed area of collector and predicted annual solar fraction for ETCs.
Sustainability 14 11549 g006
Figure 7. Installed area of collector and predicted annual solar fraction for CPCs.
Sustainability 14 11549 g007
Figure 8. Installed area of collector and lifetime system cost for ETCs.
Sustainability 14 11549 g008
Figure 9. Installed area of collector and lifetime system cost for CPCs.
Sustainability 14 11549 g009
Figure 10. Lifetime cost of solar energy system and solar fraction.
Sustainability 14 11549 g010
Figure 11. Relationship between collector area and solar fraction with a storage volume of 3 m3.
Sustainability 14 11549 g011
Table 1. Values used to calculate system lifespan costs.
Solar Collector Type C s c (GBP/m2) C S T (GBP/m3) C G E (GBP/kWh)L (Year)
ETC4007500.1920
CPC4007500.1920
Table 2. Array size and Houtputs for optimized solar cooling systems.
Solar Collector Type A c
(m2)
S F
(%)
Q u
(kWh/Year)
Q u / m 2
(kWh/Year/m2)
Lifetime Costs
(GBP)
Lifetime Savings
(GBP)
ETC1190.6769,017580394,284262,265
CPC800.9496,5641207344,127366,944
Table 3. Comparison of this investigation with previous studies.
StudyChiller Size (kW)Solar Collector Area (m2)Mode of StudySolar Collector TypeClimateOptimisation Technique
[10]2354ExperimentalCPCMediterranean/USANone used
[18]NANAReview (theoretical)Parabolic Trough Collector, CPC, Parabolic Dish Concentrator, Linear Fresnel ReflectorNANone used
[20]50200Artificial neural network and TRNSYS type12cCPCSteady stateYes
[23]2982050/1650Artificially simulated cooling load (TRNSYS type 686)Flat Plate Collector, ETCHumid subtropical climate/PakistanYes, graphical curve fitting
[24]11631350Simulation using Engineering Equation SolverParabolic Trough CollectorTropical/Kuala Lumpur MalaysiaYes, graphical curve fitting/genetic algorithm
[32]427ExperimentalCPCSubtropical/Guangzhou ChinaNone used
Current Study35.2119 (ETC) and 80 (CPC)Simulation using TRNSYS18 and multizone building type 56ETC and CPCDesert/Helwan Cairo EgyptYes, TRNOPT using Hookes–jeeves Algorithm
Publisher’s Note: MDPI stays neutral with regard to jurisdictional claims in published maps and institutional affiliations.

