Abstract
To enhance the sustainability of the regional economy, this study attempts to integrate historical big data of multiregional and multi-industry economic indicators, aiming to explore and discover the correlations among regions, industries, or cross-regional economic indicators. In this paper, two correlation analysis models (the 2-order correlation model and the elastic-net regularized generalized linear model) are used to conduct a correlation analysis study of multiregional and multi-industry economies, and 20 years of historical data from 9 prefecture-level cities in Shaanxi (778 indicators in total) are analyzed empirically. The results show that the proposed method can mine complex correlations from economic big data.
1. Introduction
In recent years, political issues, such as trade protectionism, racism, and populism, have brought great uncertainty to the political and economic development of countries worldwide [1]. In particular, the trade dispute between the United States and China has brought major challenges to the development of the world economy. In the face of today’s complex international environment, China, as the largest developing country, must urgently adjust its thinking on economic development, expand domestic demand, adjust its industrial structure, and establish a new strategy for regional economic development with adaptive capacity. In the report of China’s 19th National Congress, President Xi Jinping pointed out that China has entered a new era, and he clearly proposed building China into a strong, democratic, civilized, harmonious, and beautiful socialist modern power by the middle of this century [2]. However, in the context of current complex and changing macroeconomic development, how to effectively identify the main industrial drivers of regional economic development, how to accurately measure the internal correlation of the indicators affecting regional industrial development, and how to truly grasp the interaction between different industrial systems and their impacts on regional economic development are all important questions for the selection of pillar industries, the enhancement of urban competitiveness, and the development of regional economic synergy. Therefore, correlation analysis of the economic development impact factors of multiregional industries has become an important research topic.
In recent years, results from regional economy and industrial economy research in China have been abundant and broad in scope, and the research methods have become more advanced. Scholars have conducted multilevel and multiperspective research based on different research content and using various research methods, resulting in many research results. In terms of research content, most of the literature has focused on specific industries, such as agriculture [3], manufacturing [4,5], real estate [6], logistics [7], finance [8], productive services [9], cultural [10], information [11], and other related industries, and it has focused on regional industrial linkages and their ripple effects [12]. Policy recommendations to promote the rationalization of industrial structure have been proposed [13] as a powerful tool for determining the economic contributions of industries and the leading regional industries. Studies considering multiple industries and exploring regional economic linkages and their effects on the regional economy from multidimensional perspectives, such as outward orientation [14,15], have gradually gained attention. Research on the spatiotemporal correlation effects of regional economic development has become popular, studies have shown spatial correlations, hierarchical correlations, and administrative correlations in regional economic growth, and there are objective effects on the network of regional growth relationships [16]; there are network structures and spatiotemporal coupling characteristics in the spatial correlations of cross-country [17], interprovincial [18] and municipal economic growth in China [19,20], and there are strong urban economic spatial autocorrelations [21] and obvious spatial spillover effects [22,23,24]. Exploring the problem of the spatiotemporal effects of economic growth from a comprehensive multi-industry perspective is a promising direction for subsequent research.
In terms of research methods, the Leontief inverse coefficient is the main tool for studying associations, and the input–output method pioneered by Leontief is the most widely used method for industry association calculations. Scholars have used the inductance and influence coefficients [25] to measure the forward and backward linkages between a single industry and the entire national economy, including the industry itself, by constructing an economic distance model of industry linkages [26]. The classical regression analysis methods, principal component analysis methods, Markov chain methods, spatial econometric methods, and econometric models in economics have been fully used. In recent years, the research methods of regional economic growth spatial club convergence analysis [27,28,29] have received wide attention.
In terms of research regions, the results involve both large-scale studies, such as international, national, and regional studies, and small- and medium-scale studies, such as provincial, sectoral, and enterprise studies, showing geospatial dispersion. Although industrial relevance studies reflect variability across different regions and scales, industrial relevance studies have become criteria for comprehensive consideration of regional economic development capabilities.
However, regional economic development has multiregional and multi-industry characteristics, and economic development indicators have the characteristics of high dimensionality and a large amount of data. The existing research methods are particularly inadequate for mining the correlations between multiregional and multi-indicator systems.
2. Analysis of the Linkage of Multiregional Economy
Since the reform and opening up, all industries in China have become well developed and the conditions for the synergistic development of multiple industries exist. In the current era of prevalent neoliberalism [1], the comprehensive and coordinated development of various industrial economies and the promotion of comprehensive economic development of each region of China have become the top priorities. Determining how to coordinate the development of a multiregional multi-industry economy is very challenging: the economic indicators of multiregional multi-industries have the characteristics of high dimensionality and a large amount of data. As shown in Figure 1, among the three regions, there are correlations of economic indicators, which can influence each other. For example, in region 1, good agriculture and ecological environment can promote the development of tourism in the region, but at the same time, it will be influenced by the population size and culture level of region 2. The education level of the population in regions 1 and 2 is correlated with the development of the information industry and financial sector in region 3.
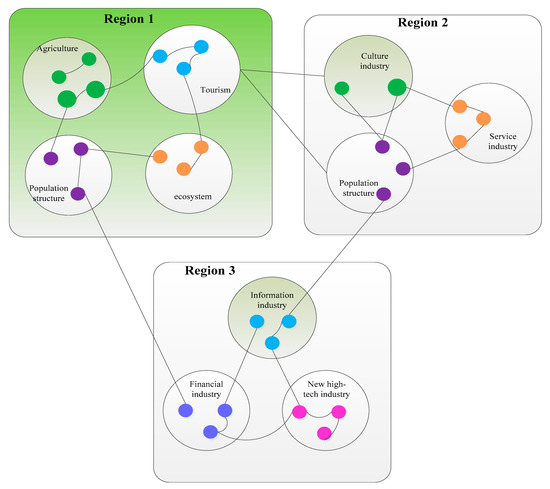
Figure 1.
Network of associations of impact factors (indicators) affecting economic development in regions 1 and 2. The node denotes the impact factor affecting the economic development of regions. (1) Within the same industry (large circle), if two nodes have connected edges, it indicates that there is a connection between these two factors (nodes) and that they may influence each other or synergize to affect the economic development of that industry. (2) Between different industries, if two nodes are connected by an edge, it means that these two factors (nodes) have an interactive relationship, and they may mutually inhibit or promote the economic development of the two industries. (3) Between the industries in the two regions, if there is a connected edge, it shows that there is an interactive relationship between the two industries, and they may inhibit or promote the economic development of the two regions. The figure is drawn with Microsoft Visio 2010.
To this end, the following important issues must be urgently addressed at this stage to enhance the country’s sustainable economic development.
- (1)
- Construction of a multiregional and multi-industrial structure economic index system. The indicators of regional population structure, ecological environment, tourism, logistics, service industry, agriculture, and industry are integrated to build a more scientific and complete multiregional and multi-industry structure indicator system.
- (2)
- Construction of correlation relationship model. For the multiregional and multi-industry structure, we integrate the big data of economic indicators and construct the mathematical model of the associational relationships of economic indicators so that the model can conduct association relationship mining between regional economic impact factors.
To address the above issues, this study focuses on the construction of the correlation relationship model of regional economic growth factors and conducts empirical analysis and research through the economic correlation of ten prefecture-level cities in Shaanxi Province. The regional economic data of Shaanxi Province for the past 20 years (1998–2018) were downloaded from the national research website (http://www.drcnet.com.cn/, accessed on 20 June 2020), and the data were organized and normalized to finally form 778 regional economic indicators.
3. 2-Order Correlation Model
The 2-order correlation model is expressed as follow,
where the function is used to calculate the association strength of evaluation indicators and , and is the set of all evaluation indicators.
For the 2nd-order correlation strength calculation function, the Pearson’s correlation coefficient and mutual information can be used. In this paper, the Pearson’s correlation coefficient (as in Equation (1)) is used to analyze the 2nd-order correlation of 778 evaluation indicators in 10 prefecture-level cities (Ankang, Shangluo, Hanzhong, Baoji, Xianyang, Tongchuan, Xi’an, Weinan, Yulin and Yan’an) in Shaanxi Province.
where N denotes the number of all evaluation indicators. denotes the correlation coefficient of evaluation indicators and . The larger that this value is, the stronger that the correlation is. If , it indicates that and are negatively correlated.
We used 2-order correction model (Equation (2)) to analyze the association of the economic indicators of ten cities in three regions (Guanzhong region, southern Shaanxi, and northern Shaanxi) of Shaanxi Province, China. Figure 2 shows the location distribution of the ten cities.
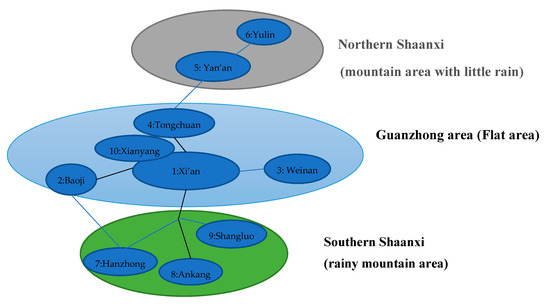
Figure 2.
The location distribution of the ten Prefecture-level cities. 1. Xi’an is the capital city of Shaanxi province. 2. Baoji the 2nd largest city of Shaanxi. Cities 1, 2, 3, 4 and 10 are located in a flat area (Xianyang has been incorporated into Xi’an now). Cities 5 and 6 are located in dry mountain with little rain. Cities are located in southern rainy mountain area.
Figure 3 (which was drawn with software Cytoscape 3.8. https://cytoscape.org/, accessed on 5 September 2020) shows the economic indicators with a strong correlation (correlation greater than 0.85) with the economic GDP growth rates of the nine prefecture-level cities in Shaanxi Province. The regional GDP growth rates are clearly strongly correlated with the GDP growth rates of adjacent regions, such as the southern region of Shaanxi (Hanzhong, Ankang, Shangluo), the central region of Guanzhong (Baoji, Tongchuan, Weinan, Xianyang) and the northern region of Shaanxi (Yan’an and Yulin), and the GDP growth rate of Xi’an, the strongest economic megacity in Shaanxi, is indirectly strongly correlated with the GDP growth rate of Yulin.
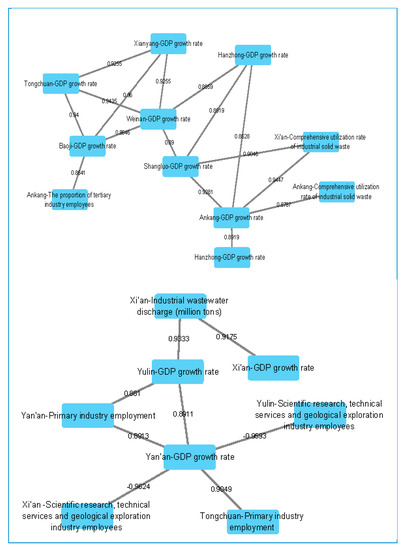
Figure 3.
Second-order (2nd-order) economic indicator correlation diagram. Nodes indicate regional economic indicators. The values on the connecting lines indicate the strength of the correlation between the economic indicators connecting the nodes. Blue edges indicate postitive correlations. Red edges indicate negative correlations.
Figure 3 shows that:
- (1)
- The regional economic correlation is highlighted by the characteristics of geographical proximity, i.e., urban areas with geographical proximity have higher economic correlation and greater interaction.
- (2)
- The economic development with the regional GDP growth rate as the main indicator shows the characteristics of cross-regional correlation, among which three major regions of Shaanxi (Northern Shaanxi, Guanzhong, and southern Shaanxi) have more obvious correlations, forming distinctive characteristics of the economic development of the three regions.
- (3)
- As the economic center of Shaanxi Province, Xi’an’s GDP growth is more related to the economic development of the two prefecture-level cities (Yulin and Yan’an) in northern Shaanxi. The research, technology, and geological prospecting practitioners in Xi’an and Yulin are negatively correlated with the growth of Yan’an GDP. The main reason may be the siphon effect in Xi’an and Yulin. The economy of Xi’an and three prefecture-level cities (Hanzhong, Ankang and Shangluo) in southern Shaanxi is more of a comprehensive utilization rate of industrial solid waste, which will have a strong correlation with the GDP growth of the three cities in southern Shaanxi.
4. Elastic-Net Regularized Generalized Linear Model
The elastic-net regularized generalized linear model can be expressed as follows:
where is a nonnegative value, denotes the number of observation samples, and . and are scalar values and an indicator weight vector of length M (M is the total number of economic indicators), respectively. and denote the predicted and true values of the model output, respectively.
The elastic-net regularized generalized linear model is used to discover the economic indicators that interact with the dependent variable Y and the corresponding weight values . The objective of is to minimize the deviation of the predicted value of the model from the true value, and the objective of is to compress the number of nonzero weights (reduce the number of redundant indicators) and find the few indicators that have the strongest correlations with the dependent variable Y. The larger that the value of is, the smaller that the number of indicators with correlation in the output will usually be (the fewer that the values of nonzero indicators are in vector ).
In this work, the elastic-net regularized generalized linear model is used to analyze the interaction correlation of the GDP growth rates of nine prefecture-level cities in Shaanxi Province, China, and 778 evaluation indicators are considered comprehensively to find indicators correlated with the GDP growth rates in each region. The experiments were implemented using MATLAB software, and 10-fold cross-validation was used to avoid overfitting. The test results of the model are shown in Table 1, Table 2, Table 3, Table 4, Table 5, Table 6, Table 7, Table 8 and Table 9, which report the regional indicators and weight values associated with the GDP growth rates of the nine regions in Shaanxi Province, respectively. In the results, we removed the weighted indicators that contributed little to the regional GDP growth rate and retained up to five indicators with the highest value of the weight coefficient for each region.

Table 1.
Economic indicators associated with the growth rate of Ankang’s regional GDP.
Table 2.
Economic indicators associated with the growth rate of Baoji’s regional GDP.
Table 3.
Economic indicators associated with the growth rate of Hanzhong’s regional GDP.
Table 4.
Economic indicators associated with the growth rate of Shangluo’s regional GDP.
Table 5.
Economic indicators associated with the growth rate of Tongchuan’s regional GDP.
Table 6.
Economic indicators associated with the growth rate of Weinan’s regional GDP.
Table 7.
Economic indicators associated with the growth rate of Xi’an regional GDP.
Table 8.
Economic indicators associated with the growth rate of Yan’an regional GDP.
Table 9.
Economic indicators associated with the growth rate of Yulin’s regional GDP.
It can be seen from Table 1 that the GDP growth rate of Ankang area is closely related to the GDP growth rate of Hanzhong and Shangluo. It is easy to understand that Hanzhong, Ankang, and Shangluo are all located in the southern of Shaanxi Province, and both belong to the Qinba Mountains in terms of geographic location. There are great similarities in economic development, industrial layout, and various resources. Therefore, the economies of the three cities are closely related and interact with each other to jointly affect regional economic growth. In addition, it is related to the amount of industrial wastewater discharge in Shangluo area. This is because from the perspective of the country’s development positioning in southern Shaanxi, southern Shaanxi is a national ecological function zone, which is a national restricted or prohibited development area. In terms of industrial development, the government gives priority to supporting the development of green economy and recycling industries, and prohibits the development of large-scale, high-energy-consuming and high-carbon emission industries. At the same time, Ankang is adjacent to Shangluo, and Shangluo’s industrial wastewater discharge is closely related to local economic growth.
In Table 2, the indicators related to the economic growth rate of GDP in the Baoji Region are the GDP growth rate of Hanzhong and Xianyang, the comprehensive utilization rate of industrial solid waste in the Xi’an Region, and the industrial wastewater discharge in the Xianyang Region. In terms of geographical location, the Baoji Region borders Hanzhong and Xianyang and has close transportation, while the Xi’an Region has an important influence on the economic development of Baoji due to the radiation effect of the central city of Xi’an. In Table 3, the GDP growth rate of the Hanzhong Region is correlated with that of the Ankang, Baoji, and Weinan regions and with the use of foreign capital in Shangluo. From Table 4, it can be seen that the GDP growth rate of the Shangluo region is closely related to that of Ankang and Xi’an. Shangluo is geographically contiguous with Ankang and Xi’an. As shown in Table 5, the GDP growth rate of the Tongchuan is closely related to that of Weinan, Xianyang, and Xi’an. Tongchuan is geographically contiguous with Xi’an, Xianyang, and Weinan (see Figure 2).
The GDP growth rate of the Tongchuan region has a strong correlation with the GDP growth rates of Weinan, Xi’an, and Xianyang (see Table 5), which is because they are in the same Guanzhong flat area, geographically close to each other, with close transportation networks and closely related industrial economies. We think the strong correlation between Tongchuan’s GDP growth and amount of Weinan’s foreign capital used is more likely a coincidental reason for the common growth of the two regions, and the correlation with Xi’an’s industrial wastewater discharge is more likely a result of the radiation influence generated by Xi’an as a central city.
It can be seen from Table 7 that there are seven economic indicators associated with the growth rate of GDP in Xi’an, covering six regions of Shaanxi. Among them, the larger weight coefficients are Shangluo’s “Region GDP growth rate” (0.4972), Ankang’s “Number of employed persons in primary industry” (0.36197), and Hanzhong’s “Industrial Output Value of Hong Kong, Macao and Taiwan Investment” (0.3266). Xi’an is the provincial capital and political and economic center of Shaanxi; it is the only megacity in Shaanxi and even northwestern China. It has a strong radiation ability to surrounding regions and has the siphon effect of large cities. It is also affected by the economic effects of other surrounding cities and regions.
Shangluo, as one of the southern Shaanxi regions, had a geographical advantage with Xi’an in terms of spatial distance before the opening of Xi’an-Ankang Railway, Xi’an-Hanzhong Expressway, Xi’an-Ankang Expressway, and Xi’an-Hanzhong High-speed Railway. It is the earliest city in southern Shaanxi that can reach Xi’an within an hour. Shangluo’s dependence on Xi’an is very strong, and its ability to receive radiation from Xi’an is also greater. As Shangluo’s geographical environment is surrounded by mountains and is dominated by mountains, the contribution rate of its primary industry to economic growth is far lower than that of the secondary and tertiary industries. With the country’s new positioning of the region’s economic development and the elimination of a large number of industries in the secondary industry, the proportion of Xi’an’s tertiary industry and the rate of increase in its regional GDP have an important impact on the growth of GDP.
At the same time, the difference in education level will also lead to a stronger dependence between regions. The greater the difference, the smaller the possibility of cooperation and the more obvious the dependency effect. Eventually, the uneven development of education will affect inter-regional development dependence. The siphon effect of metropolis has increased, while the radiation effect of education has decreased. Ankang has always been titled “Xi’an’s Back Garden”, but due to its weak industrial foundation, Ankang focuses on the development of biomedicine, tourism, and other industries based on resources such as agriculture and ecology. Therefore, the number of employees in Ankang’s primary industry not only has an impact on its own economic development but also has an important impact on the regional megacity Xi’an. From the perspective of the growth rate and proportion of the nonpublic economy, the latest statistics from the Shaanxi Provincial Bureau of Statistics in 2020 show that Ankang 59.6%, Xi’an 53.1%, and Shangluo 53.0% have the largest proportion of nonpublic economic added value in GDP. The top three places in the province show that Ankang, Xi’an, and Shangluo are highly active in the market economy and that the three regions play a strong role in market effectiveness such as increasing residents’ wealth and increasing employment levels. In addition, Hanzhong is the city in southern Shaanxi that is the farthest from Xi’an, but it is the region with the strongest industrial base and the most complete types of industries. There are a large number of old industrial bases left behind, including equipment manufacturing, modern materials, and green food and medicine. It has a strong foundation; especially its modern materials and green food and medicine have strong resource advantages and competitive strength, which complements the growth of Xi’an’s GDP. Since the beginning of the 21st century, Yan’an and Yulin in northern Shaanxi have achieved rapid growth in energy and heavy chemical industries during the inspection period based on their own resource endowment advantages and have become the regions with the most industrial structure and location advantages in the economic development of Shaanxi. The scale effect and diffusion effect on regional economic growth have been continuously enhanced, and it has become the most economic subcenter in Shaanxi.
It can be seen from Table 8 that there are five main indicators affecting the growth rate of GDP in Yan’an. The weight coefficient is greater than 0.3 is Yulin’s “Region GDP growth rate” (0.5476), followed by the “Number of Tongchuan’s industrial enterprises invested by Hong Kong, Macao and Taiwan business people” according to the degree of importance. The weight coefficient of Weinan’s “Number of employed persons in primary indus-try” is greater than 0.1. Yulin and Yan’an are the “geminis” of northern Shaanxi’s economic development, with similar resource endowments, similar industrial structures, and interconnected economic development. As a transportation hub city connecting the two major economic regions of Guanzhong and northern Shaanxi, Tongchuan has a certain location advantage in the development of secondary industries in Yan’an and Yulin in northern Shaanxi.
As shown in Table 9, the growth rates of the GDP of Yan’an and Yulin are highly correlated, with a weighting coefficient of 0.64435. It not only shows that these two regions have a strong interaction in the industrial structure but they also have a close relationship in location. As the only agricultural high-tech demonstration zone in China, Xianyang has distinct characteristics and advantages. The growth rate of its three industries is higher than the average level of the province, especially the growth of the primary industry. Xianyang has formed an economic development path with regional characteristics that is completely different from that of Yulin, which has a certain degree of complementarity and significance.
5. Conclusions
In light of the current regional economic research mainly being conducted for single regions and single (or a small number of) industries and without considering the interaction between multiregional and multi-industry economies, this paper attempts to explore the correlation between multiregional and multi-industry structural economies, aiming to discover the interactions among regions, industries, and cross-regional economic indicators, and then provides technical support for economic development decision-making.
Based on regional economic big data, this paper proposes the 2nd-order interaction relationship analysis model and elastic-net regularized generalized linear model and conducts empirical analysis and research on nine prefecture-level cities in Shaanxi Province. From the experimental results, both models are able to find some correlations between regions and are interpretable. This outcome indicates that the proposed analysis strategy is feasible; however, the calculation results could have some bias due to incomplete data before 2010. In further research, it is necessary to further improve the regional economic data, reasonably evaluate the index system, and construct a more reliable analysis model.
At present, despite the prevalence of trade protectionism, economic globalization has become an inevitable trend, and economic cooperation between countries is getting closer and closer. In the era of economic globalization, for a country, in addition to strengthening international economic cooperation, it is more important to pay attention to the effective circulation of the economy within the country and to strengthen the coordinated development between regions. Therefore, an in-depth understanding of the correlation of economic indicators between regions is very important to provide technical support for regional economic decision-making.
6. Discussions
- (1)
- Advantages
The current regional economic analysis studies mainly focus on the correlation analysis of economic indicators of multiple industries in a single region and rarely carry out the correlation analysis between regions. To discover the interactions between regions, we try to analyze the associations of multiregional and multi-industry economic indicators and find some important associations from Shaanxi province, China. The methodology can be applied to analyze the economic linkages between cities within each province in China to discover the interactions between multiple provinces in China and to explore the economic interdependencies between countries.
- (2)
- Limitations
In this study, two analytical models that we used are not quite effective enough, and some experimental results are difficult to interpret. One reason is that the economic data we employed are not complete enough and have a relatively small sample size, resulting in less accurate statistical and regression results. Another very important reason is that in the past 20 years, every regional economy in China has maintained a positive economic growth, which leads to obvious correlations in most indicators when conducting correlation analysis.
- (3)
- Future work
For further research, the regional economic annual and monthly data should be sorted out, a reasonable regional economic indicator evaluation system should be constructed, and a standardized regional economic data set should be integrated and established. It should mainly analyze and research data from regional industries (such as regional population structure, agriculture, industry, service industry, financial industry, service industry, information industry, high-tech talents, cultural industry, transportation, logistics, real estate, etc.).
Author Contributions
S.T. proposed the idea of multiregional economic correlation analysis firstly; H.H. puts forward many constructive ideas. S.T. wrote the manuscript and H.H. revised it in detail. All authors have read and agreed to the published version of the manuscript.
Funding
This research was funded by Ministry of Education of Humanities and Social Science project, China, grant number 19YJCZH148, and supported by major scientific research project of Shaanxi Provincial Department of Education, grant number 20JZ089 and The APC was funded by 19YJCZH148.
Institutional Review Board Statement
Not applicable.
Informed Consent Statement
Not applicable.
Data Availability Statement
The dataset is download from http://data.drcnet.com.cn/ (accessed on 20 June 2020).
Conflicts of Interest
The authors declare no conflict of interest.
References
- Dai, W.L. The Crisis of Neo-liberalism and Its Trend in the Trump Era. Fudan Am. Rev. 2020, 1, 93–113, 174. [Google Scholar]
- Lin, Y.F. Economics in the New Era of China. Theory Stud. Explor. 2020, 1, 9–12. [Google Scholar]
- Ye, L.; Li, Y.P.; Liang, W.H.; Zhang, H.D. Correlation and Ripple Effect of Agriculture Sector in Hainan Province. Chin. J. Trop. Agric. 2017, 37, 82–87. [Google Scholar]
- Chen, X.; Zhu, J.; Guoping, L.I. Regional Disparity and Influencing Factors of Industrial Co-Agglomeration in Chinese Manufacturing. Econ. Geogr. 2018, 38, 104–110. [Google Scholar]
- Chen, X.; Zhu, J.H. The effect of manufacturing industry affiliation on inter-industry synergistic agglomeration. Soc. Sci. Front 2018, 38, 104–110. [Google Scholar]
- He, D.W.; Hu, X.P. A Study of Correlation Effect and Ripple Effect of Real Estate Industry—Based on the Positive Analysis of Input—Output Tables in China. Rev. Ind. Econ. 2015, 2, 17–27. [Google Scholar]
- Wei, M.X.; Wang, L.; Yuan, L.I. The Industrial Association and Spreading Effects Resulting from Modern Logistics Industry. J. Bus. Econ. 2009, 12, 15–21. (In Chinese) [Google Scholar]
- Hu, R.C.; Huang, X.L.; Chen, L.M. Dynamic Effects of Financial Services Industry on the Optimization of Industrial Structure in Hunan. Theory Pract. Financ. Econ. 2012, 33, 22–26. [Google Scholar]
- Chen, J.; Wang, Y.Z. Industry Linkages and Spatial Distribution of Producer Services—An Analysis Based on Urban Panel Data Spatial Econometrics. Econ. Surv. 2016, 33, 96–101. [Google Scholar]
- Dai, J.; Sun, D.; Zhang, X. Spatial Pattern of Regional Cultural Industry Development in China. Econ. Geogr. 2018, 9, 122–129. [Google Scholar]
- Zhou, M. Study on the correlation effect of information industry in Zhejiang Province. Res. Financ. Econ. Issues 2016, S1, 18–22. [Google Scholar]
- Kunimitsu, Y.; Takahashi, K.; Furubayashi, T.; Nakata, T. Economic Ripple Effects of Bioethanol Production in ASEAN Countries: Application of Inter-regional Input-Output Analysis. Jpn. Agric. Res. Q. JARQ 2013, 47, 307–317. [Google Scholar] [CrossRef][Green Version]
- Wang, S.L. Study on the industrial linkage and industrial ripple effect of financial industry in Zhejiang Province. Manag. Adm. 2014, 12, 86–88. [Google Scholar]
- Lian, F.; Zhou, G.F. Economic Relevance, Knowledge Association and Regional Economic Growth—On the influence of government public service. J. Technol. Econ. Manag. 2018, 7, 91–95. [Google Scholar]
- Zhang, R.Y. Multidimensional Measurement and Empirical Research on Comprehensive Extraversion of Regional Economy. J. North China Univ. Water Resour. Electr. Power Soc. Sci. Ed. 2018, 34, 42–48. [Google Scholar]
- Sheng, G.Y. Multiple Correlation Effect of Regional Economic Growth and Its Empirical Test. Economist 2018, 4, 34–41. [Google Scholar]
- Antonakakis, N.; Badinger, H. Economic growth, volatility, and cross-country spillovers: New evidence for the G7 countries. Econ. Model. 2016, 52, 352–365. [Google Scholar] [CrossRef]
- Xu, Y.; Li, A. The relationship between innovative human capital and interprovincial economic growth based on panel data model and spatial econometrics. J. Comput. Appl. Math. 2020, 365, 112381. [Google Scholar] [CrossRef]
- Zhen, H.F.; Hu, H.; Xie, N.; Zhu, Y.Q.; Wang, Y. The heterogeneous influence of economic growth on environmental pollution: Evidence from municipal data of China. Pet. Sci. 2020, 17, 1180–1193. [Google Scholar]
- Zhang, W.L.; Ye, X.Y.; Li, D.; Fu, J.B.; Wu, M.H. Network Association, Spillover Effect and China’s Regional Economic Growth Based on Tencent’s Location Big data. Sci. Geogr. Sin. 2019, 39, 1371–1377. (In Chinese) [Google Scholar]
- Gao, J. An empirical analysis of the relationship between population size, spatial spillover and urban efficiency. Stat. Decis. 2018, 34, 90–94. [Google Scholar]
- Yang, H.C. Spatial Spillover Effects of Regional Economic Growth in China and Asean Countries. Ph.D. Thesis, Guangxi University, Nanning, Guangxi, China, 2017. [Google Scholar]
- Hu, S.; Li, H.; Fan, P.; Xiao, G. Spatial Spillover Effects of Innovative Outputs of University and Its Impacts on Regional Economic Growth of China: Based on Spatial Econometrics Analysis of Provincial Data. Sci. Geogr. Sin. 2016, 36, 1767–1776. [Google Scholar]
- Su, D.N.; Sheng, B.; Shao, C.D. National Value Chain, Marketization and Spillover Effect of Economic Growth. J. World Econ. 2019, 42, 143–168. [Google Scholar]
- Zhou, Z.Y. Analysis of how to construct a regional industry-related economic distance model. Product. Res. 2015, 8, 51–54. [Google Scholar]
- Li, F. Measure of Industrial Linkage and its Application. J. Shanxi Univ. Financ. Econ. 2007, 11, 34–39. [Google Scholar]
- Zhou, H.; Qu, S.; Yang, X.; Yuan, Q. Regional Credit, Technological Innovation, and Economic Growth in China: A Spatial Panel Analysis. Discret. Dyn. Nat. Soc. 2020. [Google Scholar] [CrossRef]
- Zhang, W.L. Hypothesis Testing and Interpretation on Regional Economic Growth Club Convergence. Sci. Geogr. Sin. 2018, 38, 258–263. [Google Scholar] [CrossRef]
- Zhao, W.; Li, Z.Y.; Yang, H.; Cai, B.B.; Yang, M.M.; Ding, R.Y.; Tan, C.L. The Regional Economic Growth in Spatial Clubs Convergence Checkout and Influence Factors Research. J. Henan Univ. Nat. Sci. 2018, 48, 505–513, 541. [Google Scholar]


Publisher’s Note: MDPI stays neutral with regard to jurisdictional claims in published maps and institutional affiliations. |
© 2021 by the authors. Licensee MDPI, Basel, Switzerland. This article is an open access article distributed under the terms and conditions of the Creative Commons Attribution (CC BY) license (https://creativecommons.org/licenses/by/4.0/).