Article

Optimizing the Power Generation of a Wind Farm in Low Wind Speed Regions

Faculty of Engineering & IT, British University in Dubai, Dubai 345015, United Arab Emirates
*
Author to whom correspondence should be addressed.
Sustainability 2021, 13(9), 5110; https://doi.org/10.3390/su13095110
Submission received: 26 March 2021 / Revised: 22 April 2021 / Accepted: 26 April 2021 / Published: 2 May 2021

Abstract

:
The aim of this research is to optimize the power generation of a wind farm (WF) in order to maximize the energy output, especially in low wind speeds regions such as UAE. A new WF was proposed to be built in Sir Bani Yas Island in the UAE. This project was chosen to act as the main case configuration for this research. Four configuration parameters were proposed and assessed as follows: (1) inserting smaller turbines between the original larger main turbines; (2) changing the spacing between the turbines; (3) substituting new higher efficiency turbines in place of the existing ones; (4) moving the WFs to completely new locations in different emirates within the UAE. Through using the WindFarm simulation software, the impact of these four strategies was analyzed and calculated. The main finding of this research indicates that introducing more efficient WT units has a great impact in that it can increase output by 24.5%. Bearing in mind that the UAE has a vision for a renewable energy, as well as the Gulf Cooperation Council (GCC) countries, this paper will draw a novel recommendation to optimize the wind power generation in this low-speed region.

1. Introduction

There is growing interest in developing wind farms around the world, especially in those countries which are blessed with abundant wind resources. According to International Energy Agency, the global energy demand rose by 2.3% in 2018 [1]. In the last three decades, the UAE has been well known for its high economic and financial development; owing to the fact that this country has achieved a fast-economic growth, it is a country that needs to increase its consumption of green energy to reduce CO2 emissions [2]. Renewable energy is considered a clean alternative type energy compared to fossil-based energy. It is naturally replenished and has many types, including solar, wind, geothermal, biomass and more. Although wind power has been utilized by humans for more than 3000 years, the use of wind power for electricity production has existed for only 120 years [3]. The conversion of wind energy into electricity can be realized by grouping wind turbines (WTs) to form wind farms (WFs) [4].
It is believed that there is always room for improvement when it comes to the efficiency of WFs by allowing more effective harvesting of the available energy and reducing the fatigue loads on the turbines [5].
The UAE aims to achieve a sustainable infrastructure for generating power through renewable energy [6]. The UAE is rapidly adopting renewable energy as a viable solution to meet its growing electricity demands, and to address long-term resource security. The UAE recently built the first large-scale WFs in the Gulf Cooperation Council (GCC) region. The deployment of wind energy conversion systems occurred in the UAE with the installation of a large 850 kW Vestas wind turbine on Sir Bani Yas Island, which is located 250 km southwest of Abu Dhabi. The turbine is connected to the island’s grid [7]. Consequently, the aim of this research is to optimize the power generation of a WF in the UAE in order to maximize the energy output. In order to achieve this overall aim, these objectives will be followed: (1) to thoroughly review the literature to set an understanding of the current status of wind energy; (2) to select a wind farm in the UAE to act as a case study; (3) to validate the selected software; (4) to propose several strategies in order to optimize the power generation; (5) to compare the results against the base case; (6) to draw future design recommendations.

2. Literature Review

2.1. Global Wind Farm Power Generation

Significantly, wind energy is considered to be a renewable source of energy in a global context of increasing social concerns about climate change and energy supply. From the point of view of global capacity, according to statistics from the Global Wind Energy Council (GWEC), the global annual installed wind capacities for the past seventeen years are as illustrated in Figure 1. According to the World Wind Energy Association (WWEA), wind power capacity worldwide reaches 597 GW, with 50,1 GW added in 2018 and 50,100 megawatts were added in the year 2018, slightly less than in 2017 [8].
Wind energy is estimated to supply around 40% of Denmark’s electricity demand, and between 20% to 30% of demand in the cases of Portugal, Ireland, and Spain. Denmark has an even more ambitious target of 50% by 2020 [10]. Previous studies have identified many factors that can optimize power generation when it comes to WFs. Unrestricted WF layout optimization has been investigated in terms of key factors that can influence power generation. The authors of the study stated that their optimized WF layout resulted in an increased energy production of 30.19%, compared with their baseline case. Moreover, by using an alternative selection of turbines (in terms of their rotor diameters), they managed to increase the net power generation by 15.54% [11]. Another interesting study attempted to maximize the power generated in accordance with constraints based on the number of turbines, turbine proximity to one another, and turbine interference. This study was able to achieve 10% extra power generation [12]. Consequently, the determination of WT layout patterns and distances between turbines are the key aspects of WF design. A study conducted in Hong Kong reported that the optimum WT separation is 14.5 D “direction” in terms of the prevailing wind direction and 11.0 D “direction” in terms of the cross-wind direction [13]. The type of the turbine plays a significant role, in that new WTs in the market are markedly improved compared with the old ones in terms of reducing transmission losses. A study in Taiwan indicated that by changing only the material of the cables used in WFs and improving it might help to achieve 5% increased production [14]. This means that if highly efficient WTs are implemented, better net power production will be achieved.

2.2. Wind Farm Status in GCC Countries

On the east of the Arabian Peninsula, a study in Kuwait stated that changing the characteristics or the model of the WT can lead to a significant increase in productivity. In this study, wind energy at different heights was estimated using Weibull parameters. The maximum power density was found at a height of 30 m. The wind power density varied between 130 and 275 W/m2, with a 70% increase from standard height, indicating a fair potential for wind energy, especially in the northern part of Kuwait [15]. In the same country, researchers explored the feasibility of erecting a WF with a capacity of 120 MW, in a suitable location. The results showed that the WF should be capable of producing a net annual energy production (AEP) of 322 GWh [16]. In the Sultanate of Oman there have been some attempts to build a WF, with the UAE helping to fund a USA Dollar (USD) 125 m WF in Oman’s southern Dhofar governorate. This will be the largest renewable project in the Sultanate. However, this project has been delayed and will start operations in 2020. Due to the climate in the UAE, only solar power is commonly considered. However, wind is definitely an additional option that ought not to be dismissed. With 13.4% of the year suitable for full load wind operations in the UAE, it might not be the main renewable energy source, but wind energy could be used as a support for other energy resources [17]. Apart from the Sir Bani Yas WF, which will be highlighted in depth in this study, a recently published paper studied the utilization of different WTs in a 50 MW Wind Farm (WF) tested using annual hourly values of wind speed in the Emirate of Sharjah in the United Arab Emirates. An optimization algorithm was developed in order to calculate the power output from sixteen different types of wind turbine, with various capacities, using the IPP optimization software [18]. In Saudi Arabia, the economic feasibility of developing a 15 MW WF at Taif in the western Province of the KSA has been studied and analyzed using long-term wind speed data and involving different combinations of 600 kW; they concluded their study by giving information about the importance of the WF location, and recommending that Taif is a suitable candidate for harvesting wind power in Saudi Arabia [19].

2.3. Potential Factors Affecting Wind Turbine Power Generation

Interestingly, one study [20] provided a generic model for optimizing in-land wind farm layout, where they used an optimization model that considered the WF radius and WT distance constraints. This study stressed the point that WTs can be affected by being in the wake of other WTs, and that this is a major factor with regard to maximizing the power generation of WFs. Further, a study [21] of WF design stressed that the first task is to define the constraints on the development. These may include the maximum installed capacity, the site boundaries, environmental constraints, the location of noise-sensitive dwellings and assessment criteria, the location of visually sensitive viewpoints, and WT minimum spacing, as indicated by the turbine supplier. Another important study [22] pointed out that, in order to optimize production, different layouts should be thoroughly studied to maximize the energy output. Appreciably, WFs require significant land resources to separate the wind turbines to minimize the impact of the adjacent WT wakes. Yet, many researchers [23] have emphasized that solutions should be considered in terms of the large accumulated footprint of wind turbines, in that this reduces the area available to wildlife or agriculture. Such density should be considered when it comes to placing the maximum number of WTs in a smaller area, especially if WFs are comprised of horizontal-axis wind turbines. The WT’s age can also be a factor, as this study suggests [24]. The output of 282 WFs was accurately estimated using public wind speed data. It was found that the onshore WF output falls by 16% per decade. Consequently, changing the WTs might increase power generation.

2.4. State of Arts

For decades, researchers have been finding ways to optimize the wind energy by repositioning the wind turbines in wind farms [25]. In order to identify the gap in the knowledge, the literature was thoroughly reviewed. Table 1 summarizes—but is not limited to—the most significant studies in the area. The novelty of this research lays in investigating a wide range of strategies with the ultimate aim of achieving maximum power generation from wind energy, taking into consideration the site limitations within the UAE. Exploiting wind energy in the gulf region in general and the UAE in particular is relatively new. Thus, there is a shortage of published literature in GCC countries. This research will add to the body of knowledge which will help wind energy stakeholders optimize wind energy generation not only in UAE, but also in countries with similar characteristics in terms of wind resources and geographical layout.

2.5. Overview of the Sir Bani Yas Wind Farm

Masdar is a planned city project in Abu Dhabi, in the UAE. Both Masdar and Abu Dhabi’s Tourism Development and Investment Company signed a framework agreement in 2008 to develop renewable energy on Sir Bani Yas Island [35]. The first phase will see the development of an onshore WF with a targeted capacity of 28.8 MW. The project’s conceptual design and technical evaluation was completed in 2010. The purpose of the project was to harness the renewable resource of wind energy, and thereby displace the equivalent electricity produced through the use of fossil fuels, which currently dominates the Abu Dhabi grid [36]. The project is a green field project in the Sir Bani Island of the UAE, and involves the installation and operation of 16 X 1800 kW wind turbine generators (V100-1.8 MW @ 50 Hz VCS). It was expected that, when completed, the project will generate 55,900 MWh per year and with this it will displace electricity otherwise generated by the use of fossil fuels, which eventually will lead to an emission reduction in CO2e of 19,872 t per year [37].

2.6. Sir Bani Yas’ Weather

Sir Bani Yas is located at a latitude/longitude of 24°19′33″ N, 52°36′04″ E with an altitude of 102 m and is a natural island located 250 km southwest of Abu Dhabi city. It lies 9 km offshore from Jebel Dhanna and is 17.5 km from north to south and 9 km from east to west, making it the largest natural island in the United Arab Emirates. The months of June through to September are generally extremely hot and humid, with maximum temperatures averaging above 38 °C. The cooler season is from November to March, with the weather ranging between moderately hot to mild. This period also sees dense fog on some days. On average, the warmest time of year is generally mid-July, where highs are regularly around 42.4 °C, with temperatures rarely dropping below 31.6 °C at night. The months with the lowest chance of significant precipitation in Sir Bani Yas Island are January, February, and then March. The least humid month is during May, with 26.3% relative humidity, while the most humid month is December, at an average of 56.6%. The wind in Sir Bani Yas Island is usually moderate. The windiest month is April, followed by June and February. April’s average wind speed of around 22.3 km/h is considered “a moderate breeze”. The most sustained winds (the highest speed for the day lasting more than a few moments) tend to occur in mid-March, when the average highest sustained speeds reach 40.9 km/h, which is considered a strong breeze [38].

3. Methodology

3.1. Research Approach

Firstly, extensive data were collected with regard to the Sir Bani Yas project, especially from Masdar city [39]. Based on a search of the literature, four strategies were proposed in order to optimize the WF in terms of maximizing power generation. Each strategy consisted of three scenarios. These strategies were simulated using the WindFarm Simulation Software; the package was purchased in 2017 and included simulating the utilities, energy yield and optimization with professional license. The software consists of a set of real-time simulation applications designed to provide training in WF subsystems, as well as in WT parts and operation. The simulation software incorporates sophisticated algorithms that optimize any WF in terms of increased energy or reduced cost, subject to environmental and physical constraints, and includes fast constraint satisfaction [40]. This software has been adopted in many previous research publications, and has been tested for its accuracy and credibility. It has been shown to be an accurate and proven simulation tool for consulting purposes [37,41]. The actual measurements of weather data onsite were obtained from a weather station of the National Centre of Metrology in the UAE, which recorded the weather onsite for one year (2016–2017). The weather data were fed to the software, since the software does not have the integrated weather data for that particular location. In order to test the accuracy and validation of the software to ensure the proper function of it, the 16 WTs of the base case were simulated and the simulated predicted energy generation was obtained. The results were then compared to the expected energy generation of the base case project used, calculated in gigawatt hours (GWh) [42]. Figure 2 compares the simulated energy production to the data provided by Masdar. Noticeably, the total yield of the base case was calculated as 55.9 GWh, compared to the WindFarm simulated value of 53.5517 GWh, a difference of less than 4.2%. Therefore, it is considered that the software is reliable when it comes to simulating power generation. A previous study justified most of the discrepancy between the actual measures and that of the simulation tools, stating that this was due to the complexity of the built environment and the prevalence of large numbers of independent interacting variables, and noting that is difficult to achieve a totally accurate representation of a real-world building operation [43]. However, the technical limitation was the lack of a proper optimization model and proper simulation tool. This constraint was overcome by adopting various proposed strategies and using WindFarm Simulation Software.

3.2. Proposed Strategies

To simplify the tracking of the results, each scenario was given a symbol code. The base case wind farm was symbolized as “WF 1”. According to the literature reviewed earlier, and to fulfil the aim of this research, four strategies were proposed in order to optimize the power generation of the Sir Bani Yas WF. Strategy A is inserting smaller turbines between the larger main original turbines. This stage involves (1) inserting four small additional WTs in the back row of the base case. This is symbolized as “WF 2”; (2) inserting 4 additional WTs in the front row of the base case. This is symbolized as “WF 3”; (3) inserting 4 additional WTs in the middle row in a staggered arrangement. This is symbolized as “WF 4”. Strategy 2 (B) involves changing the spacing between the turbines. This stage involves (1) rearranging the WTs into 3 rows with a distance spacing of 300 m. This is symbolized as “WF 5”; (2) rearranging the WTs in 3 rows with a distance spacing of 400 m. This is symbolized as “WF 6”; (3) rearranging the WTs in 3 rows with a distance spacing of 500 m. This is symbolized as “WF 7”. Following this comes strategy C, which involves substituting new higher efficiency turbines in place of the existing ones. For detailed specification comparisons between the new WT models and the one used in the base case, see Table 2. This strategy involves (1) locating 9 WTs in the front row. This is symbolized as “WF 8”; (2) locating 9 WTs in three staggered rows. This is symbolized as “WF 9”; (3) locating 9 WTs in two rows with a distance spacing of 600 m. This is symbolized as “WF 10”. To further investigate the factor of the site’s topographic conditions, an attempt was made to relocate the best WF in the first three stages to a different site context. In strategy D, authors examined moving the WF with the highest energy yield to a new location in a different emirate within the UAE named Al Fujairah; and this is referred as “WF 11”. These four strategies emerged from the literature review in order to enhance the wind power generation in low-speed regions.

3.3. Mathematical Model Set-Up

The following equations [44] were integrated/built-in to the WindFarm Software, and helped to assess the scenarios suggested. Firstly, the annual energy yield of a wind turbine can be calculated by:
( E a ) t u r b i n e = T a U c i U c o P ( U ) · f r e q ( U ) d U
where, Ta is the total time per year, and Uci and Uco are the cut-in and cut-out wind speeds, respectively.
In order to calculate the annual energy yield of the WF, all the scenarios have to be taken into account, as can be seen in the following equation:
( E a ) f a r m = T a 0 ° 360 ° U c i U c o ( i = 1 N P i ( U , α ) ) . f r e q ( U , α )   d U d α
In this equation, Pi(U,α) is the electrical power of the i-th WT under the scenario in which the undisturbed wind speed is U and the wind direction is α. N is the total number of turbines in the WF. Ta is the total time per year.
The distance, d, is the distance between the two WTs projected onto the wind direction and can be computed using the following equation:
d i j = | ( x j x i ) cos θ + ( y j y i ) sin θ
Here, i refers to the index of the upstream WT producing the wake, and j refers to the index of the downstream WT. θ refers to wind direction. Multiple wake interactions are all to be considered in the same way, regardless of the type of wake interaction.

4. Results and Findings

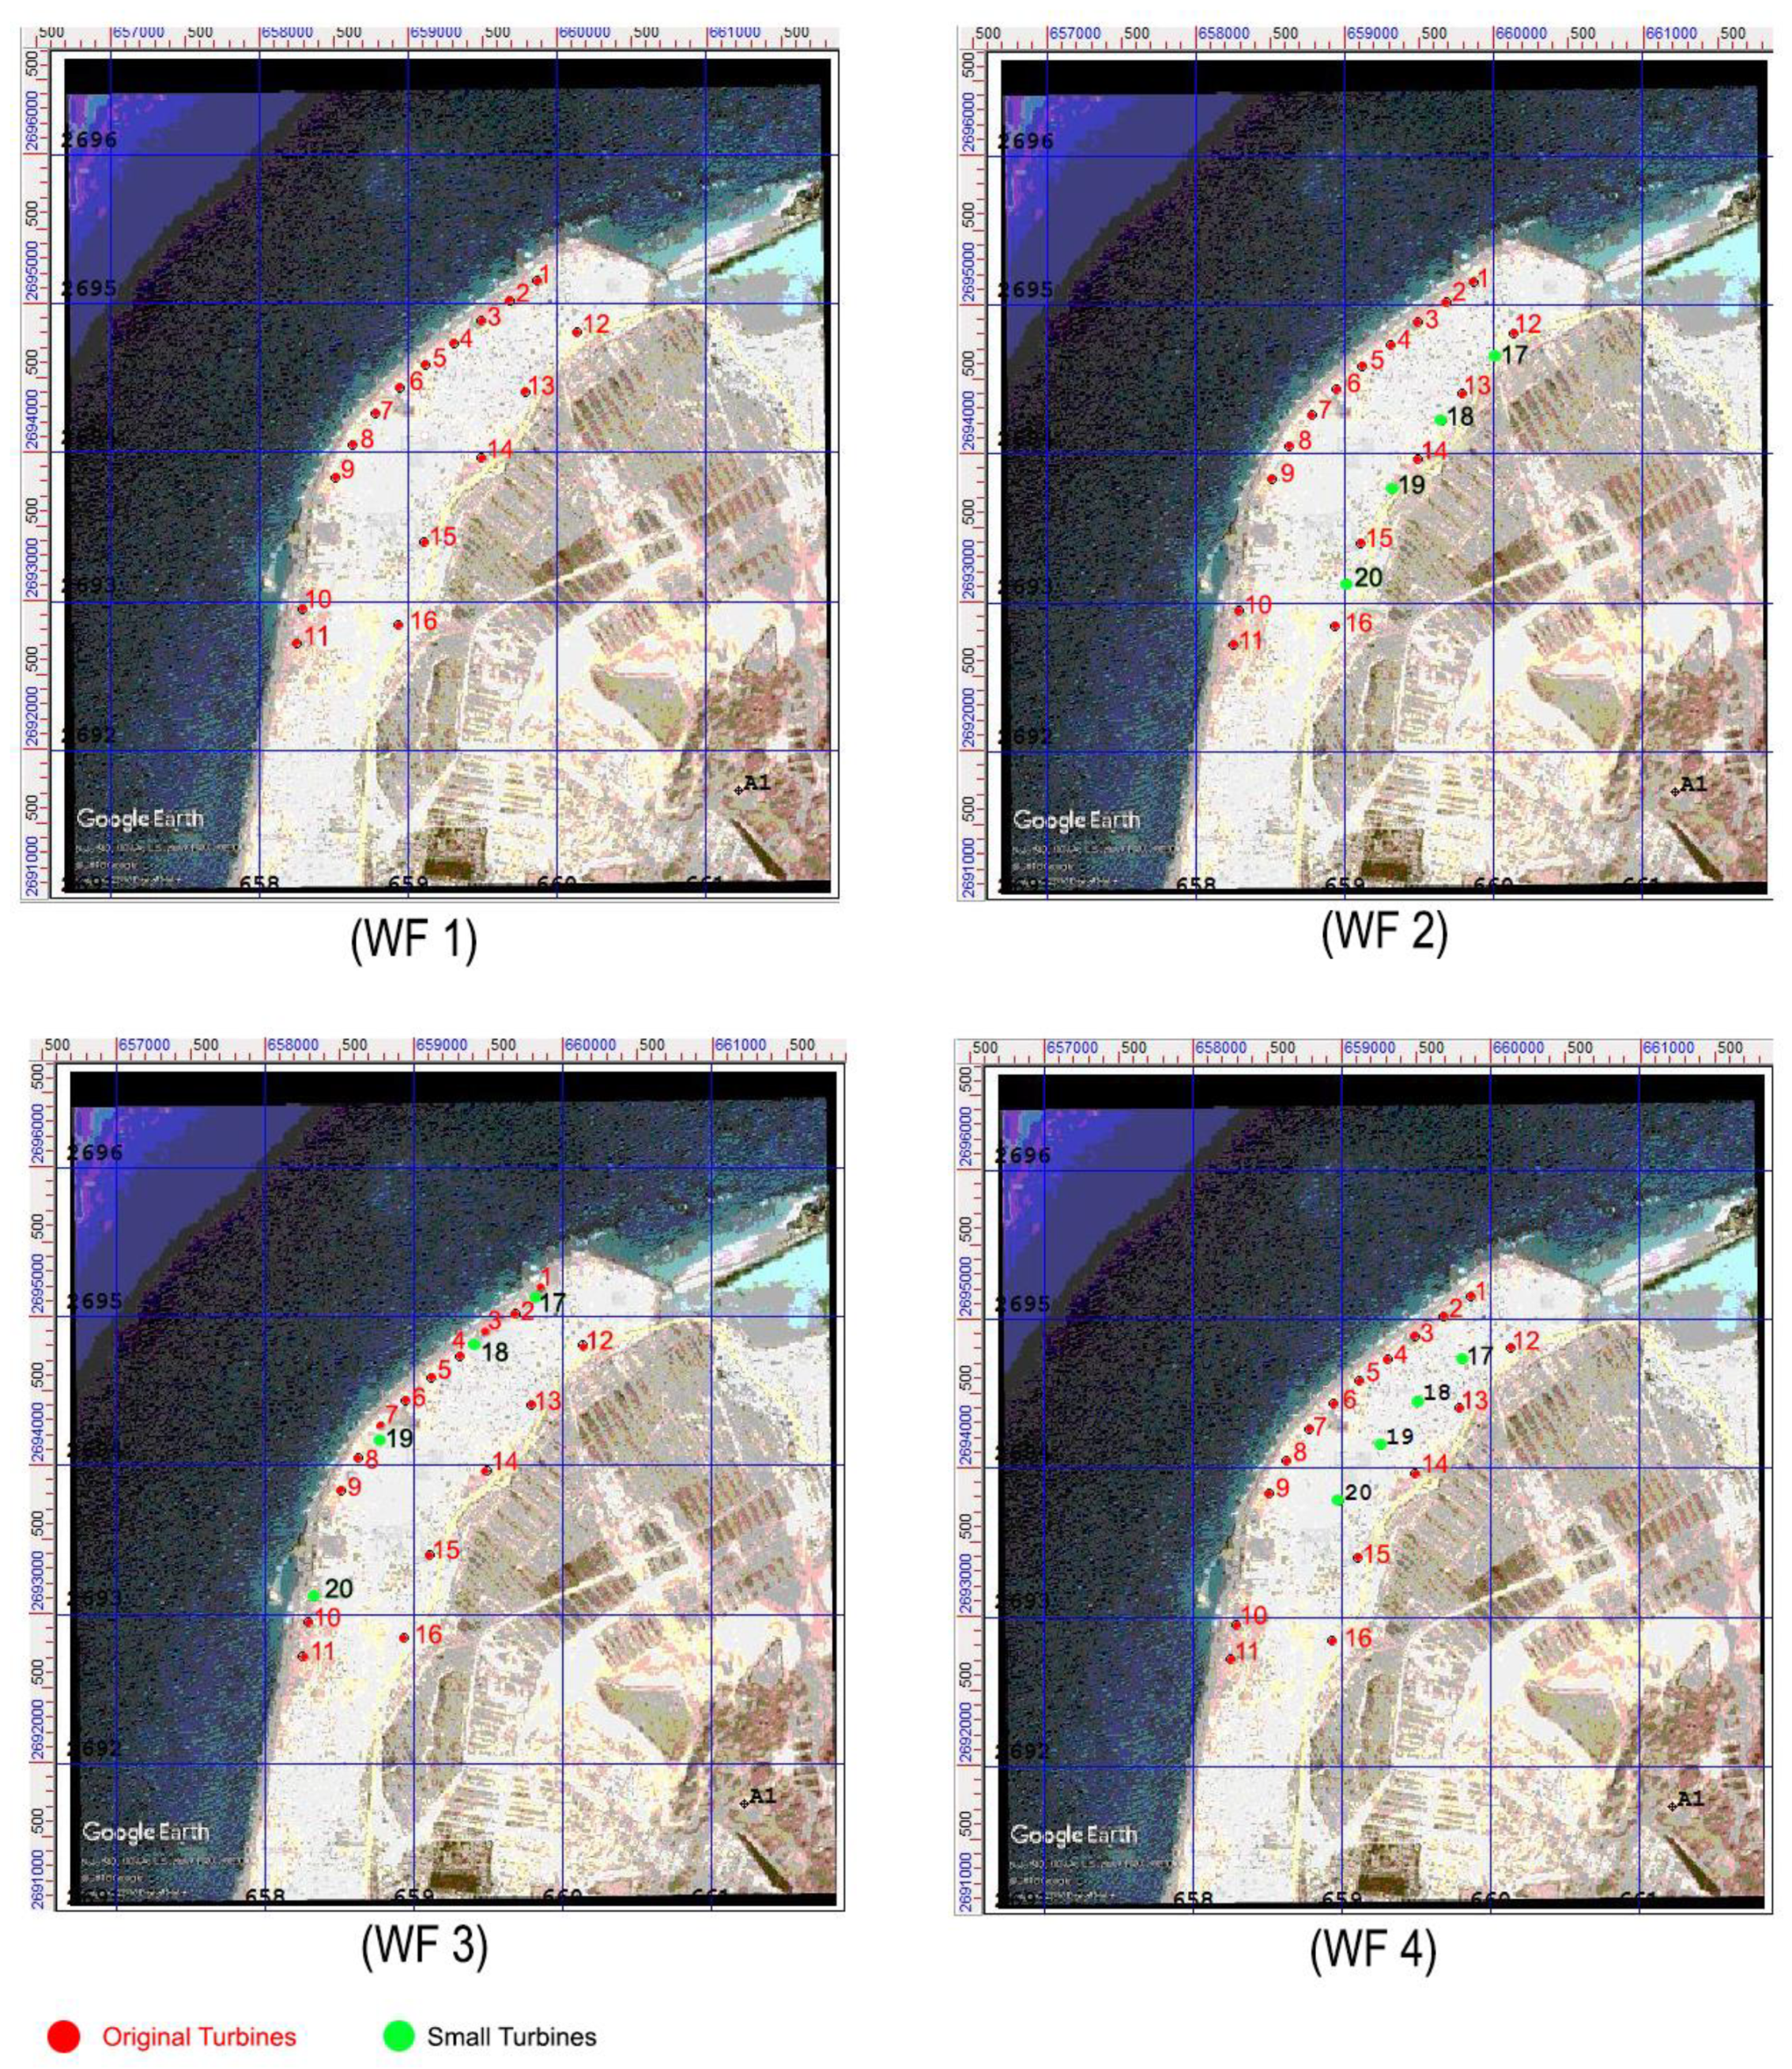
4.1. Strategy A: Inserting Smaller Turbines between the Original Turbines

Table 2 shows the 16 WT model specifications of the base case symbolized as (I), and the specifications of the four small WTs symbolized as (II), then higher capacity turbines as (III). Three locations were suggested for those four small WTs (see Figure 3). The first step was the addition of four small WTs in the back row of the base case (WF 2). The improvement in terms of power generation as a result of this strategy was satisfactory, as the power generated increased by 2.1844 GWh. Although the expected power generation was claimed by the company manufacturer to be 55.9 GWh, the simulation shows that this varied when they were placed in the back row, in that the total yield was recorded as 0.5905 GWh, 0.5905 GWh, 0.6079 GWh, and 0.6367 GWh, respectively. When those additional four WTs were moved to the front row of the base case (WF 3) there was a minimal difference compared with (WF 2), an increase of only 0.08 GWh. The total yield for the small WTs was 0.6652 GWh, 0.6442 GWh, 0.6410 GWh and 0.7195 GWh. Unexpectedly, when these four WTs were moved to the middle row with a staggered arrangement (WF 4), it resulted in a weaker performance compared to the previous scenarios of back and front; yet, it was better than the base case by 1.8496 GWh. By reviewing Figure 4, which compares the wind direction annually of the energy yield graph of WF 2, WF 3 and WF 4, it can be seen that the differences are small and similar to the WT energy yield of the latter. Moreover, the results obtained using the WindFarm software (Figure 5) shows that the red line “basic” is the expected power generation of the WT without topographic and wake effects. On the other hand, the blue lines “net” is the performance, including the effect of topographic and wake effects. The wind direction of all three scenarios was identical in that, as a result of reviewing the layout, it can be seen that the topography of the selected site for the WF in Sir Bani Yas Island is almost flat, and that there are no significant barriers except for the hill behind the WF. This hill is far away, and since the prevailing wind comes from the North West (see Figure 12), it could be argued that the WF receives the wind free of obstructions. To link the performance of “Basic” and “Net” see Table 3, which summarizes the wake loss of each WT in all WFs.

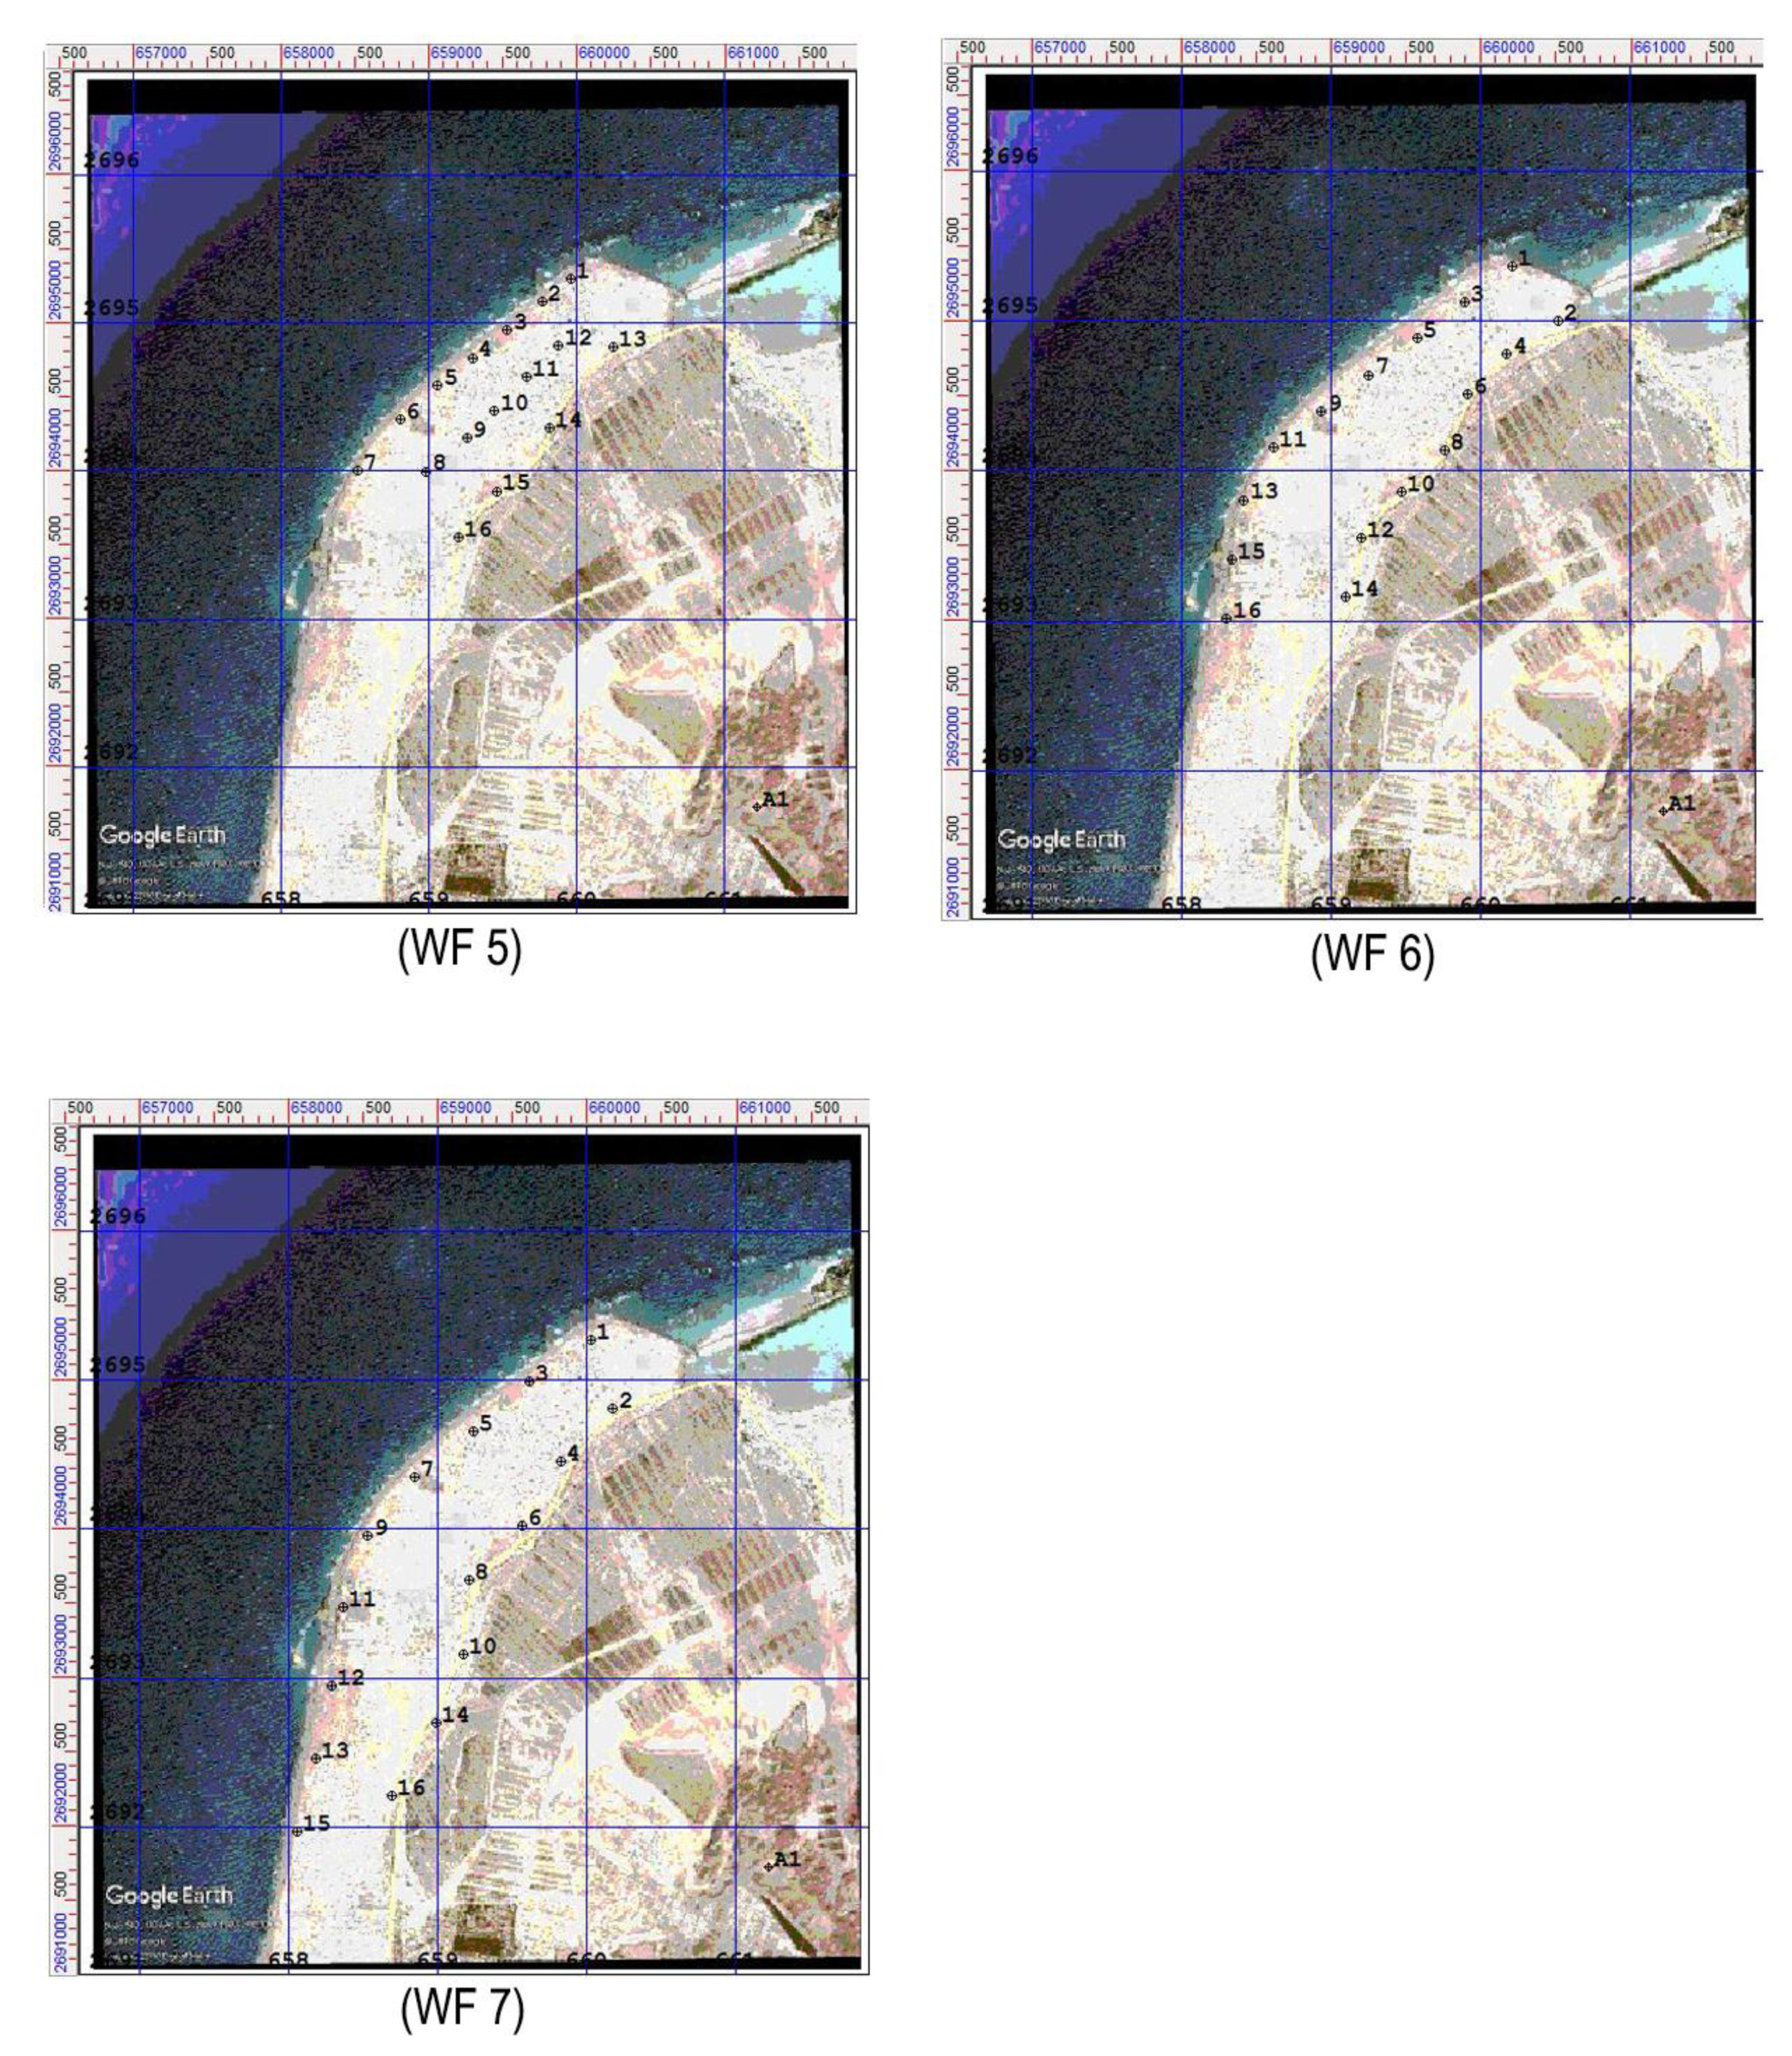
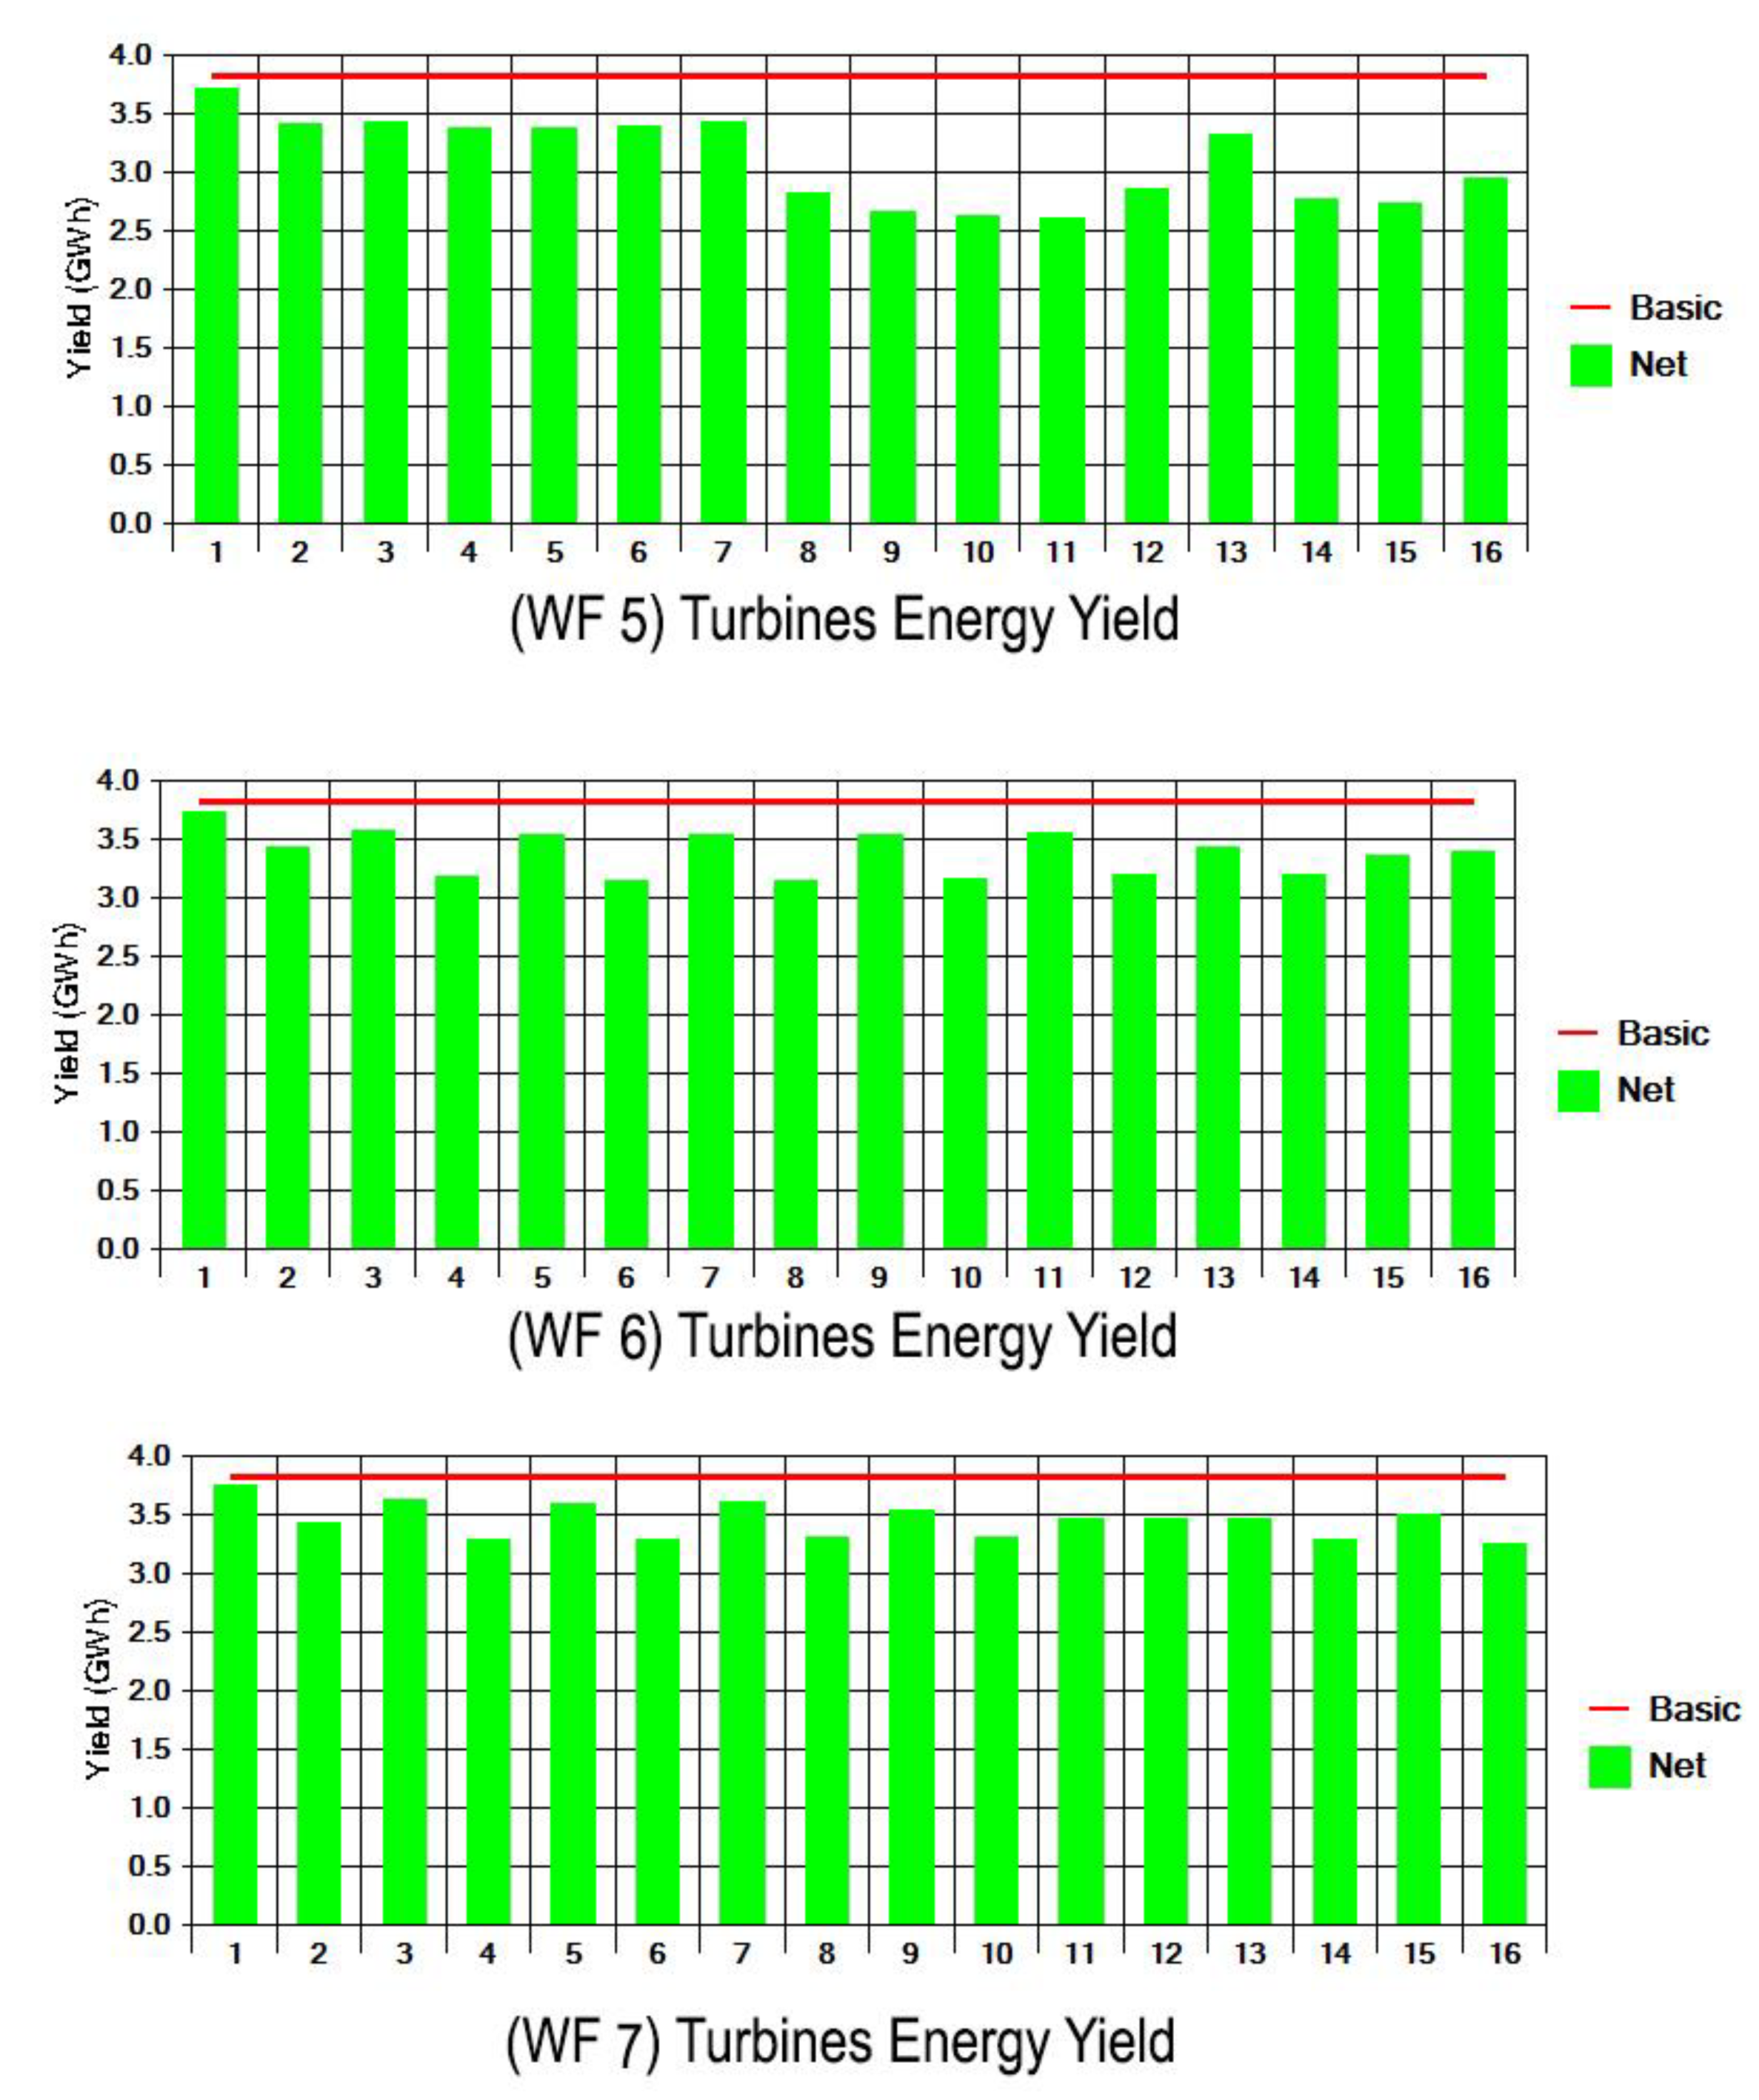
4.2. Strategy B: Changing the Spacing between the Turbines

The transformation of the WT layout pattern in terms of distance spacing was carefully studied for the sixteen WTs. The first suggestion (see Figure 6) was to minimize the distance between adjacent WTs to 300 m (WF 5) and the distance between the rows to 300 m. It was clear that the power generation of the 16 WTs was reduced by 4.1436 GWh as a result. By returning to the rule suggested by the Renewable Energy Annex 1 Wind Energy: Spacing of Turbines (2018) [45], which states that WTs need to be positioned so that the distances between them range from three to ten rotor diameters (this translates to 180–600 m for a WF using 60 m diameter rotors) depending on the individual circumstances of the site. The WF 5 results indicate that a distance spacing of 300 m was not optimal for the turbines used. It was agreed initially that the spacing represented a compromise between compactness and the need for adequate separation to lessen energy loss due to wind shadowing from upstream machines. Thus, authors maintained a distance of three rows between each row, varying between 500 m and 800 m with 400 m between one WT and another (WF 6). A slight change appeared, and the sixteen WTs generated a total of 54.038 GWh. To further investigate the distance of 600 m between each WT, and another with a distance of 500 m to 700 m between rows (WF 7), the sixteen WTs improved by only 2.74% from the base case. Such a small percentage was not sufficiently justifiable to expand further, as all shows a minimal improvement. Figure 7 compares the wind direction annually in terms of an energy yield graph for WF 5, WF 6 and WF 7, by reviewing the Sir Bani Yas wind patterns (Figure 12), and it is obvious that the generation starts to decline as a result of winds in the North East. Generation then starts to increase with winds from the South West until it reaches a peak with winds from the North West (270–360 degrees).
Figure 7 illustrates the wind direction and annual energy yield graph for WF 5, WF 6 and WF 7. Both Figure 7 and Figure 8 were possibly substandard and that helped to consider changing the WT models into more efficient ones. One way to improve the efficiency of a WF is to minimize the losses that occur from WTs that are caught in the wake of other WTs. Therefore, the next section systematically replaces the current WTs of Sir Bani Yas with a new pattern.

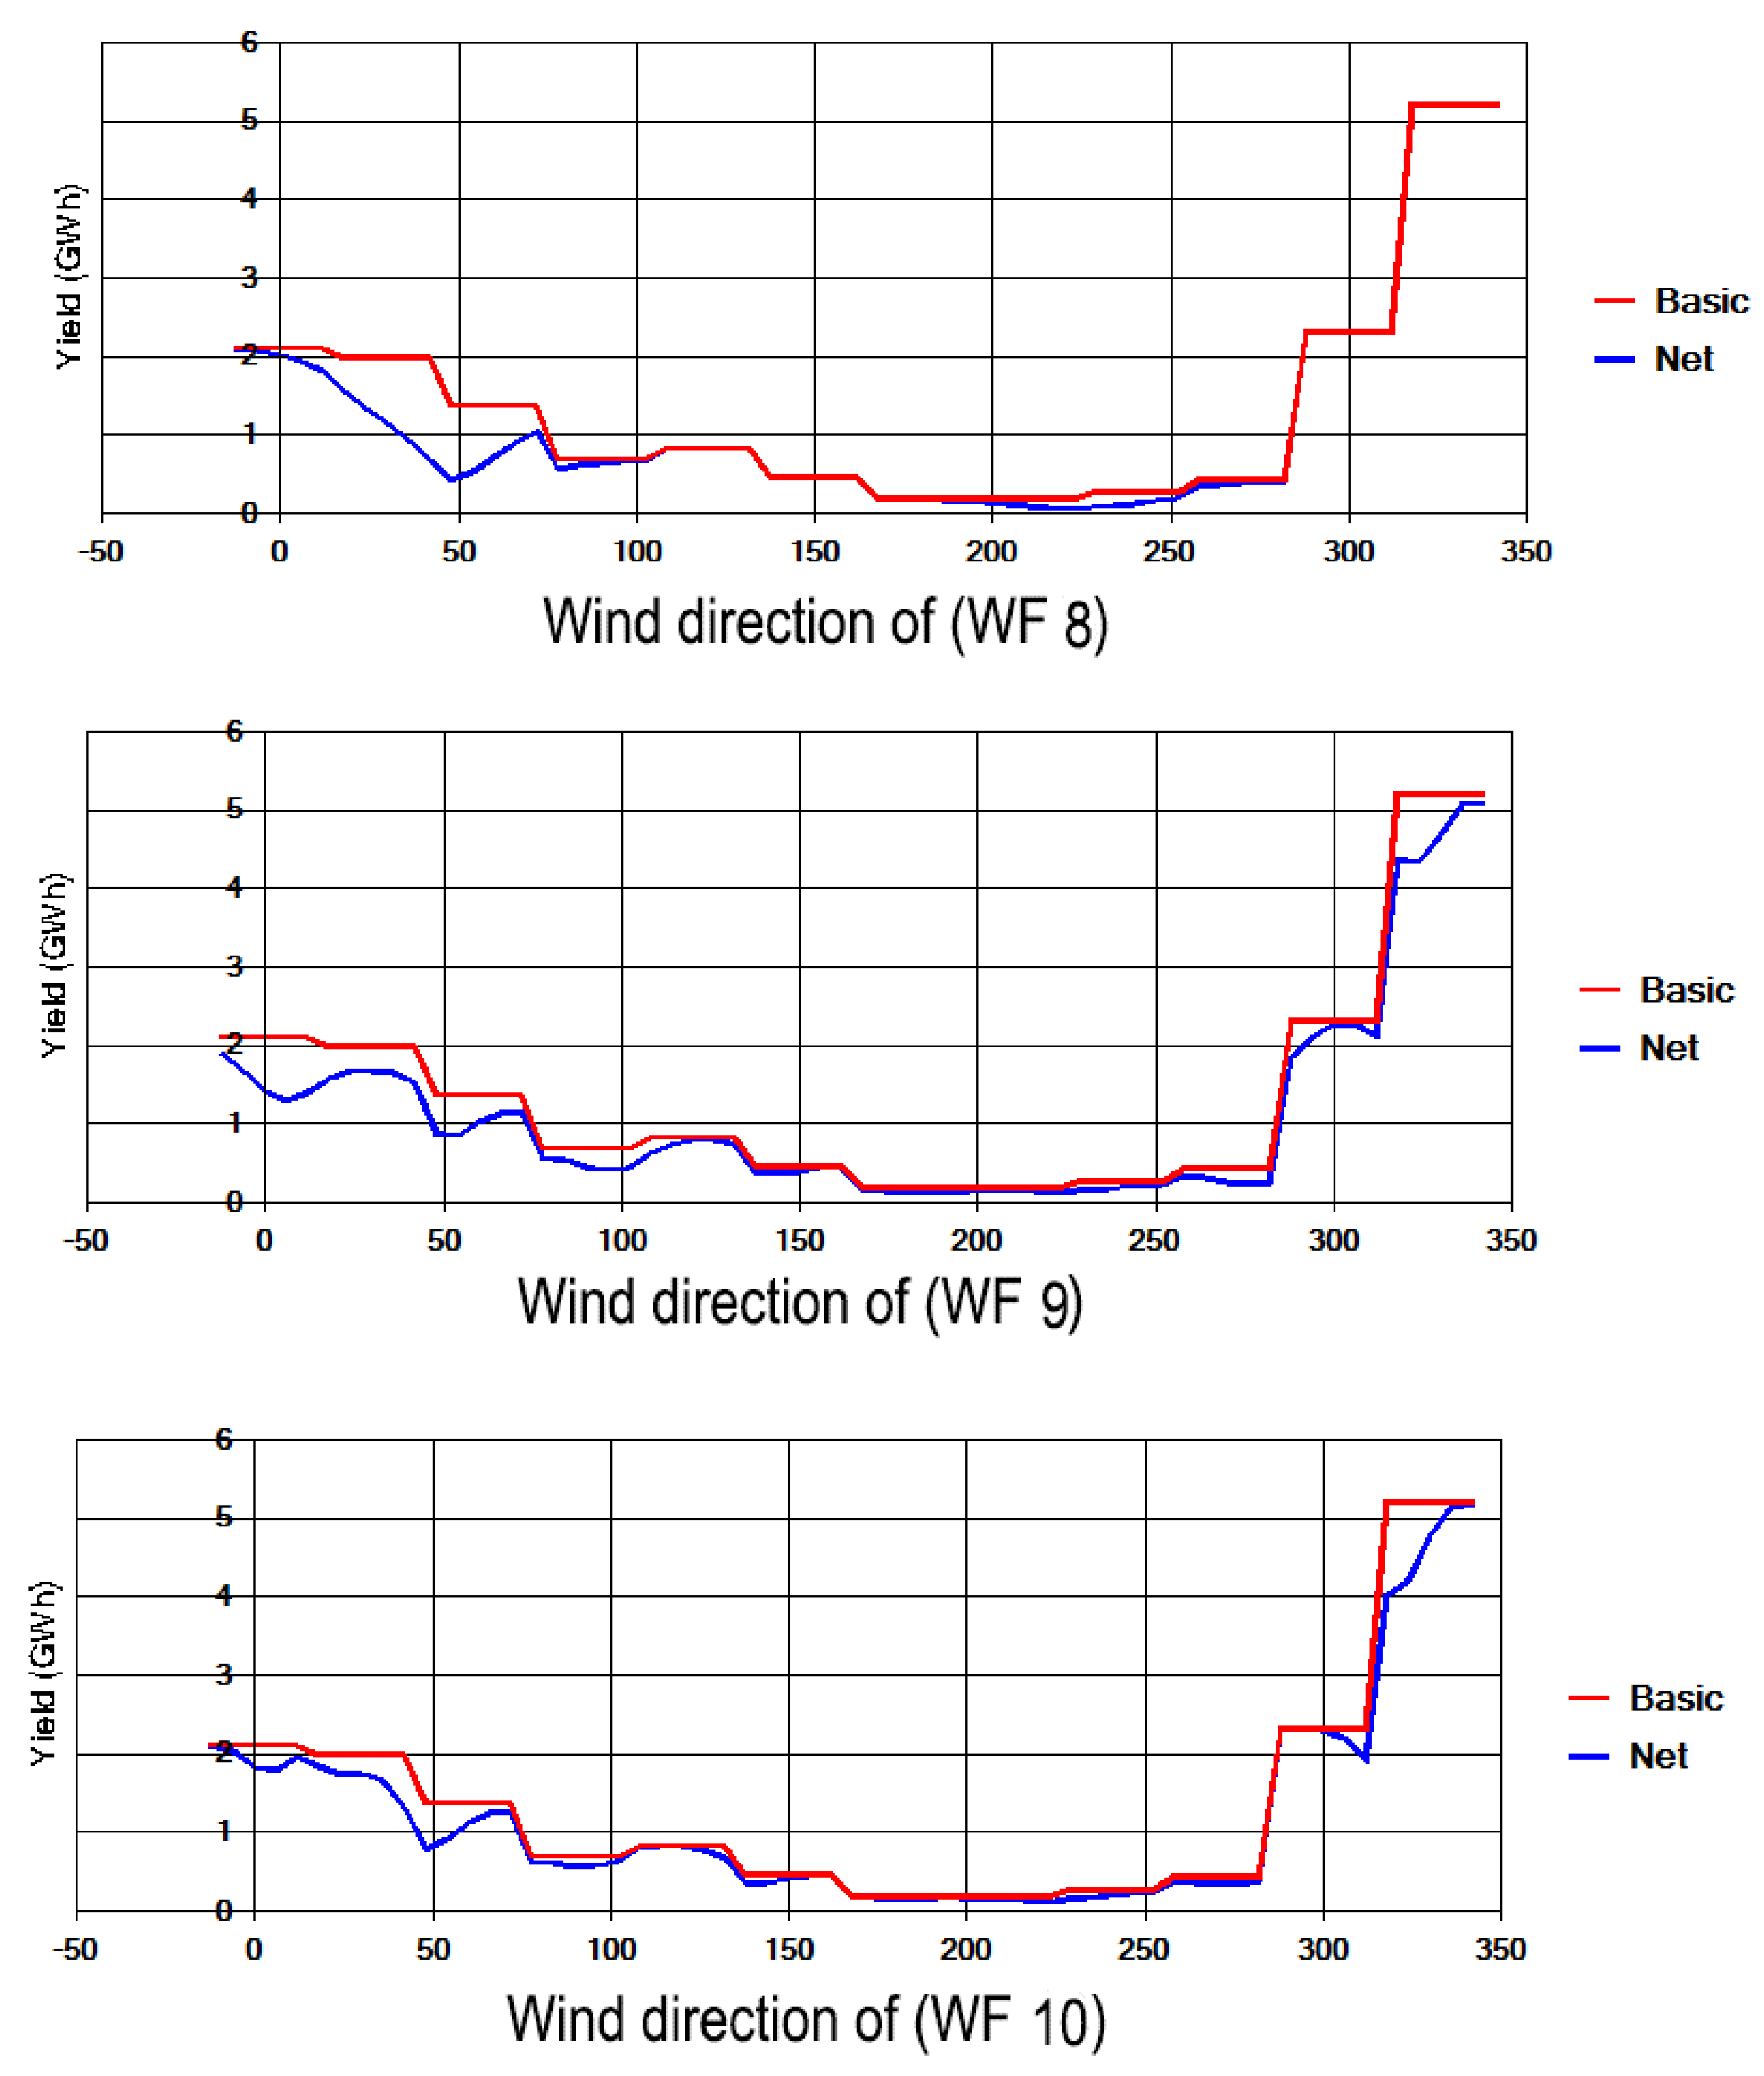
4.3. Strategy C: Substituting New Higher Efficiency Turbines in Place of the Existing Ones

Choosing WTs that best match wind profiles is vital, especially nowadays when manufacturers compete to design WTs with higher efficiency and less cost. This process needs to be based on an analysis of the stochastic element of wind for each location, and the potential energy output of each WT needs to be considered. See Figure 9 for the individual WT locations. The procedure started by reviewing each WT type in terms of the unique power curve, which represents the WT’s optimal wind speed and considering the range of wind speeds that can drive the turbine. By comparing the mean wind speed of a location with the power curve, one can obtain a rough estimate of the potential power production at that particular location for that WT. The authors believe that, in order to reduce a WF’s footprint while still maintaining the total energy output, the 16 WTs of the base case can be replaced with 9 WTs of higher capacity, WT C in Table 1. Three scenarios were suggested at this stage: firstly, to locate nine new WTs in the front row with 300 m spacing between each WT (WF 8). The result was a big improvement of 23.5% increased energy compared with the base case. In order to compare the front straight row to a staggered row, the next scenario examined locating the nine WTs in three staggered rows (WF 9). The power generation was less than that of WF 8, as the percentage improvement was only 19.7%. The final step in this stage was locating the nine WTs in two rows with a 600 m wake distance (WF 10). This scenario was the best by far, as the improvement was 24.3% greater than the base case. Figure 10 compares an annual energy yield graph in terms of wind direction with regard to WF 8, WF 9 and WF 10. Clearly, the discrepancy was due to the wake from each WT in the WF, where the wind speed was slightly reduced. As the flow proceeded downstream, there was a spreading of the wake, and the wake recovered towards free stream conditions. It is important not to forget that the wake effect is the aggregated influence on the energy production of the WF, which results from the changes in wind speed caused by the impact of the WTs on each other. Figure 10 shows the wind direction and the annual energy yield graph of WF 8, WF 9 and WF 10. Figure 11 also shows a minor discrepancy between “Basic” and “Net” in the case of WF 8. By returning to the layout, it is understandable that blue line dropped between 0 and 50 degrees, which represents North East, and due to the variable wind speed and direction that led to a reduction in energy generation. This discrepancy was less in WF 9 and WF 10. Both Figure 10 and Figure 11 show substantial upgrading.

4.4. Strategy D: Moving the WF to Completely New Locations in Different Emirates within the UAE

This stage required detailed analysis of the topography of the new WF site, as well as the prevailing wind directions, and determining where the best WT sites would be in order to minimize the wake effects. The location of Al Fujairah was considered, especially since this location was initially proposed by the government as a potential location for a WF [28]. The base case of Sir Bani Yas was on flat terrain, and to ensure more accurate results, the topography of Al Fujairah was also taken into the consideration (see Figure 12) for the layout configuration of WF 11. The model set-up ensured the correct topography of each WT in the new location. It is worth noting that the wind rose was high in both locations (see Figure 13). Changing the location was aimed to move the best scenario from Sir Bani Yas—(WF 10), which included nine new efficient WTs that were placed in two rows with a distance spacing of 600 m between individual WTs. The longitude and latitude of the base case and that of the new location is described in Table 4. This scenario is symbolized as WF 11 and it is the last configuration considered in this research. Figure 14 compares the wind direction annual energy yield graph of WF 11 against the Sir Bani Yas base case (WF 1), whereas Figure 15 compares the turbine energy yield of WF 10 and WF 11, and Figure 16 illustrates the wake and topographic effect on the WF 11 energy yield.

5. Discussion

Overall Comparison

The focus of this paper was the enhancement of wind energy production from a wind farm located in the UAE. The site of an existing wind farm project located Sir Bani Yas was used as the base case for this research. Four strategies were evaluated in order to assess the potential increase in the annual energy production from the wind farm. The first strategy was to insert four small WTs between the WTs of the original layout. By summing up the power generations of these small four WTs (see Table 5), the results were as follows: 2.3956 GWh in the case of WF 2, when they were in in the front row of the base case; 2.6699 GWh in the front row of the base case (WF 3) and 2.2724 GWh when they were the middle row with a staggered arrangement. Although the differences with regard to all these scenarios are not significant, this shows that small WTs do not benefit from being separated and in a staggered arrangement, and locating small WTs in the front row can take advantage of the prevailing wind.
The second strategy suggested was to adjust the original distance spacing of the original sixteen WTs. By comparing the power generation of each configuration, obviously, the total energy generated was 49.4081 GWh for WF 5 when they were arranged in three rows with a distance spacing of 300 m, 54.038 GWh for WT6 when they were arranged in three rows with a distance spacing of 400 m, and 55.0591 GWh for WF 7 when they were arranged in three rows with a distance spacing of 500 m. Ostensibly, siting WTs too close together has a number of predictable consequences resulting from the turbulent nature of the turbine’s wake as it moves to the other turbines downstream from it. In terms of the most efficient turbine spacing, it is the one which allows the WTs to economically extract the most energy from the wind. This has been shown to be some 15 rotor diameters. It was disappointing to see the drop of power generation in the case of WF 5. By referring to Table 5 and Figure 6, it could be argued that the WTs that were affected were WT 8, 9, 10, 11, 12, 14, 15 and 16. In WF 6 and WF 7, the distance spacing was higher, as air currents in the tunnel passed through in the case of WF 6 and WF 7. Moreover, although there was some improvement, it was insufficient to justify a larger WF land footprint, in that this urban sprawl could damage the local wildlife and pose some inconvenience to the surrounding land.
Furthermore, strategy C focused on increasing energy generation by replacing the sixteen conventional WTs. Companies have introduced technical improvements to WTs leading to more efficiency and lower cost. Noticeably, WF 8 generated 69.991 GWh when the nine WTs were put in the front row. Table 5 highlights the greatest improvement with regard to WT1 of 3.7074 GWh, which was achieved by reviewing the layout of WF 8 (Figure 6). WT1 was the first in the row where the direction was such that it received abundant amounts of wind. Deceptively, this particular geographical location is blessed with an abundant wind flow (Figure 12). Going back to the base case (WF 1), the WT in this precise location had the most significant generation of power at 3.7074 GWh. When the WTs were arranged in three staggered rows (WT9), the power generation was recorded as 66.6985 GWh; whereas it was 70.7024 GWh in the case of WF 10, when the WTs were in two rows with a wake distance of 600 m. It is shown that the new WTs with a distance spacing of 600 m had the most powerful impact, and this layout was the optimal in the Sir Bani Yas location. By referring to Table 5, it shows that the new location obviously has a good impact, in that WT10 had a total energy generation of 70.7024 GWh.
A closer look at the wake loss in terms of percentages helps to additionally allow us to understand each WT’s behavior in terms of wake loss. This is defined as the space behind a wind turbine that is marked by decreased wind power capacity due to the fact that the turbine itself has used the energy in turning the WT blades. Table 5 summarizes each WT wake loss. In the base case, the greatest wake loss was in WT 13. In strategy A, and in the cases of WF 2, WF 3 and WF 4, the huge losses that appeared in the small WTs ranged from between—16.51% and—31.14%.
Strategy D was to further test whether the optimal case in Sir Bani Yas (WF 10) would work as efficiently in other locations, and the WF was moved to Al Fujaira. The improvement was an increase of 31% by 31.6796 GWh. As Table 5 shows, the wake loss of W11 was very obvious in WT 7, 8 and 9, and the topographic effect in the WF 11 site where contour levels varied between 160 m and 215 m had a significant impact on the energy yield (Figure 16). Nonetheless, by having a look at WT 6 and WT 7 in WF 11, the annual yield is almost the same at 11 GWh although they have different location parameters, where WT 6 has a better access to prevailing wind than WT 7, which reduced the wake loss for WT 6 than WT 7 at −10.36% and −13.27%, respectively. On the other hand, the topographic effect on WT 7 was 11.21% at an altitude of 184 m, while on WT 6, it was 18.06% at an attitude of 199 m. This explains that the total yield of each WT is affected by many criteria which can immensely reduce or increase the annual yield. It is worth mentioning here that there are many external factors or circumstances that may be responsible for the deviation of turbine yield from the theoretical output. Many researchers suggest that wind direction may impact turbine yield as well as the effect of turbine blade momentum. Other authors believe that that the location of the maximum power point is significantly affected for low wind speeds. For high wind speeds, the effect is less pronounced and for typical average wind speeds, the energy yield can increase with 1%–2% if the interest is the increase in yearly energy output with respect to the classical maximum power point tracking algorithm.

6. Conclusions

The aim of this research was to optimize the power generation of wind farms in the UAE. The Sir Bani Yas island WF was systematically studied, and four main strategies were suggested and analyzed. The model was set up in WindFarm Simulation Software, and the proposed strategies emerged from the literature. Based on the capacity of the software, these strategies were as follows: inserting small WTs between WTs in the original layout; changing the distance spacing of the WTs; minimizing the wind farm footprint by replacing the current WTs with more efficient ones. As a final stage, the base case and best performing WFs were relocated to the emirate of Al Fujairah. The main findings of this paper are:
(1) inserting small WTs between the original WTs is feasible, but their energy production will be affected by the layout, with the front row that is facing the prevailing wind offering the best solution. (2) A distance spacing of 300 m between the WTs will decrease power generation. (3) Wider diameter distance spacing can minimally improve power generation but will not justify the WF land footprint. (4) Placing many WTs in close proximity to one another results in performance decreases due to wake loss effects. (5) Inserting small WTs between original WTs is feasible, but their generation of electricity will be affected by the layout, with the front row that is facing the prevailing wind offering the best solution. (6) Nine higher capacity WTs in two rows with a distance spacing of 600 m is the optimum scenario, leading to an extra 24.3% of energy generated. This paper will provide wind engineers and WF operators with some useful information so that more factors could be incorporated into proposed schemes to maximize power generation, not only in the UAE, but other countries that share similar climatic and environmental contexts. (7) The higher altitudes of the new location increased the energy generation of the nine WTs from 70.7024 to 102.382 GWh.
This paper will provide wind engineers and WF operators with some useful information so that more factors could be incorporated into proposed schemes to maximize power generation, not only in the UAE, but also in other countries that share similar climatic and environmental contexts. In terms of future work, the authors recommend the need to: (1) investigate different windy locations in the UAE; (2) take holistic, comparative views of wind energy costs, and following through on such views in terms of power-sector regulation and tendering; (3) consider different models of WTs, since the fundamental aim is to maximize energy production, minimize capital and operating costs, and stay within the constraints imposed by the site; (4) use alternative simulation tools to assess WF size, WT type, hub height and layout to allow quick and efficient consideration of proposals; (5) investigate other parameter such as “noise modelling” which needs to be optimized (6) compare the two core types of WT—the horizontal axis wind turbine (HAWT) and the vertical axis wind turbine (VAWT)—in the context of the UAE. As a final note, the results of this research were focused on the UAE, but the recommendations can be generalized to cover the nearby countries, namely, GCC countries.

Author Contributions

Conceptualization, H.M.T.; Data curation, H.M.T.; Formal analysis, H.M.T.; Investigation, H.M.T.; Supervision, B.A.H. All authors have read and agreed to the published version of the manuscript.

Funding

This research received Funding from the British University in Dubai.

Institutional Review Board Statement

This research did not involve any humans or animals. The study was conducted according to the guidelines of the Declaration of Helsinki, and approved by the Institutional Review Board (or Ethics Committee) of British University in Dubai.

Informed Consent Statement

Not applicable.

Data Availability Statement

The study did not report any data.

Conflicts of Interest

The authors declare no conflict of interest.

Abbreviations

AEPAnnual Energy Production
DRotor diameter
GCCGulf Cooperation Council
GWECGlobal Wind Energy Council
GWh Gigawatt hours
HAWT Horizontal Axis Wind Turbine
HzHertz
MWhm/s meter per second
WFWind farm
WWEAWorld Wind Energy Association
WSWind speed
WTWind turbine
WLWake Loss
W/m2Watt per meter square
%Percentage
kWKilowatt
km/hKilometer per hour
VAWT Vertical Axis Wind Turbine

References

  1. International Energy Agency. Global Energy Demand Rose by 2.3% in 2018, Its Fastest Pace in the Last Decade. 2019. Available online: https://www.iea.org/ (accessed on 16 June 2019).
  2. Al-mulali, U.; Che Sab, C.N.B. Energy consumption, CO2 emissions, and development in the UAE. Energy Sources Part B Econ. Plan. Policy 2018, 13, 231–236. [Google Scholar] [CrossRef]
  3. Kaygusuz, K. Wind Energy: Progress and Potential. Energy Sources 2004, 26, 95–105. [Google Scholar] [CrossRef]
  4. Turksoy, O.; Ayasun, S.; Hames, Y.; Sonmez, S. Gain-Phase Margins-Based Delay-Dependent Stability Analysis of Pitch Control System of Large Wind Turbines. Transactions of the Institute of Measurement and Control. 2019. Available online: https://journals.sagepub.com/doi/abs/10.1177/0142331219834605 (accessed on 30 March 2019).
  5. Manwell, J.F.; McGowan, J.G.; Rogers, A.L. Wind Energy Explained: Theory, Design and Application; Wiley: London, UK, 2010. [Google Scholar]
  6. Al-Amir, J.; Abu-Hijleh, B. Strategies and Policies from Promoting the Use of Renewable Energy Resource in the Uae. Renew. Sustain. Energy Rev. 2013, 26, 660–667. [Google Scholar] [CrossRef]
  7. Bachellerie, I.J. Enewable Energy in the GCC Countries—Resources, Potential, and Prospects; Gulf Research Center: Dubai, United Arab Emirates, 2010. [Google Scholar]
  8. WWEA. Wind Power Capacity Worldwide Reaches 597 GW, 50,1 GW Added in 2018. 2019. Available online: https://wwindea.org/blog/2019/02/25/wind-power-capacity-worldwide-reaches-600-gw-539-gw-added-in-2018/ (accessed on 17 June 2019).
  9. GWEC, Annual Installed Global Capacity 2001–2017. 2019. Available online: https://gwec.net/global-figures/graphs/ (accessed on 25 June 2018).
  10. Zhao, H.; Wu, Q. Modeling and Modern Control of Wind Power; John Wiley & Sons: London, UK, 2018. [Google Scholar]
  11. Chowdhury, S.; Zhang, J.; Castillo, L. Unrestricted wind farm layout optimization (UWFLO): Investigating key factors influencing the maximum power generation. power generation. Renew. Energy 2012, 38, 16–30. [Google Scholar] [CrossRef]
  12. Donovan, S. Wind Farm Optimization. In Proceedings of the 40th Annual Conference, Wellington, New Zealand, 2–3 December 2005. [Google Scholar]
  13. Yang, H.; Zhou, W.; Lou, C. Optimal Design and Techno-Economic Analysis of a Hybrid Solar-Wind Power Generation System. Appl. Energy 2009, 86, 163–169. [Google Scholar] [CrossRef]
  14. Chou, C.J.; Wu, Y.K.; Han, G.Y.; Lee, C.Y. In Comparative Evaluation of the Hvdc and Hvac Links Integrated in a Large Offshore Wind Farm—An Actual Case Study in Taiwan. IEEE Trans. Ind. Appl. 2011, 1, 1–8. [Google Scholar] [CrossRef]
  15. Al-Nassar, W.; Alhajraf, S.; Al-Enizi, A.; Al-Awadhi, L. Potential wind power generation in the State of Kuwait. Renew. Energy 2005, 30, 2149–2161. [Google Scholar] [CrossRef]
  16. Gharbia, Y.; Anany, M. ASME 2016 International Mechanical Engineering Congress and Exposition: Feasibility Study of Erecting a Wind Farm in Kuwait. In Proceedings of the ASME 2016 International Mechanical Engineering Congress and Exposition, Phoenix, AZ, USA, 11–17 November 2016. [Google Scholar]
  17. Jamil, M.; Ahmad, F.; Jeon, Y.J. Renewable energy technologies adopted by the UAE: Prospects and challenges—A comprehensive overview. Renew. Sustain. Energy Rev. 2016, 55, 1181–1194. [Google Scholar] [CrossRef] [Green Version]
  18. Yaseen, A.; Andreas, P. Parametric analysis for the implementation of wind power in United Arab Emirates. Renewable and Sustainable Energy Reviews. 2015, 52, 635–644. [Google Scholar]
  19. Shaahid, S.M.; Luai, M.A.; Rahman, M.K. Potential of Establishment of Wind Farms in Western Province of Saudi Arabia. Energy Procedia 2014, 52, 497–505. [Google Scholar] [CrossRef] [Green Version]
  20. MEED Editorial, Middle East Economic Digest. Special Reports Calendar. Power Oman 2014, 58, 13–21.
  21. Renwable Energy World, Wind Farm Design: Planning, Research and Commissioning. 2009. Available online: https://www.renewableenergyworld.com/articles/print/volume-12/issue-2/wind-power/wind-farm-design-planning-research-and-commissioning.html (accessed on 20 December 2018).
  22. Eroğlu, Y.; Seçkiner, S.U. Design of wind farm layout using ant colony algorithm. Renew. Energy 2012, 44, 53–62. [Google Scholar] [CrossRef]
  23. Jiang, J.N.; Tang, C.Y.; Ramakumar, R.G. Control and Operation of Grid-Connected Wind Farms: Major Issues, Contemporary Solutions, and Open Challenges; Springer: London, UK, 2016. [Google Scholar]
  24. Staffel, I.; Green, R. How does wind farm performance decline with ago? Renew. Energy 2014, 66, 775–786. [Google Scholar] [CrossRef] [Green Version]
  25. Mosetti, G.; Poloni, C.; Diviacco, B. Optimization of Wind Turbine Positioning in Large Windfarms by Means of a Genetic Algorithm. J. Wind Eng. Ind. Aerodyn. 1994, 51, 105–116. [Google Scholar] [CrossRef]
  26. Knudsen, T.; Bak, T.; Svenstrup, M. Survey of wind farm control, power and fatigue optmisation. Wind Energy 2015, 18, 1333–1352. [Google Scholar] [CrossRef]
  27. Wu, Y.-T.; Porté-Agel, F. Modeling Turbine Wakes and Power Losses Within a Wind Farm Using Les: An Application to the Horns Rev Offshore Wind Farm. Renew. Energy 2015, 75, 945–955. [Google Scholar] [CrossRef]
  28. Shakoor, R.; Hassan, M.Y.; Raheem, A.; Wu, Y.K. Wake Effect Modeling: A Review of Wind Farm Layout Optimization Using Jensen’s Model. Renew. Sustain. Energy 2016, 58, 1048–1059. [Google Scholar] [CrossRef]
  29. Vasel-Be-Hagh, A.; Archer, C.L. Wind Farm Hub Height Optimization. Appl. Energy 2017, 195, 905–921. [Google Scholar] [CrossRef]
  30. Feng, J.; Shen, W.Z. Solving the Wind Farm Layout Optimization Problem Using Random Search Algorithm. Renew. Energy 2015, 78, 182–192. [Google Scholar] [CrossRef]
  31. Gao, Y.X.; Lu, H. Optimization of Wind Turbine Layout Position in a Wind Farm Using a Newly-Developed Two-Dimensional Wake Model. Appl. Energy 2016, 174, 192–200. [Google Scholar] [CrossRef]
  32. Guirguis, D.; Romero, D.A.; Amon, C.H. Toward Efficient Optimization of Wind Farm Layouts: Utilizing Exact Gradient Information. Appl. Energy 2016, 179, 110–123. [Google Scholar] [CrossRef]
  33. Hou, P. Optimized Placement of Wind Turbines in Large-Scale Offshore Wind Farm Using Particle Swarm Optimization Algorithm. IEEE Trans. Sustain. Energy 2015, 6, 1271–1282. [Google Scholar] [CrossRef] [Green Version]
  34. Musselman, A.; Thomas, V.M.; Boland, N.; Nazzal, D. Optimizing wind farm siting to reduce power system impacts of wind variability. Wind Energy 2019. Available online: https://onlinelibrary.wiley.com/doi/abs/10.1002/we.2328 (accessed on 30 March 2019).
  35. Sir Bani Yas Wind Farm Project, Clean Development Mechanism. 2018. Available online: https://cdm.unfccc.int/Projects/DB/DNV-CUK1183446238.91/MonitoringPlanRevisions/01/RevisedMonitoringPlan (accessed on 3 April 2019).
  36. Export Gov, United Arab Emirates—Renewable Energy. 2018. Available online: https://www.export.gov/article?id=United-Arab-Emirates-Renewable-Energy (accessed on 20 March 2018).
  37. Rehman, S.; Ahmad, A.; Al-Hadrami, L.M. Development and economic assessment of a grid connected 20 MW installed capacity wind farm. Renew. Sustain. Energy Rev. 2011, 15, 833–838. [Google Scholar] [CrossRef]
  38. Climate of Sir Bani Yas and Fujairah. 2019. Available online: https://www.meteoblue.com/ (accessed on 31 October 2019).
  39. Masdar, Masdar Clean Energy. 2019. Available online: https://masdar.ae/en/masdar-clean-energy (accessed on 20 March 2018).
  40. WindFarm Software. Summary of Capabilities. Available online: http://resoft.co.uk/English/index.htm (accessed on 24 February 2018).
  41. Mihăilă, J.M.; Bigan, C.; Panduru, V. Mathematical modelling of noise mapping at wind turbine farms. Appl. Sci. 2014, 16, 48–55. [Google Scholar]
  42. National Centre of Morphology, Climate of Sir Bani Yas. 2018. Available online: http://www.ncm.ae/en#!/Radar_Merge_Sat (accessed on 10 September 2018).
  43. Coakley, D.; Raftery, P.; Keane, M. A review of methods to match building energy. Renew. Sustain. Energy Rev. 2014, 37, 123–141. [Google Scholar] [CrossRef] [Green Version]
  44. Stephan, J. Calculation of Different Generator Systems for Wind Turbines; Shaker Verlag GmbH: Düren, Germany, 2013. [Google Scholar]
  45. Planningni, Planning Policy Statements and Supplementary Planning Guidance. Draft PPS 18: Renewable Energy. Annex 1 Wind Energy: Spacing of Turbines. 2018. Available online: https://www.planningni.gov.uk/index/policy/planning_statements_and_supplementary_planning_guidance/pps18/pps18_annex1/pps18_annex1_wind/pps18_annex1_technology/pps18_annex1_spacing.htm (accessed on 30 October 2018).
  46. Al Wasmi, N. Masdar Launches Wind Atlas to Promote Alternative Energy Source in Coastal UAE. 2015. Available online: https://www.thenational.ae/uae/environment/masdar-launches-wind-atlas-to-promote-alternative-energy-source-in-coastal-uae-1.119882 (accessed on 15 January 2018).
Figure 1. Global annual installed wind capacity 2001–2018. Source: 2001 to 2017, adapted from Global Wind Energy Council [9]. The capacity of 2018 was adapted from World Wind Energy Association [8].
Sustainability 13 05110 g001
Figure 2. Calibration of total yield of base case wind turbine values against the WindFarm simulation values in (GWh).
Sustainability 13 05110 g002
Figure 3. WTs layout of WF 1, WF 2, WF 3 and WF 4.
Sustainability 13 05110 g003
Figure 4. Wind direction and annual energy yield graph of WF 2, WF 3 and WF 4.
Sustainability 13 05110 g004
Figure 5. Minimal differences of turbine energy yield between WF 2, WF3 and WF 4.
Sustainability 13 05110 g005
Figure 6. WTs layout of WF 5, WF 6, and WF 7.
Sustainability 13 05110 g006
Figure 7. Wind direction and annual energy yield graph of WF 5, WF 6 and WF 7.
Sustainability 13 05110 g007
Figure 8. Minimal differences of turbine energy yield between WF 5, WF 6 and WF 7.
Sustainability 13 05110 g008
Figure 9. WTs layout of WF 8, WF 9 and WF 10.
Sustainability 13 05110 g009
Figure 10. Wind direction and annual energy yield graph of WF 8, WF 9 and WF 10.
Sustainability 13 05110 g010
Figure 11. Differences of turbine energy yield between WF 8, WF 9 and WF 10.
Sustainability 13 05110 g011
Figure 12. Topography details of the new location with the layout configuration of WF 11.
Sustainability 13 05110 g012
Figure 13. Comparison of wind rose of Sir Bani Yas and Al Fujairah [46].
Sustainability 13 05110 g013
Figure 14. Wind direction and annual energy yield graph of Al Fujairah (WF 11) against Sir Bani Yas (WF 10).
Sustainability 13 05110 g014
Figure 15. Differences of turbine energy yield between WF 10 and WF 11.
Sustainability 13 05110 g015
Figure 16. Wake and topographic effect of WF 11.
Sustainability 13 05110 g016
Table 1. Significant studies in the area.
No.AimFindingsCitation
1To investigate the mechanical/aerodynamic part, which includes the wind turbines, their power production, fatigue and wakes affecting neighboring wind turbines.In dense wind farms, some wind turbines are placed in the wake of others, which drastically affects the average power per wind turbine by approximately 10%.[26]
2To propose modeling framework and validation to simulate turbine wakes and associated power losses in wind farms.When the prevailing wind direction is parallel to the turbine rows, the velocity deficit and the power losses are greatest, and the turbulence intensity levels are highest and have a symmetrical pattern (dual-peak at hub height) on both sides of the turbine wakes.[27]
3To review the wake models in general and far wake models, in particular by using Jensen׳s model.Jensen׳s far wake model is a good choice to solve the wind farm layout problem due to its simplicity and relatively high degree of accuracy. However, it was also found that there is a need of more optimization techniques to be applied to solve the layout problem.[28]
4To assess the effect of hub height optimization on the annual energy production (AEP) of a wind farm. The only optimization variable is the hub height of each wind turbine and all other characteristics of the wind farm, including base location, rotor diameter (D), and total number of wind turbines, remain unchanged.Wind farms with multiple hub height turbines produce >2% more energy annually.[29]
5To use a random search algorithm based on continuous formulation to optimize the wind farm layout which starts from an initial feasible layout and then improves the layout iteratively in the feasible solution space.It is found that up to 360 or more sectors for wind direction have to be used in order to obtain consistent and reliable optimization results.[30]
6To develop and validate a 2D analytical wind turbine wake model based on Jensen’s wake model using Gaussian function to optimize the wind turbine layout position
by using different downwind distances of X = 2.5D, X = 5D, X = 7.5D and X = 10D.
By using the 2D Jensen–Gaussian wake model instead of Jensen’s wake model, the total power generation and wind farm efficiency decreased, which is in accordance with the literature on the power losses caused by the wake effect in large wind farms.[31]
7To optimize the wind farm layouts by utilizing the exact gradient information of the problem’s objective and constraints. A single uniform staggered layout can result in good optimized solutions when used as a single starting point for the optimization. Wind farm designers may want run the optimization solver with different initial layouts to increase their confidence in the final solution.[32]
8To optimize the placement of wind turbines in a large-scale offshore wind farm using the particle swarm optimization algorithm.It is found that the optimized sparse layout was the best considering LPC (levelized production cost) and annual energy yields. The optimized sparse layout represents a wind farm layout with different spaces between wind turbines in each row and column where the wake losses decreased the most compared to the other cases.[33]
9To optimize the wind farm siting to reduce system impacts of wind variability.Both the average variability and max variability decreases as the average residential demand increases, because sites with lower wind output have a similar range across which the wind can vary. It is more economical to build a smaller amount of larger wind farms than small farms.[34]
10To investigate the effect of gain-phase, margins-based and delay-dependent stability analysis of the pitch control systems of large wind turbine with time delays.Delay margins made only with regard to stability will cause oscillations that may cause instability in the system response.[4]
Table 2. Comparison between the WT models adopted for this research.
Category/Code(I)
Base Case Turbines
(II)
Small Turbines
(III)
Higher Capacity Turbines
ModelV100-1.8 MWV47-660 KWV150-4.2 MW
ManufacturerVestasVestasVestas
Power RegulationPitchPitchPitch
Number of Blades333
Swept Area (m2)7853.9811734.94517,671.459
Hub Height (m)8045166
Diameter (m)10047150
RPM14.928.516.1
Speed variationVariableTwo SpeedVariable
Cut In Wind Speed (m/s)343
Cut Out Wind Speed (m/s)202522.5
Rated Power (kW)18006604200
Rated Wind Speed (m/s)121515
Table 3. Summarized Wake Loss in (%).
StrategyScenariosWT 1 (%)WT 2 (%)WT 3 (%)WT 4 (%)WT 5 (%)WT 6 ((%)WT 7 ((%)WT 8 (%)WT 9 (%)WT 10 (%)WT 11 (%)WT 12 (%)WT 13 (%)WT 14 (%)WT 15 (%)WT 16 (%)Small WT 1 Small WT 2 Small WT 3 Small WT 4
Base Case(WF 1)−2.78−10.02−9.75−10.11−9.98−10.7−10.55−11.89−12.41−8.02−14.43−14.87−20.59−19.91−17.18−12.48----
Strategy A: Inserting smaller turbines between the larger main original turbines(WF 2)−2.92−10.26−10.09−10.42−10.37−11.08−11.01−12.35−12.85−8.36−14.74−14.99−21.1−20.61−17.68−13.19−25.88−25.88−23.69−20.08
(WF 3)−2.94−11.58−9.78−11.19−9.91−10.71−10.71−13.17−12.32−10.24−14.21−15.72−22.16−20.47−18.09−13.13−16.51−19.14−19.54−9.68
(WF4)−2.88−10.35−10.31−10.63−10.46−11.13−11.20−12.70−13.05−8.49−14.86−15.08−21.86−21.98−18.86−12.90−27.75−31.14−29.54−26.35
Strategy B: Changing the spacing between the turbines(WF5)−2.64−10.57−10.32−11.70−11.52−11.31−9.95−26.17−30.21−31.34−31.46−25.28−13.09−27.70−28.22−22.84----
(WF6)−2.31−10.18−6.65−16.93−7.14−17.81−7.30−17.48−7.46−17.16−6.99−16.09−10.17−16.37−11.96−10.92----
(WF7)−1.72−10.29−4.91−14.01−5.96−13.95−5.67−13.65−7.28−13.65−9.20−9.38−9.45−13.91−8.45−14.63----
Strategy C: Substituting new higher efficiency turbines in place of the existing ones(WF8)−2.08−12.7−13.82−11.23−12.51−13.57−12.84−14.48−14.1-----------
(WF9)−3.08−15.47−14.29−8.64−21.87−24.77−9.59−19.66−27.24-----------
(WF10)−2.50−10.77−6.89−17.16−7.60−18.50−7.73−18.56−9.55 -----------
Strategy D:
Relocating the base case (WF 11) to Al Fujairah
(WF 11)−2.73−6.78−7.88−8.2−6.94−10.36−13.27−15.39−11.52
Table 4. Easting and northing of sixteen WT in Sir Bani Yas and nine WT in Al Fujairah.
Wind Turbine No.Sir Bani Yas (Flat Terrain)Al Fujairah
Vestas V100-1.8 MWVestas V150-4.2 MW
EastingNorthingEastingNorthingAltitude
1659,8662,695,1581,010,7652,829,921188
2659,6772,695,0221,010,3392,829,879181
3659,4912,694,8821,009,8012,829,737172
4659,3042,694,7391,009,3762,829,635166
5659,1192,694,5931,008,8722,829,438161
6658,9452,694,4321,008,9312,829,042199
7658,7752,694,2621,009,4182,829,157184
8658,6312,694,0541,009,9032,829,299178
9658,5102,693,8361,010,3992,829,383185
10658,2892,692,948---
11658,2522,692,716---
12660,1292,694,816---
13659,7902,694,403---
14659,4902,693,971---
15659,1012,693,396---
16658,9282,692,839---
Table 5. Summarized WT power generations (GWh).
StrategyScenariosWT 1 (GWh)WT 2 (GWh)WT 3 (GWh)WT 4 (GWh)WT 5 (GWh)WT 6 (GWh)WT 7 (GWh)WT 8 (GWh)WT 9 (GWh)WT 10 (GWh)WT 11 (GWh)WT 12 (GWh)WT 13 (GWh)WT 14 (GWh)WT 15 (GWh)WT 16 (GWh)Small WT 1 Small WT 2 Small WT 3 Small WT 4 Total Power Generation (GWh)
Base Case(WF1)3.70743.43143.44143.42773.43283.40543.41113.35973.34013.50733.26313.24643.02823.05423.15833.3373----53.5517
Strategy A: Inserting smaller turbines between the larger main original turbines(WF 2)3.70193.42213.42853.41613.41793.39093.39363.34253.32343.49473.25143.24183.00883.02733.13903.31050.59050.59050.60790.636755.7361
(WF3)3.70133.37173.44043.38683.43563.40503.40513.31123.34363.42293.27153.21372.96833.03293.12363.31270.66520.64420.64100.719555.8161
(WF4)3.70363.41873.42013.40783.41453.38903.38643.32903.31563.48963.24653.23822.97982.97513.09403.32120.57560.54860.56140.586855.4013
Strategy B: Changing the spacing between the turbines(WF5)3.71273.41023.41983.36703.37393.38223.43392.81552.66122.61832.61352.84913.31432.75692.73722.9423----49.4081
(WF6)3.72513.42513.55993.16793.54093.13433.53503.14683.52883.15883.54683.19983.42553.18923.35743.3968----54.038
(WF7)3.74793.42073.62593.27923.58593.28143.59703.29273.53563.29283.46253.45553.45293.28303.49103.2552----55.0591
Strategy C: Substituting new higher efficiency turbines in place of the existing ones(WF8)8.64617.70797.60977.83797.72547.63157.69627.55137.5849-----------69.991
(WF9)8.5587.46397.56798.06716.89856.64297.98257.09386.4240-----------66.6985
(WF10)8.60887.87908.22127.31428.15877.19648.14697.19067.9867-----------70.7024
Strategy D:
Relocating the base case (WF 1) to
Al Fujairah
Topographic effect21.0318.9417.0616.6221.1318.0623.5521.0621.39------------
(WF 11)12.311211.594911.276511.19611.788411.067611.205610.710611.2313-----------102.382
Publisher’s Note: MDPI stays neutral with regard to jurisdictional claims in published maps and institutional affiliations.

