1. Introduction
Monotowns are urban settlements whose economy is dominated by a single industry or company. The term is relevant, especially in Russia, where the Soviet-era economic and military planning created hundreds of single-industry towns. Typically, monotowns were planned close to natural resources, such as precious minerals, coal, and waterpower, and far from state borders for protection from war [
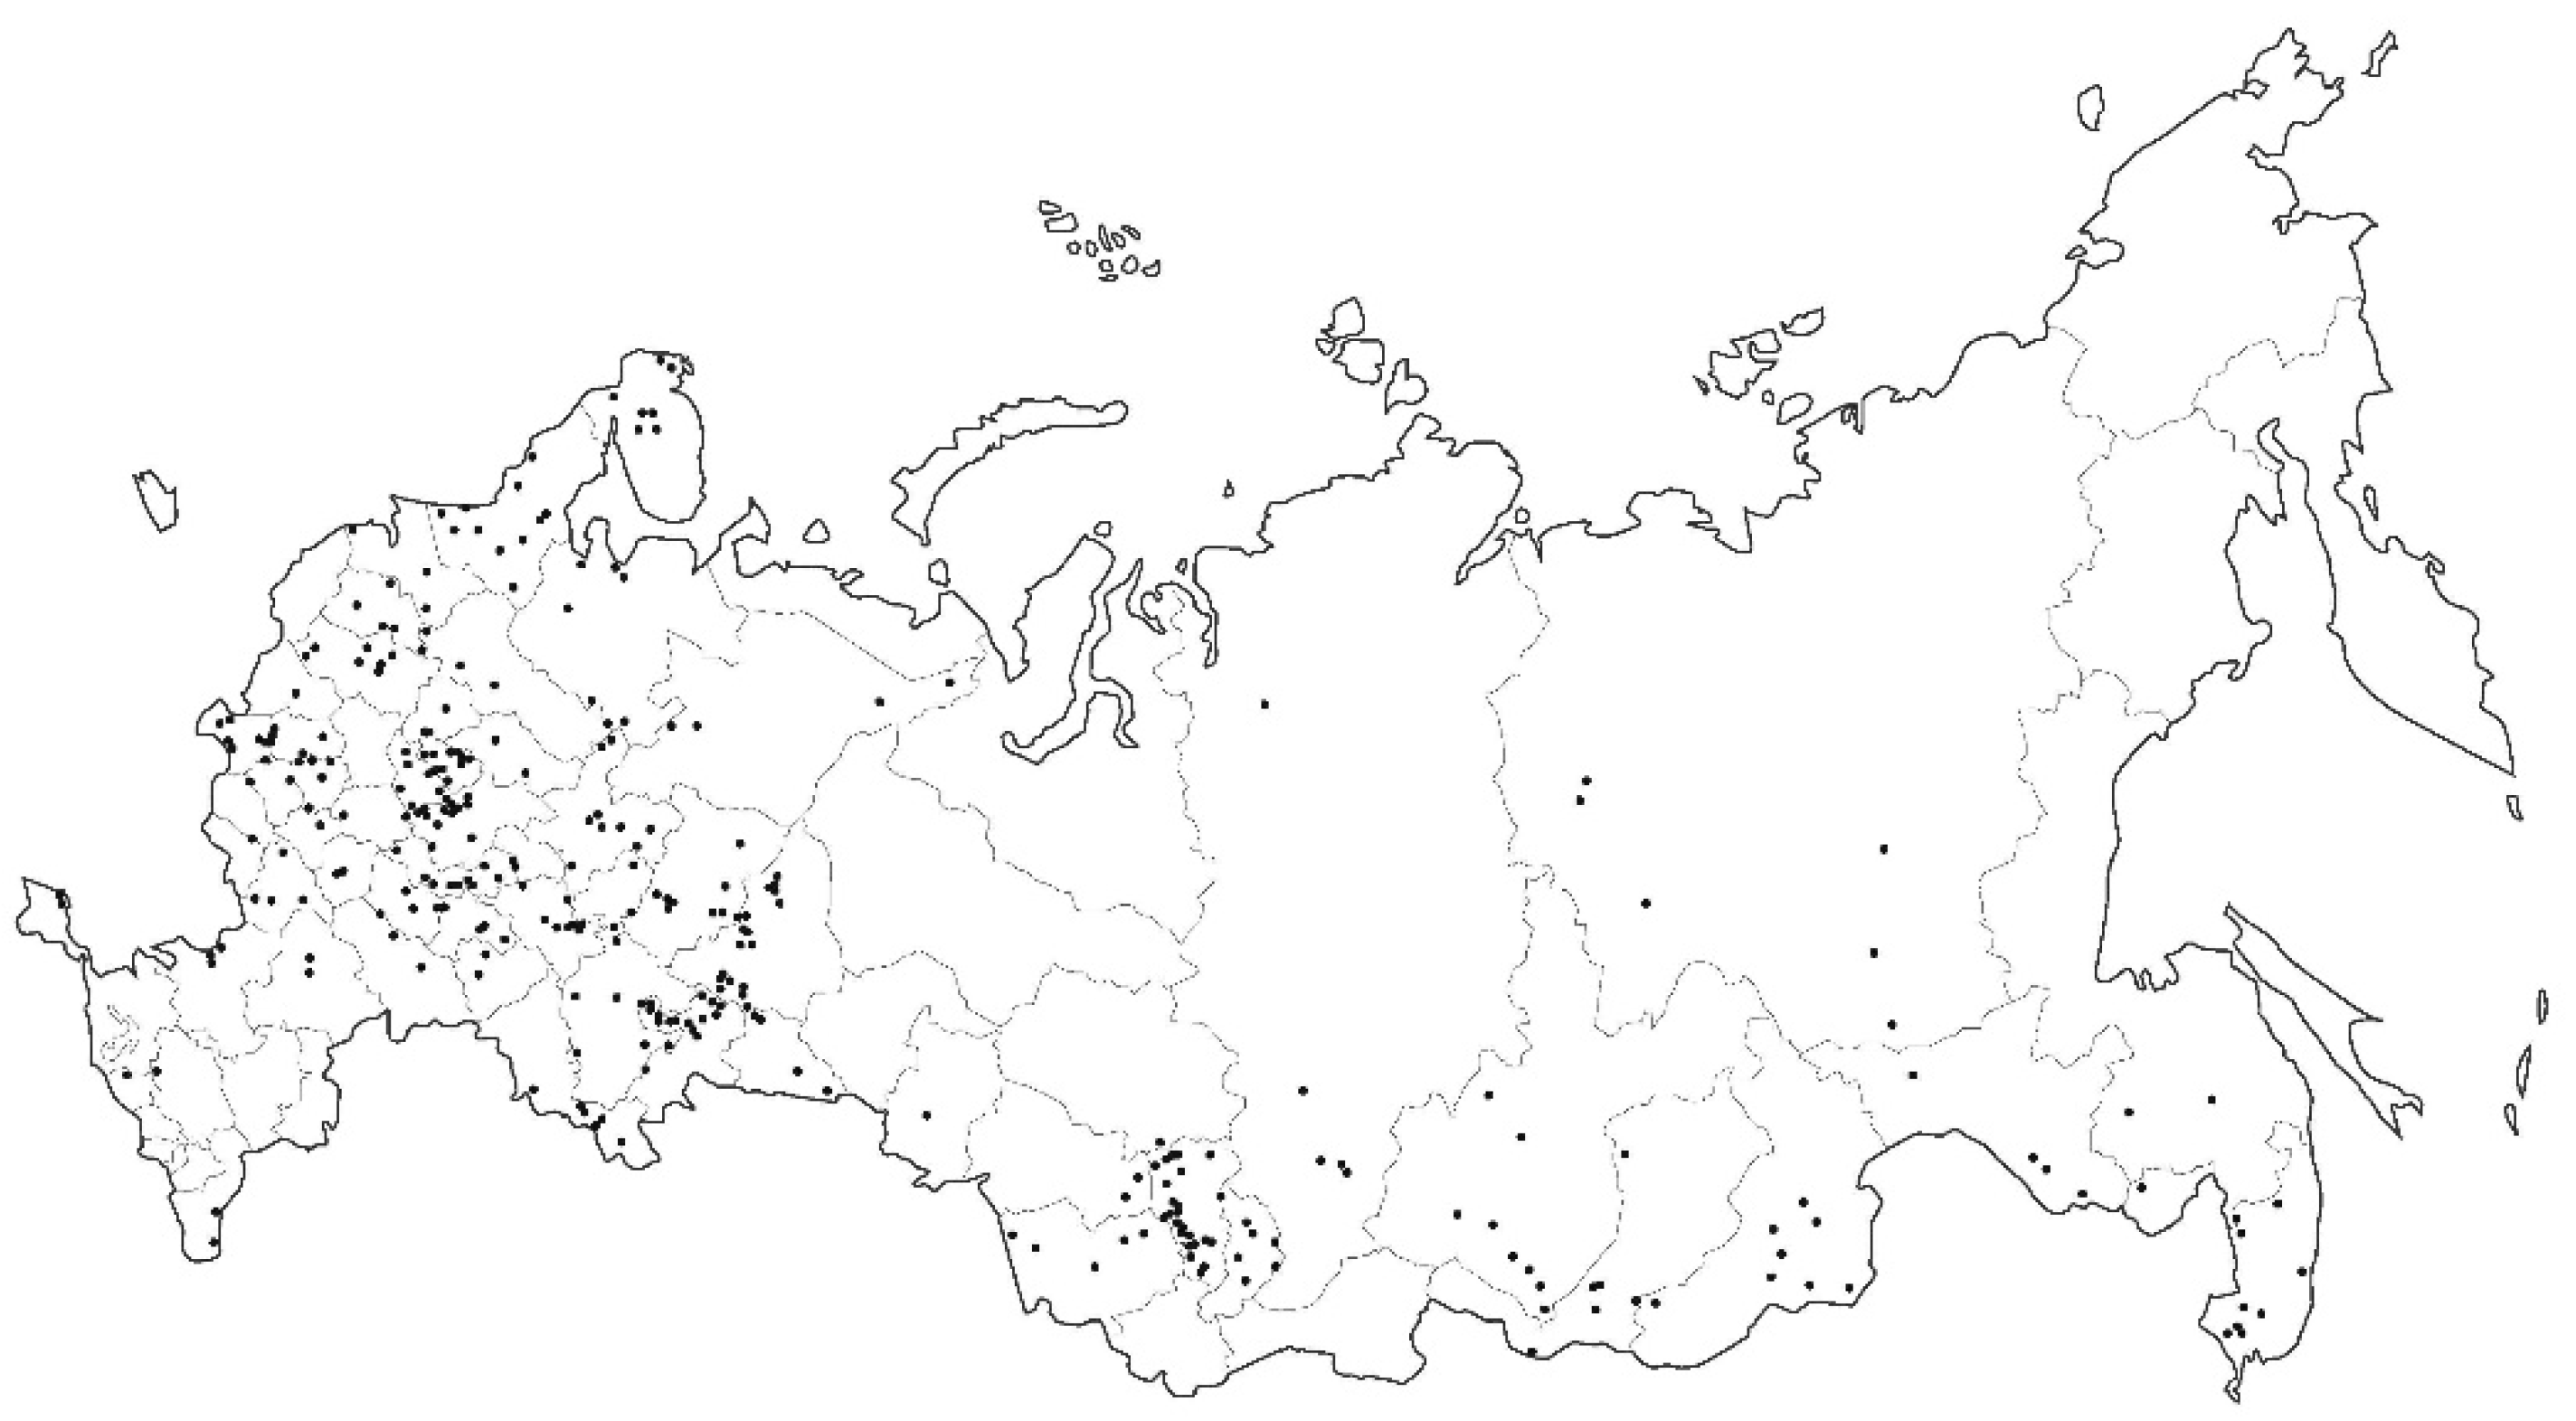
1]. While the majority of monotowns are located in central Russia and along the river Volga, many are also in Southern and Eastern Siberia and Russia’s arctic zone (
Figure 1).
In an international comparison, rather similar factory towns, mill towns, or company towns were built in the UK, US, Germany, and Japan during the early phases of industrialization. In Western societies, the rise of the welfare state and structural changes in the economy made the company town model gradually obsolete. In Russia, the economy’s structural change is currently underway, making monotowns topical both for academic analysis and policy interventions [
2].
According to Turgel [
3], monotowns account for 43–46 percent of all Russian cities. Roughly 40 percent of the country’s G.D.P. is put up in monotowns [
4]. Officially, a municipality is considered a monotown if it fills the following criteria: (1) it has status as an urban district or urban settlement; (2) its population exceeds 3000 people; (3) the core-company employs at least 20 per cent of the local workforce; and (4) the core-company operates in mining or industry, except oil and gas. With these criteria, Russia had 319 monotowns in 2017, with a total population of 14 million. The largest monotown is Tolyatti, a car-making city of 700,000, and the most remote is Beringovsky, a tiny port at the arctic Bering Sea.
Amongst academics, it is generally understood that Russian monotowns experience serious difficulties [
5]. Since the collapse of the Soviet Union, their problems have evolved in complex ways, however, and the general picture of monotowns and their future is varied. In the 1990s, monotowns lost the Soviet-planned economic support and linkages. Their production declined and became uncompetitive, and workers’ wages decreased. The town-forming enterprises downsized the social services they used to provide for citizens, lowering their quality of life. Kryukova et al. [
1] succinctly summarize that “
the main problem of social development of monotowns in Russia is a fact, that living standards of the population directly depend on the financial and economic situation at the core enterprise.” Around the year 2000, monotowns’ living standards started to differentiate; however, cities based on oil and metallurgy could tap into the international export markets and developed relatively well. The World Financial Crisis and subsequent national shocks stopped most of the positive developments, leading to protests and unrest in some locations (e.g., [
4]), but some monotowns remain stable today [
1]. A specific challenge is a predatory privatization. An example is provided by the aluminum company RUSAL, which possesses a number of town-forming plants but failed to invest any profits into the production, not to mention city-building, thus damaging its own business [
5].
1.1. Importance to Study the Quality of Life in Monotowns
Monotowns are, by definition specialized. Specialization made them efficient in the Soviet era, but they lack the diversity that could foster innovation and good social life in the contemporary situation. Monotowns fell prey to lock-ins, which turned the initial strengths of the highly developed and specialized infrastructure, close interfirm linkages, and political support to obstacles and shortcomings. Grabher [
6] distinguishes three major lock-ins that old industrial districts have the tendency to face: functional, cognitive, and political. In the Russian context, Didyk et al. [
7] further highlight the notion of geographical lock-ins, which refers to the long distances, inadequate infrastructures, and harsh climate that may make some monotowns hostile places to live.
While there are significant differences from town to town, in general, Russia’s Federal Government aims to diversify monotowns’ economy. This is reflected in the national policy program “Comprehensive Development of Monotowns”. Among more traditional tools, the program focuses on improving the urban environment and public space to improve the quality of life and foster positive socioeconomic processes. Thus, Russian monotowns clearly provide an interesting test ground for connecting an academic study to real-life planning guidance and actual urban interventions.
As planners and architects, we stress that spatial organization is a crucial element in achieving diversity and difference, working together with societal institutions with their own spatial embeddedness [
8]. Improving citizens’ quality of life is about shared benefits to produce a sustainable array of human activities, beneficial both to social life and economic success. The various, interlinked benefits are a leading clue for users’ location choice [
9], thus helping us to understand and plan urban change. Urban amenities such as shops, bars, or public buildings can offer services, activities, and venues for social interactions and economic transactions. The more human activities a city can foster, the more interactions occur, generating a vibrant urban life in indoor and outdoor spaces.
The space-related approach to quality of life is relevant in monotowns. While monotowns are centrally planned according to location (
Figure 1) and economic profile, they nevertheless represent a wide variety of 19th and 20th century planning styles. Some towns have older historical layers’, e.g., Rostov Veliky, Gorokhovets, and Tutayev—and some are “puristic” modernist settlements, e.g., Tolyatti, Naberezhnye Chelny, and Kamskiye Polyany. Furthermore, topography and natural settings diversify urban morphology and affect outdoor life, making monotowns an object of study as any set of towns and cities.
1.2. Research Question and Objectives
Our research aims to develop a method to study urban life in cities for which little or no or no data are available or there are no conditions for on-site surveys due to the number of cities, their population size, and their remoteness. Therefore, we aim to develop a set of relevant metrics to gain a minimal understandings of the quality of cities without site surveys. Currently, social media data offers new conceptual and analytic paths [
10,
11,
12,
13], especially when combined with other sources of understanding, including local knowledge [
14,
15,
16,
17]. Societally, thus, key issues involve increasing awareness about monotowns, foregrounding their hidden life and urban potentials, directing planning decisions, and arguing for local mobilization and resource-pooling. In what follows, we show how a certain combination of classic urban design principles for better city life by Jan Gehl [
18,
19] and Jane Jacobs [
20], operationalized through a multidimensional analysis of geolocated social media data, can achieve the challenging task. The methods presented below were developed to study 32 monotowns in Russia, but ultimately, they aim to be deployed to study any settlement where location-based social media data are available, making the results relevant and scalable.
The metrics should provide a systematic and consistent characterization of human activities in closed and open spaces for a vast number of cities. Simultaneously, it is necessary to represent the perceptual aspects to reveal the small interactions and the intangible networks set underneath the city’s tangible elements. The state of the art of assessing the quality of life depends on extensive and detailed datasets of urban amenities, demography, economy, environmental factors, land use, and more. In our case, not only was such information not available, but we had the necessity to embed our metrics to the range of one block to study the variation of our measurements street by street. In other words, our metric should be capable of depicting life in the city as if we were surveying every corner of the urban fabric on foot. A survey that would require extracting information from locals and visitors to define the collective image of the city was clearly impossible due to restricted time available, language, and budget constraints.
We found the optimal solution in Jan Gehl’s approach to study public space. Gehl’s research is based on understanding the primary quality of small urban places and feeding this information into his architecture practice to improve urban design [
18]. Gehl is standing with one foot into the academic discourse and the other into his practice, which finds his methods easy to implement in real-case scenarios. In his practice, he was capable of bringing together into one single conceptual model both the physical and intangible qualities of public space. The fact that Gehl’s method is designed to perform actual surveys of public space, all the metrics are engineered to be measured by human senses, mostly the eyes of the surveyor. Thanks to the high diffusion of mobile phones and the social practice of sharing a high quantity of photographic information online, we found it possible to think of social media users as proxy surveyors of public space.
The key challenges of our study on Russian monotowns can be summarized as follows:
to develop data gathering and analytic methods to study cities from which we have little or no data in advance;
to propose and test novel metrics to address the quality of life and public space;
to show how the study results may direct planning decisions and help in local mobilization.
1.3. State of the Art: Mapping Public Life
Several valid models for mapping and studying public life in the city have been used in urban studies and planning. EUROSTAT provides a widely recognized model that relies on:
Material living conditions;
Productive or main activity;
Health;
Education;
Leisure and social interaction;
Economic and physical safety;
Governance and basic rights;
Natural and living environment;
The overall experience of life.
EUROSTAT metrics are of high reliability and represent the standards for statistical analysis in Europe. However, those measures remain generic and hard to contextualize at the scale of urban settlements. To refine the scale of analysis and get deeper into the urban fabric, we can measure the relationship between wages, rent, and amenities and gain a deeper understanding of purchasing power and accessibility to certain activities provided by urban amenities at the local scale [
21]. The method was already introduced by Sherwin Rosen [
22], and it would be of high interest to categorize urban areas based on the ability of similar population groups to access and/or afford a set of urban amenities. Although this would give a solid metric to highlight the different levels of affordance within the same city or metropolitan region, the only available indicator that is common to all cities is the average salary. Glenn C. Blomquist presented a variation of this metric that allows us to compare a large number of cities by aggregating urban amenities [
23]. To be compiled, the index would require detailed information regarding the urban fabric (e.g., the height of building structures, their age, the type of housing, and its room amenities), demographic information, and even local weather conditions (e.g., humidity levels, hours of sunshine per year, or pollution levels).
We could still attempt to work on a derived form of Rosen and Roback’s index, but the geodatabase of amenities available for all those cities is not consistent. The online service Open Street Map (OSM) offers a good possibility to mine a geodatabase of urban amenities, but we found a high degree of inconsistency in quality and amount of amenities represented between cities, meaning this option had to be discarded. Nevertheless, during this exploration, the street network mapped in OSM appeared to be well representing the actual network visible on Google Maps. Therefore, we have taken steps to manually update all the streets that were apparently missing from the OSM database.
Those are just a few of the many different models currently used to measure quality of life (QoL), but most of them still rely on very general information on the economy, society, and subjectivity and experience [
24] of the model presented by the World Health Organization which follows even more personal domain believed to describe mental health: physical, psychological, level of independence, social relationship, environment, and spirituality [
25].
To face the absence of measurable dimensions, we found a reliable solution in the experiential construct of the city, which means the collection of information that is eventually quantifiable but which is gathered through the users of the city themselves. Christopher Alexander drove a constant search for the improvement of urban design through the study of activity patterns and the ontological elements of design [
26,
27,
28]. Human activity patterns are seen as the key to having a deeper understanding of both happiness in the city and socioeconomic attractions in everyday life.
An optimal approach would require the combination of both the physical and perceptual components of urban environments to bring the index closer to life, the way it is perceived by the population [
29]. This dual indicator weighted to the local and personal condition has inspired more district-level analysis, together with the rise in popularity of geographic information software (later GIS). GIS became a step forward in fine-tuning QoL metrics at the block or district scale by modeling the physical qualities of the tangible elements of the city with the way they are perceived by its population. With GIS demographic, social, and economic indicators could be geofenced and seen in spatial relationship with granular information from surveys and census data. With this approach, it is possible to map and so measure subjective and objective views that can describe the qualities of the physical, social, and economic life of one district [
30].
In urban studies, many efforts were made to stress the importance of the subjective view for a healthy living [
31,
32,
33] in understanding the intersection between urban design, social life, and economy [
20,
34], but they often remain discursive or at least hard to operationalize at large scale. QoL on a small urban scale is becoming topical to the field of planners and designers as we are now in the phase of reaching full building capacity in many western urban and metropolitan regions [
35]. This is calling for a dynamic metric of QoL in relation to the changes in city form [
36], and historically, this moment was seen as the occasion to shift from quantitative change (growth) to qualitative change [
37].
2. Materials and Methods
In “How to Study Public Life,” Jan Gehl introduces, “
The list of questions that can be asked about the interaction between life and form is essentially endless” [
19]. Although those questions are originally designed for field surveys, we propose to operationalize Gehl’s method to transform observations into quantifiable metrics. He continues, “
Every city is unique, and good observers must use their eyes,” emphasizing the importance of having eyes on the city to have a finer appreciation of the spatial and cultural complexity of a place. Only from the human scale is it possible to learn about the degrees to which people can experience the city and interact with each other and with small architectural artifacts. That said, how can we survey a large number of cities? In addition, for those cities, how can we observe and record:
How many people are present passing by every street, square, or park in one city?
Who are the people crowding or strolling by all those places?
Where those people prefer to spend their time?
What people do in each corner of the city?
How long people stay in public spaces?
Those questions can be answered through classic surveys and experts’ observations on-site, but they can hardly be implemented to survey large urban spaces and through different seasons. The method we are presenting aims to operationalize Gehl’s methodology into a quantifiable set of metrics using images taken by dwellers, becoming direct surveyors of space and activities through their personal perspectives. The five questions proposed are the means to gather the collective image of the city and quantify the hidden life of both indoor and outdoor space. To do so, we have analyzed publicly shared images from the 32 Russian monotowns on the social media platform VKontakte (later VK). The five research questions presented in our paper (Who, What, When, Why, How long) refer uniquely to the use of urban space. The ultimate goal of our methodolog-ical approach was to find a potential solution to survey urban spaces that are remote or simply too many to visit in person. The subjects of inquiry of our approach, and case study, were urban spaces, not the users. Our research was carried out by associ-ating machine- and human-generated tags (such as “indoor” or “outdoor”) with the estimated location and time of the image. No user-generated content beyond the im-age itself and the timestamp was analyzed; no information beyond the generated tag(s), approximate time bin, and estimated location was retained past the image tag-ging stage. Researchers made visual identifications on the fly by browsing images by location and time. To carry out this methodology, it was not necessary to download the images and the only three columns of data we have mapped were the tags (e.g., “indoor”), the approximate location of the image (e.g., Moskovska Square) and the time bin (e.g., early morning).
Clearly, the analytic framework is set by questions of this research, and the representative sample of the population is limited to the VK users’, but there is an intrinsic difference between interrogating social media data and classic interview, surveys, participant observations, personal mapping, softGIS, action research, and many other qualitative methods. Those all involve researchers’ direct influence in formulating questions and interviewees’ personal and professional biases [
38]. Gehl proposed his five questions for public space with the purpose of making tangible the forces that govern it.
2.1. How Many
With the first metric of how many, Jan Gehl proposes to observe the number of people walking by one street or staying in one square. This models the pedestrian flow, and it originally has been designed as a method to assess users’ preferences in public spaces and urban cores. We operationalize this metric by calculating the density of geolocated pictures as a proxy to measure the presence and preference of dwellers through the city and its peripheral region.
Similar approaches have been undertaken by calculating the number of social media active users or social media posts within a delimited area. Jiang et al. [
39] cross-referenced geotagged tweets with demographic and topological data of several showing major correspondences in distribution patterns such as building and population density. In our research, geotagged posts on VK have been utilized as weights in urban network analytics (UNA). When the use pattern of public urban space is juxtaposed with the pedestrian accessibility analyses of the underlying spatial configuration in UNA, three basic categories for each modeled unit of urban space can be distinguished: (1) under-used, (2) used as expected, and (3) used surprisingly actively. These typologies help the designer in locating interventions and finding the right tools for each situation. In stepping from analysis to intervention, Matthew Carmona’s conceptualization of the urban design process as a “place-shaping continuum” is helpful. For Carmona, urban design involves four distinct phases: (1) design; and (2) development—together shaping the physical realm for use; (3) space in use; and (4) management—together shaping the public realm through the use [
40]. We link Carmona’s phases 1 and 2 to introducing new land uses and urban elements and phases 3 and 4 to the gradual and contextual improvements of the existing situation. Carmona’s typology is not helpful, regarding the most actively used areas that do not warrant any physical change, however. For that third urban situation, we propose temporary uses as a tool to achieve positive changes, such as inviting new user groups or changing the temporal use pattern [
41,
42]. Consequently, the three types of situations and the related processes of design, use, and social innovation are characterized by different economic logics, collaborative networks, and temporalities.
2.2. Who
The question of who is presented by Gehl to map dwellers’ demographics in public space and learn which are more successful at hosting a higher mix of people through gender, age, and social groups. Through observations on site, researchers can study users’ location choices by mapping which spaces they occupy and noting down their profiles. We operationalized Gehl’s method using the categorization of prevalent gender and age of people present in public shared geolocated pictures. Successful cities are the ones that are capable of bringing together dwellers and visitors of all social and cultural backgrounds; therefore, this metric is aiming to measure the demographic blend in public space to find segregation or integration phenomena.
Social and cultural analytics using social media images have been utilized to evaluate intentionality [
16] or how to portray some current cultural rites and practices [
43,
44,
45]. Our preferable target group was the youth of the city; therefore, we focused on mapping the presence of teenagers in public space. To do so, we have manually categorized pictures portraying teenagers. We defined our reference groups as all the kids that are between 10 and 18 years old. Younger dwellers were categorized as
children and older ones as
adults. If children were accompanied by adults, those groups were categorized as
children with adults. This particular task was assigned to anthropologists who categorized images according to their abilities to capture all the characterizing elements that are distinctive to their respective age groups. Computer vision could have been used to obtain an approximate categorization of this demographic. For instance, Hu et al. [
16] and Redi et al. [
46] deploy artificial vision to categorize images by subject. However, we chose to carry it out manually since other observations for other metrics had to be carried out visually.
From the analysis of demographic maps depicting places popular by youth and adults, it became clear that youngsters are usually avoiding adults. In spatial terms, it has been observed that youth gather mostly in locations that are far from centers of urban life, transportation hubs, landmarks, and other crowded places. Those could be courtyards, unused parts of natural territories, and abandoned territories, where the control for their action is minimal.
2.3. Where
With the question where, Gehl is observing dwellers’ activity-location choice in public space to maps “where people move or stay in individual spaces” [
19]. Using geotagged photographs allows us to explore only the static component of this question. To learn what type of urban environment dwellers prefer to carry out their activities in, we are going to classify pictures whether they are taken indoor or outdoor. This categorization can be altered according to the geographic scale of the study. For analysis of small public spaces, streets, or plazas, the classification can focus on microenvironments. Pictures could be categorized based on the properties of the location in which people are gathered. Such properties can include, for example, the quality of the light: are people gathered in a bright environment or in the shadows? In the past, this approach has been suggested by Gehl.
The picture categorization process was carried out using scene recognition, one of the hallmark tasks of computer vision, allowing defining a context for object recognition. In this project, we used a scene-centric database called Places, with 205 scene categories and 2.5 million images with a category label. Examples of scene tags are attics, auditorium, badlands, ballroom, bar, and basilica. Using convolutional neural networks (CNN), the system is able to learn deep scene features for scene recognition tasks and establish new state-of-the-art performances on scene-centric benchmarks. The first step consisted of applying to all the images in our corpus the scene recognition algorithm that assigned to each photo a set of category labels with associated a confidence score. To assign to a picture the label indoor or outdoor, we first associated each scene tag with the corresponding label, e.g., a park would be associated with the outdoor label while a ballroom would correspond to an indoor scene. Then for each image, we took the three scene tags with the highest confidence score, and we assigned to the picture the corresponding label if and only if all the three labels were equal, e.g., a photo with three indoor/outdoor scene tags was tagged as indoor. In case a complete agreement was not possible, we tagged the pictures as unknown and omitted them from our sample.
In general, a mixing of indoor and outdoor activities can be considered an asset and a sign of positive urbanity. The mixing can occur in two scales: between adjacent morphological units or inside one morphological unit. In the worst case, concentrations of outdoor uses in urban parks, boulevards, and squares are ranked by active indoor uses in the neighboring urban blocks. These configurations show potential to spread indoor uses, such as restaurants or cultural events, seasonally to parks, and to enliven the economies of interior uses through pedestrian flow nearby. In the second case, the mixing can mean active yards or small kiosks in parks, features that show small-scale development opportunities for one actor, be it the municipality (parks) or a housing association (microrajons). However, active street-fronts typically require coordination between the city and shop-owners.
2.4. What
What are the activities people engage in within public spaces? Gehl’s question is aiming to map activity patterns to learn what the requirements for urban design are for hosting them adequately. We quantify this question by analyzing the variety of activity patterns observed through social media data. This is one of the main proxies to assess the perceived quality of life as the mixing of uses and activities is the hallmark of good city life together with their spatial distribution and accessibility [
47,
48]; Jacobs is also defining the variety of amenities, and consequently of human activities, as one of the four principles for good city life [
20]. She also defines cities with less specialized activities to be more resilient compared to others and likely to have better economic outputs [
34]. Through social media data, we can do that for indoor and outdoor spaces and in public and third places.
Activity patterns are analyzed through the visible content of publicly shared social media images. To do so, we are using the “activity wheel”, which extends Gehl’s dual system of necessary and optional to all its quantifiable and measurable components, unifying his work in these different approaches into one simple set of categories to map activity patterns [
49]. Activities were mapped by trained researchers by manually assigning tags to a randomized sample of 45,000 social media pictures from the 32 Russian monotowns based on the activities they can recognize in one of them. Similar to the previous metrics, computer vision has also been deployed in this field. Hu et al. [
16] also determine an activity from pictures. Again, artificial intelligence results are sometimes biased by the objectivity of the methods, as (1) one activity excludes all others, and (2) the main activity is sometimes not framed in the foreground, and (3) specifics of the activities are not always obvious. In this context, engines such as Instagram-Facebook Alt-text tags provide a list of activities “probably” being performed in the pictures uploaded to those social networks. Again, the probability of a machine identifying a person doing something might sometimes give inaccurate results (e.g., a person walking while eating can be tagged either by walking or by eating). In this case, again, we trusted the criteria of anthropologists. In a second phase of the project not reported in this article, we extended the number of pictures categorized to focus on relevant areas of interest.
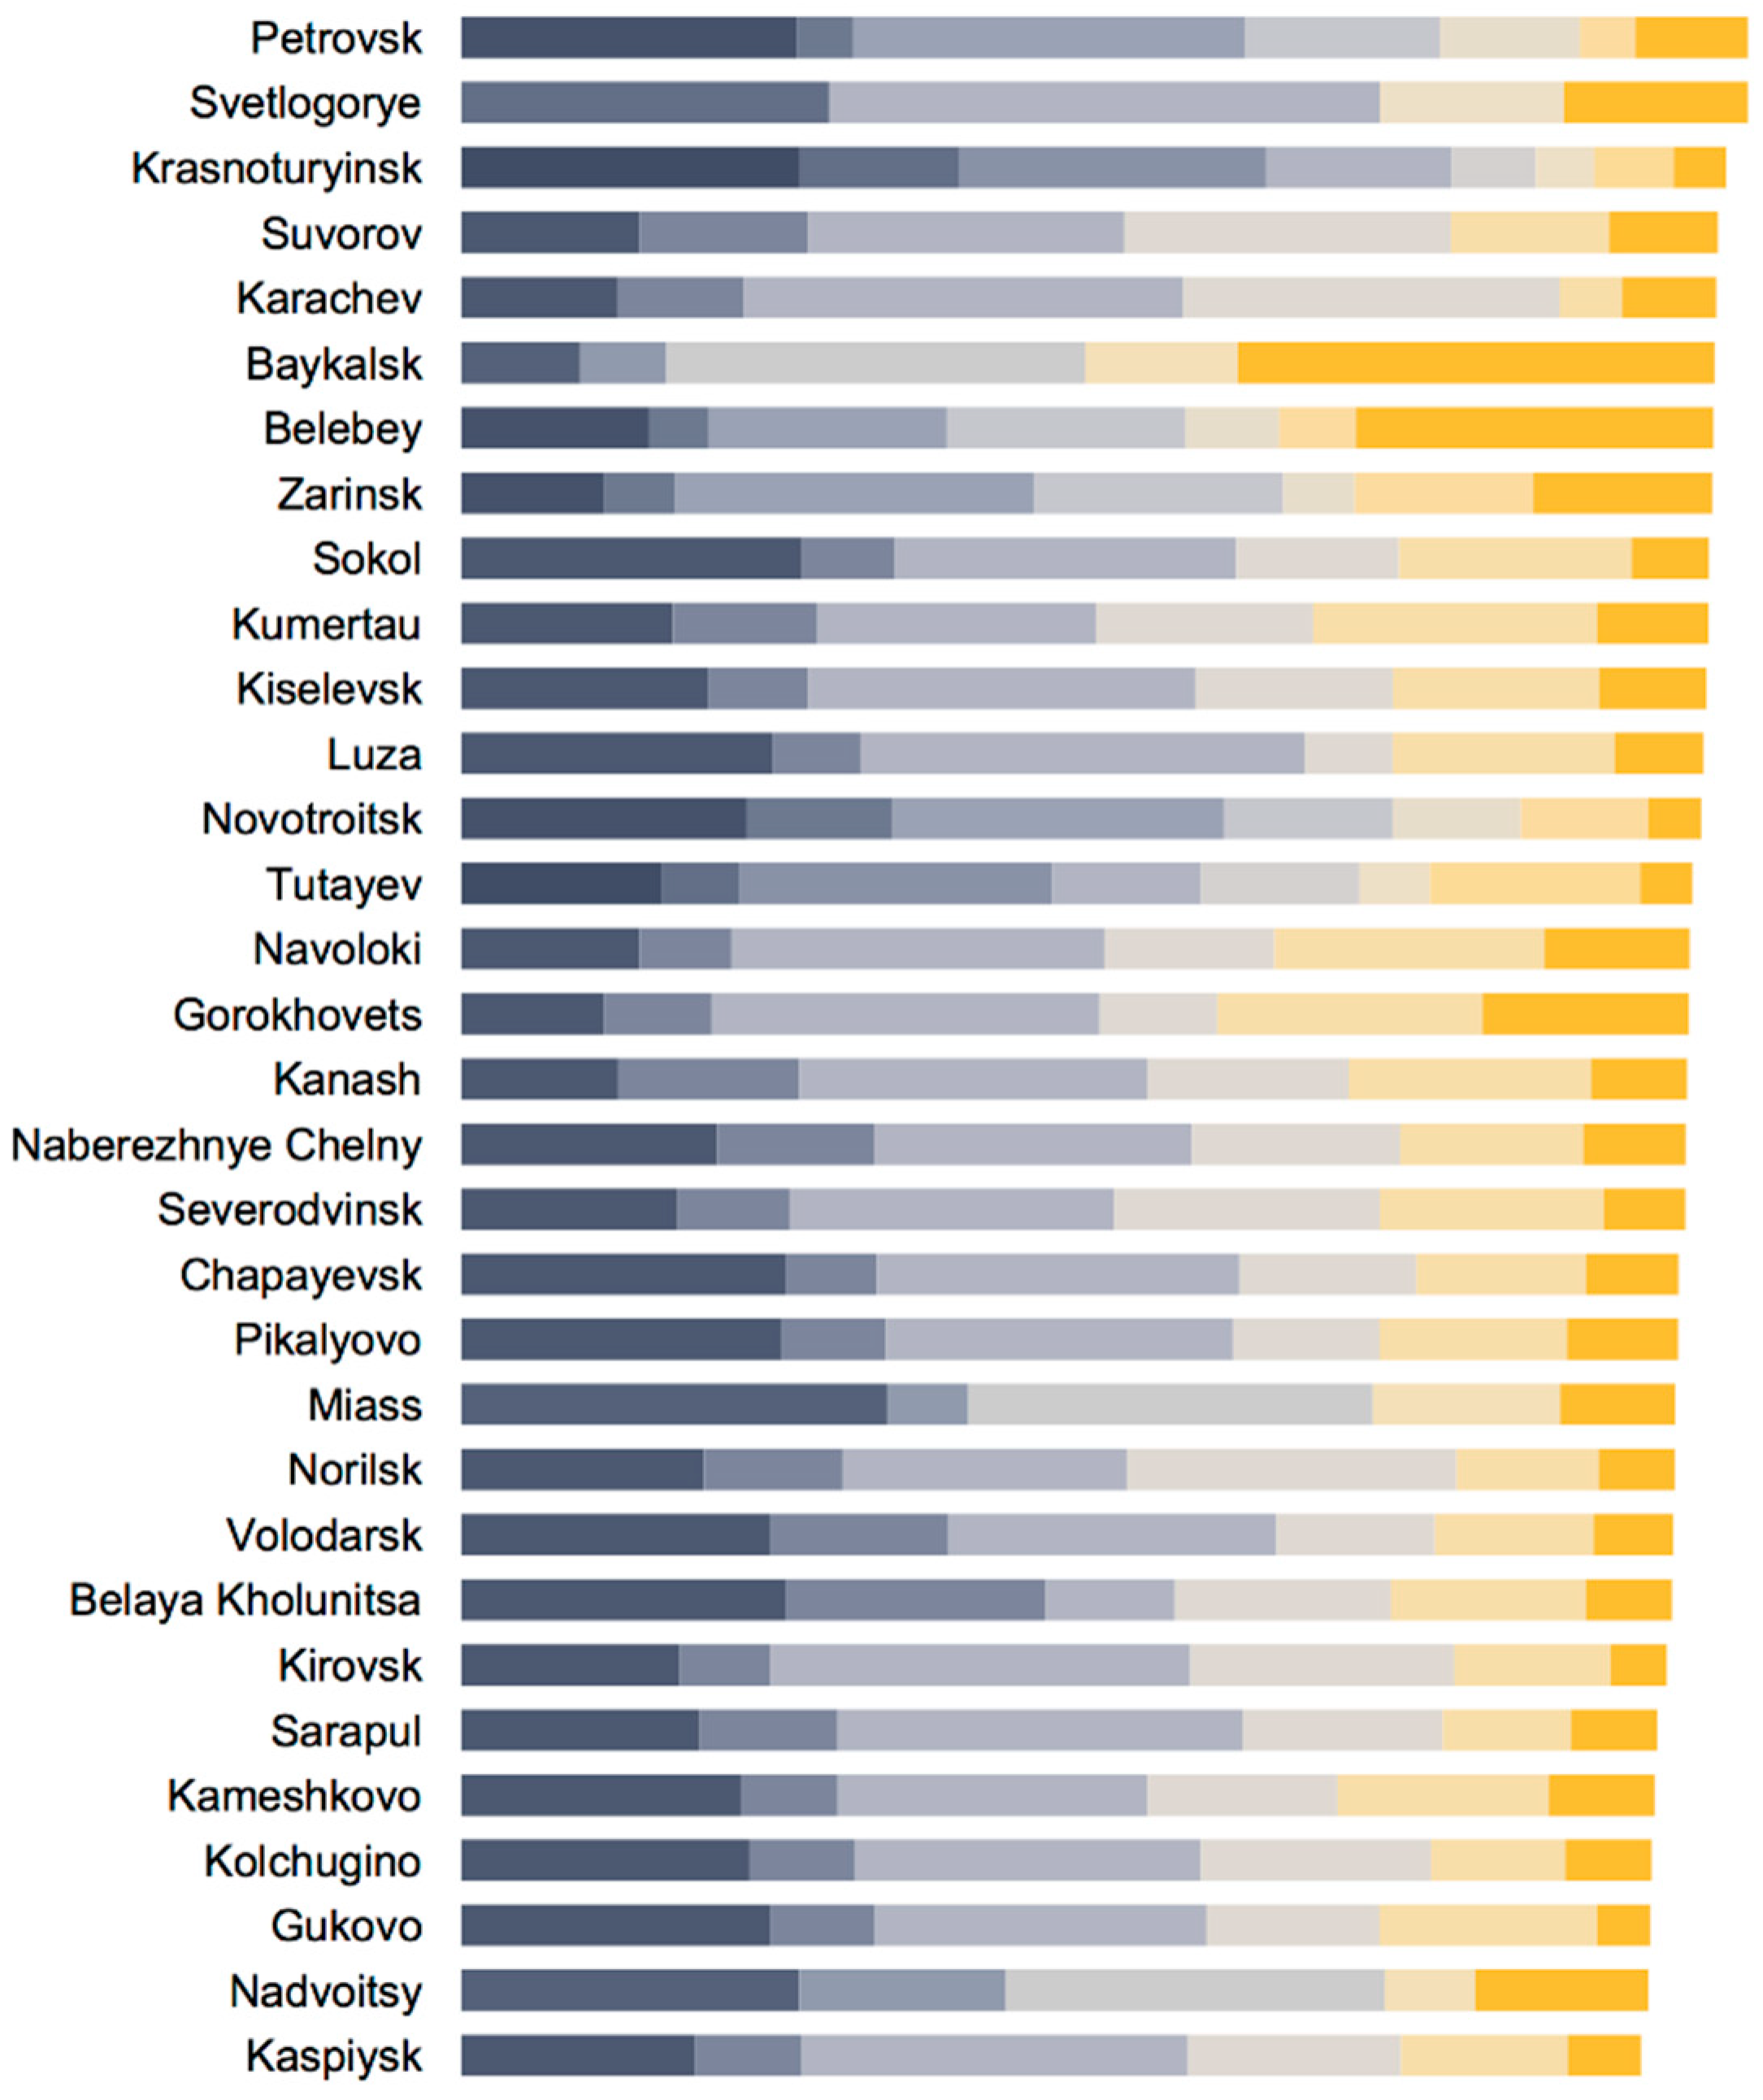
As a result of this categorization, we developed a simple metric to estimate the QoL across the cities examined and sort them in the graph above (
Figure 2). This metric favors both cities with a greater number of different reported activities and cities where the number of pictures is more uniformly distributed among the different activities there recorded. This approach correlates quality of life with the variety of activities offered by a city, favoring those cities where no single activity dominates.
This metric, M, for a given city is defined as follows:
The formula used to measure the estimated quality of life of the cities and order them in the graph (
Figure 2) is calculated as follows:
2.5. How Long
Permanence is a clear indicator of preference. The period of time spent in a certain place is a measurable parameter that describes the bonds and interactions between people and the space they inhabit. Gehl analyzes permanence in a dynamic and a static form. The first one is about measuring the lapse of time required to walk through a given place, and the second is the measurement of the duration of time one spends in a given place. They can be used together, although they can be used to study public space in different ways. The first metric describes how the environmental factor and preferences may affect human behavior by slowing or accelerating their movements, and the latter describes the duration of human activities.
With social media data, we can focus on the second metric described by Gehl as the duration or permanence of human activities. To do so, we use the timestamp of VK posts to characterize indoor and outdoor spaces based on how long they are used through the day, days of the weeks, and seasons of the year. A series of cartographies was designed to map the use of space according to days of the weeks and seasons. Those were used to perform a visual inquiry of the 32 cities at the urban scale. For instance, to study how parks were experienced through the seasons or spot the areas and districts that were active and in use throughout the week. Similar approaches to the analysis of data timestamps have been deployed, for instance, by Silva et al. [
50] and Forghani and Karimipour [
51], both emphasizing a cyclical time basis (daily, weekly, monthly, and yearly) that Cerrone [
52] later describes as “the pulse of the city”.
Jane Jacobs has stressed how the duration of activities in public space is beneficial to city life in social terms, street safety, and economic outputs. “On successful city streets, people must appear at different times. This time is considered hour by hour through the day” [
20] (p. 198). We do so by studying the temporal distribution of social media photos throughout the day. This daily probability distribution is discretized into 24 h-long time bins. To compare these time probability distributions across cities with significantly different temporal distributions and numbers of samples, we use the Kullback–Leibler (KL) divergence as a measure of the difference between each time distribution
and a corresponding uniform distribution
. For each time distribution
, the K.L. divergence
provides a measure of the entropy of the time distribution itself relative to a uniform distribution. In coding terms, the K.L. divergence can be interpreted as providing the number of additional bits required to compress
with a code optimized for
. For a discrete distribution with 24 uniform bins, this number of bits ranges from 0 (where
is uniform) to a maximum value of
.
3. Results: Urban Interventions
Architects, planners, developers, and other actors can influence the evolution of cities both through fostering new activities—such as temporary uses, events, and local activation programs—and through physical changes in urban space—such as new developments, infrastructure, and parks, or physical reconstruction and remodeling of existing structures. Some commentators distinguish these two types of intervention as “place-shaping” and “place-making” [
53], where the latter demands more monetary investment, organizational capacity, and time.
The output of this study provided local administrations across Russia with a set of guidelines to improve urban design and draft architectural competition briefs for selected sites. Later, a national co-creation platform was introduced, inviting citizens to work for their own locales and propose new ideas for collaborative vetting. In this process, resource efficiency was one important parameter, sometimes directing attention to quick and light “place-shaping” solutions.
As our role in the process was to mediate between analysis and design, we wished to enrich the place-shaping/place-making frame to better facilitate the work of expert designers and planners in reading the outputs of the five metrics and help the definition of interventions. The link between analysis and design is not simple. This relation is discussed by Carlo [
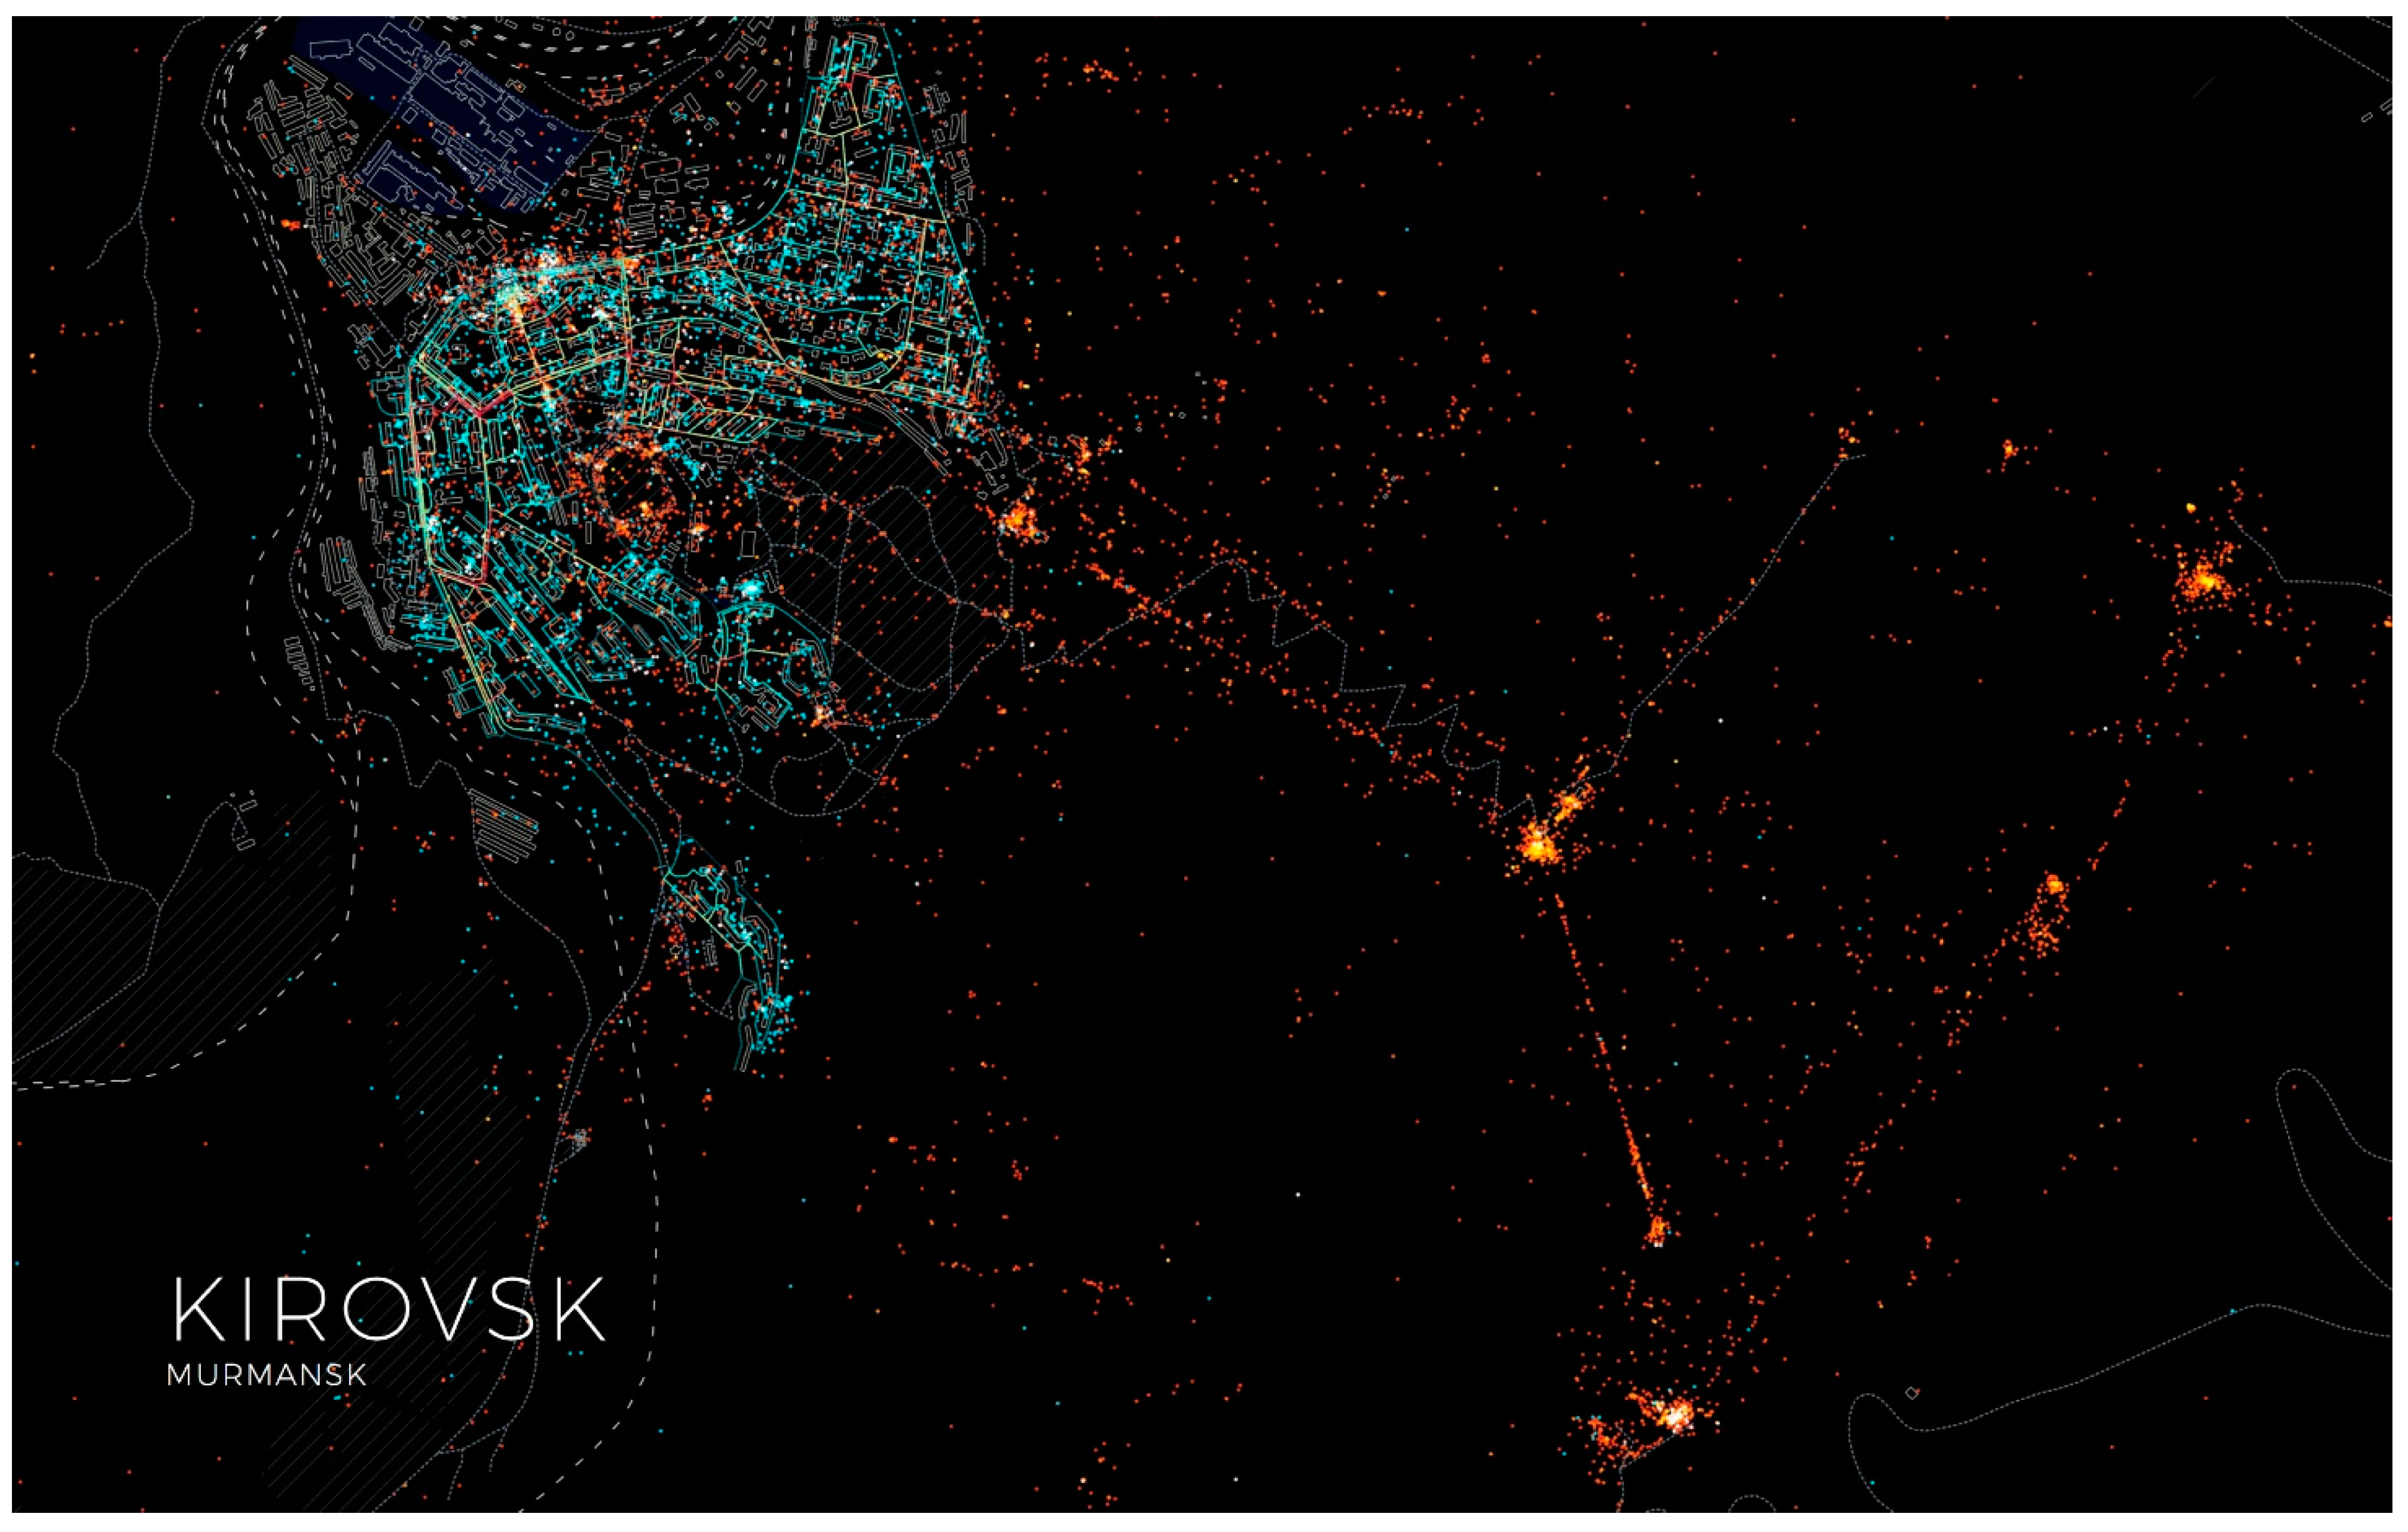
54] as two distinct “moments” in the design process, the typological moment, and the moment of invention. Our question was how to move from metrics to interventions, from analytic maps (e.g.,
Figure 3) to focused and realistic physical designs and social innovations.
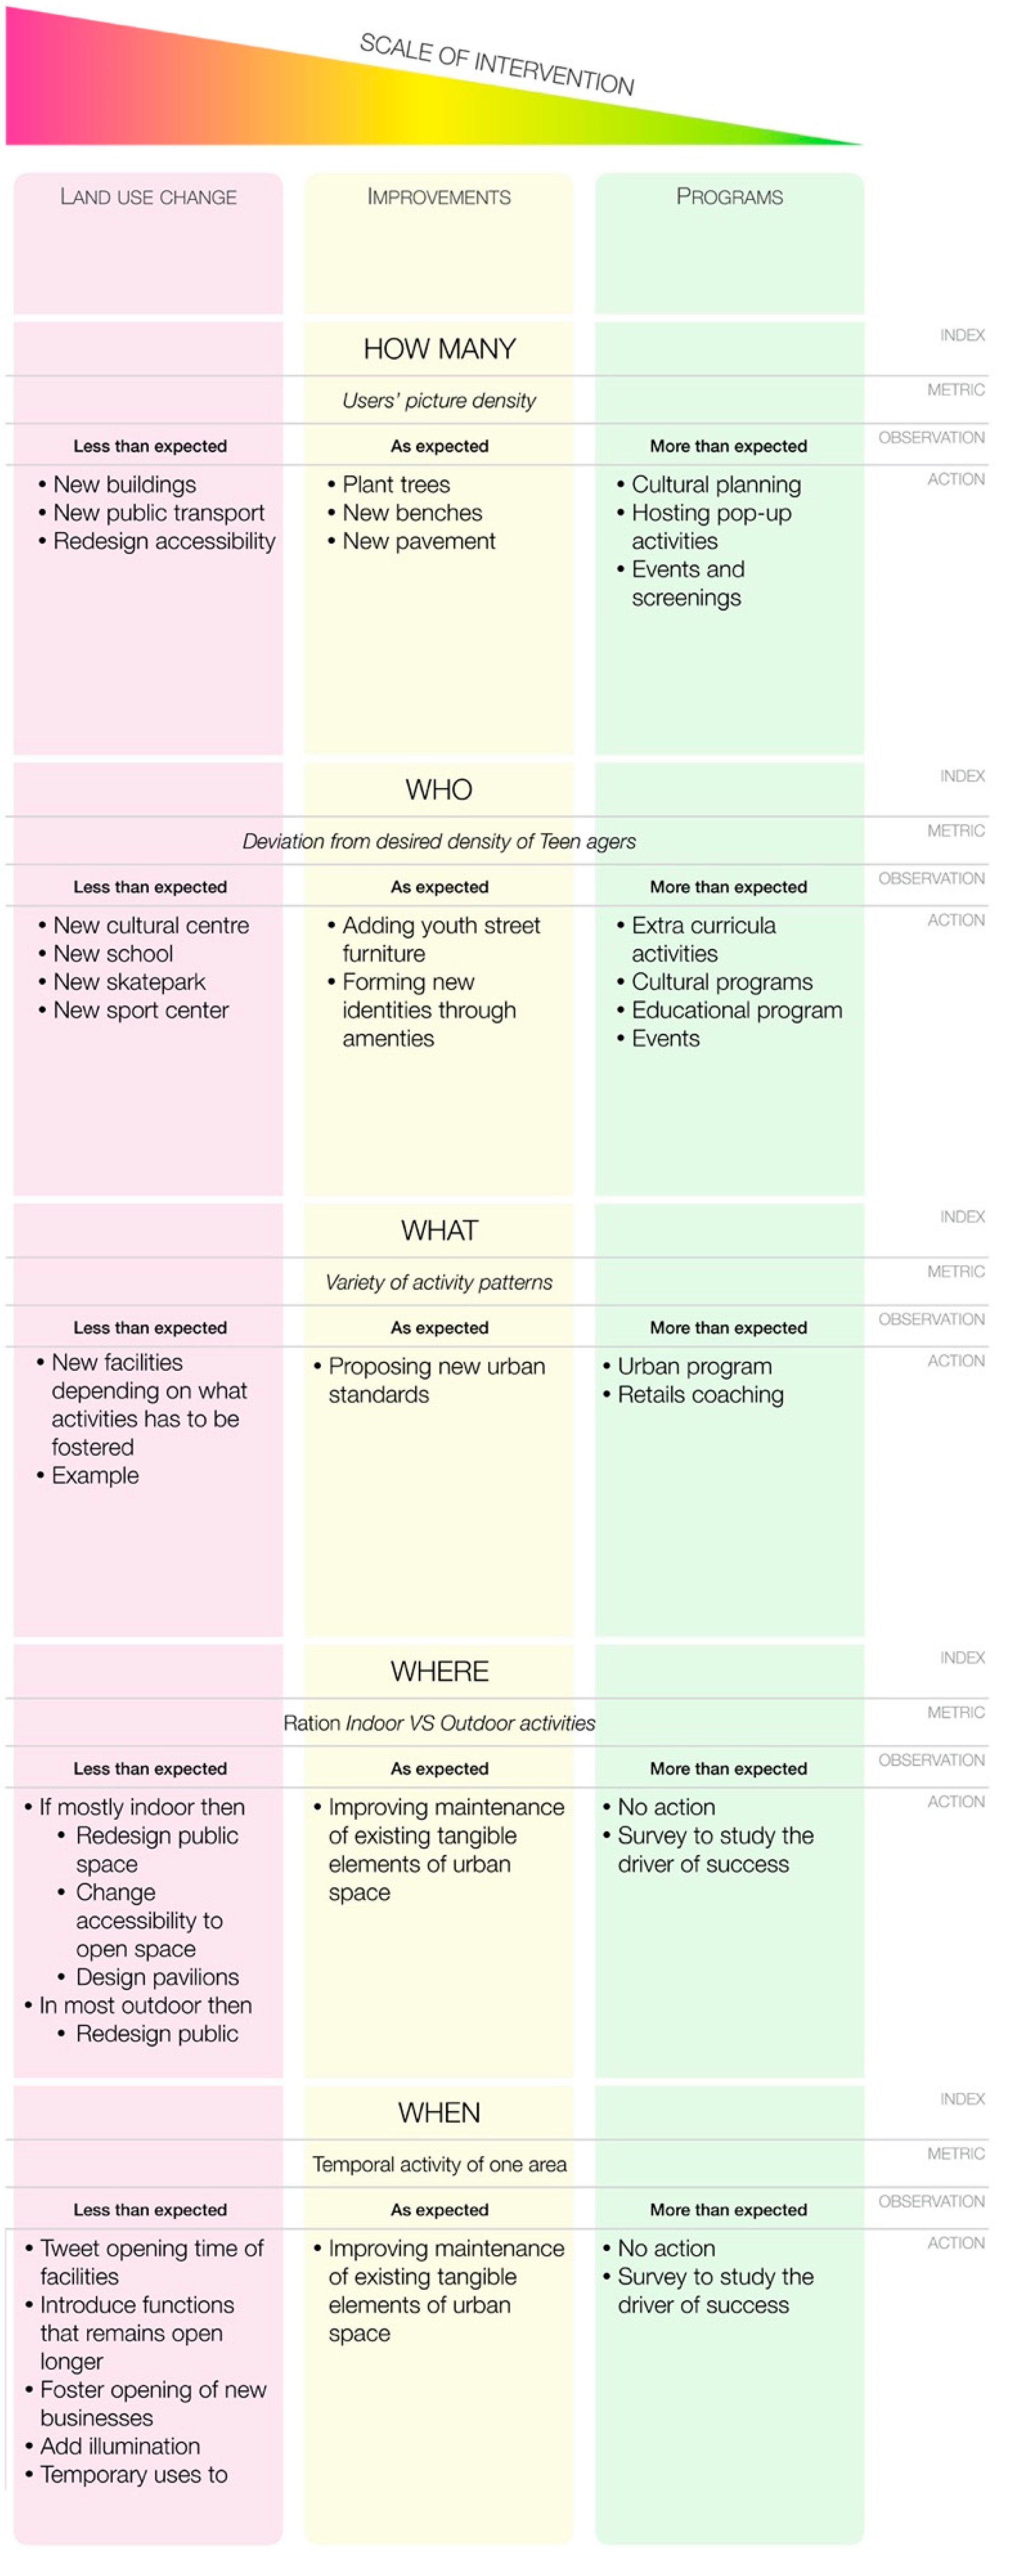
The objectivity of the patterns observed through the five questions has to reconcile and be comparable with experts’ knowledge regarding the actual spatial, social, cultural, economic, and administrative context of monotowns. To do so, we produced a matrix to interpret the results of the maps according to local knowledge and scale of intervention based on Jane Jacobs’s generators of diversity for good city life (
Figure 4). For each metric, we have three classes of intervention: for
less than expected, the metric output values are lower than the desirable ones; for as
expected, the metric output values are equal to the desired one; and for more
than expected, the metric output values are higher than the desired values. Based on the analysis of all the metrics provided, urban consultancies have defined guidelines for interventions in their areas of interest.
5. Conclusions
In the monotown study, we piloted the combination of urban network analysis (UNA) and cultural analytics of geolocated social media images and texts. This combination is valuable in linking the social media results to urban form, on the one hand, and opening paths toward partial automation of the cultural analytics, on the other. Machine learning of big visual data could potentially warrant further interesting research and tests. Despite some limitations, there is little doubt that social media provides valuable insights that cannot be replaced by any other data source.
The metrics on the quality of urban life, based on an operationalization of Jan Gehl’s classic formulations on the intensity and rhythms of the use of public space, turned out to be a step forward to approach the complex question of quantifying the quality of life. Through its use, it became noticeable that against some preconceived ideas, every monotown is unique. The analysis of the use of public space, buildings, and natural areas has given new findings in every single case. Our approach, which utilizes social media images voluntarily uploaded by citizens, has strength in shriveling the professional and cultural bias that would direct the analysis of what locals value and where they want to spend time and socialize.
We found out that youth, in general, tend to prefer two types of location: (1) the most urban and densely used parts of the city, and (2) marginal and underdefined locations near the urban core and “microrajons”, such as bridges, small forests at the edge of an estate, railway lands, and empty lots. In our sample, the “most urban or dense” means either the main street and main square (especially in Stalinist classical plans) or the “microrajons” (planned housing districts) that had the highest built density and population density in nearly every case city. In other words, youth do not go out in nature, but they tend to stay in the built area. Lack of indoor gathering places might, thus, be a problem to be addressed.
An interesting observation is that the factory of the town-forming company is, in most cases, not depicted in social media at all. Locals do not share images or other content regarding the factory. This may mean that the factory is closed and forgotten, that people do not take pictures while working, or that the connotations are negative. In few cases, however, the factory was a landscape icon, a place of exploration and excitement, or a site of renewal and new uses. In shrinking monotowns, not much can be done to reuse the factory, but in stable and growing ones, this might be an opportunity, following countless examples worldwide.
Regarding the third challenge of putting the study results in use, we can first conclude that the citizens of monotowns sent a positive signal that their place is not decaying or hopeless. On the contrary, there is a development potential in making the monotowns’ public realm better, while other policy measures (on income, housing, culture) are probably needed, as well. We believe that the analyses, done in a comparable manner for all 32 cases, have helped in focusing on the most important areas and topics in each city and starting to build on their hidden, invisible potentials. The classification of the type of intervention, inspired by Jane Jacobs’ work, did help in clarifying the scale and intensity of relevant intervention, be it place-making, place-shaping, or using the potentials for a quantum leap in urban process and quality. The societal challenge has after the original study developed further by urban consultancies as a nation-wide cocreation toolbox for improving public space.
Limitations and Further Development
The fact that the methodology was implemented in several monotowns points toward the potential replicability in other cases of similar sociocultural and morphological context, i.e., other Russian monotowns. The question of whether this approach could be universally replicated and scaled up to other types of cities outside of the Russian context must be raised.
In other countries, other applications such as Instagram or Foursquare, might be of greater relevance in the use of social media. Currently, other forms of social media data are also available in a nearly ubiquitous manner across settlements globally. In this context, the methodology presented in this paper could potentially be adapted to other data sources and formats, while keeping the overall approach to crowd-sourced data as a reliable source to be included within the process of decision making in city planning. Further development of this work could include (1) this process of adaptation considering the user profiles (personas) of each platform from a deeper sociocultural, anthropological, or ethnographical perspective, (2) the integration of machine learning for big image datasets with refined engine providing with reliable results, and (3) the inclusion of other layers of information such as socioeconomic and/or climatic constraints that could affect the livability of spaces.
The methodology presented here should not be considered as a substitute to locally collected socioeconomic data or to expert assessments in specific issues. Again, as stated in
Section 1.2, we underline the value of the methodology described here to gain a general understanding of the urban living and social dynamics, which is especially relevant when access to other kinds of data is limited.


 ,
, 


