Article

Evaluating Cultural Impact in Discursive Space through Digital Footprints

1
Digital City Science, HafenCity Universität, 20457 Hamburg, Germany
2
ANN RADAR, HafenCity Universität, 20457 Hamburg, Germany
3
CityScienceLab, HafenCity Universität, 20457 Hamburg, Germany
4
Urban Design, HafenCity Universität, 20457 Hamburg, Germany
*
Author to whom correspondence should be addressed.
Sustainability 2021, 13(7), 4043; https://doi.org/10.3390/su13074043
Submission received: 26 February 2021 / Revised: 25 March 2021 / Accepted: 29 March 2021 / Published: 6 April 2021

Abstract

:
The research presented in this paper describes an evaluation of the impact of spatial interventions in public spaces, measured by social media data. This contribution aims at observing the way a spatial intervention in an urban location can affect what people talk about on social media. The test site for our research is Domplatz in the center of Hamburg, Germany. In recent years, several actions have taken place there, intending to attract social activity and spotlight the square as a landmark of cultural discourse in the city of Hamburg. To evaluate the impact of this strategy, textual data from the social networks Twitter and Instagram (i.e., tweets and image captions) are collected and analyzed using Natural Language Processing intelligence. These analyses identify and track the cultural topic or “people talking about culture” in the city of Hamburg. We observe the evolution of the cultural topic, and its potential correspondence in levels of activity, with certain intervention actions carried out in Domplatz. Two analytic methods of topic clustering and tracking are tested. The results show a successful topic identification and tracking with both methods, the second one being more accurate. This means that it is possible to isolate and observe the evolution of the city’s cultural discourse using NLP. However, it is shown that the effects of spatial interventions in our small test square have a limited local scale, rather than a city-wide relevance.

1. Introduction

1.1. Digital Traces of Discursive Space

A notion of something beyond streets and buildings in urban space matures over modern and postmodern understandings of cities as twofold constructions assembled by tangible space and the people inhabiting it. This notion emerges with the acknowledgment of certain aspects of space, continues with the study of its role in identity formation from a psychosocial perspective [1], and expands into sophisticated socio-spatial theories. Looking at the definition of space from a multispectral perspective, its human dimension is mentioned in most descriptions. Rapoport’s [2] human–environment formulation described reciprocity in which people shape the environment, and places influence people. According to this theory, people and places cannot be conceptualized without each other; individuals construct places as a consequence of everyday social practice, and spaces have an impact on people’s cognition, behavior, identity, and the whole construction of the self [3,4,5].
This dualism between the phenomenological component of places (social, symbolic, discursive, intangible) and the formal reality of space (tangible physical elements) is addressed by several research fields that share a common standpoint: the intersection between the two. The study of cities as a set of social practices from an ethnographic perspective is based on Di Masso and Dixon’s [6] definition of place-assemblage, which recognized the intertwining and interdependence of physical space as a continuum and individual human practices, discourses, and interactions that take place on it. In this context, it is possible to extrapolate these approaches to the contemporary era, where many of these processes take place in the digital realm: a digital space constructed from a socio-discursive fabric. More in detail, Saker, and Evans [7] explored the way online data are not only a consequence of the use of space, but in many cases they also affect users’ experience of urban space by generating new interactions, creating a sense of familiarity, or modifying the way they walk through the city [8,9,10].
Several scholars acknowledge the complexity of the current approach to space at multiple levels of tangibility. The term “hybrid space” defines a combination of physical and digital spaces in such a way that activity in one entails a consequence in the other [7,11,12], making both mediators of the other [7,13,14,15]. Thanks to the data mining of geotagged data, virtual information can be accessed to understand the way spaces function from this broader perspective. In this context, Kozinets [16] uses the concept of “netnography“ to refer to a comprehensive area of research based on the digital traces of social practices. Ginzarly et al. [17] propose a framework of using digital tools based on crowd-sourced data to study urban cultural heritage. In doing so, they assume that the human-centered nature of social media data promotes the constitution of a shared heritage contained in collective memory, fostering the senses of identity and continuity. By posting images on social media as a form of cultural expression, people establish a conceptual link to “individual memory, narratives, and identity” [17] (p. 7). This approach validates research on immaterial and symbolic realms through crowd-sourced data.

1.2. Domplatz Square and SmartSquare Project

The case study on which this paper focuses is a small square and park in the core of Hamburg, Germany. The Cathedral Square (Domplatz) was the original site where the city’s first settlement “Hammaburg” built its fortress and was subsequently the center of intellectual and cultural discourse for centuries. Used as a parking lot until the last decade of the 20th century, the square has recently been transformed into an accessible park with garden areas to give the historic site its place in the city. Due to its location between the Mönckebergstraße shopping street and the business area of HafenCity, Domplatz represents a transit space. Initial observations indicate that people use the square for walking through rather than stationary activities; it is used more as a street than a plaza. With the goal of revitalizing the square and inviting people in, the German Federal Ministry of Education and Research (BMBF) funded a project to investigate the potentials of this place. Several actions and interventions have taken place in Domplatz and its surroundings, such as the implementation of a WhatsApp chatbot with an autonomous conversation bot “Hammabot”, the physical placement of information screens in buildings facing the square, or scheduling physical events as part of the citywide initiative “Long Night of the Museums” (LNDM), offering tours and talks in several museums and cultural institutions. The ultimate intention of these interventions is to increase the visibility of Domplatz as a landmark in the city’s cultural discourse.

1.3. Objectives of This Work

After the aforementioned events that took place in 2017, 2018, and 2019, the question of whether they were perceived not only by the physical visitors but also by a wider potentially asynchronous public, remained unresolved. For this reason, we raised the need to develop a methodology capable of assessing the impact of cultural interventions—physical or digital—in the discursive space of a city. Due to the unprecedented characteristics of our case, the main hypothesis raised would be the validity of the approach and the suitability of the methodology, answering the questions “Does culture have a measurable impact in the discursive space of (smart) cities?” and “Can we measure it?”. Answering these questions would not only help to increase knowledge about our particular case study space, but the methodology developed would also create a replicable set of procedures for addressing similar cases in different spatial and temporal contexts “intended to enable other public places to be revitalized later on” [18] (pp. 1–2).
Therefore, the primary goals of this work are to detect and track changes in discursive space related to digital and physical interventions, and to establish a standardized methodology for social media topic detection and topic tracking. To do so, we tested two analytic methods on Twitter and Instagram: (1) top expert-term set selection, and (2) artificial topic construction and tracking.

2. Materials and Methods

The methodology followed in this work consisted of two main sections, the preparation of data (Section 2.1) and the construction and tracking of topics (Section 2.2 and Section 2.3). The first section included collecting the data, filtering and refining them, and preprocessing according to natural language processing (NLP). After these processes were complete, the second section explained the way topics are modeled and tracked, addressing “what people talk about”. Two procedures were tested in a comparative methodology: (1) top expert term set selection, and (2) artificial topic construction and tracking. The first method models topics independently over several weeks and defines a set of relevant topics based on predefined “expert terms”. The second method creates an artificial topic that contains “expert terms,” and models subsequent topics using the parameters of the artificial topic.

2.1. Data Collection, Filtering, and Preprocessing

The database used in this work consisted of Twitter messages and Instagram posts extracted from 1 September 2017, 11:56:24 A.M., to 30 May 2019, 2:47:30 P.M.—over six million messages. These text messages were retrieved from the Instagram Basic Display API, the Instagram Graph API, and Twitter4 (available online: https://developers.facebook.com/docs/instagram-basic-display-api/ (accessed on 30 May 2019), https://developers.facebook.com/docs/instagram-api/ (accessed on 30 May 2019), and https://developer.twitter.com/en (accessed on 30 May 2019), respectively). The query criteria linked each post to the city of Hamburg by a hashtag, a location specified by the user, or by containing the word “Hamburg” within the post text.
To test our experimental methodology, the processes described in this paper were applied to a sample of “relevant weeks” when events, interventions, or implementations of solutions within the boundaries of the case-study area occurred. In addition, we added a set of “control weeks” in which no specific event took place (Table 1). Each week was treated separately as an independent data set.
After a closer look at the content of the posts, it was found that a remarkable number of them were uploaded by a reduced number of users and that the content was an automatically generated message repeated several times. Several researchers have confirmed the increasing amount of automated posts or “bots” in social media, which have generated more traffic than human posts on Twitter since 2016 [19]. Since our focus was placed on the human discursive space, posts written by bots were filtered out of the topic detection process. To do so, we set a threshold for the maximum frequency of posts per user for a user to be included in the data set. While it is true that highly engaged human users risked being excluded, it is also true that the larger goal of our research justified this bias, as the method excluded a large portion of bot-generated posts and spam, such as the weather app, job listings, and train station schedules. An alternative and more detailed method is described in the “Further Development” section below, following the work of Efthimion, Payne and Proferes [19] and considering additional variables.

2.1.1. Preprocessing Pipeline

Once the posts were retrieved from their sources and structured into independent data sets for each of the sample weeks, the data sets were preprocessed using an NLP pipeline. The preprocessing phase was a semi-supervised set of algorithms in which the textual content of each post was interpreted and pre-classified. For a correct interpretation of the content, the following sub-processes were defined within the NLP preprocessing pipeline:
  • Filtering domain-specific stopwords: Stopwords were filtered out in order to eliminate the most common terms in a language (e.g., “the”, “a”, “and”), which contain no semantic information thus have no influence on the topic identification and modeling.
  • Detection of phrases: the NLP pipeline was designed to work with words as independent entities. However, some case-specific phrases composed of more than one word were considered. To do so, a separate training process took a manually-generated set of the most common phrases expected to appear, in order to identify them as such.
  • Identification and classification of emojis and emoticons as (1) emotion or sentiment, (2) action or activity, (3) other. The first two categories were integrated within separate processes of mood extraction and activity detection.
  • Detection and grammatical categorization of “clusterable” words: following part-of-speech tagging (POS-tagging) procedures in which each term was attached to a grammatical category determined by its own definition and its contexts within the sentence.
The computational processes of the NLP pipeline output the following information from each social media post:
  • “Clusterable words”: A list of terms with semantic load and able to be clustered, and their grammatical category, i.e., adjective, verb, and noun.
  • Sentiment: Main polarity of the overall opinion—i.e., positive, negative or neutral—present in the text, extracted following standardized sentiment analysis protocol integrated into NLP.
  • Mood: Main polarity of the overall emotion—i.e., positive, negative or neutral—present in the text, extracted from a pre-set classification of emojis and emoticons extracted from the open-source library Emojipedia [20].
  • Activities: A joint list of verbs generated by POS-tagging procedures, along with the textual translation of the emojis and emoticons portraying activity or action.
  • Hashtags used in the post.
  • Language in which the text was written, filtering only English and German posts (case-specific process).
  • URLs links included in the text.
In addition, the following metadata were extracted from each post and merged with the NLP output:
  • Date and time in which the post was generated by the user.
  • Numeric ID generated as a random integer for username to ensure anonymization.
  • The social network in which the post was generated, Twitter or Instagram.

2.1.2. Topic Modeling

After all the posts were preprocessed by the NLP pipeline, topics were modeled using the “clusterable words” extracted from each post. The topic modeling process took the number of topics to be generated as input through the well-known “k-means” computational cluster generation method, where a number of output clusters “k” must be specified in advance. In order to establish a consistent and replicable methodology that can be implemented in data sets of different sizes and sources, the number “k” must be determined by a standardized procedure. To this end, a coherence analysis was performed in each data set prior to topic modeling. This analysis performed a series of correlations between different numbers of topics and the degree of coherence measured in each of them and set an average value as output. Topic coherence was measured by combining segmentation, probability estimation, a confirmatory measure, and setting a final aggregation value. The evaluation of coherence output tended to describe a curve with a distinct peak in the average aggregation value for all topics, the “coherence score” (Figure 1). The number of topics corresponding to the first peak in the coherence score was selected as the optimal number of topics “k” to extract from each data set. Topics were extracted using the Latent Dirichlet Allocation (LDA) method.

2.1.3. Expert Terms

Expert terms were domain-specific words from a semantic domain that were listed manually. Expert terms did not have a role in modeling the topics, but they were used to evaluate the relevance of the topics modeled. We evaluated posts that might be related to cultural activities by observing the presence of terms from the same semantic field such as “culture, museum, or exhibition”.
The expert terms were set by selecting the most frequent words from the book Mythos Hammaburg, a publication covering the most important cultural topics related to the spatial location of our case [21], together with a manually set list of terms related to the semantic field of culture. Both lists of terms were extended with an algorithm that used Word2Vec, a pre-trained language model on news and articles in Wikipedia. By using this model, it was possible to find at least 10 synonyms for each of the terms from the original lists and output a joint list of terms composed of (1) case-specific keywords from the book Mythos Hammaburg, (2) generic terms from the semantic field of culture, and (3) 10 synonyms for each of the words in (1) and (2). After the expansion of the terms was completed, a semi-supervised refinement process was performed in the output “expert term” list to eliminate duplicate terms.

2.2. Top Expert-Term Set Selection

This methodology was characterized by a phase in which the presence of expert terms was evaluated in each week. To this end, after preprocessing each week (Section 2.1.1, Preprocessing Pipeline) and generating the different topics posted about (Section 2.1.2, Topic Modeling), statistics on the frequency of expert terms mentioned in each week were extracted and normalized with the total number of posts per week to obtain an average ratio of expert terms per post measured for each week. The week with a higher ratio of expert terms per post was considered a “key week”—week 39 of 2018 with a ratio of 0.018 expert terms per post, measured in 45,297 posts—in which the discursive space may contain a higher number of references mentioning general cultural topics or case-specific events and spatial interventions related to Domplatz.
After a “key week” was identified, the topics generated were observed in detail. Topics with a higher ratio of expert terms per post were considered “relevant topics.” To determine the number of relevant topics to consider, a clustering procedure was performed by looking at the ratio of expert terms per post in each week separately and grouping the topics from the highest to the lowest value. The result of this calculation was three clusters, with cluster 1 being the highest ratio of expert terms per post and cluster 3 being the lowest, as shown in Table 2.
These “relevant topics” were formed by specific posts during the “key week”. Consequently, the topics in all other weeks needed to be generated again, following the definition of the “relevant topics” in the “key week”. The non-key weeks went through the topic modeling process (Section 2.1.2, Topic Modeling) using a testing algorithm in which the topics were not generated from scratch, but the properties of the topics in the “key week” were replicated to model new topics in the non-key weeks.
As a result of this second topic modeling, all weeks were standardized to the same topics, so that each topic could be identified in all weeks. The evaluation of the presence of the “relevant topics” in all weeks allowed the detection of changes in the discursive space.

2.3. Artificial Topic Construction and Tracking

This methodology consisted of creating an artificial data set of posts that were intended to contain strong topic segmentation. Artificial posts were created to intentionally contain a large number of expert terms. To do so, phrases from the publication Mythos Hammaburg were used to create an artificial data set, which combined these phrases with a sample of tweets from “control weeks” (in which no cultural events took place in our case-study area) in equal proportions. The resulting data set was preprocessed using the NLP pipeline, and topics were modeled.
This methodology generated two topics, (1) a “relevant topic” containing a majority of artificial posts generated by Mythos Hammaburg related to the case-specific cultural topic, and (2) a “non-relevant” topic generated by a majority of real posts and unrelated to our case-specific cultural topic. The same process was repeated for all control weeks (Table 3). The control week with the highest number of artificially generated posts and the lowest number of real posts from social media was considered as the “key week” (bolded in Table 3).
After identifying the “relevant topic” in the “key week”, all other weeks were standardized with the same topics by using a testing algorithm in which the characteristics of the topics in the “key week” (artificial data set) were replicated to model the topics in all other weeks. As a result, all weeks were standardized with the same two topics—one relevant and one irrelevant—so that the relevant topic could be identified in all weeks. The evaluation of the presence of the relevant topic over time was also associated with the detection and evaluation of changes in the discursive space, which allowed us to observe the activity level of the cultural topic.

3. Results

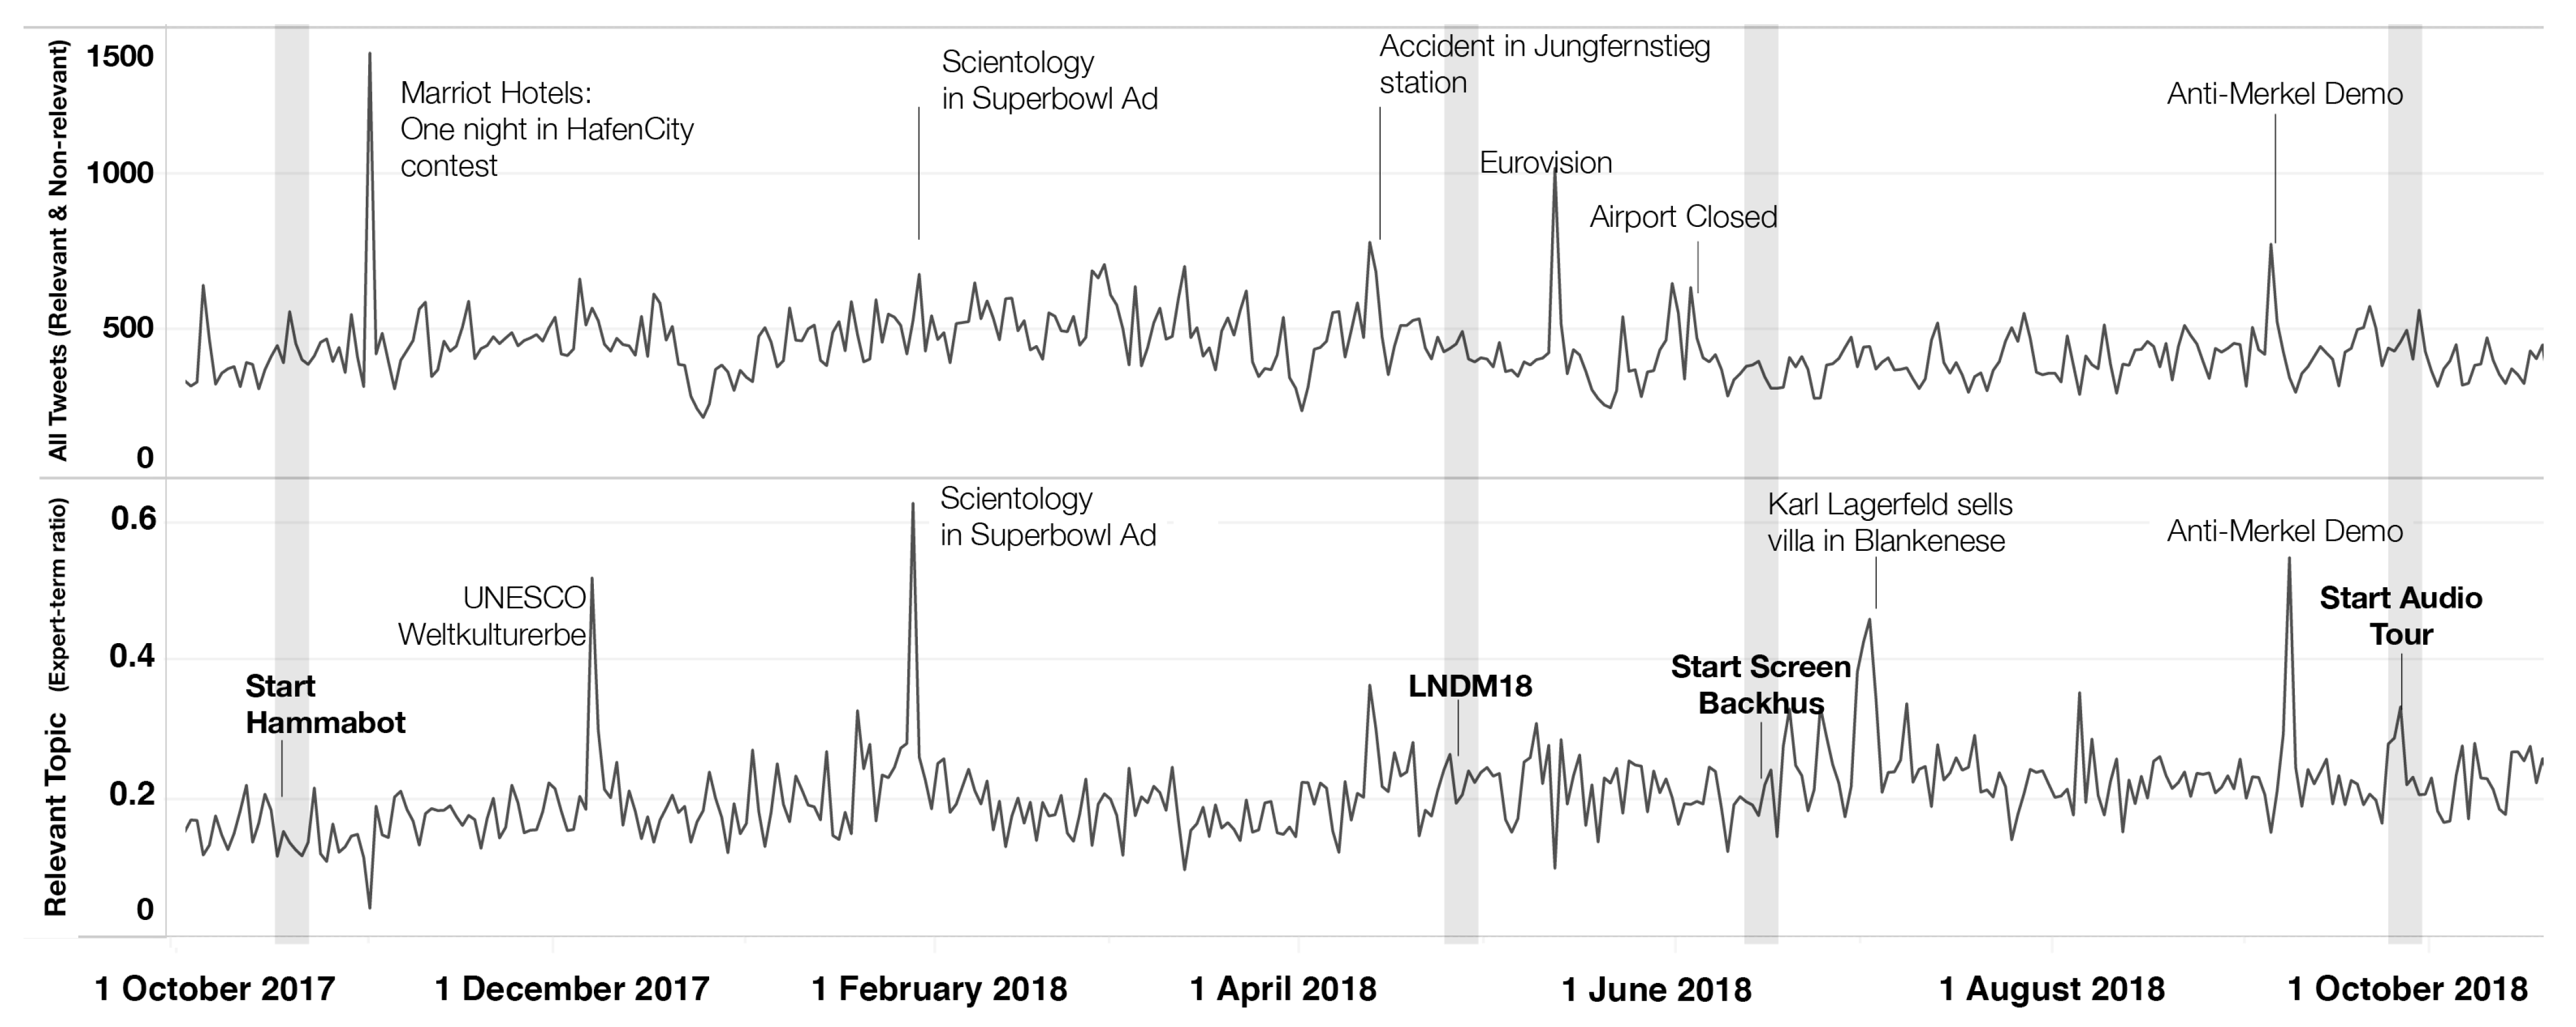
3.1. Activity in Social Media

Visualizing tweets and Instagram posts by frequency over time allowed for the detection of general activity trends without specific linkage to a particular topic: the aggregate activity of the discursive space as a consequence of physical events in the city (e.g., a marathon) and caused by immaterial actions (e.g., a TV contest). This visualization represented someone being active online during a particular period of the day, and therefore, statistics about the average activity per hour could be extracted.
Comparing Instagram against Twitter in terms of their daily activity patterns, one noticed some differences, such as (1) Twitter users started to be active earlier than Instagram users, with a sharper increase in tweets in the early morning, and (2) Twitter’s activity peak was closer to the morning hours between 9 and 11 A.M. and decreased at 5 P.M. (tweets during working hours), while Instagram users’ peak was closer to the late evening between 5 and 7 P.M. (Instagram pictures after work) (Figure 2).
The consistency of these two trends across all weeks, and their similarity to other activity studies from different disciplines, such as energy demand curves [22] or traffic congestion curves [23], indicated the validity of the data collection and cleaning methods presented in this paper from a conceptual perspective. Furthermore, social media use was associated with strong routine activity patterns, in line with Manovich’s [24] approach to social media to portraying “the everyday” rather than “the extraordinary”, which situates online social content within the narrative of mass cultural production.

3.2. Topic Detection and Validation

To validate the topic identification process, we evaluated the presence of “expert terms”, as it was independent of the topic modeling process. Following the methods described in Section 2.2 and Section 2.3, we modeled topics in a “key week” and exported the properties of those topics to the rest of the weeks, so all the weeks were standardized by containing the same topics. Therefore, all weeks contained a “relevant topic” with the highest ratio of “expert terms” per post. To validate the topic identification process, we calculated the ratio of “expert terms” in all topics of all weeks and check whether the highest ratio was defined by the “relevant topic” (Table 4).
Forty-eight topics were modeled using the “Artificial topic construction”. As explained above, these topics were marked as relevant or non-relevant. Looking at the ratio of expert terms per post, 14 of the relevant topics were successfully identified (87.5%). Only two topics identified as relevant (week 23 of 2018 and week 41 of 2017) had a lower ratio of expert terms than the non-relevant topic.
The same validation was performed with topics generated using the “Top expert-term set selection” method, with a total of 176 topics. In this case, we performed a cluster calculation in the original “key week” to determine the “relevant topics”. In this case, validation using the ratio of expert terms per post revealed that 13 of the 16 (81.25%) relevant topics were successfully identified.
In both methods, the topic generated under the label “no topic” contained the lowest percentage of expert terms per post (100%) in all cases.

3.3. Long-Term Topic Tracking

The success rate of topic identification following the “Artificial topic construction” method was over 87%. That methodology was replicated and upscaled within a single data sample of 787,550 tweets continuously from April 2017 to June 2019. By implementing the bot filtering method described in Section 2.1, we reduced the number of tweets to 271,305.
The continuous data set of 271,305 tweets was preprocessed using the NLP pipeline described in Section 2.1. Then, an artificial data sample was created with 50% of the phrases from the book and 50% random tweets, and two topics were modeled from them. These two topics were later replicated within the continuous data set, as described in Section 2.3. As a result, the relevant topic was detected within the entire time span and could be tracked as a continuous procedural unit.
The timeline graph in Figure 3 represents the continuous data sample where the number of tweets for each topic was measured, as well as the total number of tweets found in the database. It was possible to observe certain peaks standing out from the overall trend, with events such as demonstrations (e.g., Fridays for Future), cultural events (e.g., Eurovision contest, UNESCO heritage report), sports (e.g., Formula 1 preparation, Bundesliga events), etc. The gray-shaded vertical sections are located in the periods when intervention was carried out by the research team, namely the start kick-off of the WhatsApp chatbot “Hammabot”, the events and tours in the context of the Long Night of the Museums (LNDM18), the installation of an information display screen “Backhus”, and the start of an audio tour. The absence of peaks in the line “relevant topic”, during the events in the gray-shaded vertical section indicates that the effects of the interventions in Domplatz did not have an urban-scale impact in the discursive space that could be noticed.
Despite not being able to distinguish peaks in the expected interventions in Domplatz, large-scale events can easily be spotted in Figure 3. Based on the presence of peaks in the “relevant topic” line and/or the general line representing “all tweets”, it was possible to detect three types of events:
(1) Non-cultural events such as the airport being closed showed an impact on the general discourse, but not on the cultural topic. They had a citywide scale relevance and were not necessarily related to the culture. (2) Only cultural events such as the UNESCO heritage report showed a high impact in the cultural discourse (“relevant topic”) and not in the overall discursive space of the city (“number of tweets”), which indicated the strong segregation of the discussion within the cultural cluster. (3) Events with a cultural and non-cultural impact, such as the Anti-Merkel Demonstration, showed a general impact in both the cultural discourse and the general discourse, indicating that discussions on the topic were not only limited to the cultural cluster.

4. Discussion

Open and crowd-sourced data services are a popular source to describe the multiple dynamics hosted by urban spaces. A set of tools and methods in the sphere of digital urbanism are being used to theorize about the nature of cities and gain a broader understanding of places beyond their tangible topology. The present work explored two different data sources, Twitter and Instagram, aiming at gaining insights into a small-scale public open urban space and its social impact on an intangible discursive level. We defend that spaces with an exceptional symbolic load define landmarks and have a potentially major effect on the processes of identity generation and the development of a feeling of belonging to places, from individuals’ perspectives [25]. The symbolic dimension of urban spaces—and more specifically, the narratives developed around places—defines a powerful field of research that involves locations in the city and the discourses related to them. Domplatz being a square of high historical value, it is reasonable to assume that its symbolic load is equivalent: it is a landmark. Interestingly, the results described in Section 3.3. Imply the opposite, opening up the discussion on spatial symbolism of places.

4.1. Theoretical Implications

The research located in the intersection between tangible space and intangible dynamics of cities has been expanded in recent years, and this contribution adds content to the urban knowledge base. As explained in the first section of this contribution, several researchers considered cities as “hybrid” systems where the immaterial overlays the tangible. The relation between tangible and discursive spaces in the city was addressed by Zukin’s [26] “symbolic economy”, which speaks of representational agents with a symbolic load beyond the physical spatial reality. According to Lefebvre [27], social–discursive and physical spaces are merged and shape the reality of the cities. Under the perspective of Soja [28], cities are an aggregation of behavioral events accumulated in time with a major human dimension. Space is socially constructed from its use and the experiences of individuals [4,27], and from individual narratives linked to specific locations [29].
In this context, Stewart [30] studied the way the “discursive space” is a key element in space production. She claimed that discourses shape urban spaces through disruption and discussion. Through collective bargaining involving designers and the general public in active discussions, decisions are made and space is shaped accordingly. Brought by the example of fin-de-Siècle dynamics in the European context, coffeehouse discussions among intellectuals were generators of a social–discursive space, which eventually had a direct effect on physical space. In practice, urban spaces are built or modified according to what is said in public discussions, through public participation, or public consultation. In parallel, urban interventions are also assessed and criticized by the public discourse. In consequence, the physical and the discursive spaces of the city are intertwined, as one has always an impact on the other.
In this piece of research, social media data are looked at through Stewart’s prism of discursive–tangible interplay. Besides being information linked to a place in the city, the social networks utilized in this work are defined as a collection of individual perceptions, interactions, and behaviors [31]⁠ and the result of the socio-cultural practices of content-sharing that generate a certain discursive space. Underneath this theoretical approach lies the logical relation concerning research on observable variables, which enables moving forward from theorization to actual spatial analysis. Places contain social activity. Defining and observing the characteristics of this activity can provide information about socio-spatial dynamics and places themselves. In this particular research case, we focused on social activity on the discursive layers and their linkage to physical actions. In a broader context, the methodology of topic identification and tracking presented in this contribution can also be used beyond the cultural discourse of heritage places and be replicated to different topics and scales of impact. A potential field of implementation would be data mining for urban intervention assessment embedded in urban planning processes.

4.2. Implications for the Urban Practice

Social media data can contribute to the normative processes of traditional urban planning, such as the land-use definition, by matching the temporal pulse of activity in social media [32], or the identification of the main city landmarks as main hotspots of activity to characterize urban landscapes [33].
Several approaches using NLP and topic clustering methods have already been implemented in urban planning processes, specifically in public participation and consultation phases. The “Digital Participation System” (DIPAS) initiative utilizes advanced techniques to identify topics from large texts inputted from participants in the consultation about the development of an area [34,35]. The integration of NLP techniques in public consultation could also be deployed in assessing the impact of a spatial intervention by directly asking participants. However, social-media-based data inputs could be employed for curtailing the main limitations of collaborative planning and public consultation, since the main biases—the subject knowing that it is an actual subject and intending to get a certain output—are precluded by the fact that reality mining is “honest” in the sense that the sample has no knowledge of the fact of being a sample itself.
Social media data establish a link between information generated by people and the spatial context where the information is posted. Along with this technology, the integration of GPS traces in social media interactions has generated a new concept of platform beyond Website 2.0 allowing geosocial networking to empower communication and interaction features between users and between the users and the physical environment. Thus socio-spatial analytics are performed through the study of the digital traces that constitute the intangible and discursive layers of information generated by social interactions, activities, and practices overlapping the physical boundaries beyond the formal space.
Taking into consideration the aforementioned approaches to this field, it can be derived that a hybrid sociotechnical approach in urban design and development in terms of public participation and consultation is needed and should be widespread, as the combination of advanced, data-driven technology and user-centric, co-creation approaches can eminently support urban development and place-making activities. The new demands arising from the combination of data-driven urban development (information-richness, quick communication, and feedback) and a socio-psychological perspective (moderated debate, sociable setting, facilitative space) have become explicit. It is obvious that successful citizen participation depends on transparency, usability, and broad outreach, and these qualities can be easily achieved by digital means of information processing, reality augmentation, data analysis. These technologies and approaches—if seamlessly integrated—can become standards for urban planning and development.

5. Conclusions

5.1. Temporal Activity Patterns

The consistency of trends in the data and their proximity to routine pattern representations from other disciplines—e.g., household energy consumption or urban traffic flow—suggests the validity of the data collection and cleaning methods from the conceptual perspective of observing digital traces in virtual space as indicators of social dynamics occurring offline. The results show that topics can be tracked, i.e., topics detected in a data set by combining the subsequent NLP preprocessing and LDA modeling methods can be used to train an LDA model on a second data set that generates the topics of the first data set, and thus it is able to track the topics of the first data set into the second data set. By applying this train of thought to our 16 weeks, we were able to identify a cultural topic in all of the weeks and observe the presence of the cultural narrative in the discursive space of the city. Ultimately, we were able to observe its continuous evolution over time and distinguish specific events with impact in the discursive layer of urban space.

5.2. Detecting and Tracking the Cultural Discourse

The fact that culture-related events were detected as peaks, as well as the high topic detection success rate of 87.5%, indicate a successful methodology. Cultural and non-cultural events were indeed detected in either the relevant topic or the general discourse; we were able to distinguish three event categories: (1) Non-cultural, (2) Only-cultural, and (3) Events with a cultural and non-cultural impact.

5.3. Did the Interventions in Domplatz Make an Impact on the Urban Scale?

While it is true that some events with cultural value were recognized, the main objective of this work concerned the small-scale public space of Domplatz. The recognition of location-specific events that influence the discursive space of the city at urban-scale remains unresolved. As the statistics show, no distinguishable peaks are found before or after our target interventions. This fact implies that spatial interventions in Domplatz could not be detected due to their lack of impact in the discursive space of social media at the urban scale, as they are small local interventions compared to other major events (e.g., the publication of the UNESCO heritage report, citywide demonstration, or the Eurovision contest) that stand out instead.

5.4. Limitations and Future Directions

It was noticeable that although bots and automated posting services were supposed to be eliminated in a preliminary filtering step, many of them got through. Our preliminary filtering of posts generated by non-human automated machines set a maximum number of tweets posted by a single user in order for the user to be considered within our study. We also eliminated duplicate messages posted by the same user. However, we found multiple posts that contained the same text or portions of text posted by different users, implying that multiple automated posting accounts were connected under the same service. We also found that most of the messages were not repeated completely, but some text fragments (e.g., “The weather forecast for tomorrow is sunny” versus “The weather forecast for tomorrow is rainy” or “The weather forecast for today is sunny”). With deeper filtering, several complex methods can be implemented, such as Levenshtein distance (how similar text phrases are) and/or user-specific metrics, such as the number of followers versus following. Implementing deeper and more detailed cleaning of data sets prior to the NLP pipeline would significantly reduce the number of bots.
Further, a mixed approach comprising the integration of the methods described in this research within normative urban planning processes could help solve some of the biases of public consultation and public participation mentioned in Section 4.2. An integrated approach would set a new field of action in which space-makers, space-users, and stakeholders produce socio-spatial information actively, which can be merged further with data retrieved from passive digital sources, ensuring the integrity of the social information and integration in a greater level of the social source.

Author Contributions

Conceptualization, J.L.B.; methodology, K.H.; validation, J.L.B., J.B., K.H., M.N., J.A., A.W.; formal analysis, J.L.B.; investigation, J.B., K.H., M.N., J.A., A.W.; writing—original draft preparation, J.L.B.; writing—review and editing, J.L.B.; visualization, J.L.B.; supervision, J.B., K.H.; project administration, J.B.; funding acquisition, J.B. All authors have read and agreed to the published version of the manuscript.

Funding

This research was funded by the German Federal Ministry of Education and Research (Bundesministerium für Bildung und Forschung, BMBF), under the umbrella program of “Innovations for the production, services and work of tomorrow” (Innovationen für die Produktion, Dienstleistung und Arbeit von morgen, PDA Forschung für Dienstleistung), and the competition “Smart Service City” (Smart Service Stadt). The research described in this contribution was carried out as part of the project “Entwicklung und Integration smarter Dienste mittels datenorientierter dynamischer Vermessung von Plätzen und Quartieren (SmartSquare)” (Available online: https://www.produktion-dienstleistung-arbeit.de/de/projekte.php?PN=11050427 (accessed on 20 February 2021)).

Institutional Review Board Statement

Not applicable.

Informed Consent Statement

Not applicable.

Data Availability Statement

The code used in this contribution can be found in Available online: https://github.com/SvRgn/SmSqr (accessed on 20 February 2021).

Acknowledgments

Special support by the project partners Archeological Museum Hamburg (AMH), the digital network Hamburg@work, and eCulture.info. Further description of the project and a summary of the research presented in this contribution can be found in: Bley, J.; Hartkopf, K.; Niggemann, M.; Wiedenhöfer, A. SmartSquare: An Interdisciplinary Guided Tour of an Urban Testbed; BOD GmbH: Hamburg, Germany, 2020.

Conflicts of Interest

The authors declare no conflict of interest. The funders had no role in the design of the study; in the collection, analyses, or interpretation of data; in the writing of the manuscript, or in the decision to publish the results.

References

  1. Stokols, D.; Shumaker, S. People in places: A transactional view of settings. In Cognition, Social Behavior and the Environment; Harvey, J.H., Ed.; Lawrence Erlbaum: Hillsdale, NJ, USA, 1981; pp. 441–488. [Google Scholar]
  2. Rapoport, A. Human Aspects of Urban Form; Pergamon: Oxford, UK, 1977; Volume 3. [Google Scholar]
  3. Lefebvre, H. La producción del espacio. Pap. Rev. Sociol. 1974, 3, 219. [Google Scholar] [CrossRef] [Green Version]
  4. De Certeau, M. The Practice of Everyday Life; University of California Press: Berkeley/Los Angeles, CA, USA, 1984. [Google Scholar]
  5. Neal, Z.P. The Connected City: How Networks Are Shaping the Modern Metropolis; Routledge: New York, NY, USA, 2012. [Google Scholar]
  6. Di Masso, A.; Dixon, J. More than words: Place, discourse and the struggle over public space in Barcelona. Qual. Res. Psychol. 2015, 12, 45–60. [Google Scholar] [CrossRef]
  7. Saker, M.; Evans, L. Everyday life and locative play: An exploration of Foursquare and playful engagements with space and place. Media Cult. Soc. 2016, 38, 1169–1183. [Google Scholar] [CrossRef]
  8. Boyd, D.M.; Ellison, N.B. Social network sites: Definition, history, and scholarship. J. Comput. Mediat. Commun. 2007, 13, 210–230. [Google Scholar] [CrossRef] [Green Version]
  9. Humphreys, L. Mobile social networks and urban public space. New Media Soc. 2010, 12, 763–778. [Google Scholar] [CrossRef] [Green Version]
  10. Humphreys, L. Mobile social networks and social practice: A case study of Dodgeball. J. Comput. Mediat. Commun. 2007, 13, 341–360. [Google Scholar] [CrossRef] [Green Version]
  11. Sutko, D.M.; De Souza e Silva, A. Location-aware mobile media and urban sociability. New Media Soc. 2011, 13, 807–823. [Google Scholar] [CrossRef]
  12. De Lange, M.; De Waal, M. Owning the city: New media and citizen engagement in urban design. First Monday 2013, 18. [Google Scholar] [CrossRef]
  13. Campbell, S.W.; Ling, R. Effects of mobile communication. In Media Effects: Advances in Theory and Research, 3rd ed.; Bryant, J., Oliver, M.B., Eds.; Lawrence Erlbaum Associates: Mahwah, NJ, USA, 2009; pp. 592–606. [Google Scholar]
  14. Gordon, E.; Baldwin-Philippi, J.; Balestra, M. Why We Engage: How Theories pf Human Behavior Contribute to our Understanding of Civic Engagement in a Digital Era. Berkman Cent. Res. Publ. 2013, 21. Available online: http://ssrn.com/abstract=2343762 (accessed on 20 February 2021). [CrossRef]
  15. Martin, J.A. Mobile media and political participation: Defining and developing an emerging field. Mob. Media Commun. 2014, 2, 173–195. [Google Scholar] [CrossRef]
  16. Kozinets, R.V. The field behind the screen: Using netnography for marketing research in online communities. J. Mark. Res. 2002, 39, 61–72. [Google Scholar] [CrossRef] [Green Version]
  17. Ginzarly, M.; Roders, A.P.; Teller, J. Mapping historic urban landscape values through social media. J. Cult. Herit. 2019, 36, 1–11. [Google Scholar] [CrossRef]
  18. HafenCity University (HCU). Joint Project of HafenCity University Hamburg Brings Cathedral Square Back to Life. 2017. Available online: https://amh.de/en/digitales-angebot/joint-project-of-hafencity-university-hamburg-brings-cathedral-square-back-to-life (accessed on 9 October 2019).
  19. Efthimion, P.G.; Payne, S.; Proferes, N. Supervised Machine Learning Bot Detection Techniques to Identify Social Twitter Bots. SMU Data Sci. Rev. 2018, 1, 5. Available online: https://scholar.smu.edu/datasciencereview/vol1/iss2/5 (accessed on 20 February 2021).
  20. Emojipedia. Available online: http://emojipedia.org (accessed on 14 September 2019).
  21. Weiss, R.M.; Klammt, A. Mythos Hammaburg. Archäologische Entdeckungen zu den Anfängen Hamburgs; Veröffentlichung des Helms-Museums, Archäologisches Museum Hamburg, Stadtmuseum Harburg: Hamburg, Germany, 2014. [Google Scholar]
  22. Boßmann, T.; Staffell, I. The shape of future electricity demand: Exploring load curves in 2050s Germany and Britain. Energy 2015, 90, 1317–1333. [Google Scholar] [CrossRef]
  23. Ghosh, B.; Basu, B.; O’Mahony, M. Analysis of trend in vehicular traffic flow data by wavelets. In Proceedings of the IET Irish Signals and Systems Conference (ISSC), Dublin, Ireland, 28–30 June 2006; pp. 415–419. [Google Scholar] [CrossRef]
  24. Manovich, L. The practice of everyday (media) life: From mass consumption to mass cultural production? Crit. Inq. 2009, 35, 319–331. [Google Scholar] [CrossRef]
  25. Carpio-Pinedo, J. La producción de identidad de los nuevos desarrollos urbanos a través del place-based social big data: Los crecimientos del área metropolitana de Madrid durante la burbuja inmobiliaria (1990–2012). EURE 2020, 47, 5–28. (In Spanish) [Google Scholar] [CrossRef]
  26. Zukin, S. Space and symbols in an age of decline. In Re-Presenting the City; King, A.D., Ed.; Palgrave: London, UK, 1996; pp. 43–59. [Google Scholar]
  27. Lefebvre, H. The Production of Space; Wiley: Hoboken, NJ, USA, 1974. [Google Scholar]
  28. Soja, E.W. The spatiality of social life: Towards a transformative retheorisation. In Social Relations and Spatial Structures; Gregory, D., Urry, J., Eds.; Palgrave: London, UK, 1985; pp. 90–127. [Google Scholar]
  29. Schwartz, R.; Halegoua, G.R. The spatial self: Location-based identity performance on social media. New Media Soc. 2015, 17, 1643–1660. [Google Scholar] [CrossRef] [Green Version]
  30. Stewart, J. Public Speaking in the City: Debating and Shaping the Urban Experience; Palgrave Macmillan: London, UK, 2009. [Google Scholar]
  31. Manovich, L. Cultural analytics, social computing and digital humanities. In The Datafied Society: Studying Culture through Data; Schäfer, M.T., van Es, K., Eds.; Amsterdam University Press: Amsterdam, The Netherlands, 2017. [Google Scholar]
  32. Frias-Martinez, V.; Frias-Martinez, E. Crowdsourcing Land Use Maps via Twitter. Workshop on Data Science for Social Good, 20th ACM SIGKDD Conference on Knowledge Discovery and Data Mining. 2014. Available online: http://citeseerx.ist.psu.edu/viewdoc/download?doi=10.1.1.434.1641&rep=rep1&type=pdf (accessed on 20 February 2021).
  33. Frias-Martinez, V.; Soto, V.; Hohwald, H.; Frias-Martinez, E. Characterizing urban landscapes using geolocated tweets. In Proceedings of the 2012 International Conference on Privacy, Security, Risk and Trust and 2012 International Conference on Social Computing, Amsterdam, The Netherlands, 3–5 September 2012; pp. 239–248. [Google Scholar]
  34. Lieven, C.; Lüders, B.; Kulus, D.; Thoneick, R. Enabling digital co-creation in urban planning and development. In Human Centred Intelligent Systems; Zimmermann, A., Howlett, R.J., Jain, L.C., Eds.; Springer: Singapore, 2021; pp. 415–430. [Google Scholar]
  35. Thoneick, R. Integrating online and onsite participation in urban planning. Int. J. E-Plan. Res. 2021, 10, 1–20. [Google Scholar] [CrossRef]
Figure 1. Coherence score (vertical axis) against number of topics “k” (num_topics, horizontal axis). Evaluation in tweets posted during week 42 of 2017 (a), computed for up to 100 topics, and week 43 of 2018 (b), computed for up to 140 topics. Source: Authors.
Sustainability 13 04043 g001
Figure 2. Average activity levels by the hour of the day in Twitter (a) and Instagram (b) in Hamburg (Source: Authors).
Sustainability 13 04043 g002
Figure 3. Evaluation of tweets following an upscaled continuous approach, showing a sample of tweets from 1 October 2017 to 1 October 2018.
Sustainability 13 04043 g003
Table 1. Selection of sample weeks and general post statistics.
WeekEventTotal Social Media PostsHuman-Generated %
Week 41—2017Hammabot 122,21872.06%
Week 42—2017Hammabot45,62680.99%
Week 23—2018Scr.2 Backhus82,40465.24%
Week 24—2018Scr. Backhus83,46963.19%
Week 38—2018Audio Tour90,78760.63%
Week 39—2018Audio Tour58,16188.73%
Week 13—2019Scr. Bürgerstiftung70,61885.25%
Week 14—2019Scr. Bürgerstiftung68,34485.13%
Week 20—2019LNDM 361,36984.84%
Week 11—2018(control week)126,64766.65%
Week 43—2018(control week)853661.55%
Week 45—2018(control week)811164.73%
Week 21—2019LNDM29,31483.05%
Week 44—2018(control week)798560.59%
Week 16—2018LNDM82,50869.12%
Week 17—2018LNDM82,61666.73%
1 Automatic conversation bot deployed in Whatsapp. 2 Info screen installed. 3 “Lange Nacht der Museen” a series of cultural events taking place during nighttime.
Table 2. Relation of expert terms and number of posts in the “key week” week 39 of the year 2018.
TopicNumber of PostsNumber of Expert TermsRatio of Expert Terms/PostRelevance Cluster
170704906.93%2 (relevant)
23616300.83%3
329152307.89%1 (relevant)
42666160.60%3
56018140.23%3
6328610.03%3
7261300.00%3
83190180.56%3
9178720.11%3
10183850.27%3
No Topic10,29810.01%3
Table 3. Summary of messages by week, and topic in which they are modeled. The relevant topic was expected to gather more artificially generated posts since they are created from a text with a strong cultural discourse.
Topic 1—RelevantTopic 2—Non-RelevantNo Topic
Social MediaArtificially GeneratedSocial MediaArtificially GeneratedSocial Media
Week 11—20185620725126186
Week 4320182214551961428
Week 45—20182324391803057
Table 4. Sample of results displaying the ratio of expert terms per post in relation to the relevance of the topics extracted following the method “Artificial topic construction”.
SourceReference Week to Model AgainstTopicNumber of PostsNumber Expert TermsRatio of Expert Terms/PostRelevant is Highest
week2018-11artificial-week2018-43Relevant28,3215541.96%TRUE
week2018-11artificial-week2018-43Non-relevant23,8081420.60%
week2018-11artificial-week2018-43No Topic20,756180.09%
week2018-16artificial-week2018-43Relevant23,40517487.47%TRUE
week2018-16artificial-week2018-43Non-relevant14,10010.01%
week2018-16artificial-week2018-43No Topic12,27640.03%
week2018-17artificial-week2018-43Relevant19,8476863.46%TRUE
week2018-17artificial-week2018-43Non-relevant16,9413972.34%
week2018-17artificial-week2018-43No Topic11,398130.11%
week2018-23artificial-week2018-43Relevant19,1733261.70%FALSE
week2018-23artificial-week2018-43Non-relevant16,5503992.41%
week2018-23artificial-week2018-43No Topic10,96320.02%
Publisher’s Note: MDPI stays neutral with regard to jurisdictional claims in published maps and institutional affiliations.

