Article

Evaluation of Rainfall Interception by Vegetation Using a Rainfall Simulator

by
Thiago Augusto Mendes
1,2,*,
Roberto Dutra Alves
3,
Gilson de Farias Neves Gitirana, Jr.
3,
Sávio Aparecido dos Santos Pereira
1,
Juan Félix Rodriguez Rebolledo
4 and
Marta Pereira da Luz
5,6
1
Federal Institute of Education, Science and Technology of Goias, Aparecida de Goiânia 74968-755, Brazil
2
School of Engineering, Pontifical Catholic University of Goias, Goiânia 74605-010, Brazil
3
School of Civil and Environmental Engineering, Federal University of Goias, Goiânia 74605-220, Brazil
4
Department of Civil and Environmental Engineering, Technology College, University of Brasilia, Brasília 70910-900, Brazil
5
Eletrobras, Furnas Centrais Elétricas S.A., Aparecida de Goiânia 74923-650, Brazil
6
Industrial and Systems Engineering Postgraduate Program (MEPROS), Pontifical Catholic University of Goias, Goiânia 74605-010, Brazil
*
Author to whom correspondence should be addressed.
Sustainability 2021, 13(9), 5082; https://doi.org/10.3390/su13095082
Submission received: 30 March 2021 / Revised: 17 April 2021 / Accepted: 21 April 2021 / Published: 1 May 2021
(This article belongs to the Special Issue Applications of Complex System Approach in Project Management)

Abstract

:
Interception by vegetation is one of the main variables controlling hydrological and geo-environmental problems such as erosion, landslides and floods. Interception, along with precipitation and evapotranspiration, is required for the modeling of infiltration, percolation and runoff. Unfortunately, the measurement of interception in the field is time consuming, burdensome and subject to testing parameters with relatively high variability. In this context, experiments using rainfall simulators (RSs) have the potential to provide an alternative approach that addresses most of the limitations of field experiments. This paper presents a new approach to evaluate interception that combines a RS and the monitoring of the wetting front using pore-water pressure instrumentation at specific locations of the specimen. Two specimens are required, one with and another without vegetation. The proposed approach was applied to Paspalum notatum (bahiagrass) and a tropical soil. The results indicated an average interception of 5.1 mm of the simulated rainfall for a slope at 15 degrees, rainfall intensity of 86 mm h−1, and duration of 60 min. Furthermore, the vegetation decreased the surface runoff that contributes to erosion. The proposed method will enable studies on the interception mechanisms and the various involved variables, with benefits to the modeling of soil-vegetation-atmosphere interaction.

1. Introduction

The urbanization and growth of cities and the accelerated development of areas destined for agribusiness lead to alterations in the hydrological cycle. These changes are due to several factors, such as the reduction of the flora, the planting of non-regional species, the impermeabilization of the ground surface, and the exposure of bare soil to precipitation [1,2,3]. The resulting decrease in the infiltration rate and corresponding increase in surface runoff leads to floods, landslides, erosion, and silting. In this context, rainfall interception by vegetation plays a positive role, as it reduces the degree of saturation of the soil and the infiltration rate in the deeper layers of the soil without the negative impact of runoff [4,5]. Vegetation and its roots produce cohesion and additional shear strength of the soil, increasing soil suction due to loss of water by evapotranspiration [6,7]. It is important to note that interception is also dynamically associated with other hydrological phenomena, such as evaporation, evapotranspiration, and water uptake by plants through their root systems [8,9,10].
Interception is defined as the capacity of vegetation, litter, and rocks—among other elements—to retain rainfall, thereby reducing the amount of water that effectively reaches the soil surface. This definition implies that interception must return to the atmosphere by evaporation. Interception may reduce infiltration and retard the onset of runoff [3,4,5,7]. Rainfall interception by trees can be influenced by the shape of the vegetation cover, the leaf area, and the type of the tree bark [4,5,8,11,12]. It is generally acknowledged that interception reduces surface runoff and erosive processes [5,13,14]. Unfortunately, most studies of interception have focused in arboreous species. Regarding the few studies on the interception of grasses, it is worth mentioning that this phenomenon has been studied considering different rainfall intensities [15], that evaporation and interception in forests has been found to be greater than in grasslands [16], and that the interception of grasses also retards the surface runoff and erosion processes [10].
Interception may be measured in the field and in the laboratory. Field testing results can be more representative in terms of scale factor; however, these experiments are time consuming, the installation and setup of the instrumentation are burdensome, and many testing variables cannot be controlled because they are dependent on the weather conditions [6,17,18,19,20,21,22]. Because of the difficulties associated with field experiments subjected to natural rainfalls, the use of rainfall simulators (RSs) has become an attractive alternative, allowing the evaluation of interception, infiltration, runoff, erosion, and sediment transport, including the effect of vegetation [17,23,24,25,26]. Rainfall simulators yield controlled artificial rainfalls with adjustable duration, intensity, and surface slope.
The solution of Richards’ equation for the analysis of water flux in porous media may be combined with appropriate boundary conditions and sinks to represent infiltration, evapotranspiration, surface runoff, and interception [27,28,29,30,31,32]. Unfortunately, the consideration of rainfall interception in water flux simulations is not common, as it involves many complex variables. The approach presented by [33], for example, was based on a constant storage value converted to a flux rate based on the daily interception using the average number of daily precipitation events. Another implementation of interception in water flux analyses was presented by [34], who analyzed a constant storage value in combination with a fraction of the total rainfall lost by evaporation. The disagreement regarding the ideal representation of interception may be in part due to the fact that there is limited experimental information supporting the existing models.
This paper aims to introduce a new method for the measurement of interception, based on the use of the RS presented by [7,35], the use of pore-water pressure instrumentation, and the combination of data from tests with and without vegetation. The proposed method is used herein to quantify interception for the Paspalum notatum (bahiagrass), which is commonly used in land protection in Brazil.

2. Materials and Methods

2.1. Location, Soil, and Vegetation

The soil used in this study was collected in the southeast region of the city of Goiânia, Goiás, Brazil (Figure 1). This material was previously studied by several authors [36,37,38,39,40]. Disturbed and undisturbed samples were collected in August 2018, during the dry season, between 0.0 and 0.5 m in depth. For undisturbed samples taken from the ground surface, the native grass vegetation (Paspalum notatum) was preserved in order to allow the evaluation of the saturated hydraulic conductivity in the soil’s natural state, including the influence of its roots. Disturbed samples were used in the production of additional remolded specimens, as described later on.
Table 1 presents the dry unit weight ( γ d ), unit weight ( γ ), specific gravity (Gs), porosity (n), liquid limit (wL), plastic limit (wP), plasticity index (PI), and pH of the soil used. Both the dry unit weight and the unit weight shown in Table 1 are representative of average values found in the field, between 0 and 2.0 m in depth [7].
The high content of gibbsite, kaolinite, and iron and aluminum oxides, along with its acidic state, is characteristic of oxisols from the region. The soil is also classified as a low-plasticity clay (CL) according to the Casagrande plasticity chart.
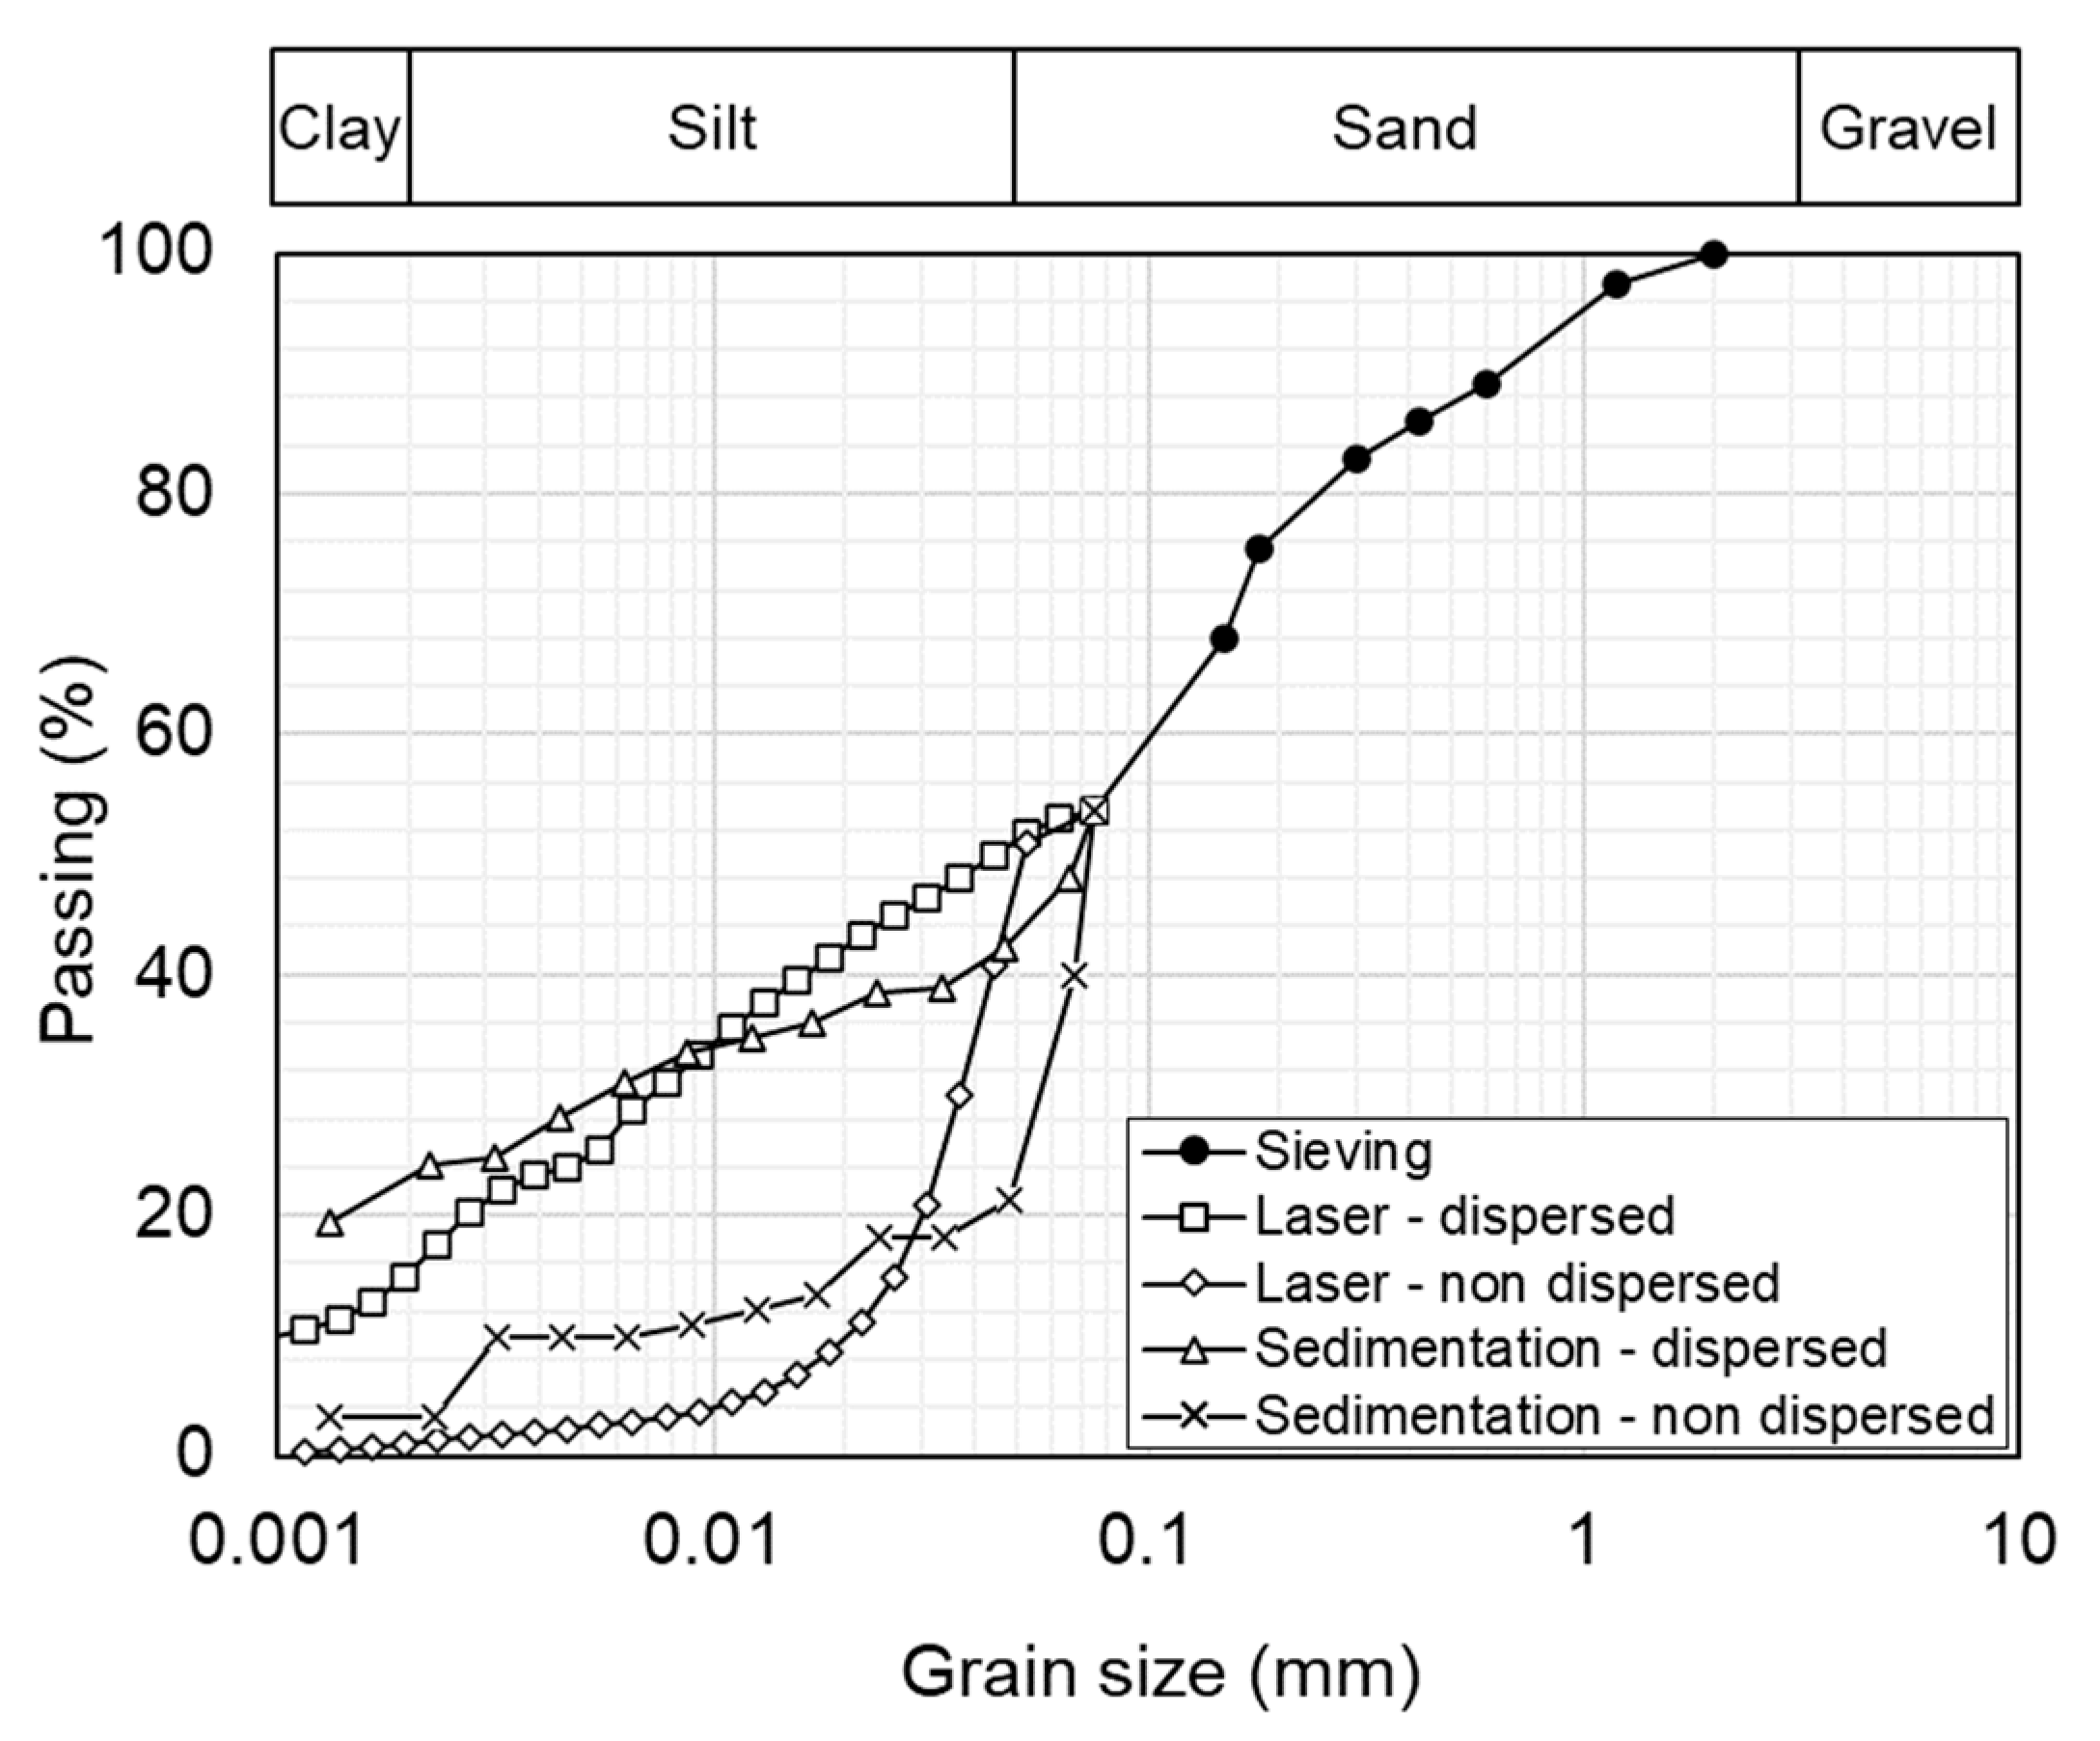
The particle-size distribution curve (Figure 2) was measured in accordance with [39] using the hydrometer and laser diffraction techniques. Samples were evaluated with and without dispersion, resulting in a silty sand with varying clay contents. When the soil is not physically or chemically dispersed, the clay fraction forms aggregations that are characteristic of highly weathered tropical soils. The difference between the dispersed and non-dispersed curves in Figure 2 is approximately 20% and corresponds to the clay aggregations that are identified as silts. This behavior explains the high coefficient of permeability of the soil in its natural state, as will be discussed later.
The studied grass species was Paspalum notatum, commonly known as bahiagrass. The grass was planted 7 months prior to testing, and no fertilizers were used. Paspalum notatum is often used for the protection of slopes of earth fills and earth dams and on the surface of roadcuts. This grass species requires low maintenance and can adapt to several types of soil and climate. At the time of testing, the grass had a fully developed root system and an average height of 30 cm.

2.2. Rainfall Simulator Tests

In situ studies allow the evaluation of representative conditions of the surface and subsurface, but they are expensive and time consuming. Physical models built in the laboratory are cheaper and enable testing under well-controlled environments. However, difficulties related to scale factor may arise. Many devices have been developed and used to evaluate infiltration and runoff [7,41,42,43,44,45], but only a few studies use physical models to evaluate the interception phenomena.
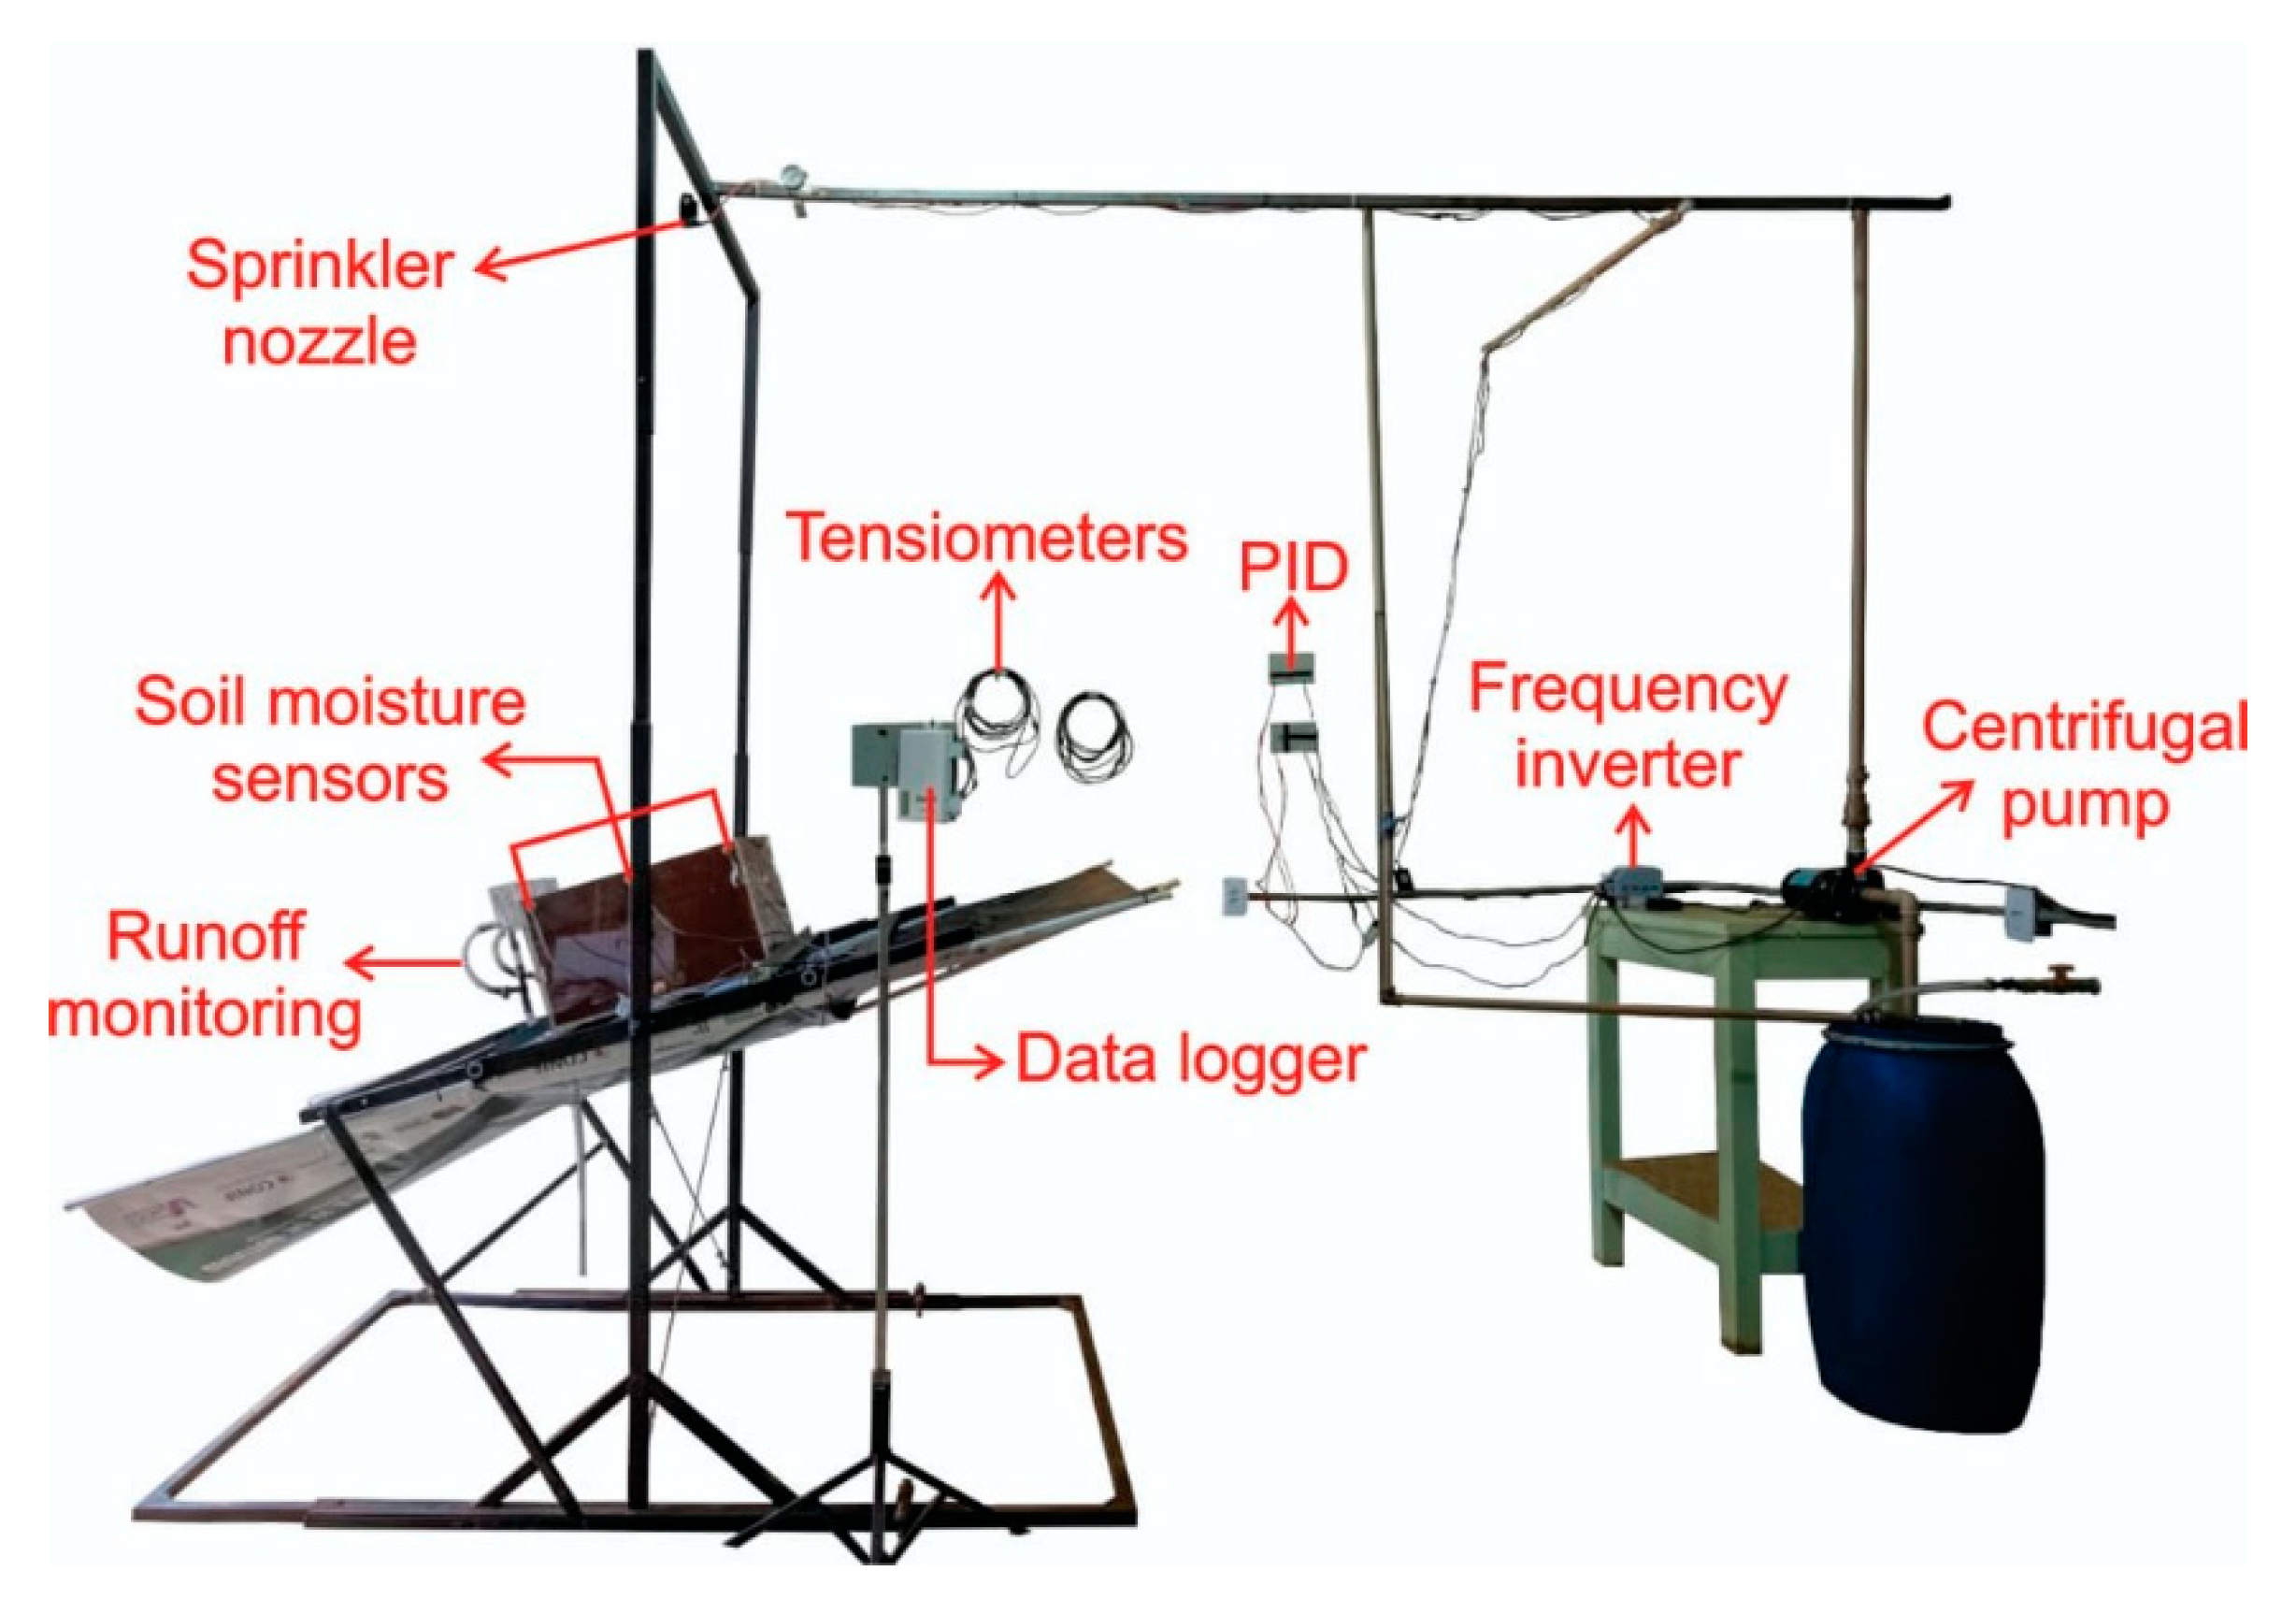
In this context, this study used the RS developed by [7,41], which was designed to evaluate the infiltration and runoff of unsaturated specimens with or without vegetation (Figure 3). This RS allows the control of the intensity, size, and uniformity of the simulated raindrops applied to specimen, with different dimensions and inclinations. It also allows the monitoring of the volumetric water content, matric suction, surface runoff, and water balance. The RS is capable of applying rainfall intensities between 86.0 and 220.0 mm h−1 over areas less than 1.0 m2. In typical conditions, the system allows the simulation of return periods between 10 to 100 years. The main variable used to evaluate the performance of the developed RS is the uniformity coefficient of Christiansen (CUC), which is defined based on the spatial and time distribution of the volume of raindrops over the specimen surface [43]. The RS employed herein presents CUC values higher than 70%, as recommended by Sousa Junior et al. and Minguntanna [43,46].
The RS instrumentation and data acquisition system are responsible for storing the soil parameter data before, during, and after the rainfall tests. For the monitoring of the volumetric water content (VWC) in the soil, five soil moisture sensors, model EC-5 (Decagon Devices, Pullman, USA), were used, allowing the measurement of a volume of influence of 0.3 L and a measurement capacity ranging from 0 to 100% in saturated soils and from 40 to 60% for other types of soils [47]. The pore-water pressures and, consequently, the matric suctions were monitored using five mini tensiometers, model T5 (USM, Munich, Germany), measuring pore-water pressures ranging from −100 to +100 kPa, and data logger model GP2 from Delta-T Devices [48].
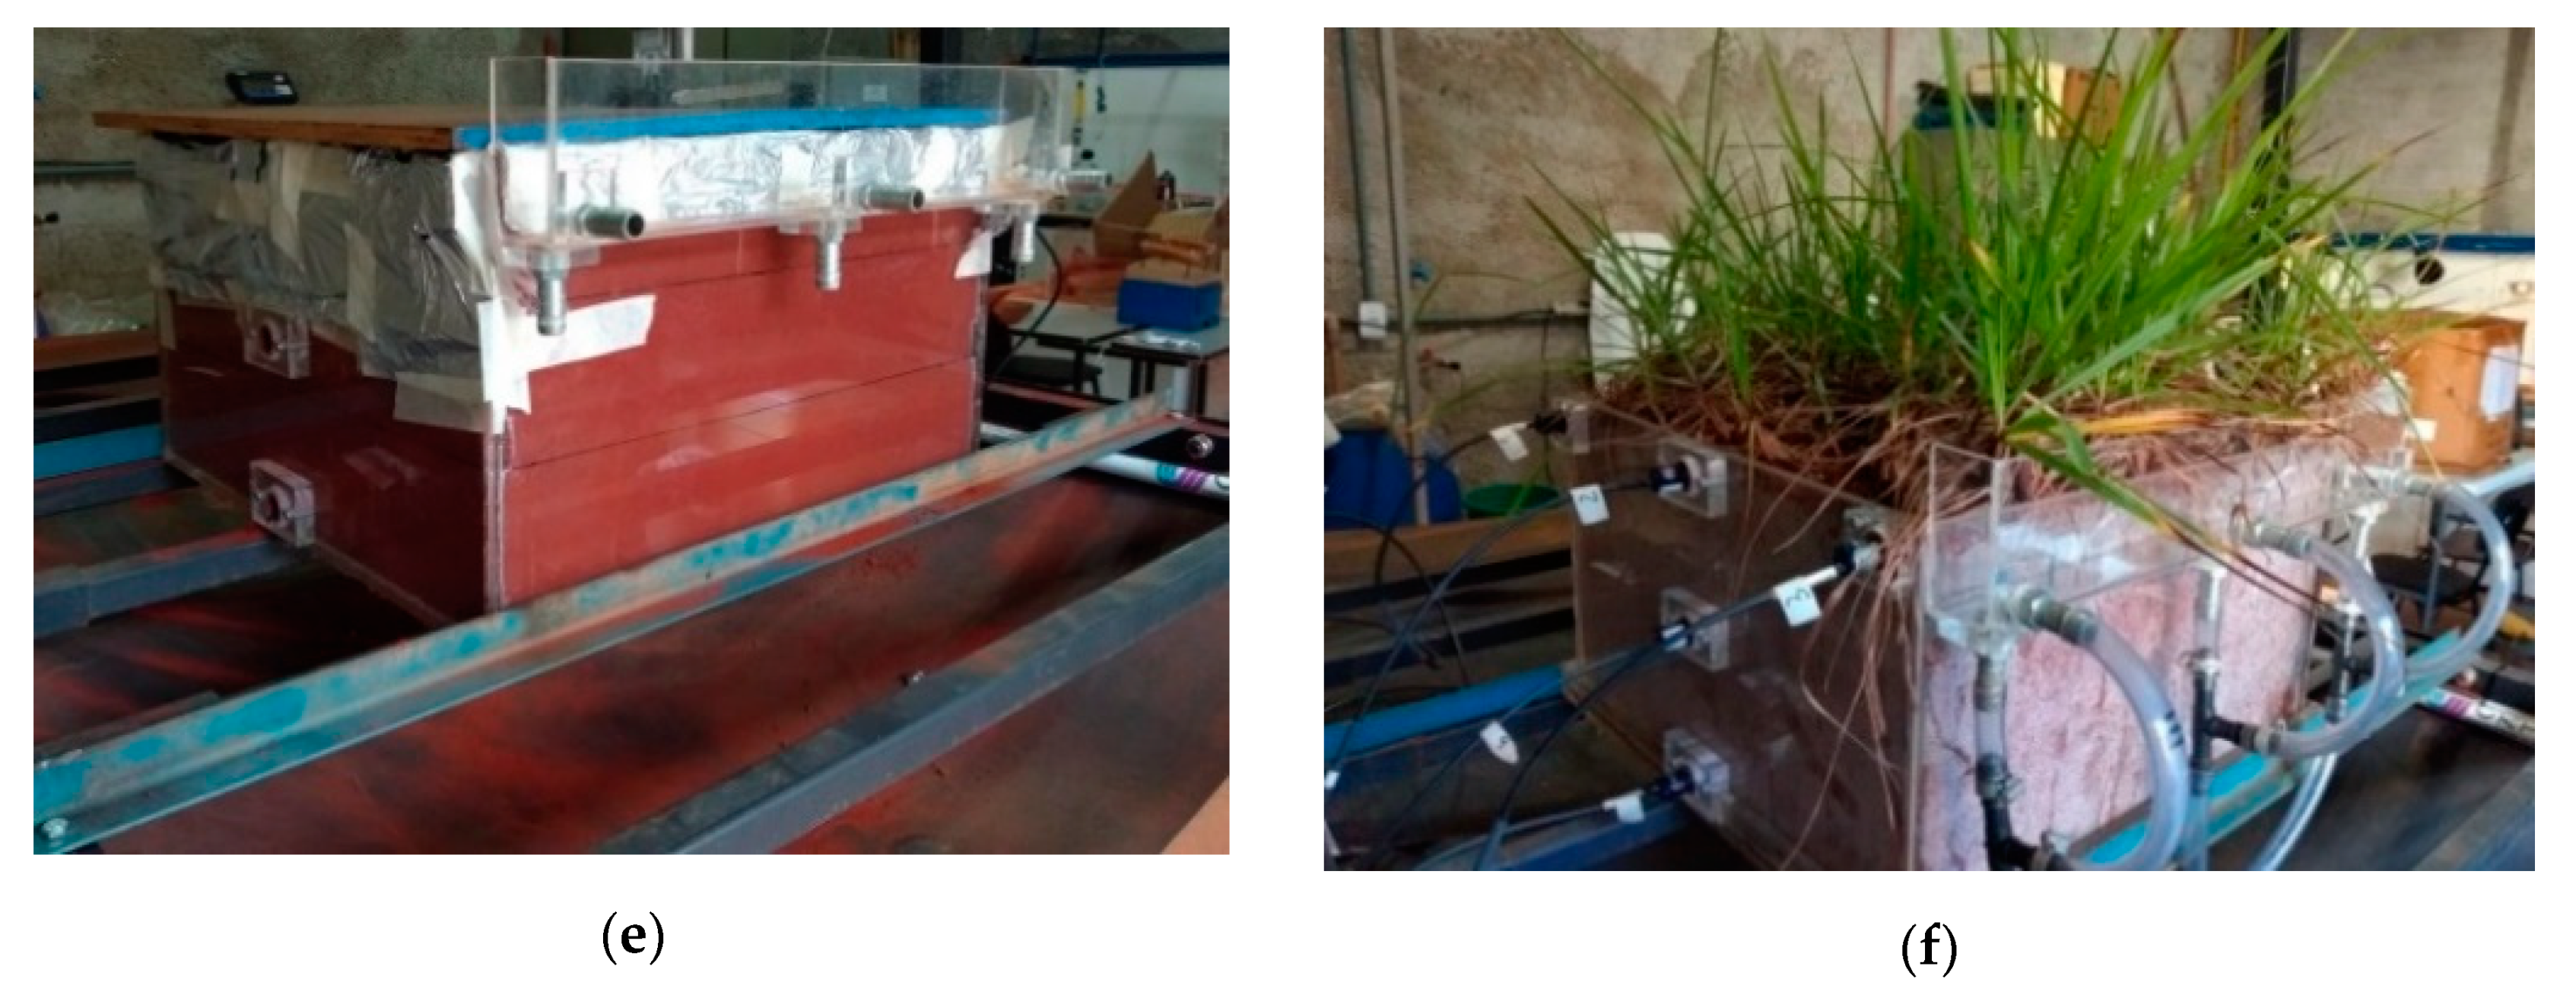
Figure 4 depicts the preparation steps required for the production of specimens for the RS tests. The RS can accommodate specimens of up to 1.5 m in length and 1.0 m in width. For the current experimental program, the specimens were prepared with dimensions of 50 cm in length, by 50 cm in width, by 30 cm in height. According to [35], these are the optimum dimensions to reduce end-effects and provide adequate uniformity in the characteristics of the simulated rainfall. For the vegetated specimens, bahiagrass was planted after compaction, and the specimens were stored at least until the complete development of the grass, which usually took 3 to 4 months.
Soil specimens were prepared in the laboratory in conditions that are typical of those found in the field. This allowed for greater control of the soil and grass cover conditions, reducing natural variability. Soil specimens were remolded by static compacted at a moisture content of 18% and a dry unit weight of 15.8 kN m−3. The weight of a typical specimen was over 130 kg, and the compaction force applied to each layer was about 42 kN (4200 kg). Specimen remolding was carried out using a compaction plate of 49.8 by 49.8 cm and using a hydraulic press at a constant speed of 5 mm min−1.
Two types of specimen containers were adopted. Remolded specimens tested without vegetation cover were prepared in containers made of acrylic, with walls of 10 mm in thickness (Figure 4a). Remolded specimens tested with vegetation cover were first prepared in plywood containers (Figure 4b). These specimens remained in the plywood containers during the grass growth period and were later transferred to acrylic containers for testing in the RS (Figure 4c,d). External reinforcement braces were used to prevent damage to the containers during compaction.
The specimen was extensively instrumented for the monitoring of matric suction and water content, using tensiometers and capacitive sensors, respectively (Figure 4f). Details regarding the preparation, installation, and operation of tensiometers and moisture sensors are described in [7,41]. Once the instrumentation was in place, the specimen was locked in alignment with the sprinkler system and rotated according to the desired slope (Figure 4e).
The final procedures prior to testing involved the following steps: de-airing of the hydraulic plumbing; adjustment of the service pressure for the specified rainfall intensity (e.g., 70 kPa for 86 mm h−1); preparation of the containers and flow rate sensor to store and monitor runoff every 5 min. A simulated rainfall corresponding to 86 mm h−1 was applied in all tests, for a duration of 60 min and with a slope of 15°. These rainfall characteristics are representative of the tropical region where this study was carried out [41]. The selected slope angle is commonly found in the field and in earthworks.
All experiments carried out using the RS were conducted indoors. Because the duration of tests was 60 min, evaporation during rainfall was neglected. Ambient temperature varied between 20 and 25 °C, and relative humidity was approximately equal to 60% during the entire experimental program. Surface runoff and infiltration were also evaluated during the simulated rainfall. The erosion due to the impact of the drops in the soil was quantitatively analyzed. Eroded sediments were collected into a container for determination of the dry mass.

2.3. Interpretation of Rainfall Simulation Tests and Determination of the Interception

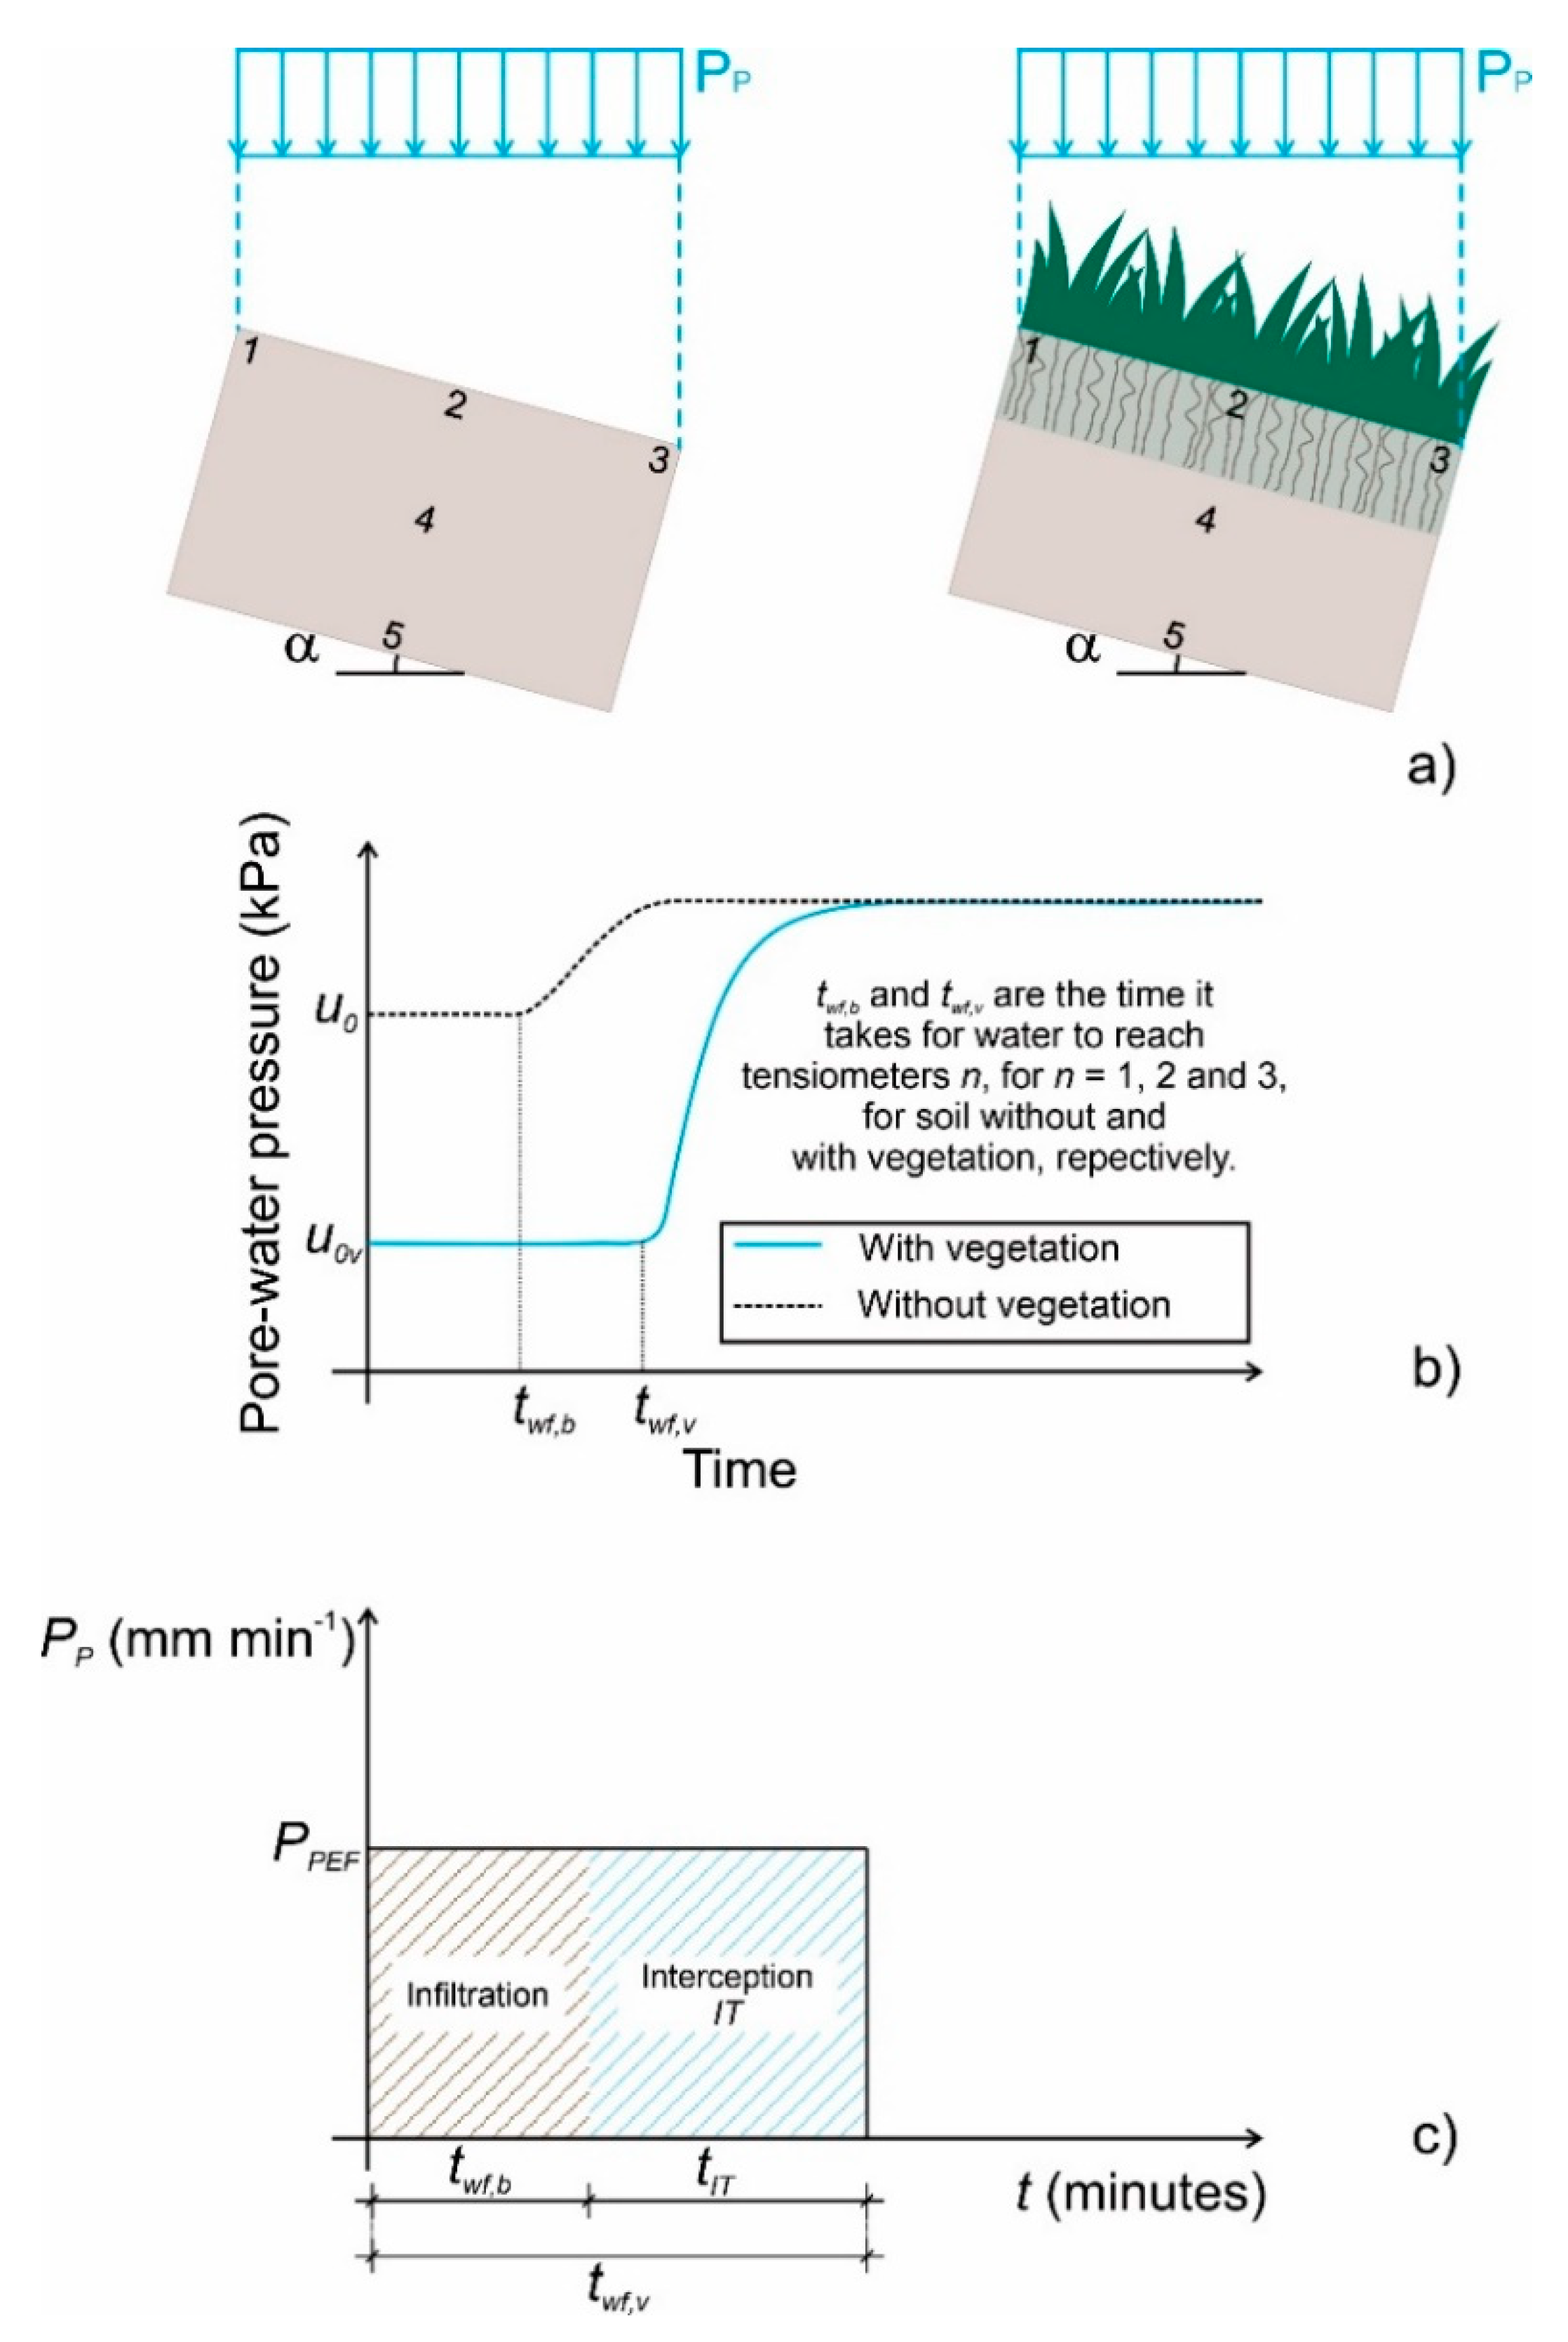
Figure 5 illustrates the proposed steps for the new method of determination of interception. According to the proposed procedure, two tests are required, one with a bare soil surface (Test 1) and another with the vegetated soil (Test 2). The changes in the pore-water pressures and water content were monitored at five different positions: points 1 to 5. Tensiometers installed at points 1, 2, and 3 were positioned near the specimen surface. To ensure a strict testing protocol, the surface tensiometers 1–3 were always installed 2.0 cm below the surface.
The three surface tensiometers serve as indicators of when water starts to reach the surface of the bare soil or of the soil-root system. Therefore, the measurement of the pore-water pressures by tensiometers 1 to 3 allows the determination of the time interval, twf, between the start of the simulated rainfall and when the water reaches the tensiometers. The difference between twf for the specimens with and without vegetation, obtained as indicated in Figure 5, is assumed to correspond to the effect of the vegetation.
Considering a vertical rainfall and the effective volume that reaches the soil surface, as illustrated in Figure 5a, the interception is quantified as follows:
I T = P P cos α ( t w f , v t w f , b )
where IT is the interception (L); PP is the rainfall intensity (L T−1); α is the slope angle of the specimen with respect to the horizontal direction; and twf is the elapsed time from the start to the application of the constant rainfall until the wetting front reaches the near-surface tensiometers (T), with the subscripts v and b indicating the values corresponding to the vegetated and bare soil surfaces, respectively.
It is important to note that the proposed method assumes that the rainfall intercepted during the evaluated time interval will not reach the soil surface and will be completely available to return later to the atmosphere by evaporation. It is also assumed that the full interception storage capacity is reached by the time the wetting front starts advancing in the soil. The proposed procedure requires the use of tensiometers installed as close as possible to the specimen surface. The small distance between the specimen surface and the tensiometers (2.0 cm) ensures that differences in hydraulic conductivity and initial water content between the two specimens will not significantly affect the estimation of interception.

3. Results and Discussion

3.1. Tests in the RS

RS tests were carried out for a rainfall intensity of 86 mm h−1, rainfall duration of 60 min, and a slope of 15°. The initial conditions of these tests are shown in Table 2. The specimens were prepared under conditions that are representative of those found in the field. The compaction water content of 18% was strictly controlled. Regarding the initial pore-water pressures of Test #1, a relatively homogeneous condition was observed, especially for the tensiometers located along the surface (points 1, 2, and 3). The decreasing matric suctions from the top of the specimen along its depth were due to water movement due to gravity. Test #2, with vegetation cover, was subjected to variations in weather conditions during 120 days and conducted in July 2019, during the dry season. Therefore, the pore-water pressure distribution and water content were influenced by the antecedent weather conditions, resulting in reduced water contents. Water uptake by roots led to relatively uniform conditions along the entire specimen. It is also important to note that hysteresis in the soil-water characteristic curve produces a nonunivocal relationship between water content and pore-water pressure. Therefore, similar values of water contents may correspond to a relatively large range in pore-water pressures.
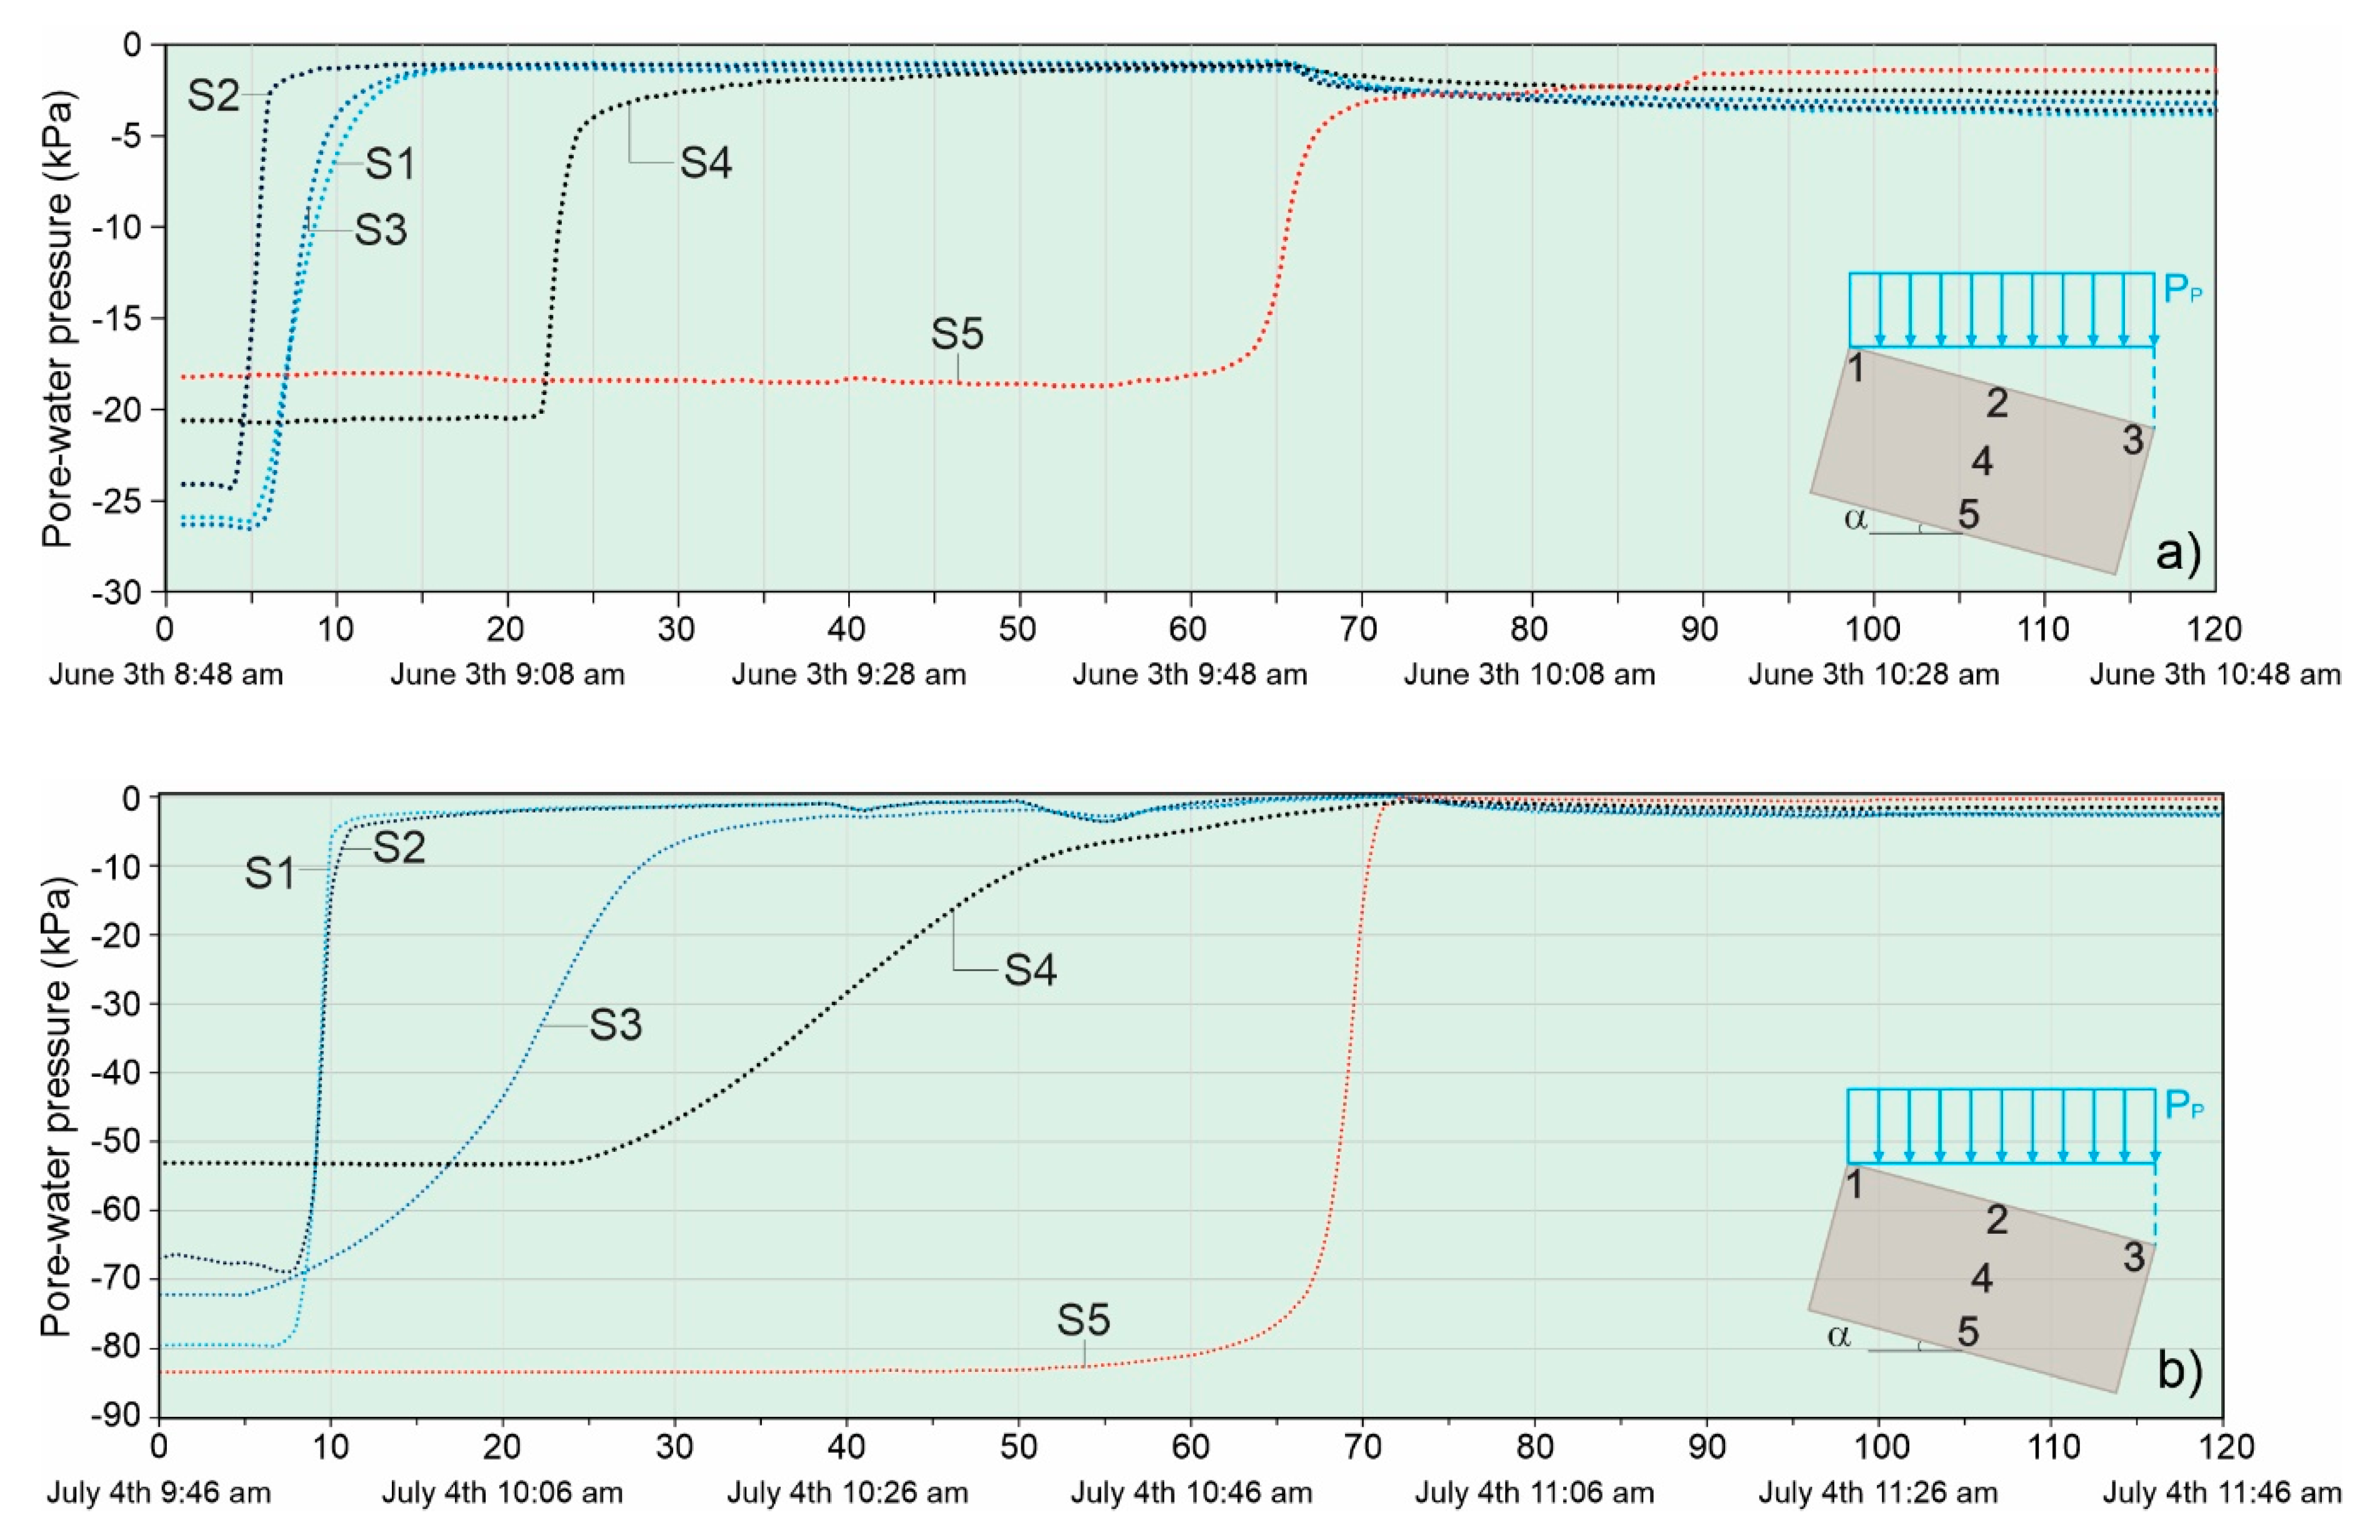
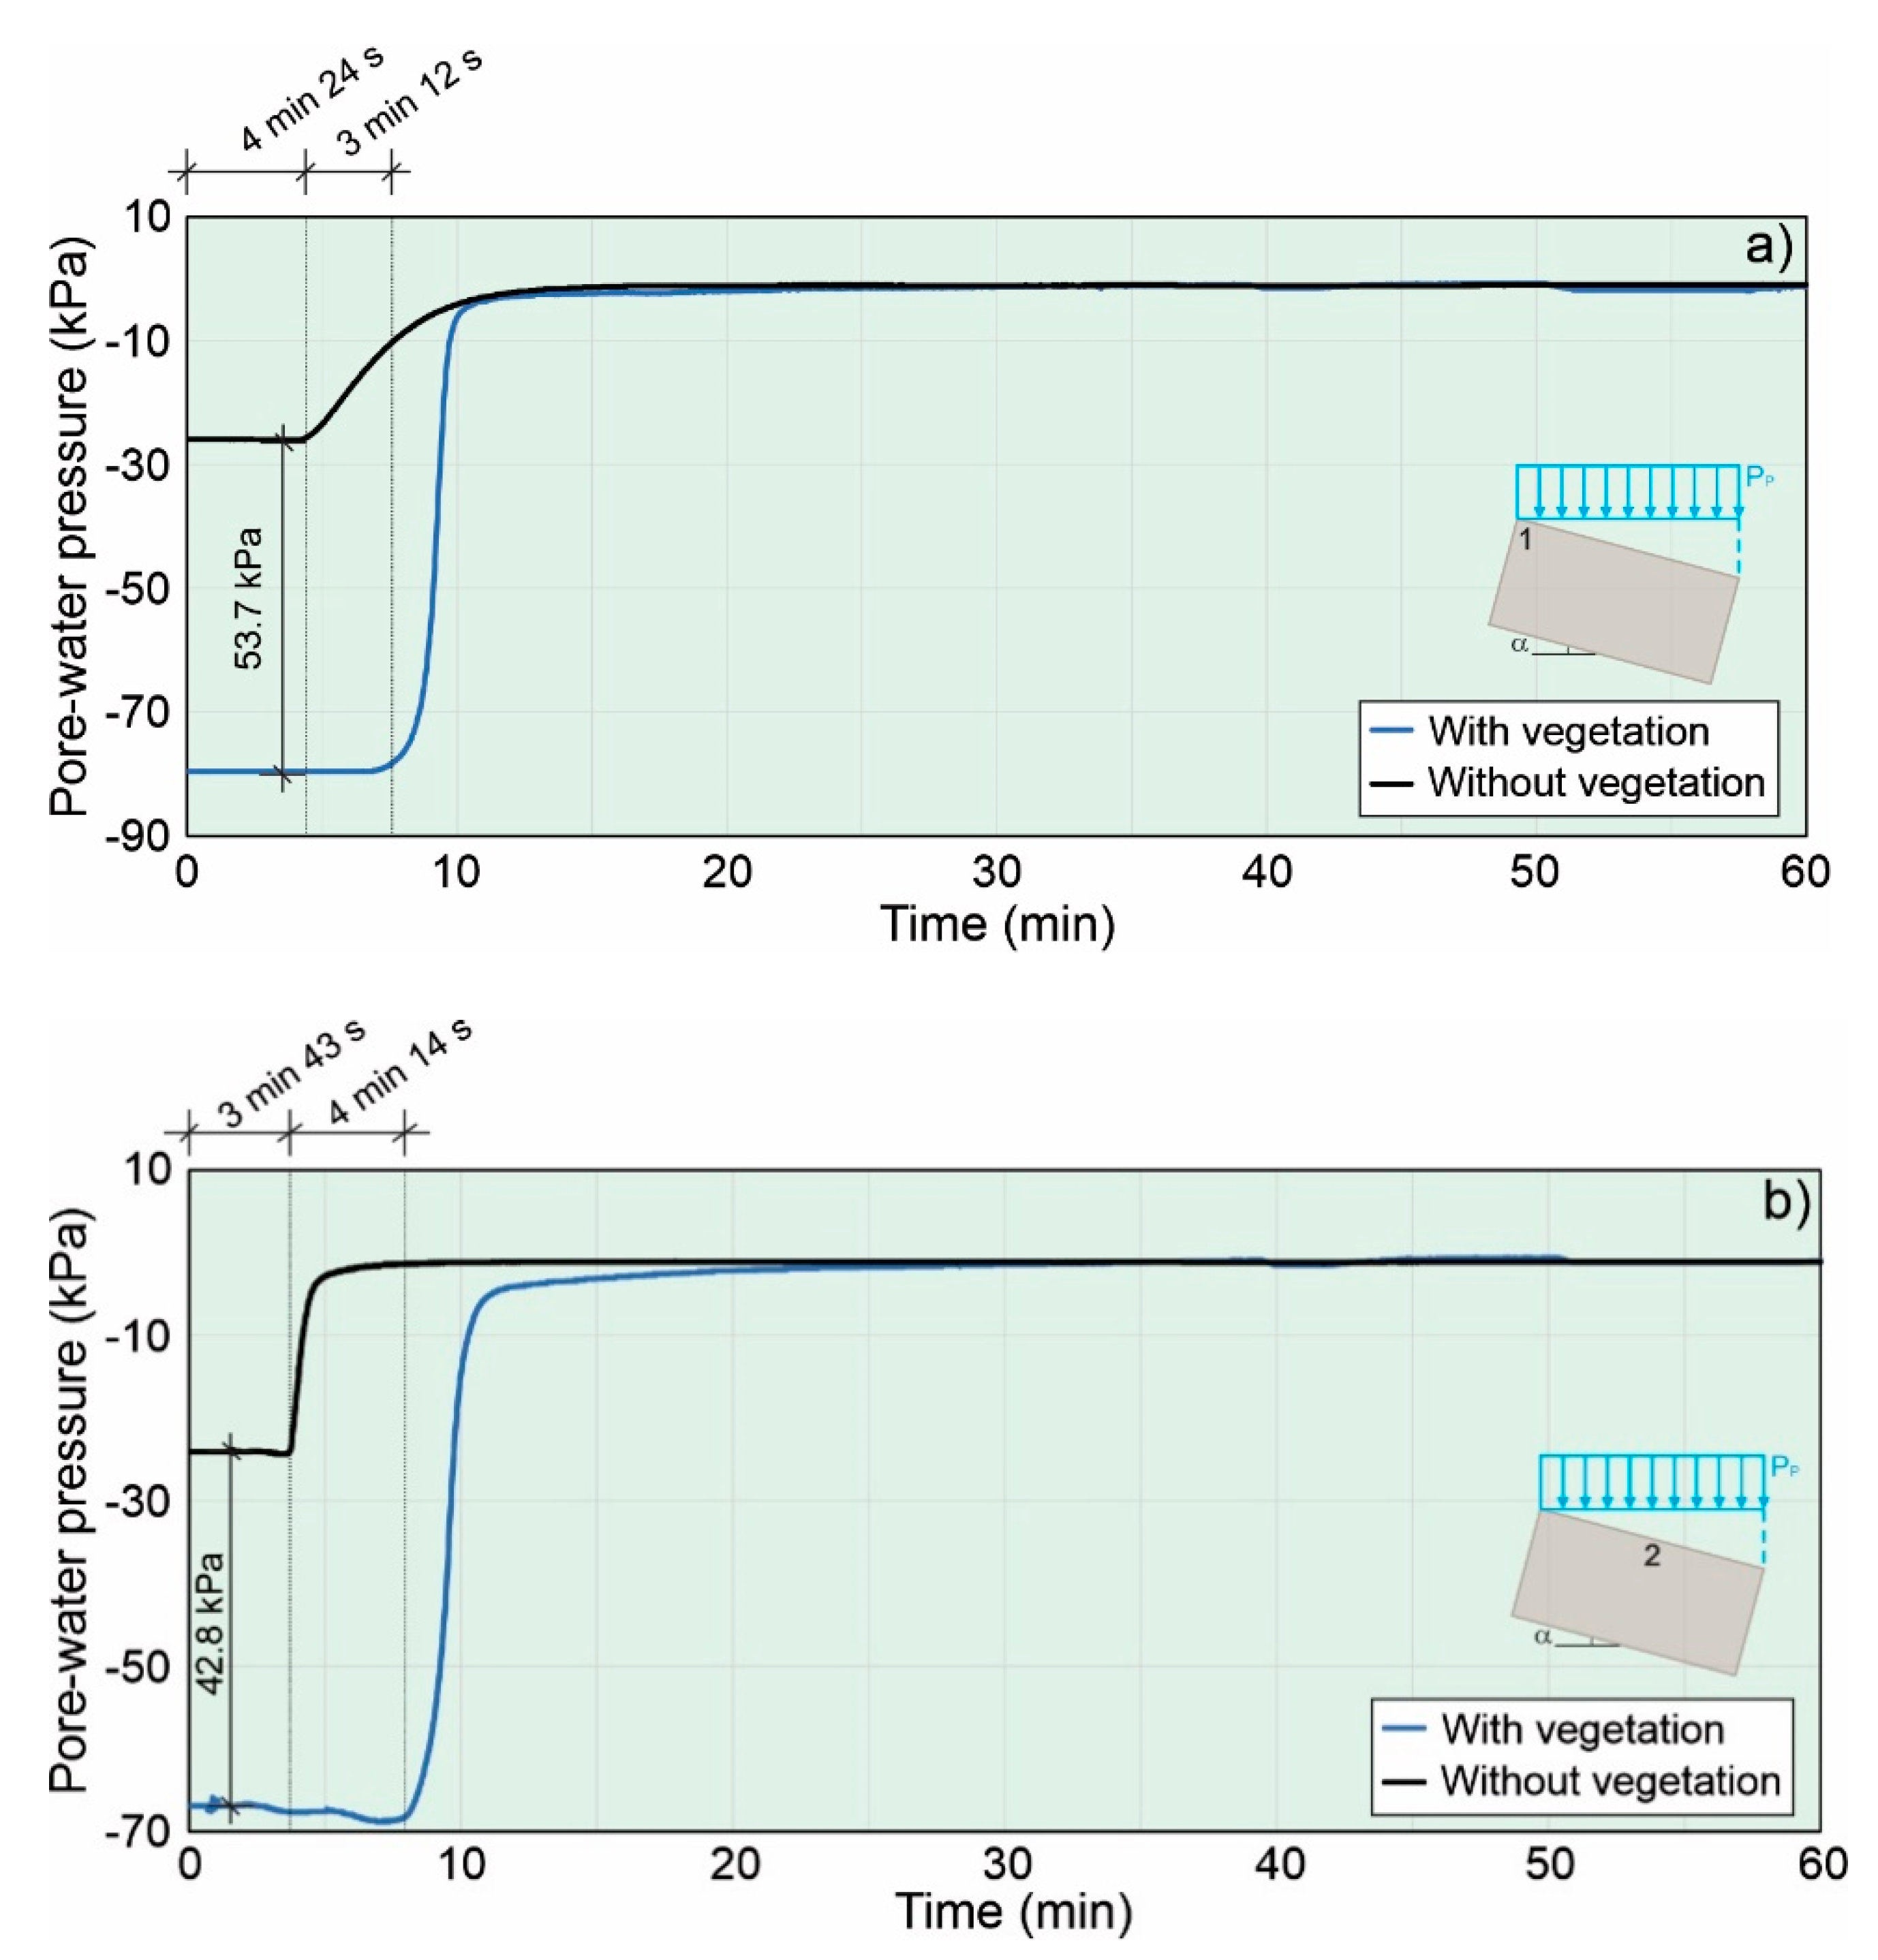
Figure 6 presents the variations in the pore-water pressures measured by the tensiometers for the specimens with and without vegetation. Two testing stages are shown in Figure 6, with the first corresponding to the simulated rainfall (0 to 60 min) and the second corresponding to drainage after the interruption of rainfall (60 to 120 min). The information provided by both stages allows the interpretation of the main ground surface water balance variables during a rainfall, namely interception, infiltration, and runoff.
Figure 6 shows steep changes in pore-water pressure as the infiltration front reaches the specimen surface and deeper layers within the specimen. A summary of breakthrough times for each tensiometer is presented in Table 3. The sensors positioned near the specimen surface responded to the applied rainfall after 3.71 to 4.86 and 5.55 to 7.95 min, for the bare and vegetated specimens, respectively. The average difference in breakthrough time for the bare and vegetated surface specimens, considering tensiometers 1 and 2, was 3.71 min. Sensors 1 and 2 behave similarly to each other, indicating that flow due to gravity does not play a significant role upstream of sensor 2, during the early stages of the simulated rainfall event. The vegetation acts as a dumper, and the surface runoff generated is reduced. The distinct behavior of tensiometer 3 in the vegetated specimen could be due to natural heterogeneity resulting from the presence of the root system.
For points 4 and 5, the breakthrough curves are not as sharp, leading to a more difficult assessment of twf. Considering the moment when the readings of tensiometer change by more than 5%, sensors 4 and 5 responded to the applied rainfall in the bare soil specimen after 20.89 and 64.55 min, respectively. For the vegetated specimen, the infiltration front reached tensiometers 4 and 5 after 24.10 and 66.95 min, respectively. These results show that the difference observed between the times when tensiometers respond to the rainfall event in the bare surface and in the vegetated specimen were between 2.40 and 4.23 min throughout the test, for all depths. This is an indication that the time lag was mainly a result of interception outside the soil and had little influence from differences in the initial water content and hydraulic properties of the soil.
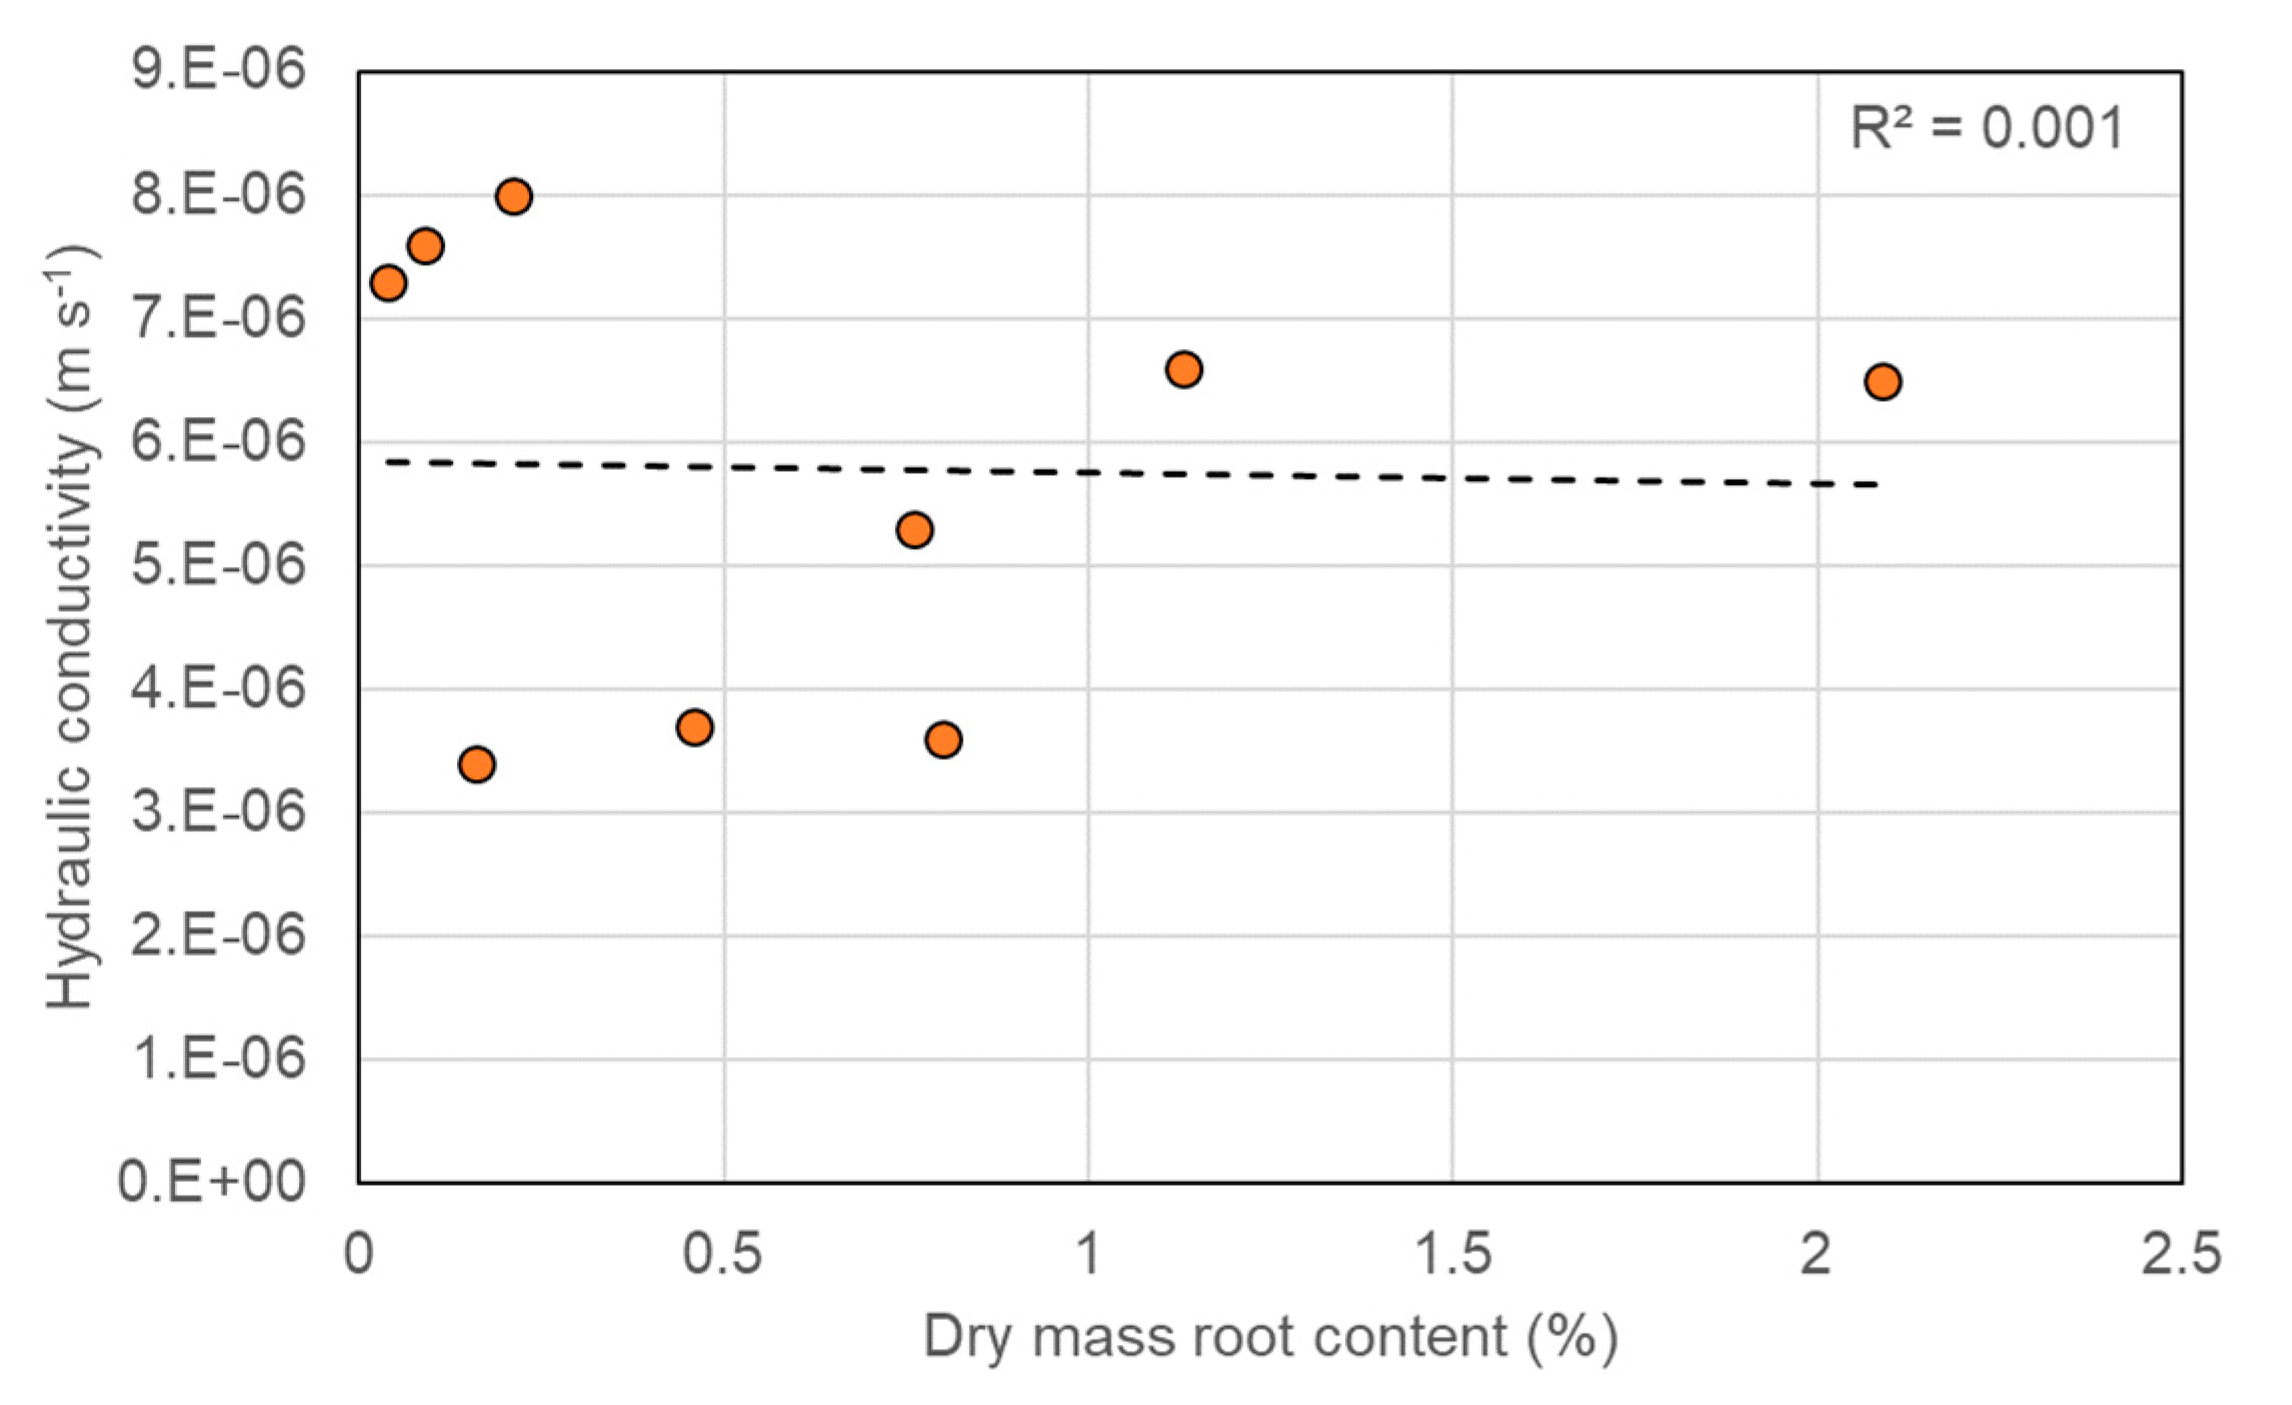
The indication that the differences in the hydraulic parameters of the soil with and without vegetation did not affect the lag times shown in Table 3 is also supported by Figure 7, which presents the relationship between the root content of the soil and the hydraulic conductivity. The results presented in Figure 7 were obtained from undisturbed specimens taken between 5 and 25 cm of depth and using a triaxial testing system, modified to allow the measurement of hydraulic conductivity under constant hydraulic head gradients. There seems to be a small trend of increase in permeability with the increase in root content, but this observation is not based on a statistically significant relationship.
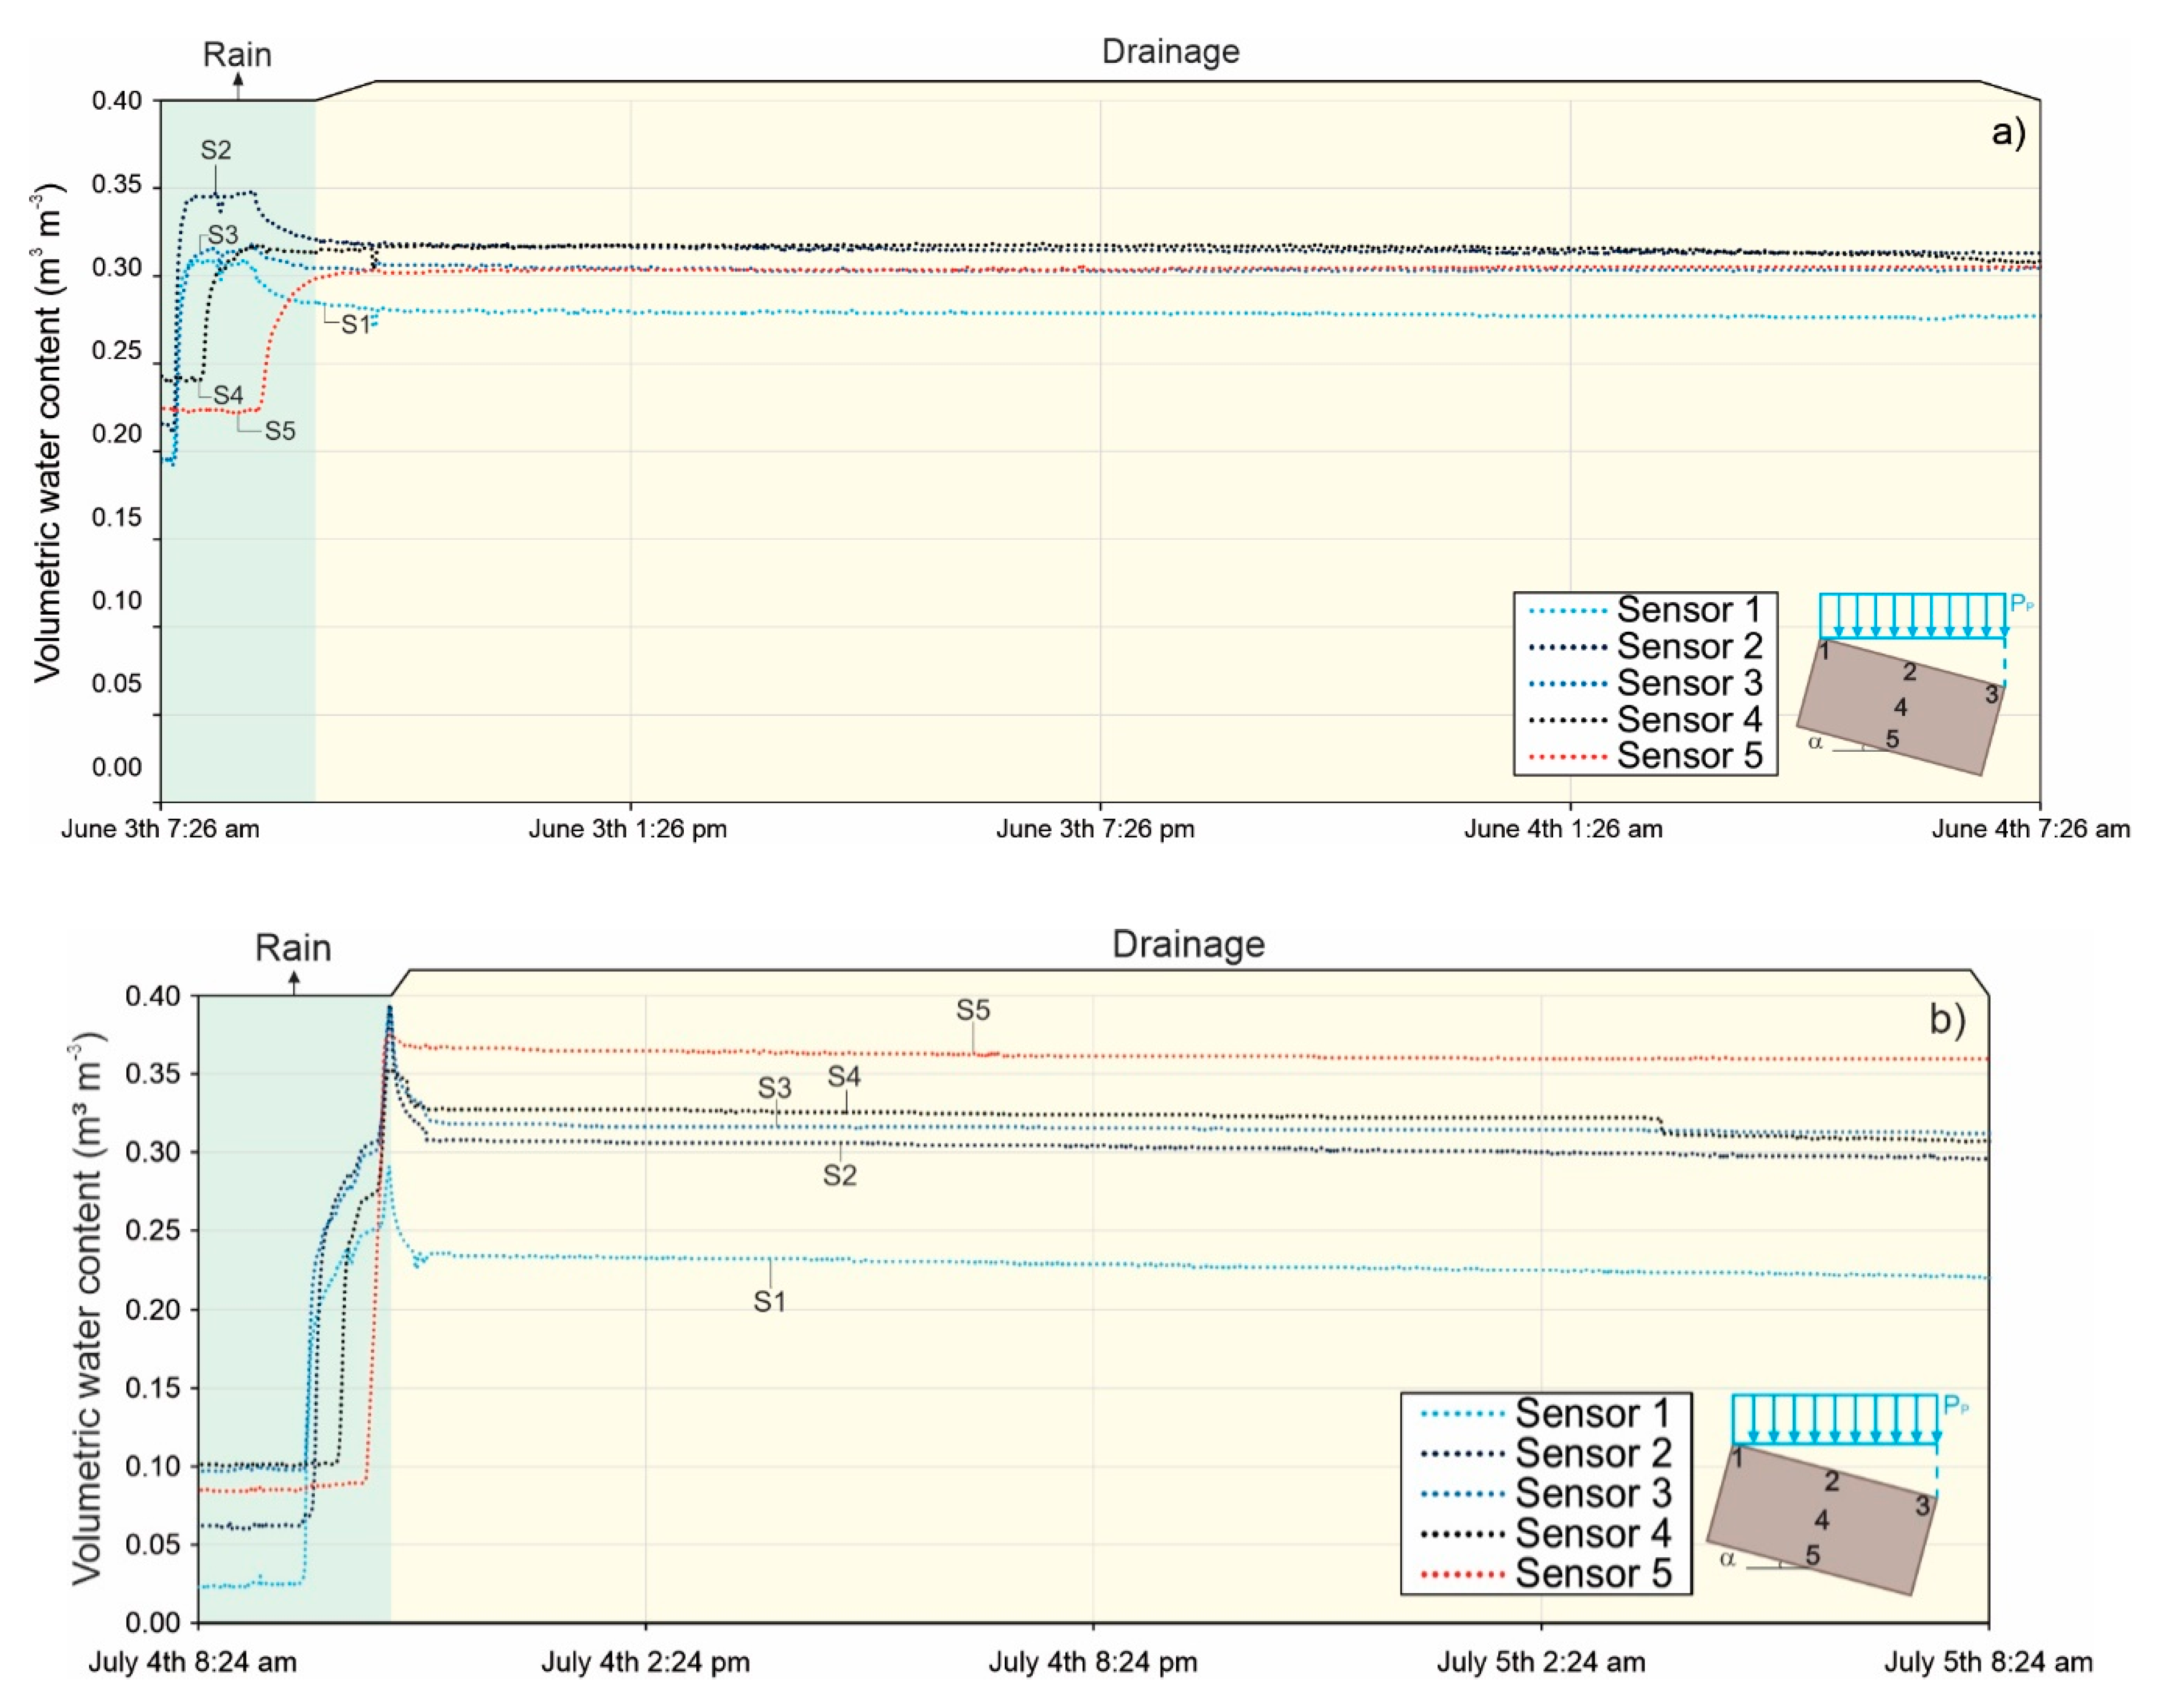
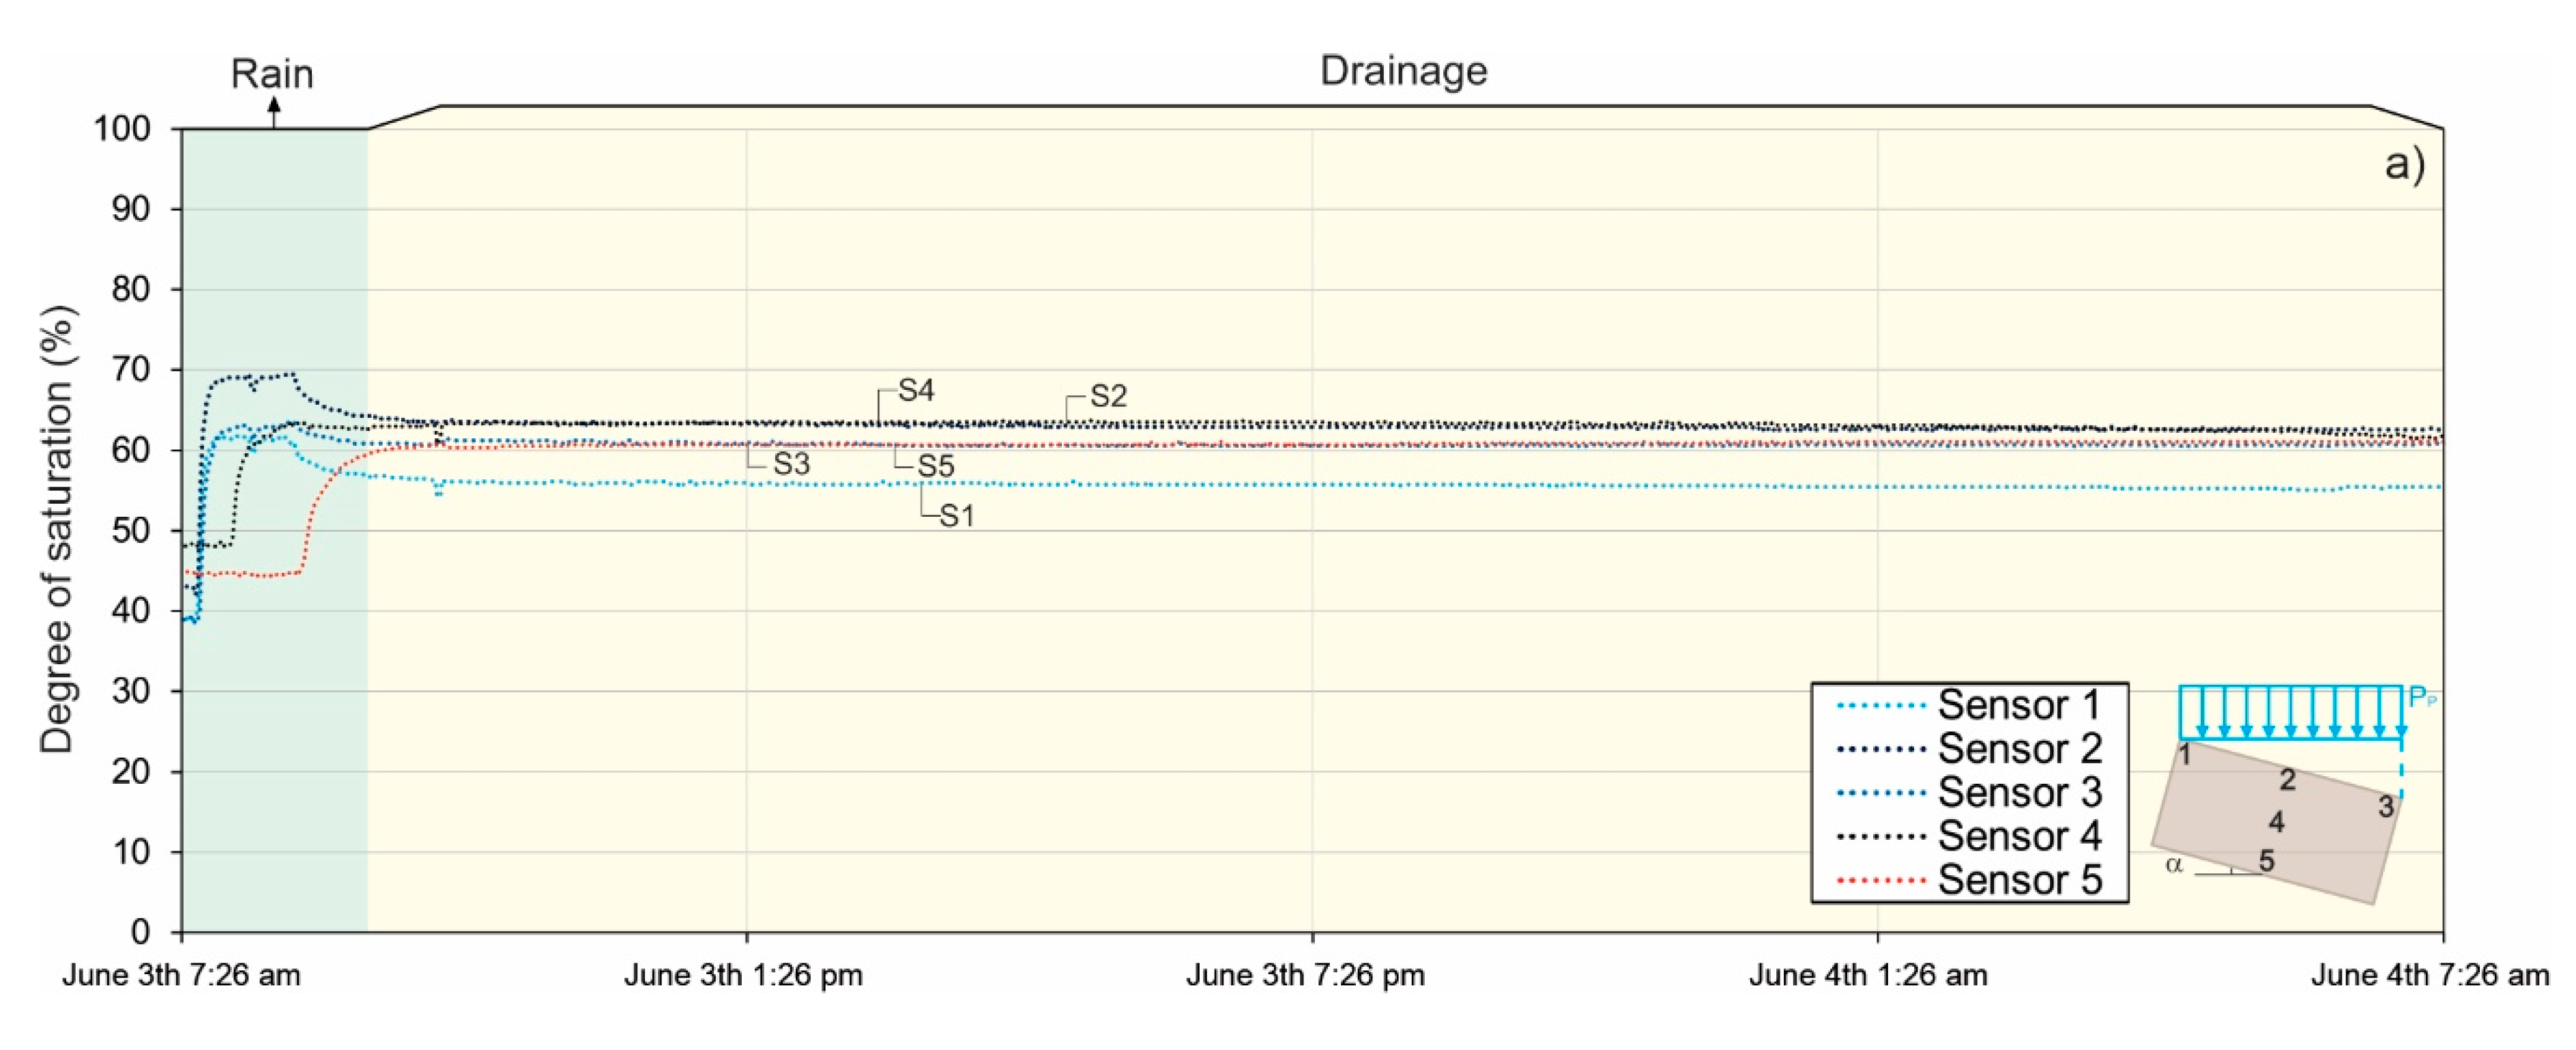
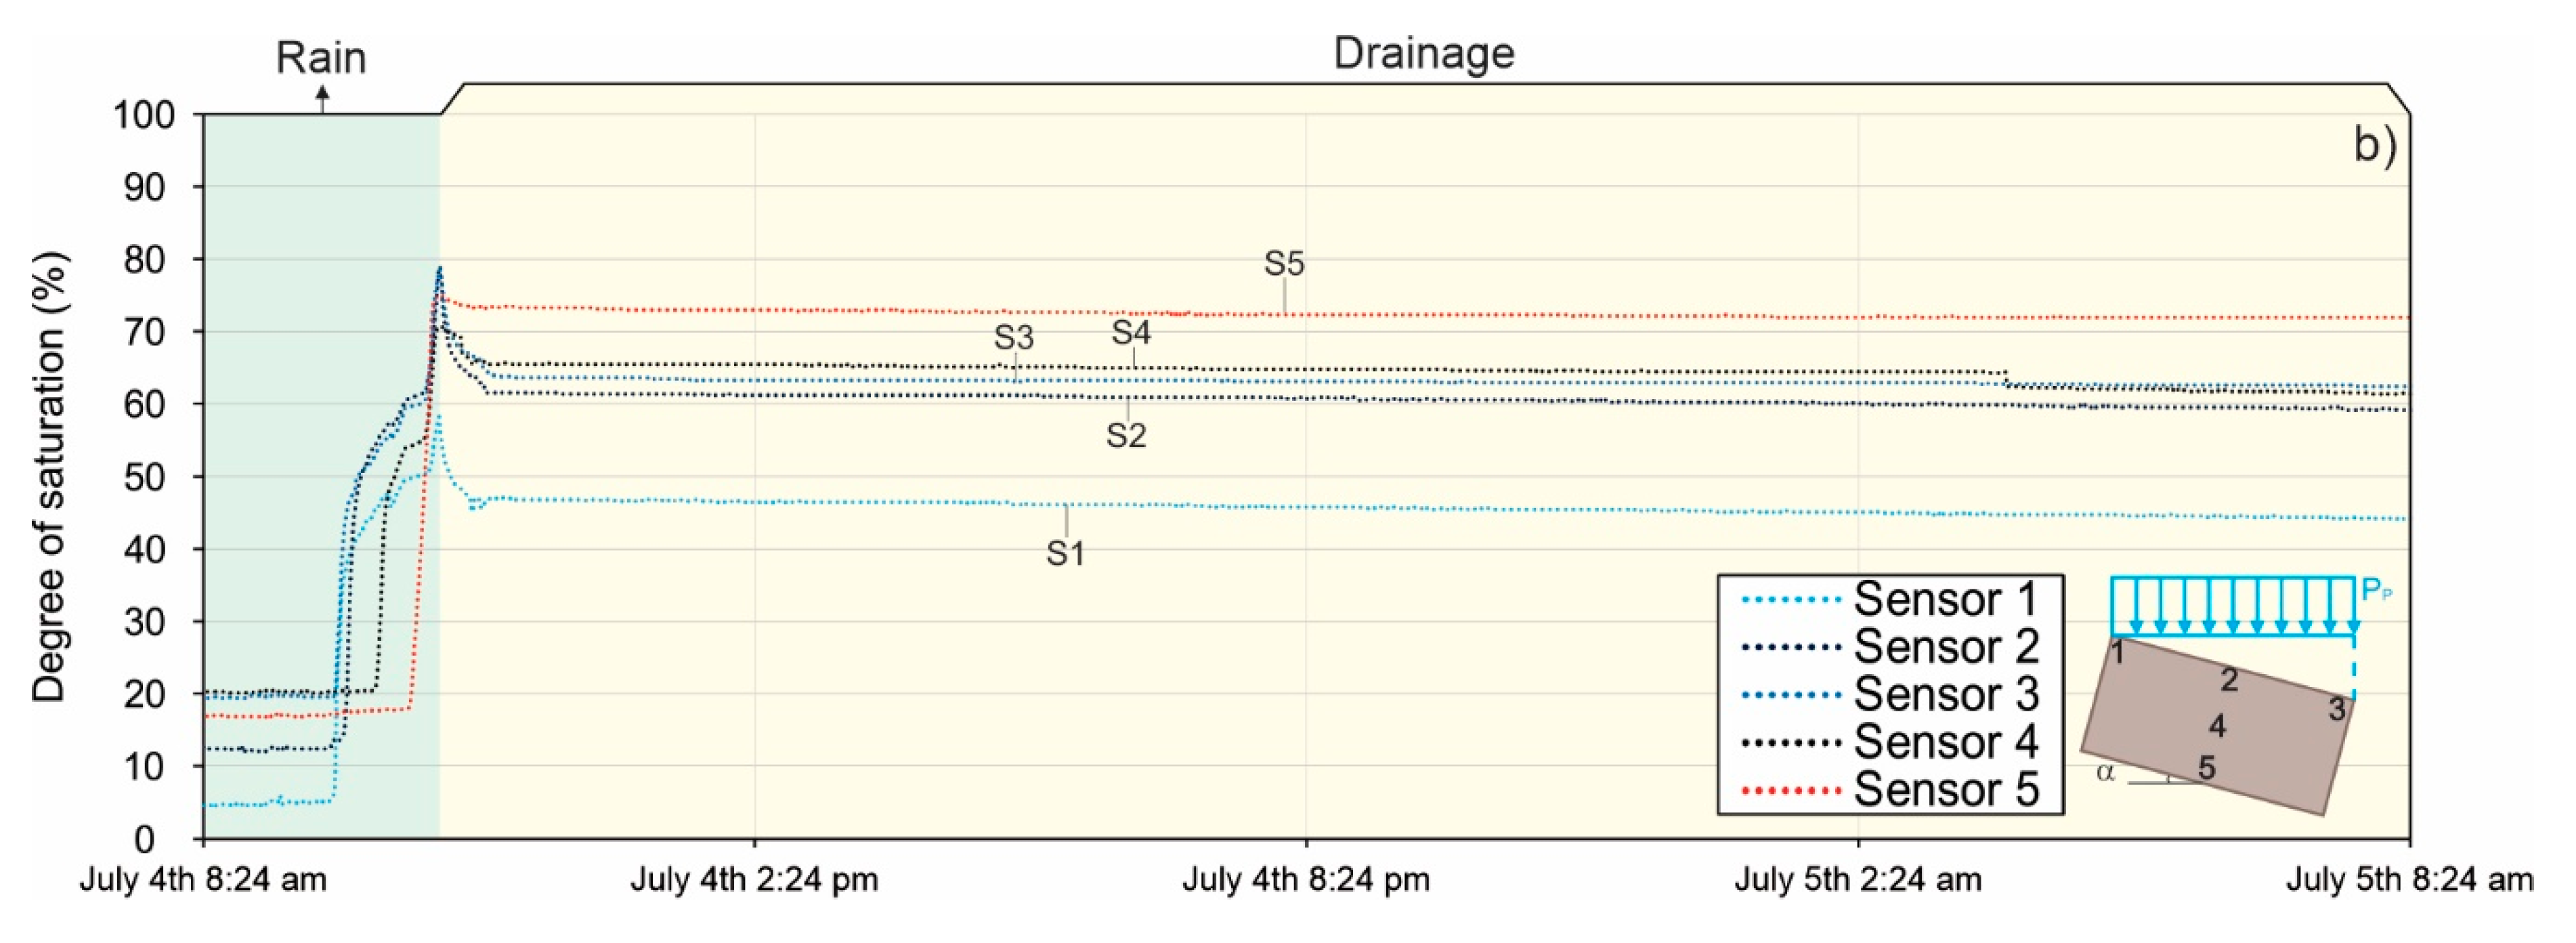
Figure 8 and Figure 9 present the measured volumetric water contents and degrees of saturation corresponding to the same tests. The degree of saturation (S), presented in Figure 9, was calculated from the volumetric water content values and considered the porosity value presented in Table 1. Due to the fact that the water content sensors measure an average value over a larger volume, the wetting front position is relatively less precise when compared to what is observed using tensiometers. Nevertheless, the obtained results allow the identification of the water storage capacity, which is associated with runoff and may indirectly interfere with interception.
It can be seen in Figure 8 and Figure 9 that the wetting front reached the bottom of the vegetated specimen 68 min after the beginning of the test (i.e., 8 min after the rainfall ceased), and because the specimen container was not sealed, the excess water was drained, and runoff did not take place. For the test using the specimen without vegetation, runoff and was observed, demonstrating the roots increased the infiltration.
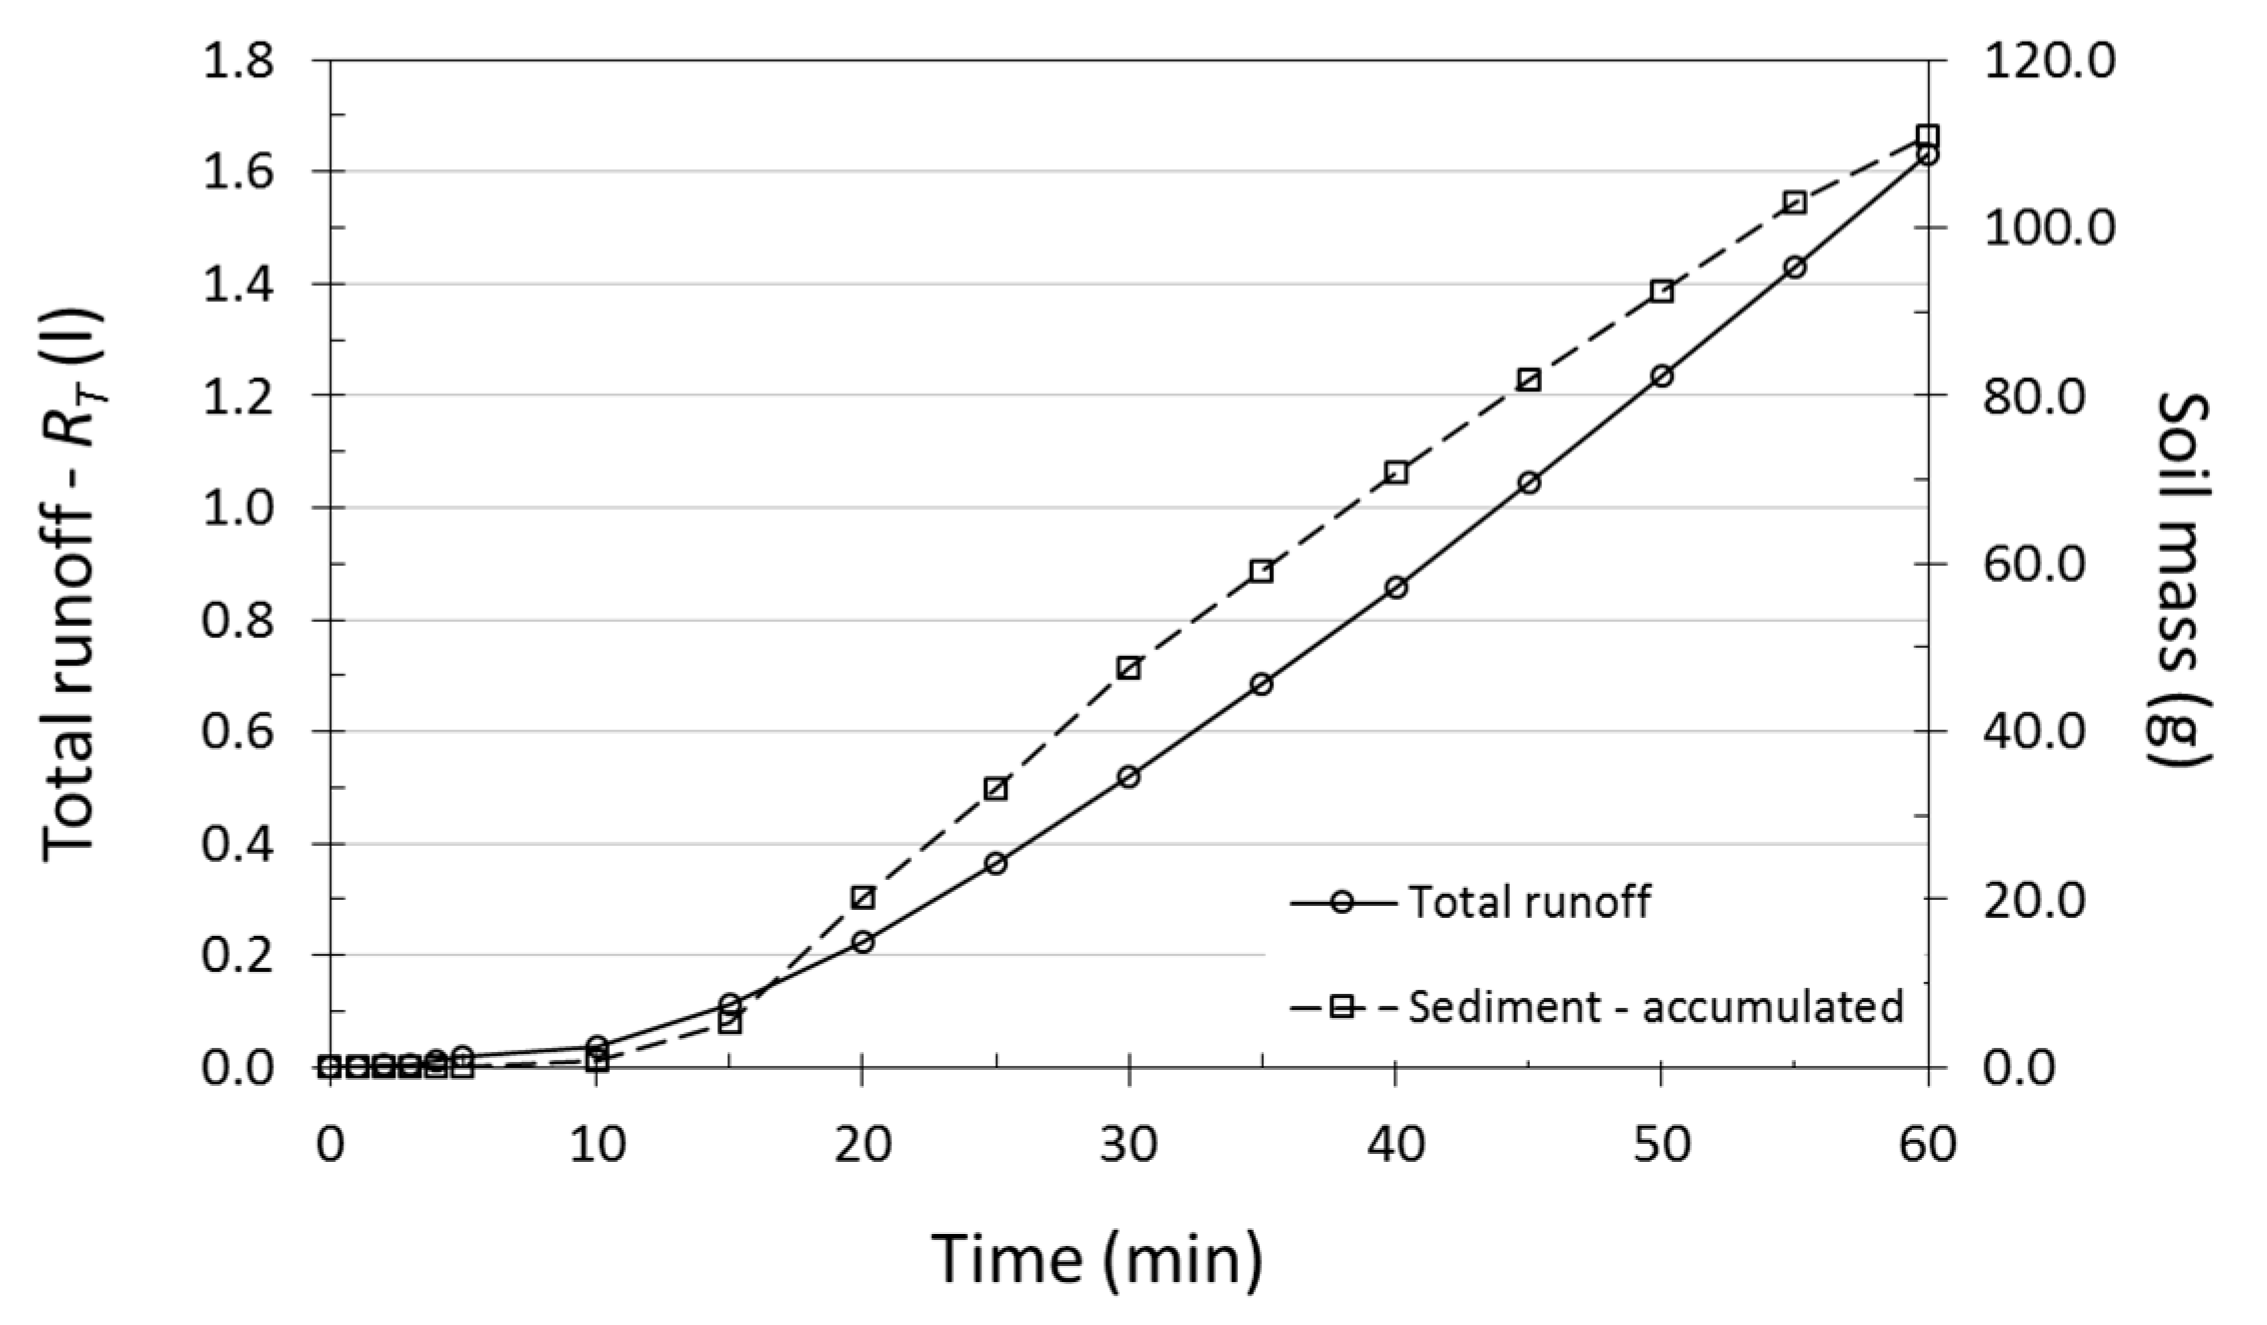
Figure 10 presents the measured runoff and accumulated soil mass resulting from surface erosion for the specimen without vegetation. It is worth mentioning that the eroded mass presented in Figure 10 does not take into account the particles displaced by the splash erosion. Thus, the amount of soil mass erosion is slightly underestimated. For the test using the specimen with vegetation, no runoff, particle detachment, or sediment transport was observed. This indicates that the vegetation cover acted as a superficial layer storing water, gradually redistributing it over time and effectively preventing soil erosion.

3.2. Quantification of the Interception

Interception was quantified using the approach presented in Figure 5 and using Equation (1). From a modeling perspective, the interception effect results in a modification of the precipitation applied as a flux boundary condition. The interception is represented in terms of a time lag between the start of the actual rainfall and the flux rate effectively applied to the soil surface. Based on the results presented in Figure 11 and Table 3, the lag time corresponding to the interception effect was estimated, based on tensiometers 1 and 2, as equal to 3.71 min, resulting in an interception of 5.1 mm, which corresponds to 6.0% of the accumulated rainfall of 86 mm.
Table 4 summarizes the interception data reported by other authors [15,24,49,50]. The reported values can be compared against those obtained for Paspalum notatum. Some of the studies presented in Table 4 have reported interception values for multiple rainfall intensities. In general, higher rainfall intensities are associated with higher interception values in absolute terms (i.e., interception height) and lower values in relative terms (i.e., percentage of accumulated precipitation). Reporting interception in terms of percentage of accumulated precipitation may be misleading, because it only applies to that specific cumulative rainfall. In the present study, the lower interception of 6.0% can be explained by the relatively high rainfall intensity of 86 mm h−1. However, the obtained interception is significantly lower than the range of values reported by Clark [15] and Drastig et al. [49] for rainfall intensities of up to 50.8 mm h−1.
The vegetation species obviously determines the interception to a great extent. Higher values are reported for those species presenting higher leaf areas and plant height. The relatively lower values of interception reported herein for Paspalum notatum are in part due to the fact that this species has an average height of 30 cm, which is lower than most species presented in Table 4. The interception values obtained for Paspalum notatum are partially comparable to those presented by Gardon et al. [50] for species with similar height and characteristics. However, significant variability is observed in the range of values presented by Gardon et al. [50]. Future studies using the proposed methodology may allow a better understanding of the variables involved and confirm the existing information regarding interception values.

4. Conclusions

Interception is a complex hydrological parameter that is difficult to measure and, unfortunately, is influenced by multiple variables. A new method for evaluating interception was proposed. The method is based on the difference in the breakthrough time of the infiltration front near the ground surface, with and without vegetation cover. The methodology was evaluated for the grass species Paspalum notatum. Tests using a laboratory RS with a slope of 15° and a rainfall with intensity of 86.0 mm h−1 and duration of 60 min, demonstrated that the interception was 5.1 mm. The obtained interception was similar to that observed in experiments reported in the literature for similar grass species but lower than the average value of a larger set of vegetation species.
The proposed methodology has some potential limitations due to the hypotheses adopted for the evaluation of interception. The method assumes that the near-surface infiltration breakthrough time will be insensitive to the differences in the soil properties, with and without a root system. Fortunately, monitoring the infiltration front at multiple depths provides an evaluation of the impact of roots, rendering the methodology more robust. In addition, the proposed method assumes that intercepted rainfall will evaporate after the rainfall event. The measurement of pore-water pressures along the soil profile and the integration of water contents stored in the soil could potentially offer some confirmation that no additional infiltration was offered to the soil surface after the end of the precipitation event.
The proposed methodology has the potential to enable more detailed studies of interception, including the evaluation of the effect of rainfall intensity. It is important to note that the new methodology may be applicable to field conditions, provided that the simulated or natural rainfall characteristics be adequately monitored and that the infiltration breakthrough be monitored in bare and vegetated portions of the same area. The results presented herein and the potential future increase in the knowledge of the interception phenomenon will provide benefits to the modeling of hydrological systems, particularly in the case of small-scale problems, including the evaluation of soil-atmosphere interaction effects on erosion and slope stability.

Author Contributions

Conceptualization, T.A.M., R.D.A., J.F.R.R. and G.d.F.N.G.J.; methodology, T.A.M., J.F.R.R. and G.d.F.N.G.J.; formal analysis, T.A.M. and R.D.A.; investigation, T.A.M. and S.A.d.S.P.; resources, T.A.M., J.F.R.R. and M.P.d.L.; data curation, T.A.M., J.F.R.R. and G.d.F.N.G.J.; writing—original draft preparation, T.A.M., R.D.A., G.d.F.N.G.J. and S.A.d.S.P.; writing—review and editing, T.A.M. and R.D.A.; supervision, J.F.R.R. and G.d.F.N.G.J.; project administration, T.A.M.; funding acquisition, J.F.R.R. and M.P.d.L. All authors have read and agreed to the published version of the manuscript.

Funding

This research was funded by the Agência Nacional de Energia Elétrica (ANEEL, National Agency of Electric Energy-PD-ANEEL 0394-1705/2017).

Institutional Review Board Statement

Not applicable.

Informed Consent Statement

Not applicable.

Data Availability Statement

Not applicable.

Acknowledgments

The authors would like to thank the Instituto Federal de Educação, Ciência e Tecnologia de Goiás (IFG, Federal Institute of Education, Science and Technology of Goias), Universidade de Brasília (UnB, University of Brasilia), Universidade Federal de Goiás (UFG, University of Goias), and the Eletrobras FURNAS community for the support provided and Agência Nacional de Energia Elétrica (ANEEL, National Agency of Electric Energy) for supporting this research (PD-ANEEL 0394-1705/2017).

Conflicts of Interest

The authors declare that they have no known competing financial interests or personal relationships that could have appeared to influence the work reported in this paper. Thus, the authors declare no conflict of interest.

References

  1. Lu, D.; Hetrick, S.; Moran, E. Impervious surface mapping with Quickbird imagery. Int. J. Remote Sens. 2011, 32, 2519–2533. [Google Scholar] [CrossRef] [PubMed] [Green Version]
  2. Weng, Q. Remote sensing of impervious surfaces in the urban areas: Requirements, methods, and trends. Remote Sens. Environ. 2012, 117, 34–49. [Google Scholar] [CrossRef]
  3. Lin, Q.; Xu, Q.; Faqi, W.; Li, T. Effects of wheat in regulating runoff and sediment on different slope gradients and under different rainfall intensities. Catena 2019, 183, 104–116. [Google Scholar] [CrossRef]
  4. Alves, P.L. Capacidade de Interceptação pelas árvores e suas Influências no Escoamento Superficial Urbano. Ph.D. Thesis, University of Goias, Goiânia, Brazil, 2015. [Google Scholar]
  5. Alves, P.L.; Formiga, K.T.M. Efeitos da arborização urbana na redução do escoamento pluvial superficial e no atraso do pico de vazão. Ciênc. Florest. 2019, 29, 193–207. [Google Scholar] [CrossRef] [Green Version]
  6. Rahardjo, H.; Krisnanto, S.; Leong, E.C. Effectiveness of capillary barrier and vegetative slope covers in maintaining soil suction. Soils Rocks 2016, 39, 51–69. [Google Scholar]
  7. Mendes, T.A. Physical and Numerical Modeling of Infiltration and Runoff in Unsaturated and Vegetative Coverage Surfaces. Ph.D. Thesis, University of Brasília, Brasília, Brazil, 2019. [Google Scholar]
  8. Tucci, C.; Clarke, R.T. Impacto das mudanças da cobertura vegetal no escoamento: Revisão. Rev. Bras. Recur. Hidr. 1997, 2, 135–152. [Google Scholar] [CrossRef]
  9. Elliot, W.J. Modeling Rangeland Watershed Erosion Processes. In Proceedings of the Watershed Management and Operations Management, Fort Collins, CO, USA, 20–24 June 2000; Volumn 2, pp. 1–9. [Google Scholar] [CrossRef]
  10. Zhang, X.; Li, P.; Li, Z.B.; Yu, G.Q.; Li, C. Effects of precipitation and different distributions of grass strips on runoff and sediment in the loess convex hillslope. Catena 2018, 162, 130–140. [Google Scholar] [CrossRef]
  11. Moura, A.E.S.S.; Correa, M.M.; Silva, E.R.; Ferreira, R.L.C.; Figueiredo, A.C.; Possas, J.M.C. Interceptação das chuvas em um fragmento de floresta da Mata Atlântica na Bacia do Prata, Recife, PE. Rev. Árvore 2009, 461–469. [Google Scholar] [CrossRef] [Green Version]
  12. Mcpherson, E.G.; Simpson, J.R.; Xiao, Q.; Wu, C.H. Million trees Los Angeles canopy cover and benefit assessment. Landsc. Urban. Plan. 2011, 99, 40–50. [Google Scholar] [CrossRef]
  13. Ghimire, C.P.; Bruijinzell, L.A.; Lubczynski, M.W.; Bonell, M. Rainfall interception by natural and planted forests in the Middle Mountains of Central Nepal. J. Hydrol. 2012, 475, 270–280. [Google Scholar] [CrossRef]
  14. Zhang, Y.; Wang, X.; Hu, R.; Pan, Y.; Paradeloc, M. Rainfall partitioning into throughfall, stemflow and interception loss by two xerophytic shrubs within a rain-fed re-vegetated desert ecosystem, northwestern China. J. Hydrol. 2015, 527, 1084–1095. [Google Scholar] [CrossRef]
  15. Clark, O.R. Interception of rainfall by prairie grasses, weeds, and certain crop plants. Ecol. Monogr. 1940, 10, 243–277. [Google Scholar] [CrossRef]
  16. Calder, A. Evaporation in the Uplands; John Wiley & Sons Ltd.: Chichester, UK, 1990; 148p. [Google Scholar]
  17. Martinez, G.; Weltz, M.; Pierson, F.B.; Spaeth, K.E.; Pachepsky, Y. Scale effects on runoff and soil erosion in rangelands: Observations and estimations with predictors of different availability. Catena 2017, 151, 161–173. [Google Scholar] [CrossRef]
  18. Moreno-De Las Heras, M.; Nicolau, J.M.; Merino-Martín, L.; Wilcox, B.P. Plot-scale effects on runoff and erosion along a slope degradation gradient. Water Resour. Res. 2010, 46, 1–12. [Google Scholar] [CrossRef] [Green Version]
  19. Fu, Z.; Li, Z.; Cai, C.; Shi, Z.; Xu, Q.; Wang, X. Soil thickness effect on hydrological and erosion characteristics under sloping lands: A hydropedological perspective. Geoderma 2011, 167–168, 41–53. [Google Scholar] [CrossRef]
  20. Shao, Q.; Baumgartl, T. Estimating input parameters for four infiltration models from basic soil, vegetation, and rainfall properties. Soil Sci. Soc. Am. J. 2014, 78, 1507–1521. [Google Scholar] [CrossRef]
  21. Oorthuis, R.; Hürlimann, M.; Fraccica, A.; Lloret, A.; Moya, J.; Puig-Polo, C.; Vaunat, J. Monitoring of a full-scale embankment experiment regarding soil–vegetation–atmosphere interactions. Water 2018, 10, 688. [Google Scholar] [CrossRef]
  22. Vianna, V.F.; Fleury, M.P.; Menezes, G.B.; Coelho, A.T.; Bueno, C.; Silva, J.L.; Luz, M.P. Bioengineering Techniques Adopted for Controlling Riverbanks’ Superficial Erosion of the Simplício Hydroelectric Power Plant, Brazil. Sustainability 2020, 12, 7886. [Google Scholar] [CrossRef]
  23. Liu, Y.; Hu, J.M.; Wang, T.W.; Cai, C.F.; Li, Z.X.; Zhang, Y. Effects of vegetation cover and road-concentrated flow on hillslope erosion in rainfall and scouring simulation tests in the Three Gorges Reservoir Area, China. Catena 2016, 136, 108–117. [Google Scholar] [CrossRef]
  24. Wang, Y.; You, W.; Fan, J.; Jin, M.; Wei, X.; Wang, Q. Effects of subsequent rainfall events with different intensities on runoff and erosion in a coarse soil. Catena 2018, 170, 100–107. [Google Scholar] [CrossRef]
  25. Langhans, C.; Diels, J.; Climans, W.; van den Putte, A.; Govers, G. Scale effects of runoff generation under reduced and conventional tillage. Catena 2019, 176, 1–13. [Google Scholar] [CrossRef]
  26. Melo, M.T.; Palmeira, E.M.; Santos, E.C.; da Luz, M.P. Geosynthetic performance against slope erosion caused by high intensity rainfall. Geosynth. Int. 2020, 27, 1–49. [Google Scholar]
  27. Šimůnek, J.; van Genuchten, M.T. Modeling nonequilibrium flow and transport processes using HYDRUS. Vadose Zone J. 2008, 7, 82–97. [Google Scholar] [CrossRef] [Green Version]
  28. Shouse, P.J.; Ayars, J.E.; Šimůnek, J. Simulating root water uptake from a shallow saline groundwater resource. Agric. Water Manag. 2011, 98, 84–90. [Google Scholar] [CrossRef]
  29. Soulis, K.X.; Valiantzas, J.D.; Ntoulas, N.; Kargas, G.; Nektarios, P.A. Simulation of green roof runoff under different substrate depths and vegetation covers by coupling a simple conceptual and a physically based hydrological model. J. Environ. Manag. 2017, 200, 434–445. [Google Scholar] [CrossRef]
  30. Gubiani, P.I.; Mentges, L.R. Using root water uptake estimated by a hydrological model to evaluate the least limiting water range. Rev. Bras. Ciênc. Solo 2020, 44. [Google Scholar] [CrossRef]
  31. Šimůnek, J.; Sejna, M.; van Genuchten, M.T. The HYDRUS-2D Software Package for Simulating the Two-Dimensional Movement of Water, Heat, and Multiple Solutes in Variably-Saturated Media: Version 2.0; Agricultural Research Service, US Department of Agriculture: Riverside, CA, USA, 1999. [Google Scholar]
  32. Cai, G.; Vanderborght, J.; Couvreur, V.; Mboh, C.M.; Vereecken, H. Parameterization of root water uptake models considering dynamic root distributions and water uptake compensation. Vadose Zone J. 2017, 17, 2–21. [Google Scholar] [CrossRef] [Green Version]
  33. Sutanto, S.J.; Wenninger, J.; Coenders-Gerrits, A.M.J.; Uhlenbrook, S. Partitioning of evaporation into transpiration, soil evaporation and interception: A comparison between isotope measurements and a HYDRUS-1D model. Hydrol. Earth Syst. Sci. 2012, 16, 2605–2616. [Google Scholar] [CrossRef] [Green Version]
  34. Keim, R.F.; Tromp-Van Meerveld, H.J.; Mcdonnell, J.J. A virtual experiment on the effects of evaporation and intensity smoothing by canopy interception on subsurface stormflow generation. J. Hydrol. 2006, 327, 352–364. [Google Scholar] [CrossRef]
  35. Mendes, T.A.; Gitirana, G.F.N., Jr.; Rebolledo, J.F.R.; Vaz, E.F.; Da Luz, M.P. Numerical evaluation of laboratory apparatuses for the study of infiltration and runoff. Braz. J. Water Res. 2020, 25. [Google Scholar] [CrossRef]
  36. Araújo, A.G. Análise do Desempenho de Poços de Infiltração na Cidade de Goiânia. Master’s Thesis, University of de Goias, Goiânia, Brazil, 2013. [Google Scholar]
  37. Kühn, V.O. Resistência ao Cisalhamento de um Solo Tropical não Saturado Considerando Altas Sucções. Master’s Thesis, University of de Goias, Goiânia, Brazil, 2014. [Google Scholar]
  38. Laguna, M.A.A. Comportamento Hidromecânico de um solo Argiloso Compactado em Diferentes Umidades. Master’s Thesis, University of Goias, Goiânia, Brazil, 2015. [Google Scholar]
  39. Araújo, A.G. Uso de Microtomografia e Porosimetria para análise da Estrutura Bimodal de um Latossolo Vermelho Reconstituído. Ph.D. Thesis, University of Goias, Goiânia, Brazil, 2019. [Google Scholar]
  40. Vaz, E.F. On the Equilibrium of Suction and Pressure Plate Tests. Master’s Thesis, University of Goias, Goiânia, Brazil, 2019. [Google Scholar]
  41. Mendes, T.A.; Sávio, A.S.P.; Rebolledo, J.F.R.; Gitirana, G.F.N., Jr.; Melo, M.T.S.; Da Luz, M.P.S. Development of a rainfall and runoff simulator for performing hydrological and geotechnical tests. Sustainability 2021, 13, 3060. [Google Scholar] [CrossRef]
  42. Egeli, I.; Pulat, H.F. Mechanism and modelling of shallow soil slope stability during high intensity and short duration rainfall. Sci. Iran. 2011, 18, 1179–1187. [Google Scholar] [CrossRef] [Green Version]
  43. Souza, S.F.D., Jr.; Mendes, T.A.; Siqueira, E.Q.D. Development and calibration of a rainfall simulator for hydrological studies. Braz. J. Water Res. 2017, 22. [Google Scholar] [CrossRef] [Green Version]
  44. Kim, H.; Ko, T.; Jeong, H.; Ye, S. The development of a methodology for calibrating a large-scale laboratory rainfall simulator. Atmosphere 2018, 9, 427. [Google Scholar] [CrossRef] [Green Version]
  45. Jadhao, V.G.; Bhattarai, R.; Pandey, A.; Mishra, S.K. Performance evaluation of a rainfall simulator in laboratory. In Water Management and Water Governance; Pandey, A., Mishra, S.K., Kansal, M.L., Singh, R.D., Singh, V.P., Eds.; Springer: Cham, Switzerland, 2020; pp. 375–391. [Google Scholar] [CrossRef]
  46. Minguntanna, N.S. Determining a Set of Surrogate Parameters to Evaluate Urban Stormwater Quality. Master’s Thesis, Faculty of Built Environment and Engineering, Queensland University of Technology, Brisbane, QLD, Australia, 2009. [Google Scholar]
  47. Decagon Devices Inc. Soil Moisture Sensors: User’s Manual; Decagon Devices Inc.: Pullman, WA, USA, 2008. [Google Scholar]
  48. UMS. User’s Manual—T5 Tensiometer. Available online: http://library.metergroup.com/Manuals/UMS/T5_Manual.pdf (accessed on 23 March 2021).
  49. Drastig, K.; Quiñones, T.S.; Zare, M.; Dammer, K.H.; Prochnow, A. Rainfall interception by winter rapeseed in Brandenburg (Germany) under various nitrogen fertilization treatments. Agric. For. Meteorol. 2019, 268, 308–317. [Google Scholar] [CrossRef]
  50. Gardon, F.R.; Toledo, R.M.; Brentan, B.M.; Santos, R.F. Rainfall interception and plant community in young forest restorations. Ecol. Indic. 2020, 109, 105779. [Google Scholar] [CrossRef]
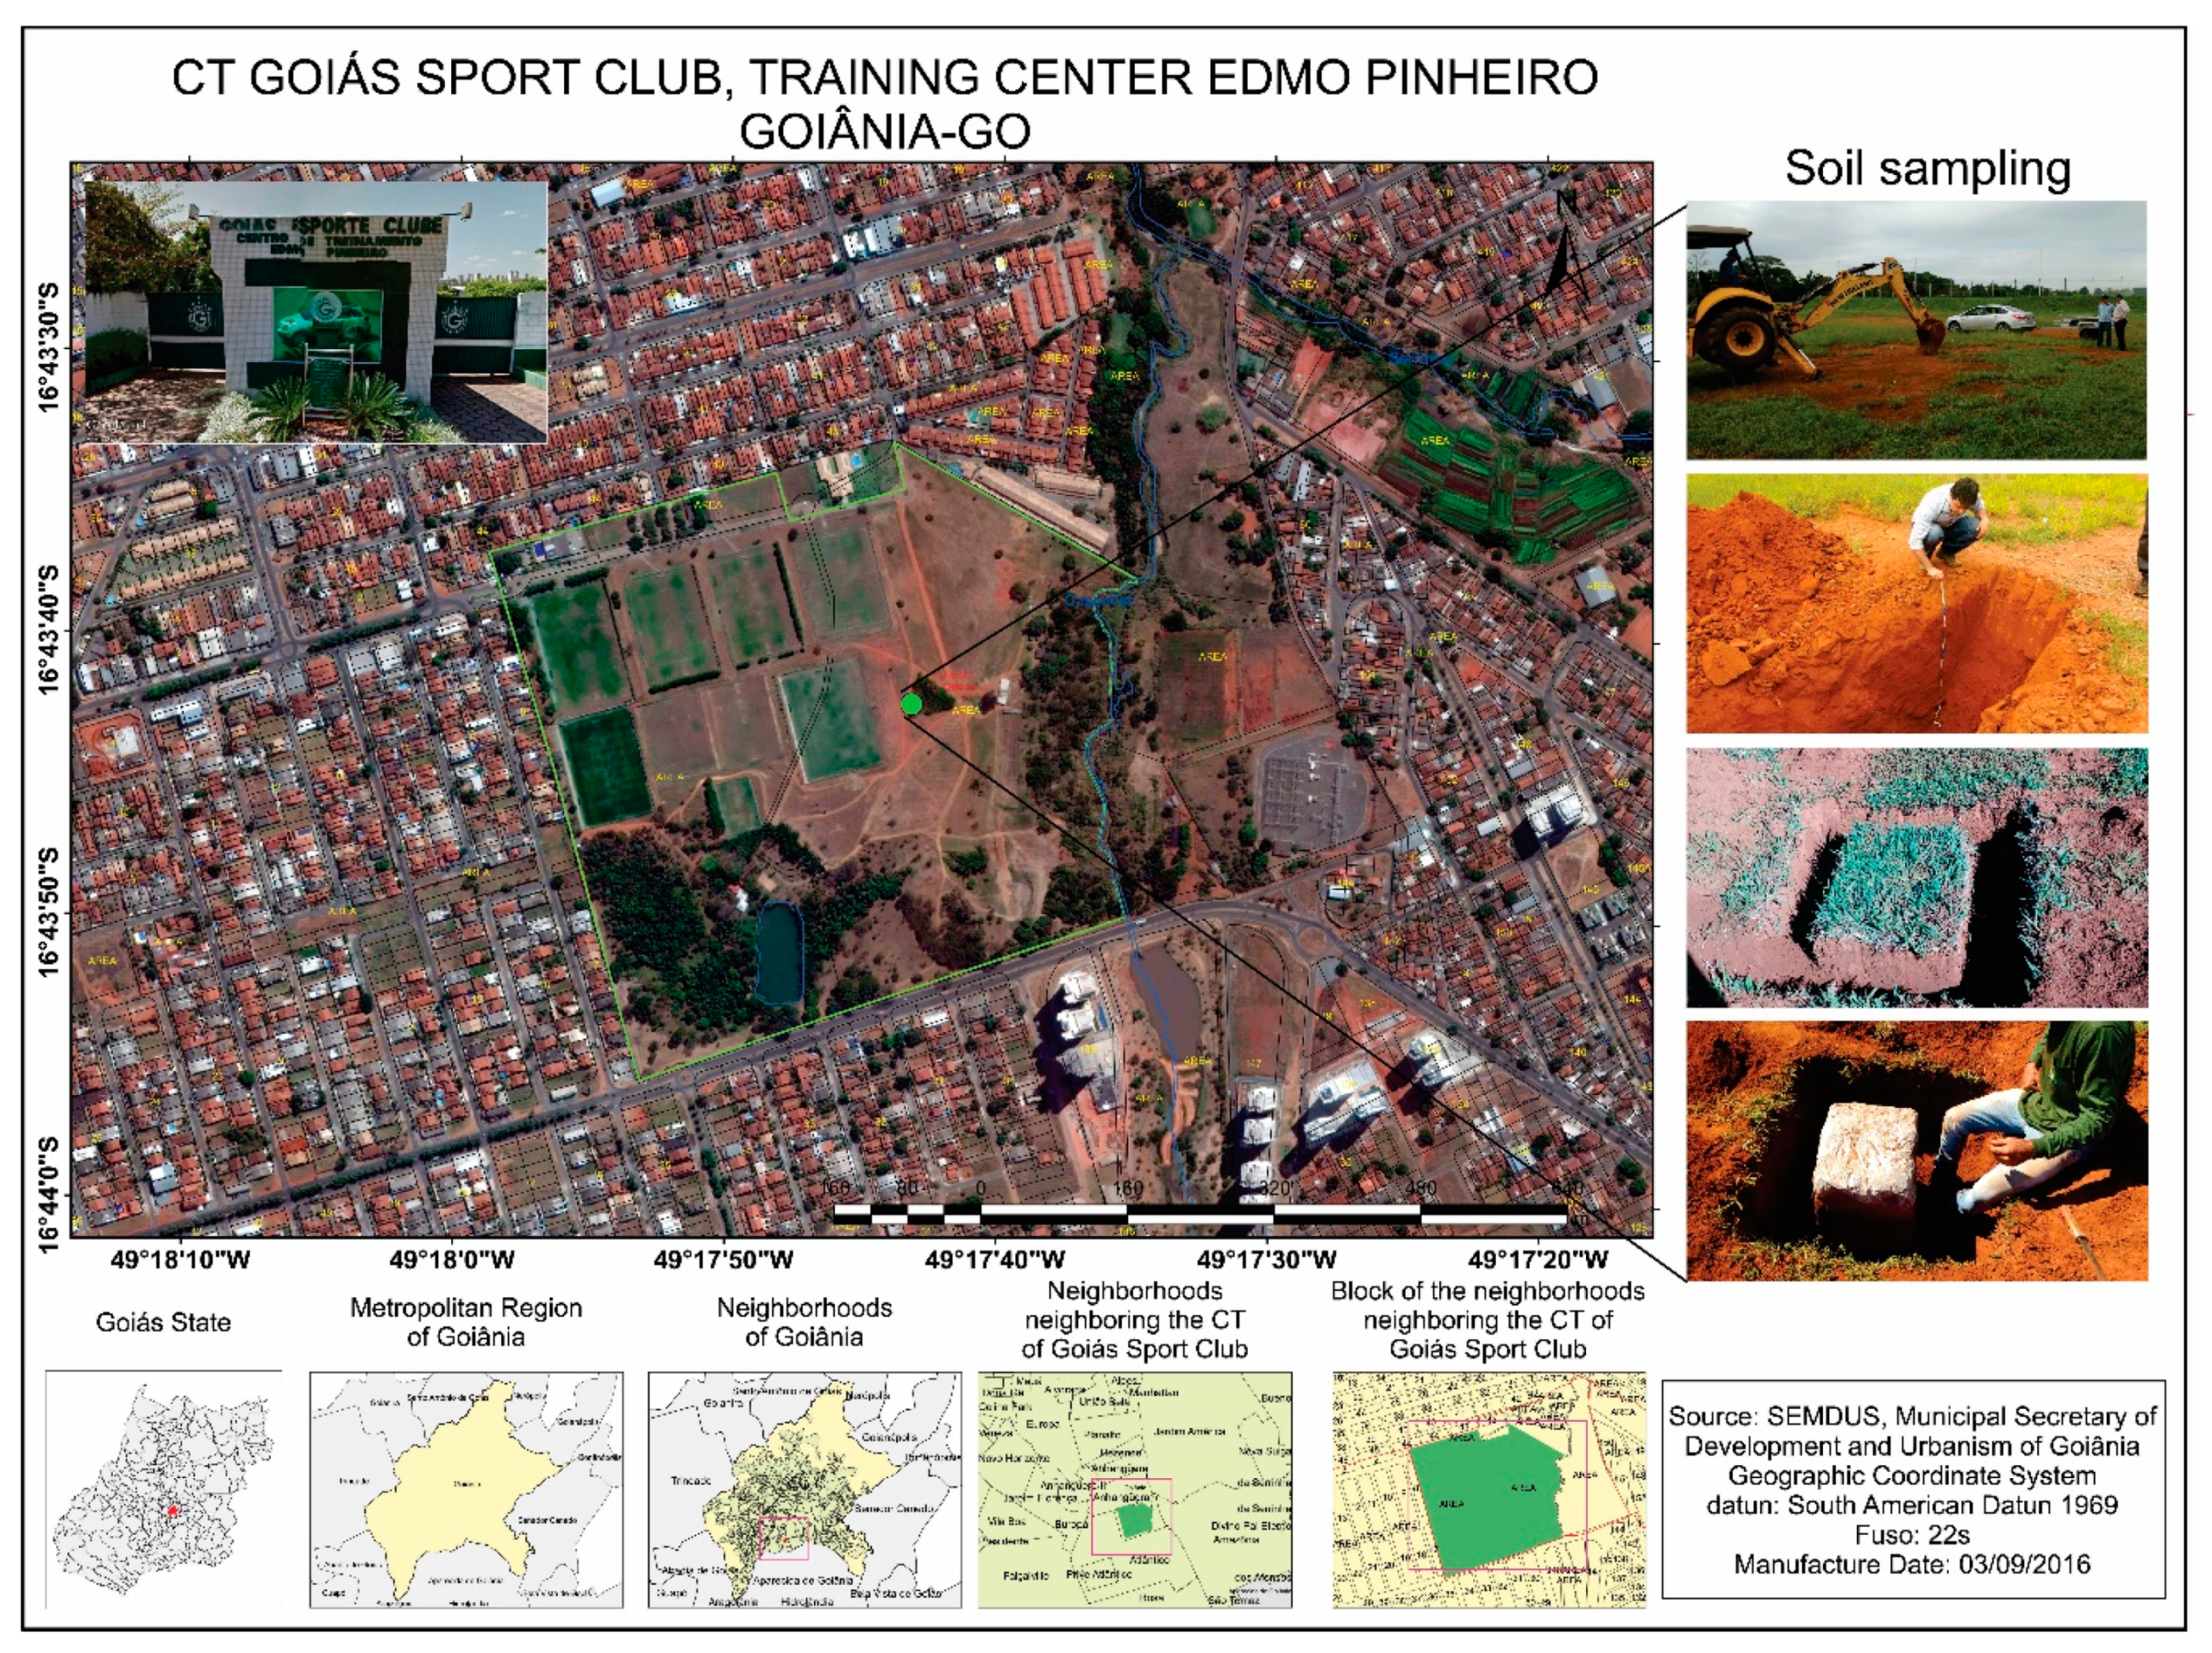
Figure 1. Site of soil sampling (disturbed and undisturbed).
Sustainability 13 05082 g001
Figure 2. Particle-size distribution curves of the specimens [39].
Sustainability 13 05082 g002
Figure 3. Complete design of the RS showing the rain generator and the monitoring system.
Sustainability 13 05082 g003
Figure 4. Specimen preparation and stages: (a) static compaction; (b) grass growth in the wooden container; (c) overview of the root system of the specimen outside the container; (d) assembly of the acrylic container; (e) locking of a bare soil specimen in the RS; and (f) tensiometer instrumentation.
Sustainability 13 05082 g004aSustainability 13 05082 g004b
Figure 5. Evaluation of the interception: (a) specimens with bare and vegetated surfaces; (b) determination of wetting front breakthrough time; (c) infiltration and interception partitioning.
Sustainability 13 05082 g005
Figure 6. Pore-water pressure changes: (a) bare soil and (b) vegetated soil.
Sustainability 13 05082 g006
Figure 7. Relationship between root content and hydraulic conductivity.
Sustainability 13 05082 g007
Figure 8. Volumetric water content changes: (a) bare soil and (b) vegetated soil.
Sustainability 13 05082 g008
Figure 9. Degree of saturation changes: (a) bare soil and (b) vegetated soil.
Sustainability 13 05082 g009aSustainability 13 05082 g009b
Figure 10. Surface runoff and erosion for the test on the bare soil (α = 15° and PP = 86.0 mm h1).
Sustainability 13 05082 g010
Figure 11. Time lag between bare and vegetated soil surfaces: (a) tensiometer 1 and (b) tensiometer 2.
Sustainability 13 05082 g011
Table 1. Properties of the soil used.
γ d   ( kN   m 3 ) γ   ( kN   m 3 ) GSn (%)wL (%)wP (%)PIpH
13.515.92.6948.833.222.011.25.6
Table 2. Summary of the initial condition of the tests in the RS.
TestTensiometer w 0   ( % ) θ 0 , s e n s o r
(m3 m−3)
u w 0   ( kPa )
Test #1
Without vegetation
117.70.196−25.9
218.30.215−24.0
317.80.196−26.3
418.50.176−20.6
518.60.225−18.2
Test #2
With vegetation
115.40.026−79.6
215.90.062−66.9
314.30.098−72.2
414.20.101−53.1
512.20.084−83.4
Note: w 0 is the initial gravimetric water content, u w 0 is the initial pore-pressure, and θ 0 , s e n s o r is the measured volumetric water content.
Table 3. Summary of wetting front breakthrough times.
PointBreakthrough Time (minutes)Lag Time (minutes)
Bare SurfaceVegetated Surface
14.427.613.19
23.717.954.23
34.865.550.69
420.8924.103.21
564.5566.952.40
Table 4. Previously reported vegetation interception values.
AuthorsGrass SpeciesCountryTesting ConditionVegetation Height (cm)Rainfall Intensity (mm h−1)Interception (mm)Interception (%)
Wang et al. [24](Medicago sativa) AlfalfaChinaField11–660.06 *0.46–1.49-
Clark [15]Andropogon furcatusUSAField56–926.352.6784
25.411.9247
50.825.9151
Clark [15]Stipa spartea, Bouteloua curtipendula, Sporobolus heterolepisUSAField46–616.351.7857
25.410.9243
Clark [15]Agropyron smithiiUSAField7712.72.92–3.1846–50
Clark [15]Elymus canadensis L. USAField10212.73.8160
Clark [15]Spartina pectinataUSAField102–1156.352.2972
12.74.3268
25.47.1155
Drastig et al. [49]Triticum aestivum L.; Hordeum vulgareL.GermanyLaboratory-112 mm (March, 2014 to June, 2016)0.92–2.92 **40–72
Gardon et al. [50]Brachiaria sp.; Panicum maximum; Melinis sp.BrazilField-0.14–0.19 *3.1–30.014.9–26.4 of annual interception of PP
* Average annual rainfall; ** calculated for 26 rainfall events.
Publisher’s Note: MDPI stays neutral with regard to jurisdictional claims in published maps and institutional affiliations.