Article

Children’s Pictorial Expression of Plant Life and Its Connection with School-Based Greenness

1
Faculty of Education Bilbao, University of the Basque Country (UPV/EHU), 48940 Leioa, Spain
2
Faculty of Science and Technology, University of the Basque Country (UPV/EHU), 48940 Leioa, Spain
*
Author to whom correspondence should be addressed.
Sustainability 2021, 13(9), 4999; https://doi.org/10.3390/su13094999
Submission received: 9 March 2021 / Revised: 23 April 2021 / Accepted: 26 April 2021 / Published: 29 April 2021

Abstract

:
Previous research highlights the positive influence that experiences in nature have on children’s physical, emotional and conceptual development. There is also evidence that indicates that the availability of green areas on school grounds is associated with pupils’ better academic performance as well as with their comprehension of wildlife. This study examines the drawings that 152 children completed with the objective of expressing their understanding of the plant world. Approximately half of the drawings were depicted by children that attend a school with green areas within the school site as well as in the surrounding area. The remaining half of the sample includes the illustrations that children attending an educational centre with, virtually, no green areas within the school premises or in the immediate vicinity. Notwithstanding the fact that the two schools involved in the study belong to a similar social context and they are relatively close to each other, the results show relevant differences between the drawings by the two groups compared, in terms of the pictorial content and the utilisation of colour. The results are discussed in light of the growing number of studies that emphasise the positive impact that close contact with nature has on children’s everyday life at school.

1. Introduction

Most children enjoy activities in nature. Gardening, collecting and observing living beings, exploring or just playing in gardens and green areas are among those activities in which children love being involved [1,2].
The significance of the close contact with nature in early years, however, goes beyond mere enjoyment. Research indicates that children’s engagement in nature-based out-of-doors activities has a relevant and positive impact on their mood and welfare [3]. Current evidence also points out that activities in nature have a positive influence on motor and cognitive development in childhood [4].
In addition, children with more access and more experiences in nature display higher levels of connection with the environment, a fact that results in a greater tendency to display pro-environmental behaviours [5]. Not surprisingly, the establishment of green areas that allow young people to interact with plants and animals in their natural environment constitutes an essential aspect of plans for conservation and improvement of biodiversity in urban areas [6] because involvement with nature plays a decisive role in shaping positive attitudes towards biodiversity that last well beyond infancy.
Regarding the conceptual development within the biological domain, children’s understanding of biodiversity and their knowledge about the environment improve as the opportunities that they have to interact with nature expand [5,7]. This way, outdoor educational programmes that encourage children to experience nature first-hand have proved an effective means of enhancing their understanding of nature [8]. Similarly, activities in a school garden serve to improve pupils’ knowledge about wildlife and environmental processes [9], and they are related to improvements in children’s knowledge about vegetables, a fact that contributes to developing more healthy nutrition behaviours [10].
In this context, school grounds are of special relevance as optimal places to provide early contact with nature, to promote a better understanding of biodiversity and to involve schoolchildren in environmental education [11]. In this regard, some regulations in Europe recommend that 0.5 m2 per pupil should be set aside on the school premises for natural habitats including, for example, untreated grassed areas, gardening areas, pods, meadowlands, planted borders and trees [12]. These ideas connect with recent research that highlights the fact that the outdoor environment surrounding schools might have a beneficial effect on students’ academic performance [13].
On a separate but not unrelated matter, the analysis of young children’s drawings of nature has proved to be a useful source of information to collect data regarding how the understanding of biological phenomena evolves during childhood. Thereunder, Eugenio-Gozalbo, Aragón, and Ortega-Cubero [14] examine children’s drawings of “a garden” to track what aspects of science learning enhance when children take part in activities in a school garden. The authors pinpoint that the knowledge linked to plant life is the most prevalent science learning that children achieve thanks to their participation in this kind of nature-based out-of-doors activities. Similar results are reported in Laaksoharju’s study [15], which indicates that children’s pictorial expression about a garden becomes more detailed and with a greater variety of plants after being involved in gardening activities during summer time. The latter paper also highlights that compared to the representations drawn by children in urban areas, the depictions that children in rural settings create on the topic of gardens tend to display plants in more detail as well as to introduce a greater variety of vegetables in their illustrations. Villarroel, Antón, Zuazagoitia and Nuño [16] also account for significant differences between drawings on the issue of plant life that children enrolled in rural schools depict and those made by children attending urban schools. Based on this study, the differences arise in connection with the variety of plants but particularly with the tendency that rural schoolchildren show to illustrate plant specimens in more detail.
Taken as a whole, the abovementioned studies strengthen the assumption that close contact with nature has a positive impact on children’s affective, cognitive and motor development and facilitates the emergence of pro-environmental attitudes and behaviour in childhood. All of the bibliographic references previously cited also reinforce the belief that the opportunities for nature-based experiences provided by schools (either by activities in their green areas or by to the fact that schools’ location facilitates children’s contact with the natural environment) beneficially influence the understanding and graphic expression of nature in childhood.
This research project attempts to collect fresh data coherent with this belief. More specifically, the research question that guides this study refers to whether the fact that schools present marked dissimilarities in terms of the possibilities that they offer to facilitate their students’ contact with nature can be related to differences in the drawings that children in the initial educational levels create to express their knowledge about the plant world. It is worth noting that, although significant efforts have been made to examine the influence that the school environment has on pupils’ comprehension of nature, the study of whether this influence extends to children’s way to express their knowledge of biological phenomena has been significantly more limited. Importantly, no study has examined the drawings of plant life made by children from schools that are very different in terms of accessibility to green areas.
This way, the study analyses two samples of drawings that children aged 4–7 years old drew when they were asked to express, through drawings, what the plant world means to them. The two samples originate from two urban schools belonging to the same cultural context and they both are publicly funded. The schools, however, show very different characteristics when it comes to accessibility to green areas.
The specific objectives are as follows:
  • To examine the pictorial content and the use of colour in the drawings that children in the sample depict to express their knowledge about plant life; and
  • To relate the differences that the two educational centres included in the study show in terms of accessibility to green areas with the pictorial content and the use of colour in the depictions of the plant world that the children in the sample draw.
The ultimate purpose of the study is to provide the scientific community with additional data regarding the role that green areas within and around educational centres have in the promotion, throughout childhood, of more accurate knowledge about biodiversity and nature.

2. Materials and Methods

The methods used in the research begin with a description of the characteristics of the educational centres involved in the study and the sample of drawings examined. Next, the pictorial task proposed to the participating students is detailed, as well as the variables considered for the data analysis. Finally, the ethical considerations linked to the research procedure are presented.

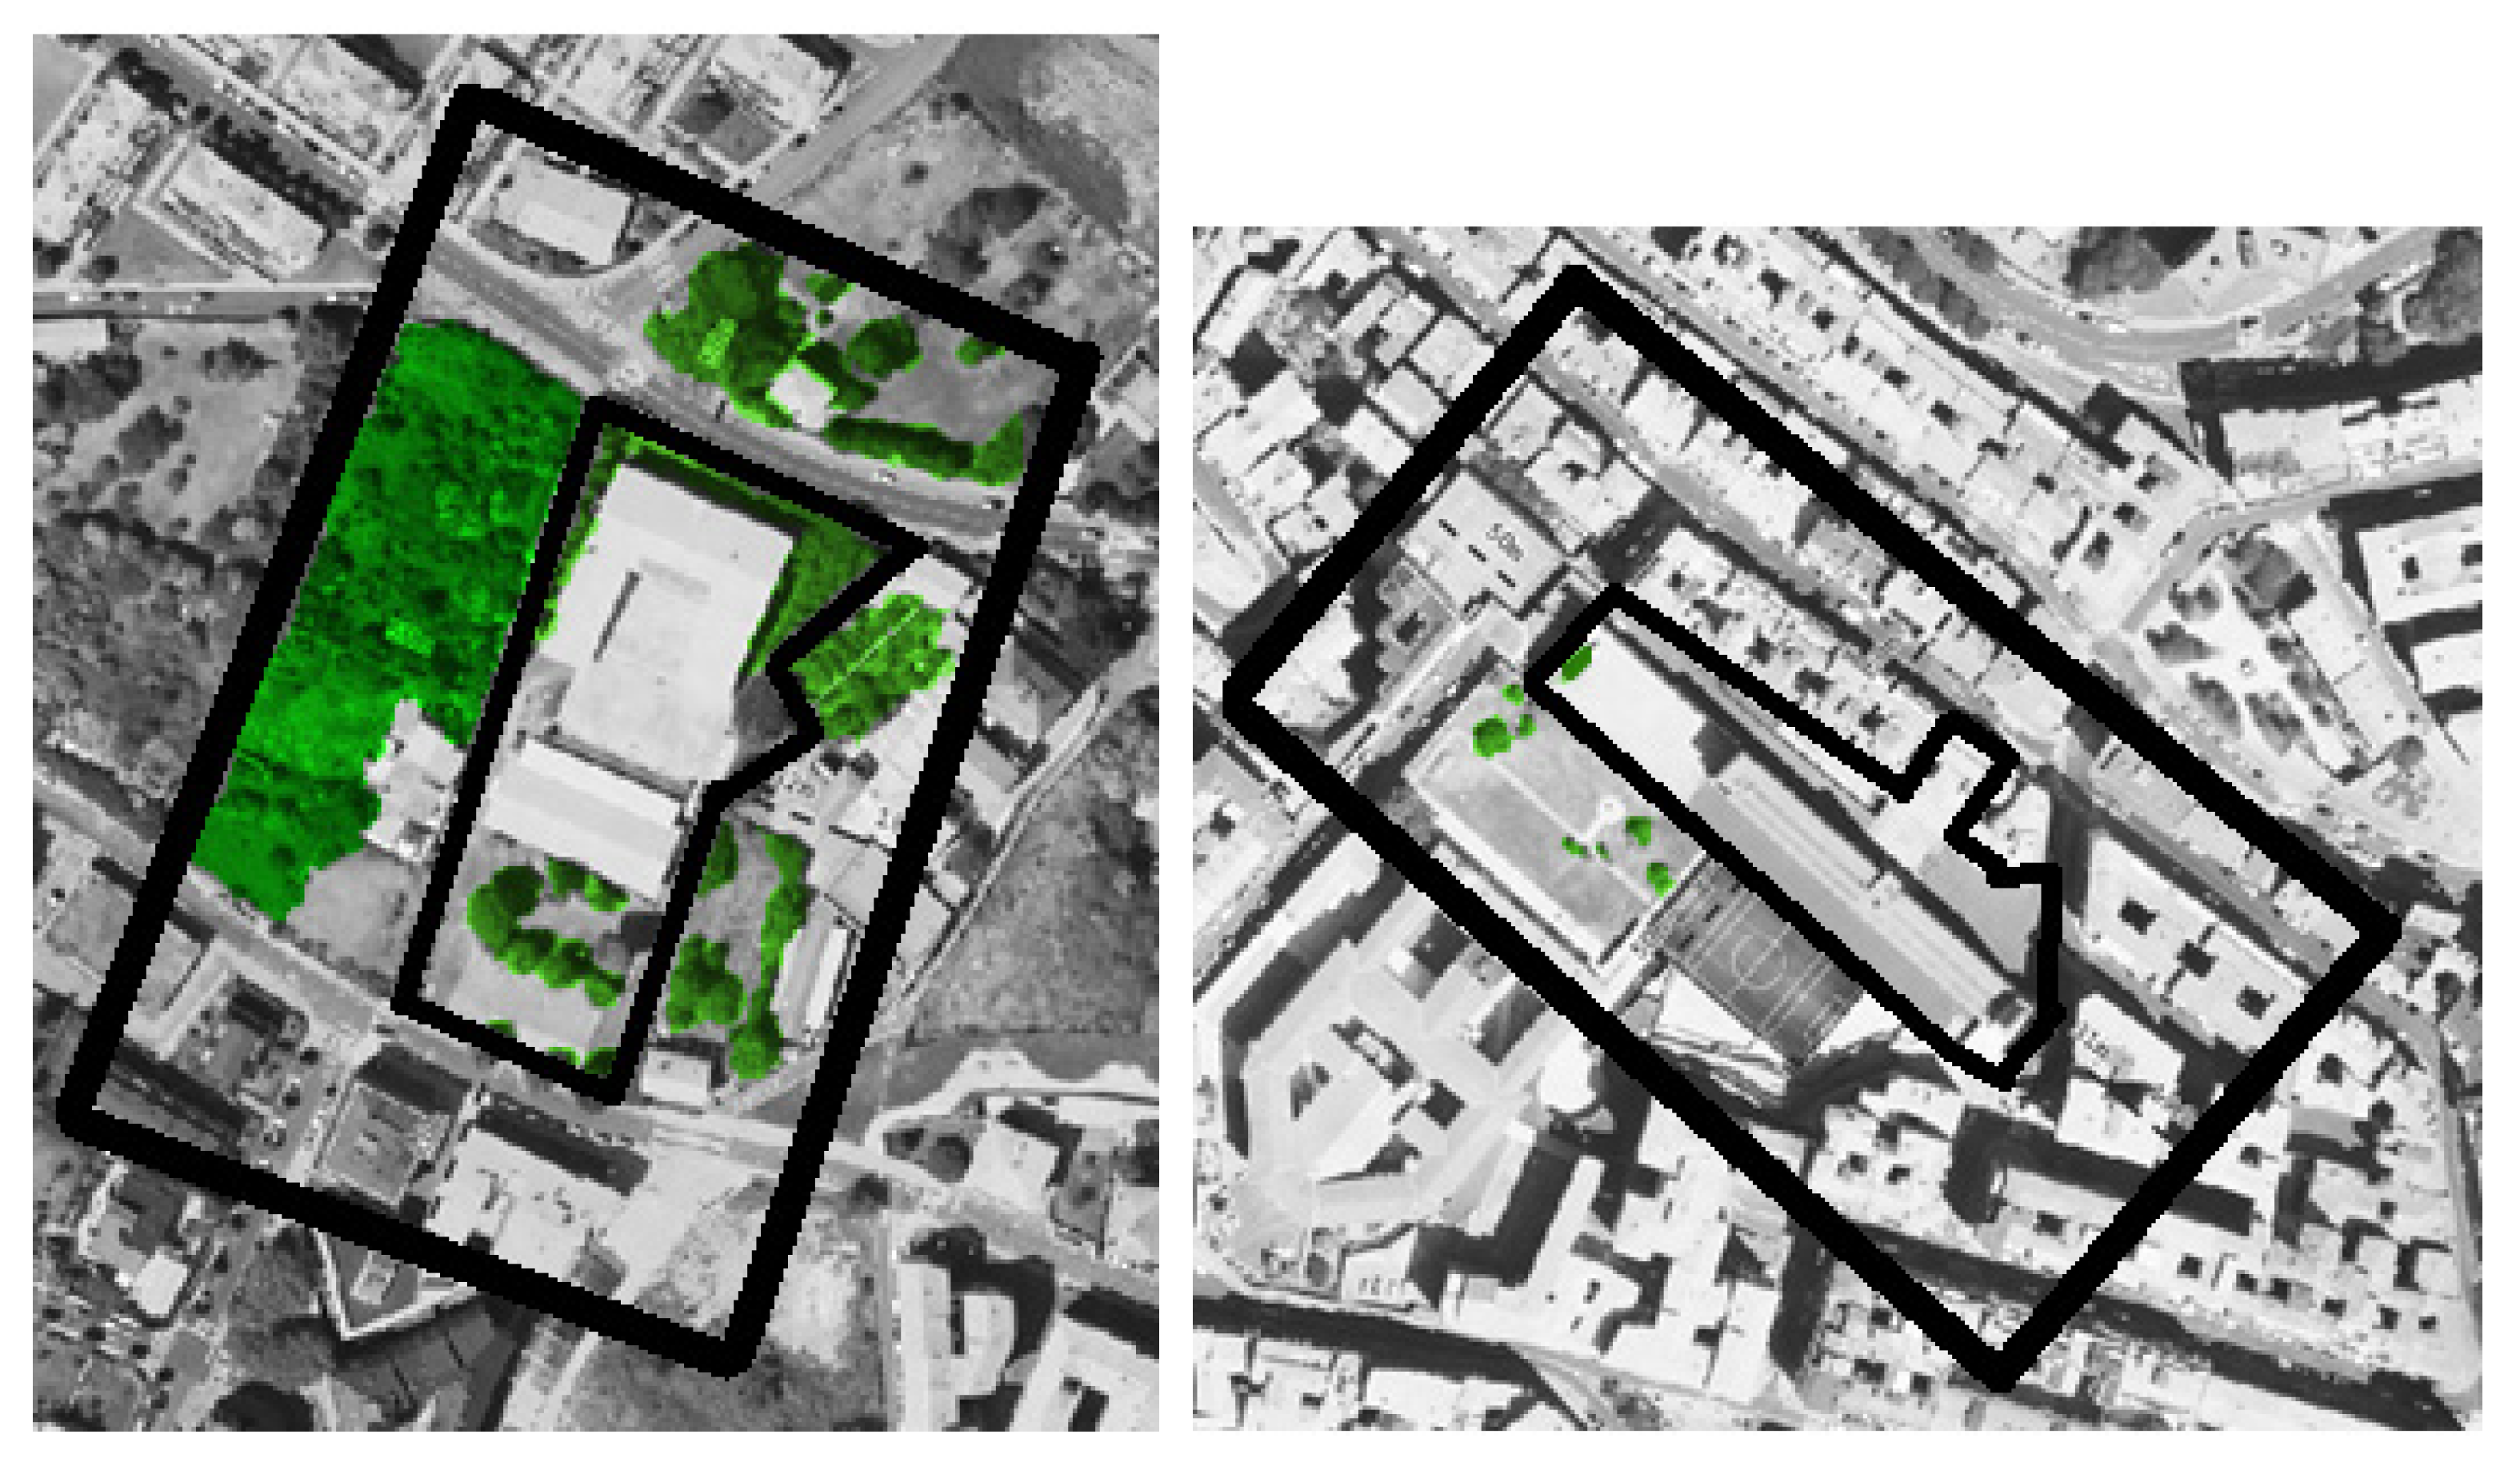
2.1. Description of the Educational Centres Involved in the Study

The research was carried out in two urban schools that are located in the metropolitan area of Bilbao (Spain) [17]. They are within 20 km of each other.
The first school (hereinafter, school A) is located in the municipality of Getxo, which has a population of less than 80,000 inhabitants. The second educational centre (hereinafter, school B) is located in the city of Bilbao, with a population of over a quarter of a million inhabitants.
School A is located in a transition zone between the urban area of the city and the rural area surrounding the municipality. The environment surrounding the school is characterised as having an intermediate population and urban density and has green areas, parks and orchards.
School B, on the other hand, is located in the centre of the city of Bilbao in a highly urbanised area, with high population density and without green areas around the school. Table 1 presents information regarding the context in which the schools participating in the study are located [18].
Table 2 breaks down the information related to the green areas within the school grounds and their surroundings.
The green areas within the school premises and their perimeters were obtained through the GeoEuskadi geospatial information service [19]. Following the procedure used in a previous investigation [1], the surrounding green area was measured at a perimeter 50 m wide from the outer limit of the school buildings. GIMP software was used for the analysis and processing of the images [20].
Figure 1 shows aerial photographs of the schools involved in the study, showing the boundaries of the school campus as well as the 50-metre-wide perimeter that was used as a reference for estimating the surrounding green area.

2.2. The Sample of Drawings Studied

This study analyses a total of 152 drawings created by students between 4 and 7 years of age. This age range has been the focus of particular attention of prior research regarding the understanding of biological phenomena in early childhood [16]. Seventy of the drawings were made by the students in school A and 82 by students in school B. The ratio of the number of girls to the number of boys was 1:1. Table 3 presents the distribution of the participants in the sample regarding their educational level and age
The number of girls and boys is exactly the same in each school. There are no statis-tical differences in the number of students by level between the two schools (Chi squared test = 1.432 [2]; p = 0.482). Moreover, there are no differences by sex between the three levels (Chi squared test = 1.387 [2]; p = 0.5).
The Appendix A presents four representative drawings of the analysed illustrations (see Figure A1, Figure A2, Figure A3 and Figure A4).

2.3. Description of the Pictorial Task

The drawings composing the sample were collected during the month of June 2019 through individual interviews with the participating children. The interviews were conducted by a single person, and the same researcher was in charge of all the interviews.
Next, the procedure used to carry out the interviews with the students is described, which coincides with the protocol used in previous investigations [21,22].
The pictorial activity began with the researcher meeting with the students of each classroom to introduce themselves and present the activity. During this first meeting, the researcher, with the help of the teacher responsible for the group, told a story to the children in which the character explains their difficulty in understanding what plants are. The researcher used a doll to tell the story, and the aim was to motivate the students to become engaged in the task of explaining, through drawing, everything they know about the world of plants to the story’s protagonist.
After this introduction and story-telling, individual interviews with each of the study’s participants began. The children were asked to explain through a drawing everything they knew about plants in order to help the story’s protagonist understand what plant life is. During the interview, the children were not offered additional information regarding how to complete the drawings. This interview was conducted in a place connected to the classroom but outside of it. During the interview, a sheet of paper, a pencil, an eraser and a pen were made available to the child. After they finished drawing, 12 markers were offered in random order, in the following colours: dark green, light green, dark blue, light blue, black, brown, red, yellow, orange, purple, pink and grey. The pictorial activity lasted between 10 and 15 minutes. After the child expressed that she or he had finished the drawing, the researcher reviewed with them the meaning of the pictorial content depicted to be sure that she could understand what the child had wanted to represent.
It should be noted that the students were generally very agreeable to participating in the pictorial activity.

2.4. Variables and Statistical Procedures

The research described in this article is based on analysing the variables indicated below. The selection of the variables is in line with the procedures described by previous research regarding the study of children’s representations of plant world [21,22]:
(a)
Independent variables: educational centre (school A and school B) and sex.
(b)
Dependent variables: related to the pictorial content and the colour used in the drawings, as follows:
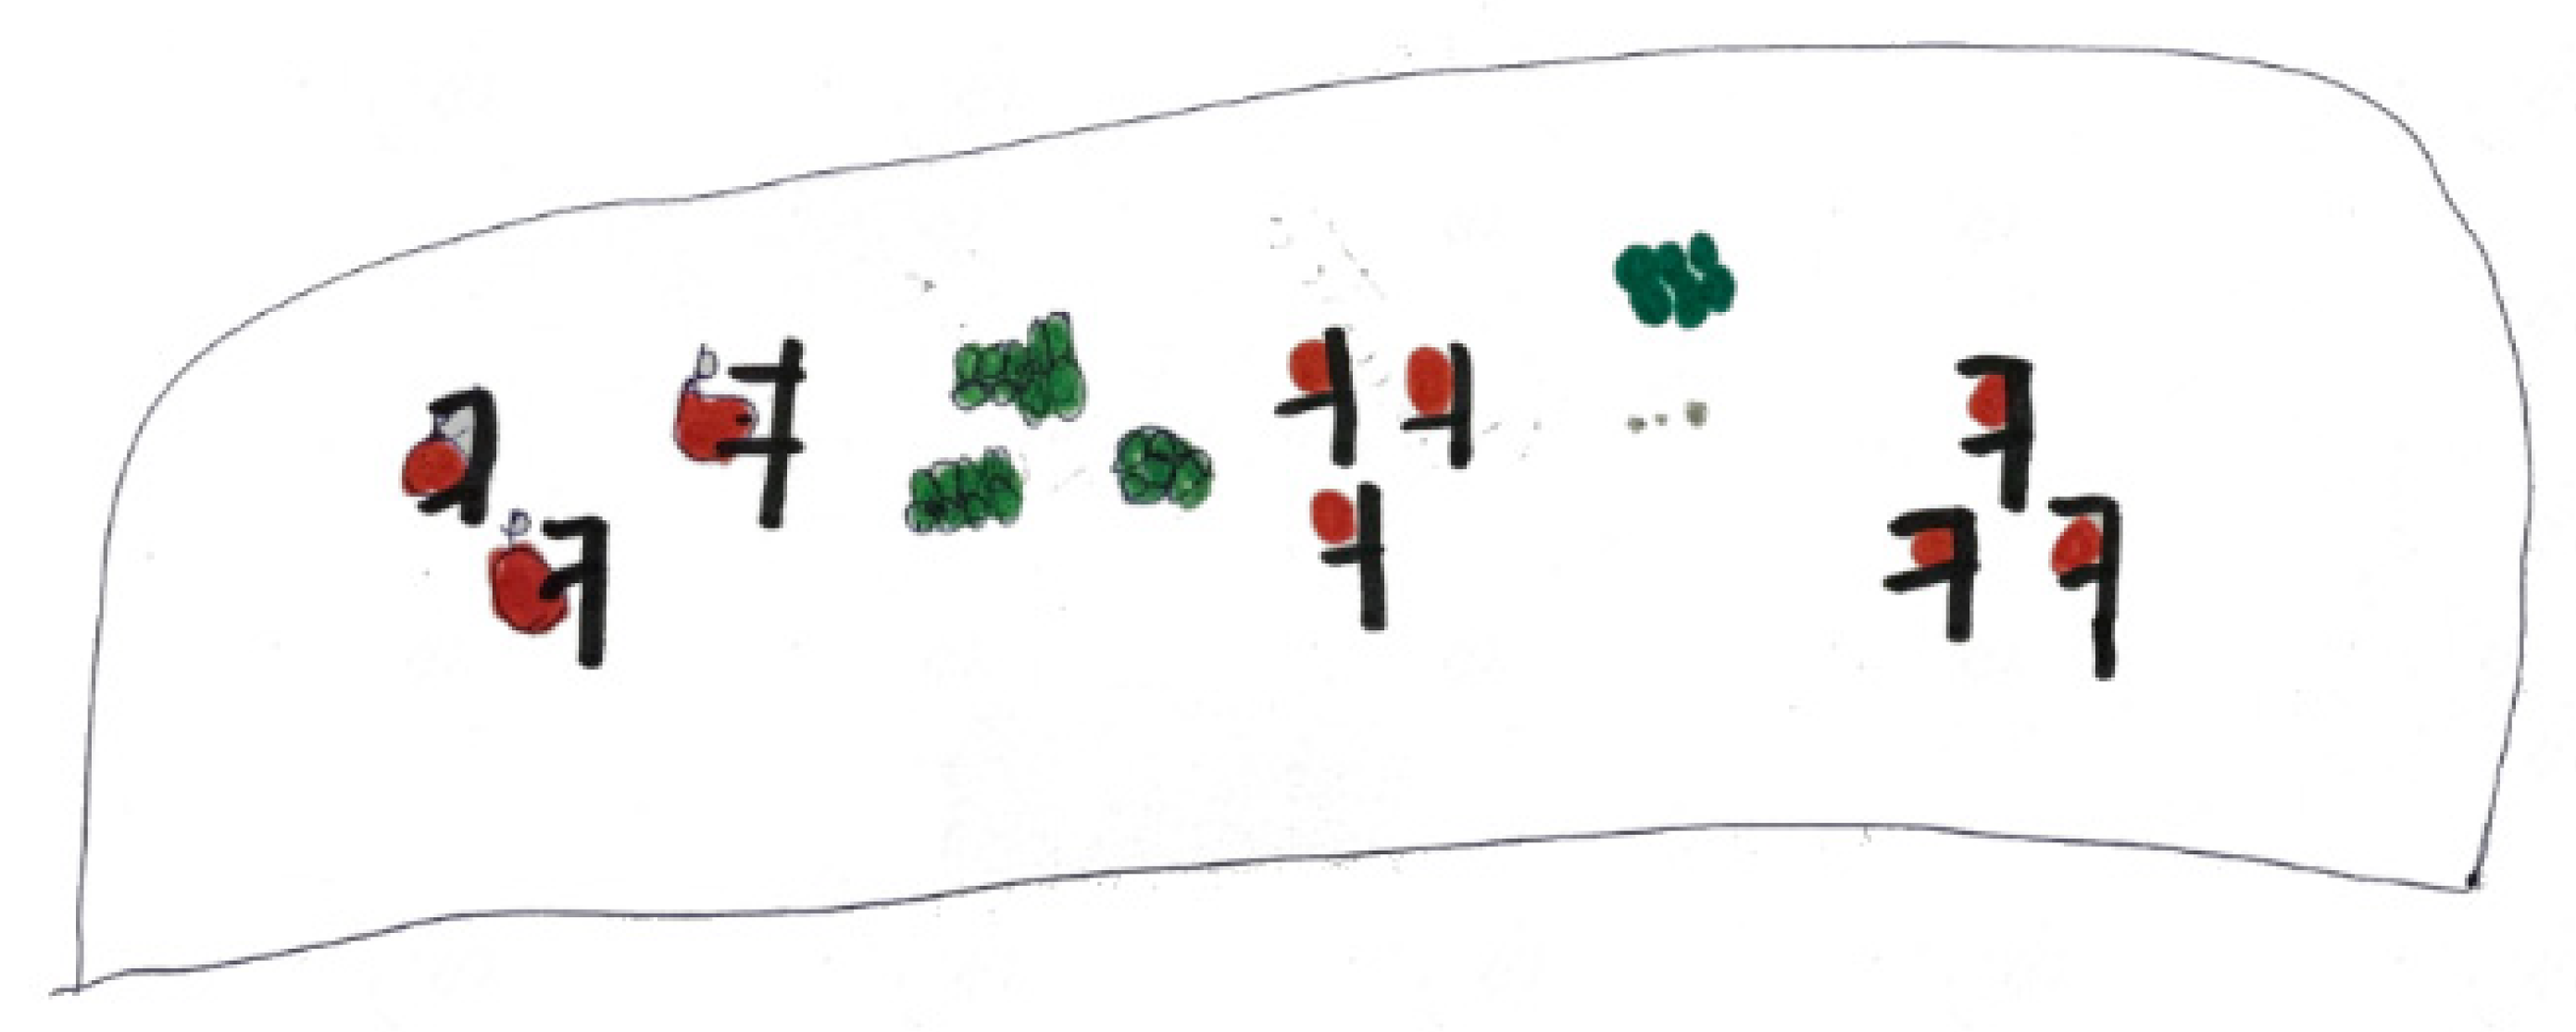
  • Number of pictorial elements identified in each of the drawings composing the sample. It is understood that a pictorial element is the graphic representation of a drawn entity that presents a certain level of independence with respect to other parts of the drawing. The pictorial elements can be realistic representations of objects and living beings, for example, a flower or a tree, but they can also be abstract representations, such as decorative patterns. The researcher who carried out the meeting with the children also encoded the drawings, based on the information that she had collected regarding the meaning of the pictorial content of the drawings in the interviews. Notably, this same criterion has been used in previous research [23].
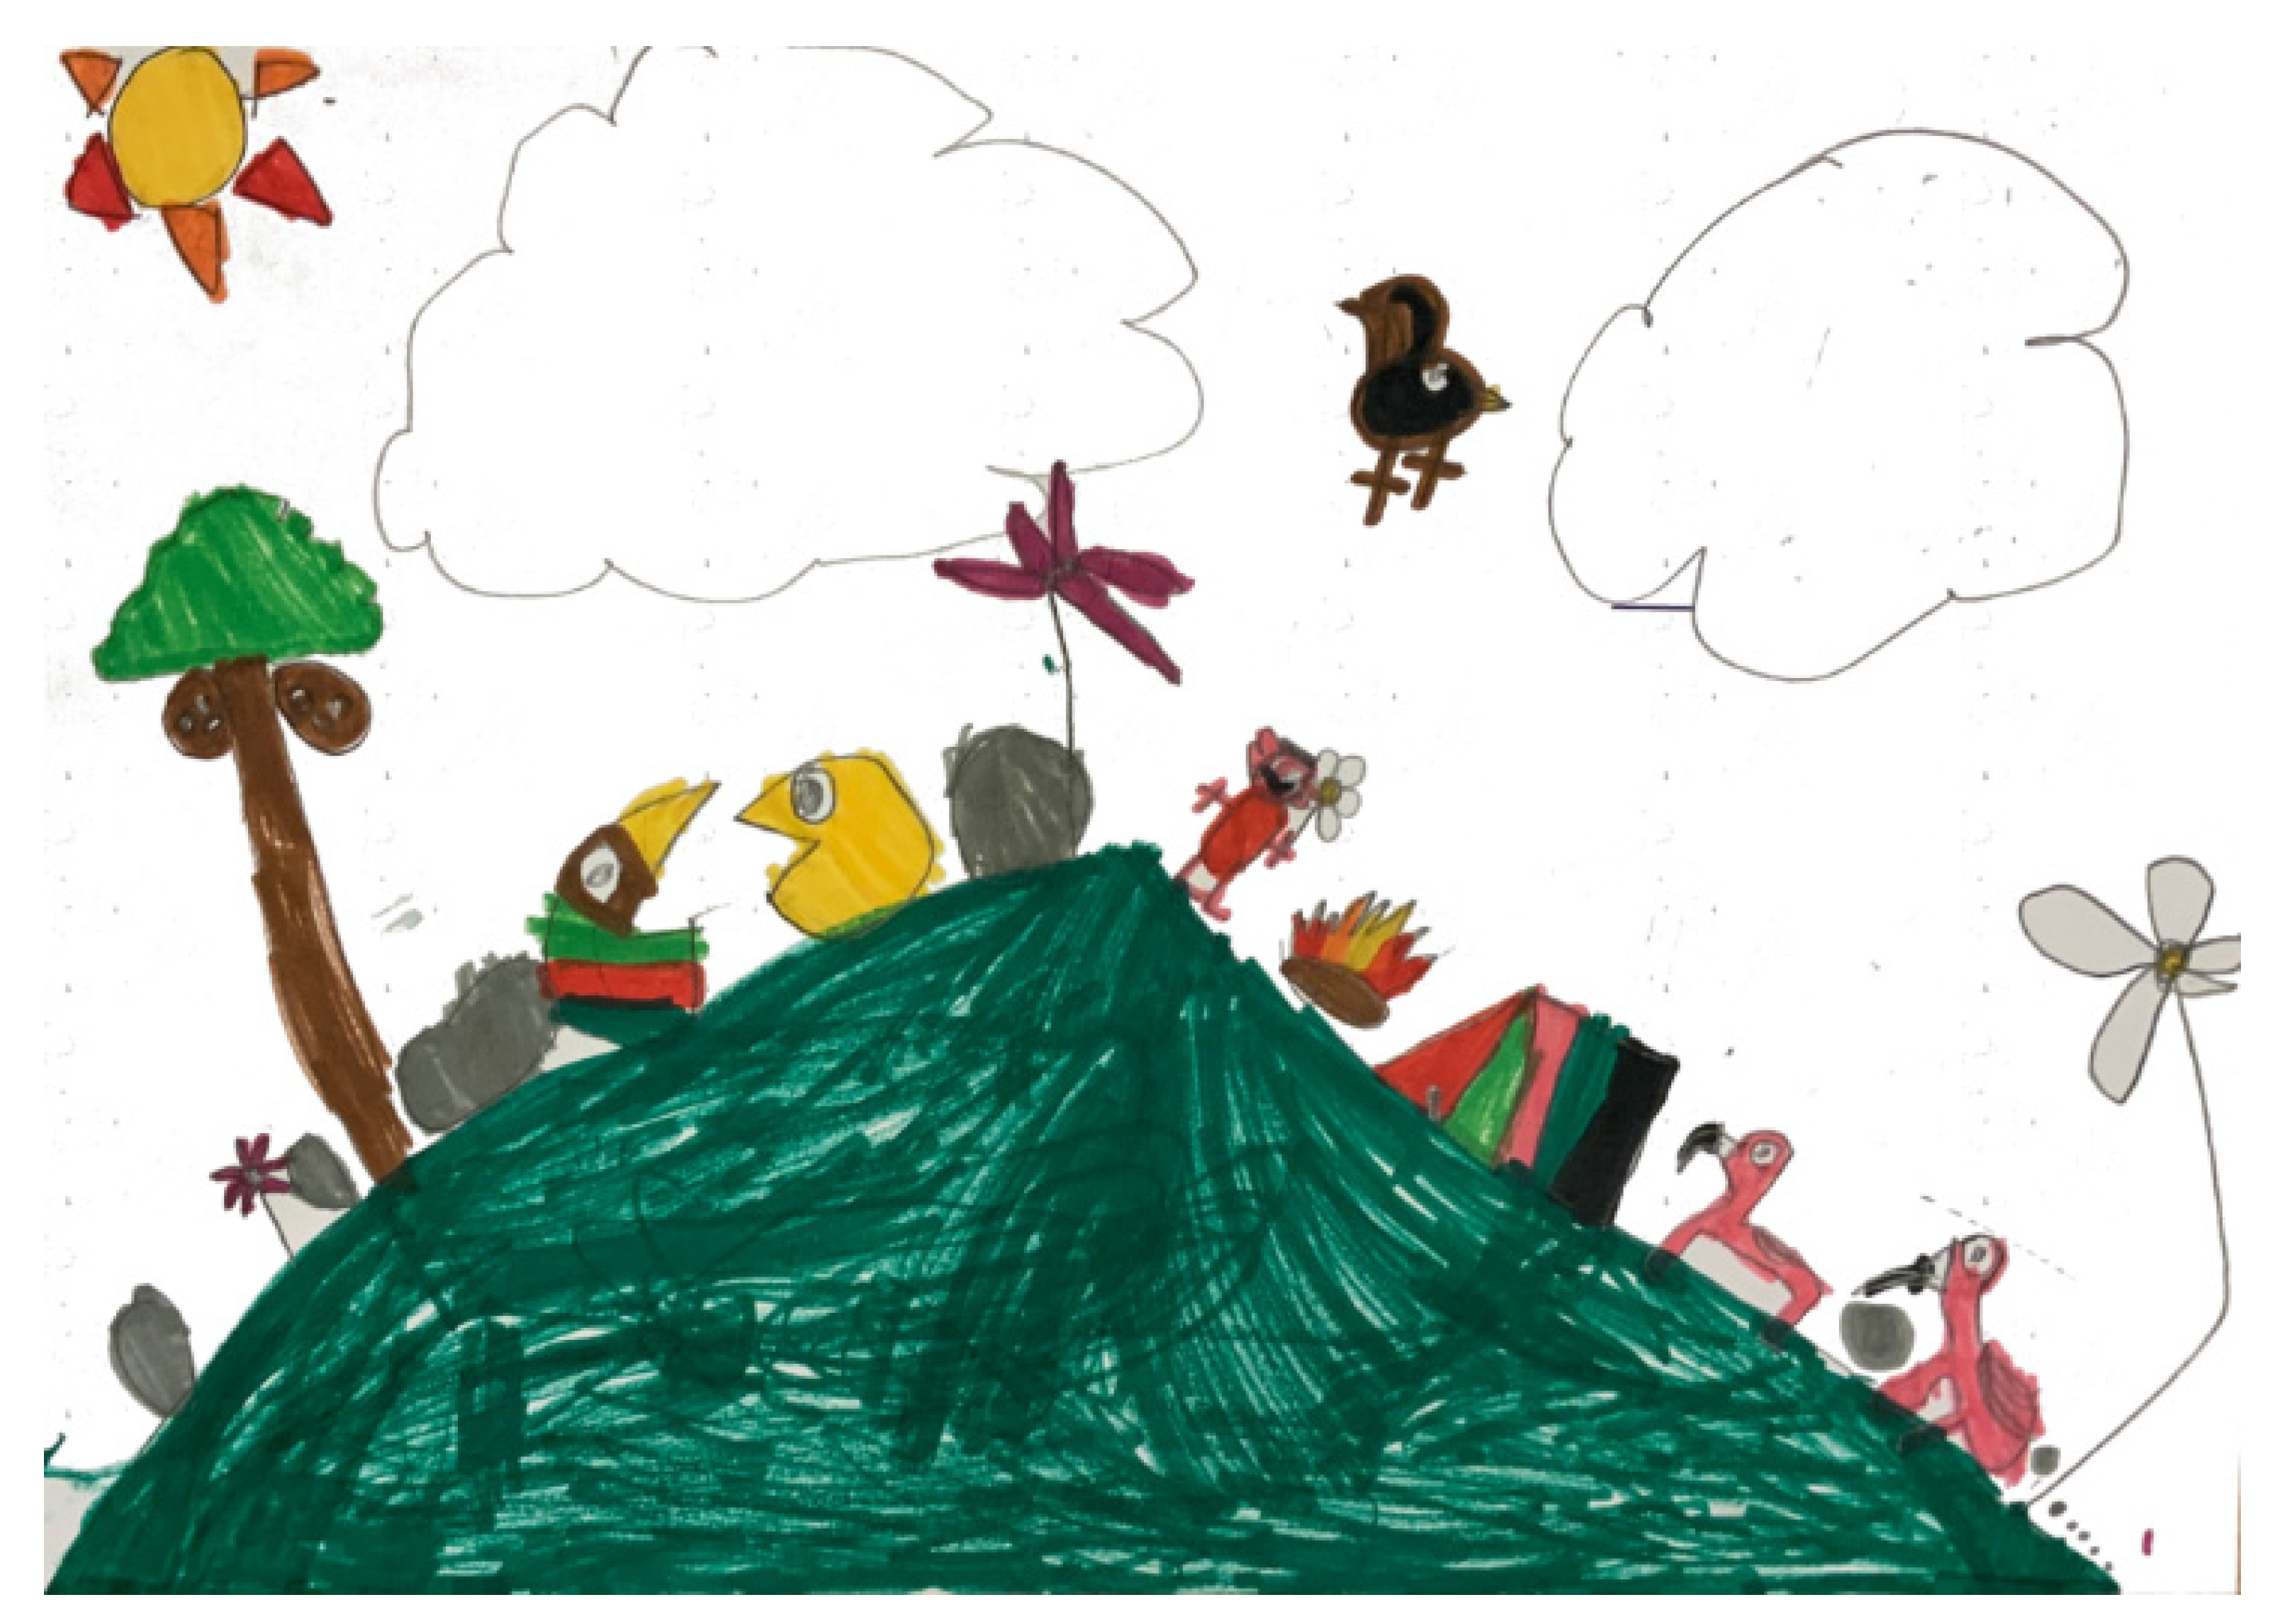
  • Number of different pictorial elements in each of the following five categories:
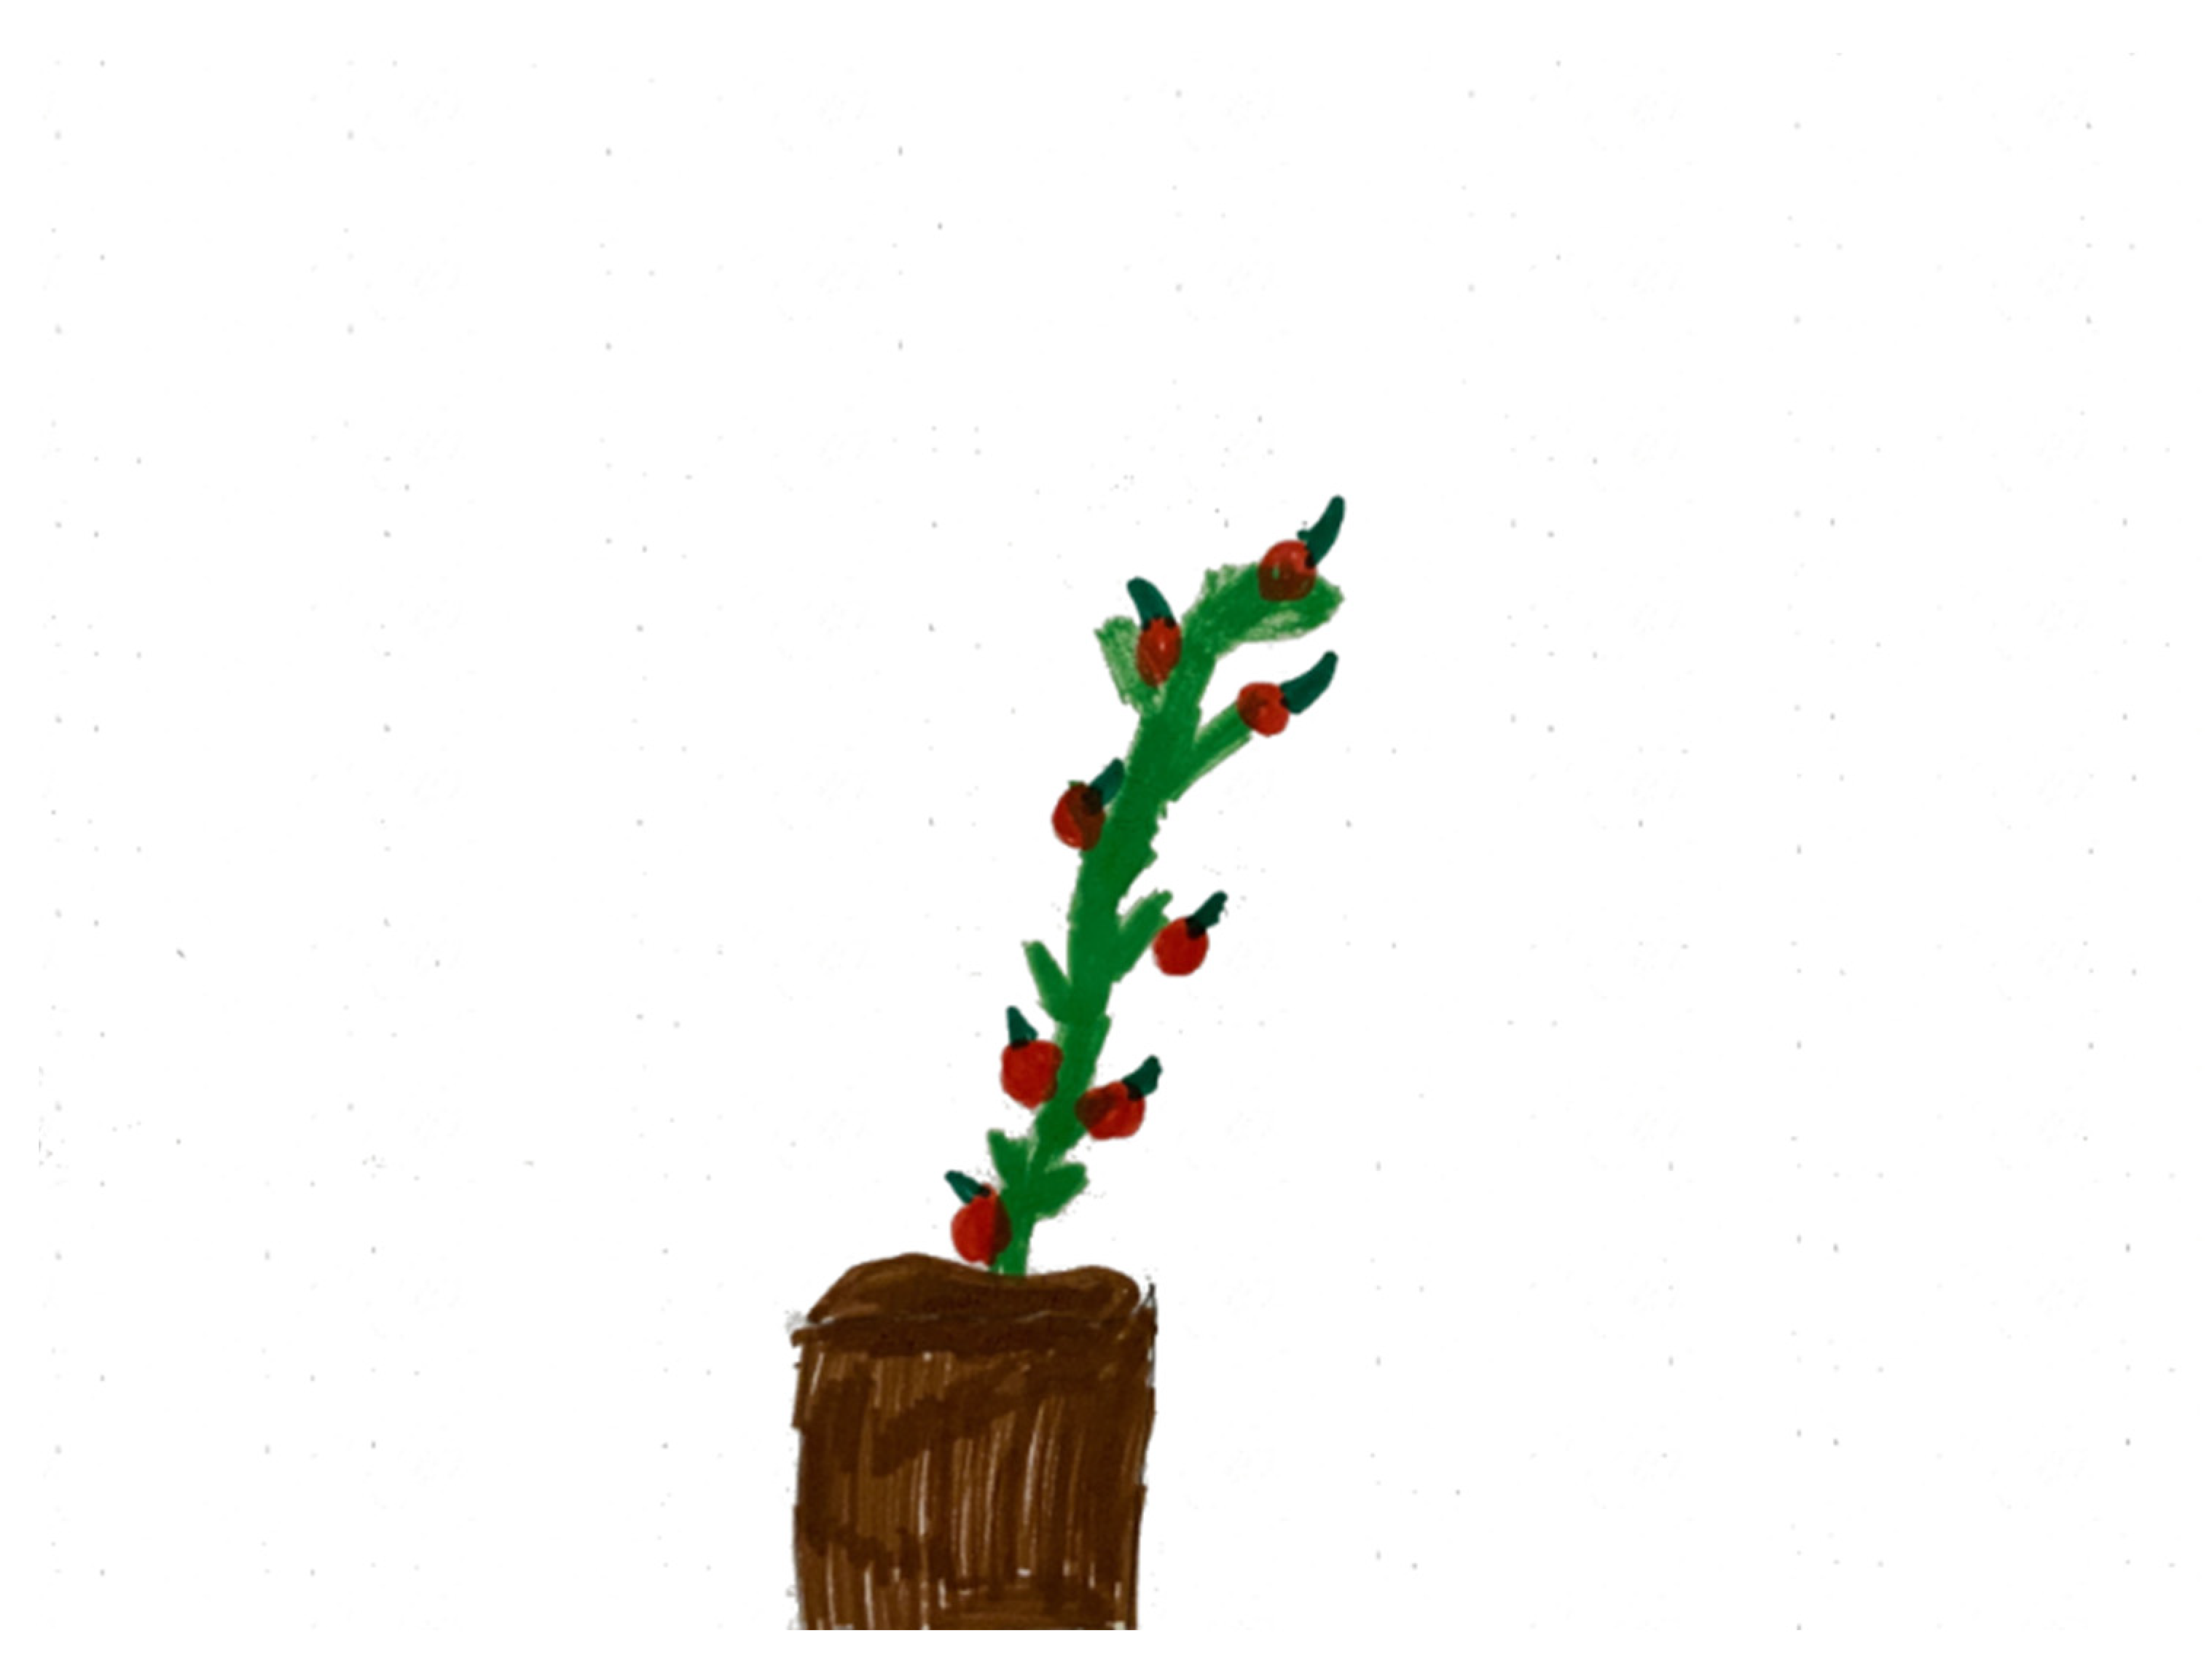
    Plants: plant type (flowers, grass, vegetables, fruit, trees, etc.);
    Morphological elements of the plant world: singular parts of plants, for example, leaves, seeds, roots or fruits;
    Abiotic elements: sun, clouds, rainbows, rain, soil, mountains, etc.;
    Other living things: vertebrate animals, invertebrates, fungi, mushrooms, etc.; and
    Elements unrelated to the plant world: the representation of entities without or little relationship with the plant world, for example, balls, houses, roads, trucks, etc.
  • Total area coloured: quantification of the coloured area in each drawing, taking values between 0 and 623.7 cm 2 (Din A4).
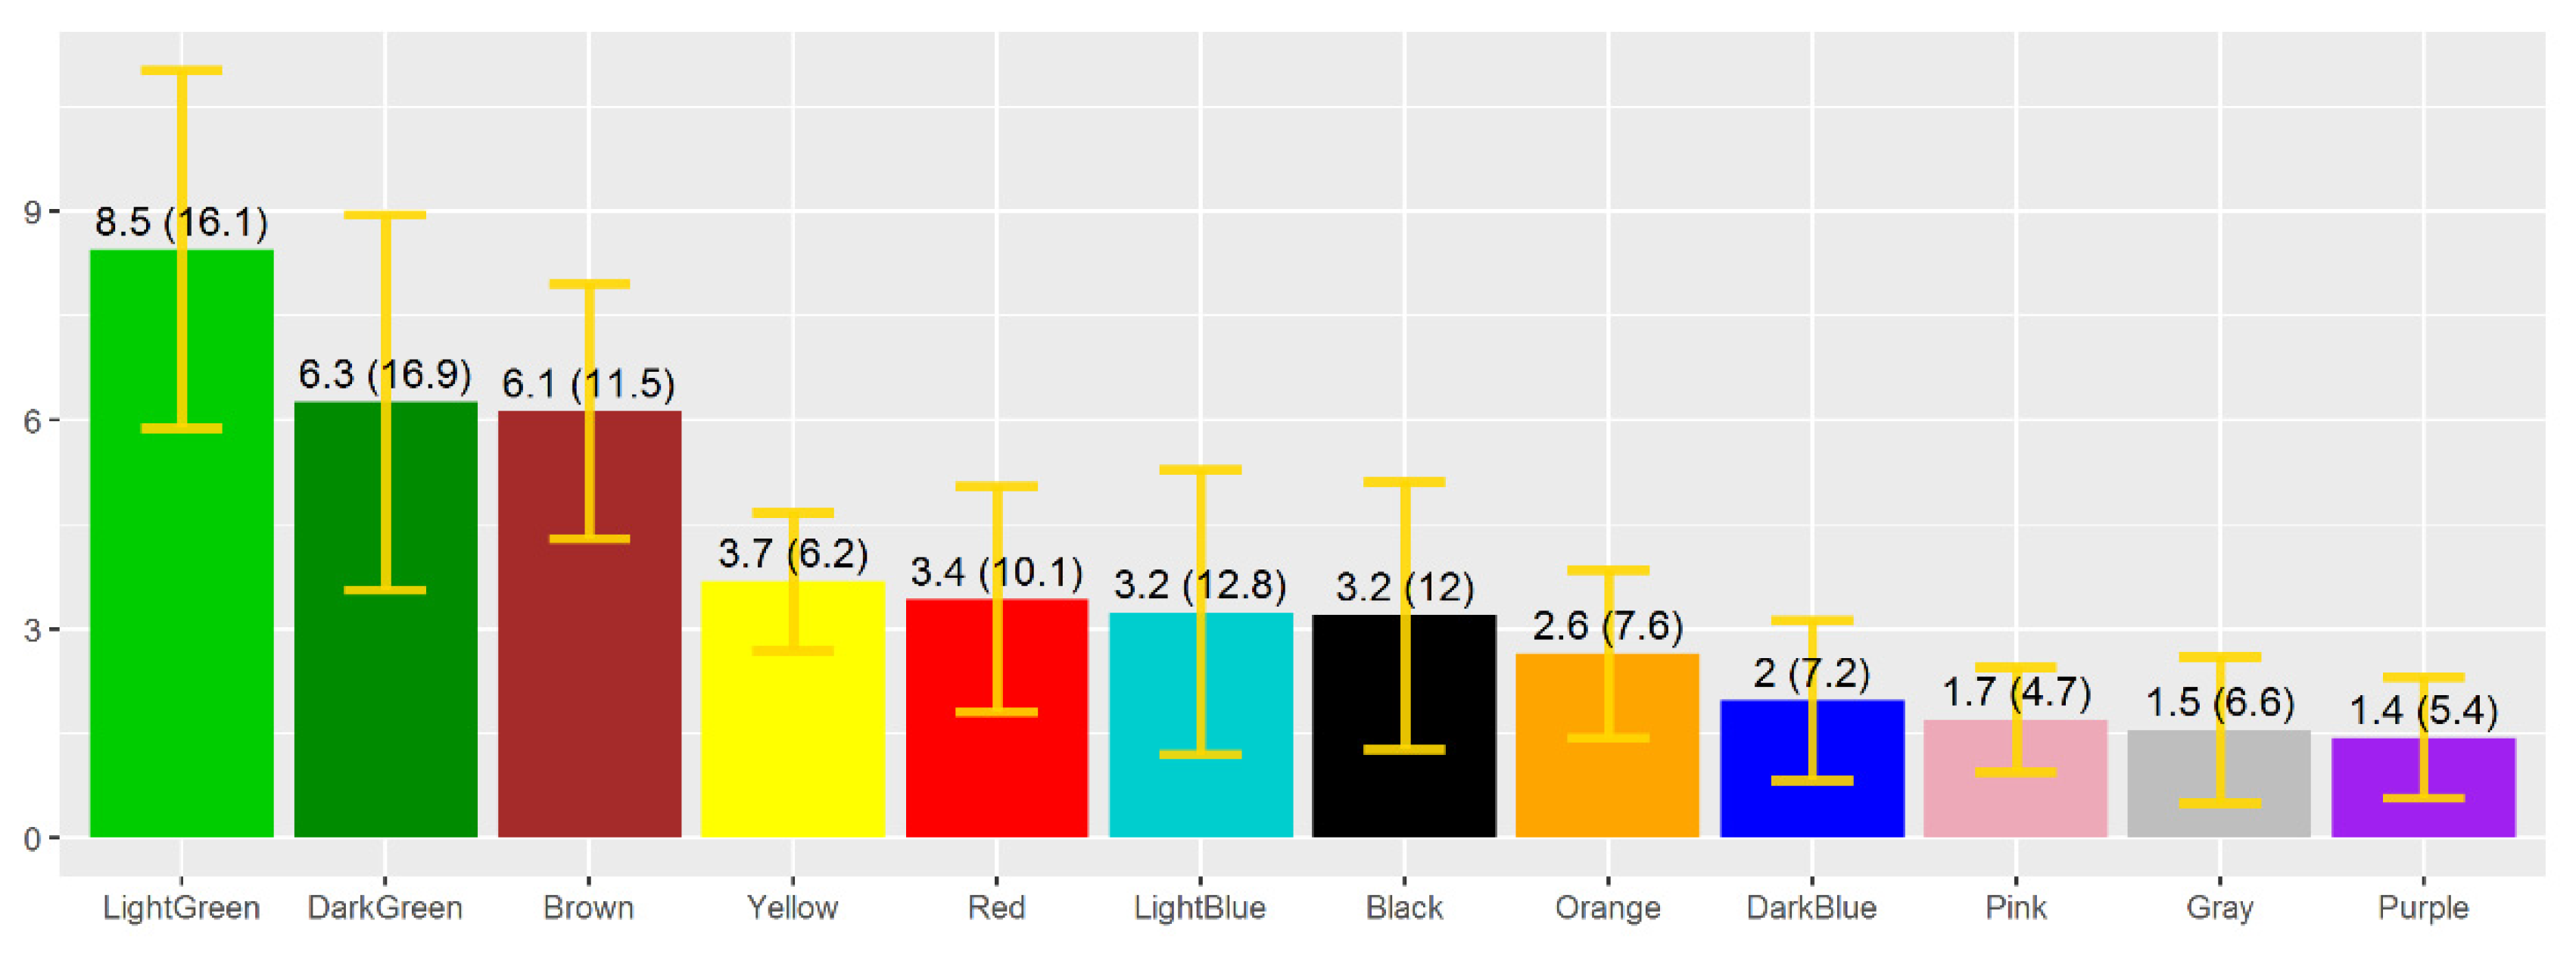
  • Area coloured with each of the 12 colours that the girls and boys who participated in the pictorial activity had available to them at the time of the interview.
Notably, the total number of different pictorial elements within each category are counted. As such, possible repetitions are not considered. For example, if two trees and three flowers appear in a drawing, what will be recorded in the plant category for the drawing will be two pictorial elements (one for tree and one for flower). Previous studies analysing the pictorial content expressed by young girls and boys regarding the plant world use similar categories and criteria [22,24]. Moreover, a single researcher measured the coloured areas by using a raster graphics editor following the procedure described in previous research [21].
Regarding statistical procedures, the analysis of the dependent numerical variables as a function of the independent categorical variables was carried out using the Kruskal-Wallis test [25]. The effect size was estimated using the statistical parameter η 2 (eta-squared) [26]. In this regard, the effect size was considered based on the following intervals: small if 0.01 η 2 < 0.06 ; medium if 0.06 η 2 < 0.14 and large if η 2 0.14 [27].
The level of significance used in the study was 0.05, and the significant differences detected were considered relevant from median values of the effect size.
IBM SPSS Statistics version 26 [28] was used to perform the statistical analyses, and the software R version 3.5.0 [29] was used to prepare the figures that graphically represent the variables.

2.5. Ethical Declaration

The research procedure presented below was reviewed and approved by the Ethics Committee for Research on Human Beings of the University of the Basque Country/Euskal Herriko Unibertsitatea (M10_2016_247MR1_VILLARROEL VILLAMOR).
The study received approval from the school directors and the teachers involved in the study. The families of the children who participated in the interviews gave their written consent. No recordings were made or photographs taken of the students who participated in the study.

3. Results

The results of the study are presented below. First, the data related to the sample as a whole are summarised, both in terms of the pictorial content and the area coloured. The second part of the results section presents the analysis of the differences between the drawings made by the girls and boys of school A and those of school B.

3.1. Results of the Study for the Sample as a Whole

In the 152 drawings analysed, a total of 414 pictorial elements were counted. Table 4 presents the frequency of each of the pictorial categories studied.
Regarding the study of colours in the drawings, the mean area coloured per drawing was 55.9 cm2. Figure 2 shows the mean coloured area and the confidence interval (95%) for each of the 12 colours available to the children throughout the activity.
Finally, in the present study, no evidence was found to conclude that there were significant differences between the drawings by girls and boys, both in terms of both the pictorial content and the use of colour.

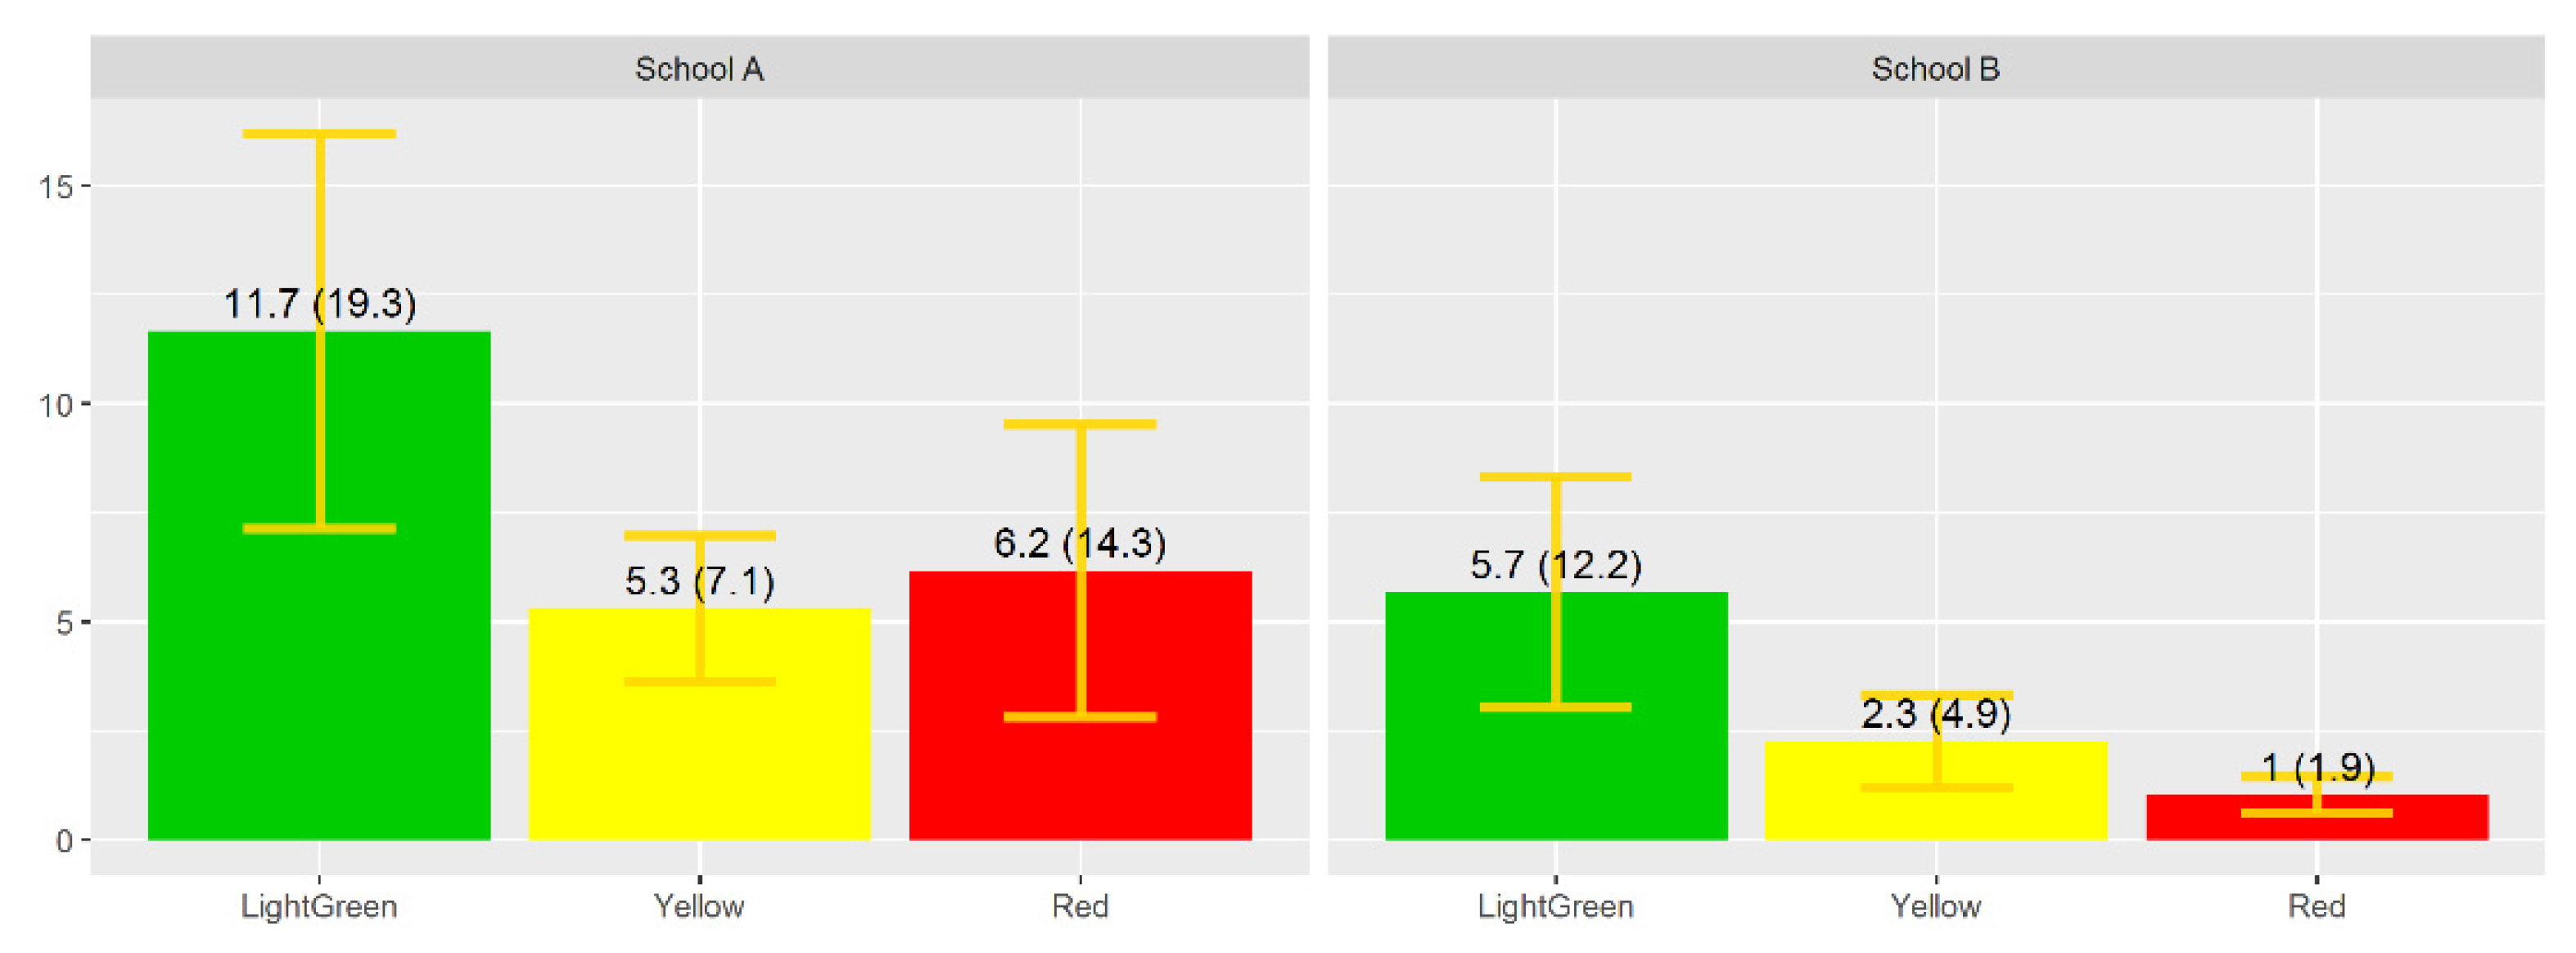
3.2. Results of the Study Related to the Comparison Between the Drawings by Children in School A and School B

In the analysed sample, there were statistically significant differences between the two schools in terms of the total number of pictorial elements identified in the drawings (Kruskal-Wallis H-test = 12.861 [1]; p < 0.001; η2 = 0.0852). The differences were also significant with respect to the pictorial category plants (Kruskal-Wallis H-test = 12.26 [1]; p < 0.001; η2 = 0.081). Notably, in both comparisons, the effect size was medium. As Table 5 indicates, the children in the school A tend to draw more illustrations of plants and include more pictorial elements in their depictions.
The total coloured area in the drawings was significantly different between schools A and B (Kruskal-Wallis H-test = 16.833 [1]; p < 0.001; η2 = 0.111). Importantly, the effect size related to this comparison was medium.
Finally, of the 12 possible colours available for drawing, in the sample examined, significant differences were found between school A and school B in terms of the areas coloured light green (Kruskal-Wallis H-test = 10.76 [1]; p < 0.01; η2 = 0.071), red (Kruskal-Wallis H-test = 13.23 [1]; p < 0.001; η2 = 0.088) and yellow (Kruskal-Wallis H-test = 17.43 [1]; p < 0.001; η2 = 0.115). The effect sizes for these particular colour comparisons indicate that the relationship between the variables is medium, with the highest value for yellow.
Figure 3 shows the mean values and confidence interval for the mean (95%) for each of the three colours that showed significant differences between the drawings by students of the two schools. Table 6 summarises the descriptive statistics related to the total coloured area and the colours light green, red and yellow for each of the two educational centres.

4. Discussion and Conclusions

This study aimed to analyse the drawings that young children from two urban educational centres depicted to express their understanding of plant life.
The educational centres under consideration are located in a similar cultural and urban context and relatively close to each other. However, they substantially differ in terms of accessibility to green areas. School A has green areas within the school grounds as well as in its surroundings. Furthermore, this school involves pupils in garden activities when they are in preschool (4–5 years). School B, by comparison, has virtually no green areas within the schoolyard nor around the school premises. In addition, the school delays gardening activities until schoolchildren are in primary education.
Based on the data provided by this research project, the drawings of plant life that the children in school A drew, compared with those drawn by children in school B, display a significantly greater number of pictorial elements and they include a greater variety of plants. Relevant differences also appear in terms of the utilisation of colour. Specifically, the total coloured area is significantly more extensive in the drawings by children in school A than in the representations by students in school B. More to the point, the children in school A tend to create larger drawings, particularly using the colours green, red and yellow.
In connection with these observations, previous research indicates that both the pictorial content that young children display in their floral representations as well as the colours that they select for their drawings are related to their understanding of the plant world. Thus, Villarroel and Infante [30] report that the drawing of key pictorial elements in children’s representation of plant life, such as the sun, rainfall, clouds, soil and trees, is linked to their comprehension of the concept of living things and, in particular, to considering plants as living creatures. Ahi [31] also points out the importance that the pictorial content in drawings has regarding the study of comprehension of the plant world in early childhood. The author relates the frequency of representing the sun, rainfall, soil and different specimens of plants (trees, flowers, and grass) to the understanding of the plant world that young children express in their drawings. Similarly, Anderson, Ellis and Jones [32] also inform that the content of drawings that young children create reflects their conceptual understanding of the plant world. More to the point, children’s better understanding of the plant world appears to be associated with the representation of a larger diversity of vegetables in their drawings [14]. Other research finds that the detail with which children depict plants is related to the mental models that children have regarding plant life [33].
The colours that children choose in their drawings of plant life have also been shown to be connected with their conceptual development in the botanical domain. Thus, the colours yellow and green are those that young children use to represent, respectively, the sun and aboveground parts of plants [21]. Moreover, it is reported that as the children attribute more importance to the role that the sun plays in plant life, they also tend to allocate wider areas of their drawing to the solar representation, a fact that leads them to paint more extensive areas in yellow [34]. Other research pinpoints that those children expressing a more realistic perception regarding the plant world tend to colour larger areas of their drawings with brown, yellow and green to represent tree trunks, the sun and vegetables [31].
In light of the previous research, the fact that the children in school A drew more pictorial elements and a wider variety of plants, together with the observation that they painted larger areas and, in particular, in yellow and green, cannot be considered as a minor matter. Thus, the children in school A, with more accessibility to nature and green areas during their school day, might have developed a more detailed and accurate comprehension of the plant world and its diversity. This fact would then be reflected in their illustrations on flora inasmuch as the children in school A depicted more variety of plants and expressed their illustrations of flora with a more realistic utilisation of colours. By contrast, a more limited contact with plants during school activities might have prevented the children in school B from having those experiences with vegetables and plants in their educational centre that eventually could boost a more precise understanding on plant life in childhood. This circumstance would remain evident in their drawings of the plant world, in which the diversity of plants appears more poorly illustrated.
The abovementioned assumption fits in well with those studies that indicate that the outdoor environment surrounding educational centres may positively influence students’ academic performance [13,35] and, more significantly, children’s understanding of plant life [11,14,15] and nature [8]. In addition, beyond cognitive development, ecosystems, wildlife and, in particular, plant life play noteworthy roles in enhancing artistic inspiration [36,37], a fact that might be supported by the fact that the children in school A depicted more pictorial elements and coloured larger areas in their drawings.
In summary, this study accounts for the association that occurs between the characteristics that educational centres involved in the study have in terms of the possibilities they offer to facilitate students’ contact with nature and the pictorial characteristics of the representations of the plant world that the children in the sample drew. The data provided does not allow us to conclude causal relationships, nor does it allow us to rule out other factors that eventually might influence the way that children draw their understanding of plan life (such us their experiences outside the school time, with their families or in their free time). Nevertheless, the results presented do support emerging research outcomes that show the beneficial effect that contact with nature during school activity has on children’s understanding of biological phenomena [14,15,16]. On the basis of the above, gardens, green schoolyards and green walls should be regarded a significant assets to promote learning and development [38].

Author Contributions

Conceptualization, J.D.V. methodology, M.M. and J.D.V.; software, M.M. and I.Z.; validation, J.D.V. and M.M.; formal analysis, J.D.V. and M.M.; investigation, I.Z.; resources, J.D.V.; data curation, M.M.; writing—original draft preparation, J.D.V.; writing—review and editing, J.D.V.; visualization, I.Z. and M.M.; supervision, I.Z.; M.M. and J.D.V.; project administration, I.Z.; M.M. and J.D.V.; funding acquisition, J.D.V. All authors have read and agreed to the published version of the manuscript.

Funding

This research was funded by the University of the Basque Country through the projects PPGA20/05, GIU20/054 and PES20/49.

Institutional Review Board Statement

The study was approved by the Ethics Committee for Research on Human Beings of the University of the Basque Country/Euskal Herriko Unibertsitatea (M10_2016_247MR1_VILLARROEL VILLAMOR).

Informed Consent Statement

Informed consent was obtained from all subjects involved in the study.

Data Availability Statement

Data available on request from the authors.

Conflicts of Interest

The authors declare no conflict of interest.

Appendix A

Figure A1. Drawing by a 6-year-old girl from school A.
Sustainability 13 04999 g0a1
Figure A2. Drawing by a 6-year-old girl from school B.
Sustainability 13 04999 g0a2
Figure A3. Drawing by a 6-year-old girl from school A.
Sustainability 13 04999 g0a3
Figure A4. Drawing by a 6-year-old girl from school B.
Sustainability 13 04999 g0a4

References

  1. D’Amore, C.; Chawla, L. Significant Life Experiences that Connect Children with Nature: A Research Review and Applications to a Family Nature Club; Cutter-Mackenzie-Knowles, A., Malone, K., Barratt Hacking, E., Eds.; Research Handbook on Childhoodnature: Assemblages of Childhood and Nature Research; Springer International Publishing: Cham, Switzerland, 2020; pp. 799–825. [Google Scholar]
  2. Davies, S. Let’s get gardening. Eye 2019, 21, viii–ix. [Google Scholar] [CrossRef]
  3. Harvey, D.J.; Montgomery, L.N.; Harvey, H.; Hall, F.; Gange, A.C.; Watling, D. Psychological benefits of a biodiversity-focussed outdoor learning program for primary school children. J. Environ. Psychol. 2020, 67, 101381. [Google Scholar] [CrossRef]
  4. Dankiw, K.A.; Tsiros, M.D.; Baldock, K.L.; Kumar, S. The impacts of unstructured nature play on health in early childhood development: A systematic review. PLoS ONE 2020, 15, e0229006. [Google Scholar] [CrossRef] [PubMed] [Green Version]
  5. Chawla, L. Childhood nature connection and constructive hope: A review of research on connecting with nature and coping with environmental loss. People Nat. 2020, 2, 619–642. [Google Scholar] [CrossRef]
  6. Hosaka, T.; Sugimoto, K.; Numata, S. Childhood experience of nature influences the willingness to coexist with biodiversity in cities. Palgrave Commun. 2017, 3, 1–8. [Google Scholar] [CrossRef]
  7. Beery, T.; Jørgensen, K.A. Children in nature: Sensory engagement and the experience of biodiversity. Environ. Educ. Res. 2018, 24, 13–25. [Google Scholar] [CrossRef]
  8. Skarstein, T.H.; Skarstein, F. Curious children and knowledgeable adults—Early childhood student-teachers’ species identification skills and their views on the importance of species knowledge. Int. J. Sci. Educ. 2020, 42, 310–328. [Google Scholar] [CrossRef] [Green Version]
  9. Fischer, L.K.; Brinkmeyer, D.; Karle, S.J.; Cremer, K.; Huttner, E.; Seebauer, M.; Nowikow, U.; Schütze, B.; Voigt, P.; Völker, S.; et al. Biodiverse edible schools: Linking healthy food, school gardens and local urban biodiversity. Urban For. Urban Green. 2019, 40, 35–43. [Google Scholar] [CrossRef]
  10. Benkowitz, D.; Schulz, S.; Lindemann-Matthies, P. The impact of gardening experiences on children’s intake of vegetables. J. Health Environ. Educ. 2019, 11, 1–5. [Google Scholar]
  11. Akoumianaki-Ioannidou, A.; Paraskevopoulou, A.T.; Tachou, V. School grounds as a resource of green space to increase child-plant contact. Urban For. Urban Green. 2016, 20, 375–386. [Google Scholar] [CrossRef]
  12. Harvey, D.J.; Gange, A.C.; Harvey, H. The unrealised potential of school grounds in Britain to monitor and improve biodiversity. Null 2020, 51, 306–316. [Google Scholar] [CrossRef]
  13. Li, D.; Chiang, Y.; Sang, H.; Sullivan, W.C. Beyond the school grounds: Links between density of tree cover in school surroundings and high school academic performance. Urban For. Urban Green. 2019, 38, 42–53. [Google Scholar] [CrossRef]
  14. Eugenio-Gozalbo, M.; Aragón, L.; Ortega-Cubero, I. Gardens as Science Learning Contexts across Educational Stages: Learning Assessment Based on Students’ Graphic Representations. Front. Psychol. 2020, 11, 2226. [Google Scholar] [CrossRef] [PubMed]
  15. Laaksoharju, T. A Children’s Garden: Connectedness to Place through Affordances: A Grounded Theory. Ph.D. Thesis, University of Helsinki, Helsinki, Finland, 2020. [Google Scholar]
  16. Villarroel, J.D.; Antón, A.; Zuazagoitia, D.; Nuño, T. Young children’s understanding of plant life: A study exploring rural–urban differences in their drawings. J. Biol. Educ. 2018, 52, 331–341. [Google Scholar] [CrossRef]
  17. Ploger, J. Bilbao City Report; LSE CASE Report 43; CASE Centre For Analysis of Social Exclusion: London, UK, 2008. [Google Scholar]
  18. Eusko Jaurlaritza-Gobierno Vasco Eustat: Basque Statistics Office. Available online: https://en.eustat.eus/indice.html (accessed on 25 February 2021).
  19. Eusko Jaurlaritza-Gobierno Vasco GeoEuskadi, Infraestructura de Datos Espaciales (IDE) de Euskadi. Available online: https://www.geo.euskadi.eus/s69-15375/es (accessed on 24 February 2021).
  20. The GIMP Development Team. GIMP. 2019. Available online: http://www.gimp.org/ (accessed on 28 April 2021).
  21. Villarroel, J.D. Young Children’s Drawings of Plant Life: A Study Concerning the Use of Colours and its Relationship with Age. J. Biol. Educ. 2016, 50, 41–53. [Google Scholar] [CrossRef]
  22. Villanueva, X.; Villarroel, J.D.; Antón, A. Young children’s drawings of plant world: A cohort study analysing pictorial content. J. Biol. Educ. 2019, 1–13. [Google Scholar] [CrossRef]
  23. Villarroel, J.D.; Merino, M.; Antón, Á. Symmetrical Motifs in Young Children’s Drawings: A Study on Their Representations of Plant Life. Symmetry 2019, 11, 26. [Google Scholar] [CrossRef] [Green Version]
  24. Villarroel, J.D.; Antón, A.; Zuazagoitia, D.; Nuño, T. A Study on the Spontaneous Representation of Animals in Young Children’s Drawings of Plant Life. Sustainability 2018, 10, 1000. [Google Scholar] [CrossRef] [Green Version]
  25. Kruskal, W.H.; Wallis, W.A. Use of ranks in one-criterion variance analysis. J. Am. Stat. Assoc. 1952, 47, 583–621. [Google Scholar] [CrossRef]
  26. Tomczak, M.; Tomczak, E. The need to report effect size estimates revisited. An overview of some recommended measures of effect size. Trends Sport Sci. 2014, 21, 19–25. [Google Scholar]
  27. Vašíčková, J.; Frömel, K.; Svozil, Z. Key competences of Czech students in PE lessons with different content. In Proceedings of the 6th FIEP European Congress, Porec, Croatia, 18–21 June 2011; pp. 496–503. [Google Scholar]
  28. IBM Corp. IBM SPSS Statistics for Windows, Version 26.0; IBM Corp: Armonk, NY, USA, 2019. [Google Scholar]
  29. R Core Team. R: A Language and Environment for Statistical Computing; R Foundation for Statistical Computing: Vienna, Austria, 2018. [Google Scholar]
  30. Villarroel, J.D.; Infante, G. Early understanding of the concept of living things: An examination of young children’s drawings of plant life. J. Biol. Educ. 2014, 48, 119–126. [Google Scholar] [CrossRef]
  31. Ahi, B. The world of plants in children’s drawings: The color preference and the effect of age and gender on these preferences. J. Baltic Sci. Educ. 2017, 16, 32–42. [Google Scholar]
  32. Anderson, J.L.; Ellis, J.P.; Jones, A.M. Understanding early elementary children’s conceptual knowledge of plant structure and function through drawings. CBE Life Sci. Educ. 2014, 13, 375–386. [Google Scholar] [CrossRef] [PubMed] [Green Version]
  33. Comeau, P.; Hargiss, C.L.; Norland, J.E.; Wallace, A.; Bormann, A. Analysis of Children’s Drawings to Gain Insight into Plant Blindness. Nat. Sci. Educ. 2019, 48, 1–10. [Google Scholar] [CrossRef]
  34. Villarroel, J.D.; Villanueva, X. A Study Regarding the Representation of the Sun in Young Children’s Spontaneous Drawings. Soc. Sci. 2017, 6, 95. [Google Scholar] [CrossRef] [Green Version]
  35. Leung, W.T.V.; Tam, T.Y.T.; Pan, W.C.; Wu, C.D.; Lung, S.C.C.; Spengler, J.D. How is environmental greenness related to students’ academic performance in English and Mathematics? Landsc. Urban Plan. 2019, 181, 118–124. [Google Scholar] [CrossRef]
  36. Katayama, N.; Baba, Y.G. Measuring artistic inspiration drawn from ecosystems and biodiversity: A case study of old children’s songs in Japan. Ecosyst. Serv. 2020, 43, 101116. [Google Scholar] [CrossRef]
  37. Villanueva, X. El pensamiento medioambiental en la infancia y su relación con el concepto de ser vivo. Ikastorratza e-Revista de Didáctica 2018, 21, 77–86. [Google Scholar] [CrossRef]
  38. Kuo, M.; Barnes, M.; Jordan, C. Do experiences with nature promote learning? Converging evidence of a cause-and-effect relationship. Front. Psychol. 2019, 10, 305. [Google Scholar] [CrossRef] [PubMed] [Green Version]
Figure 1. Aerial photographs of schools A (left) and B (right) showing the area corresponding to the school (interior line) and the exterior perimeter drawn to measure the surrounding green area (space between the interior and exterior lines). Source: www.geoeuskadi.eus (accessed on 28 April 2021).
Sustainability 13 04999 g001
Figure 2. Mean area (standard deviation) coloured (cm2) and confidence interval for the mean (95%) for each of the 12 colours available to students during the pictorial activity.
Sustainability 13 04999 g002
Figure 3. Mean area (standard deviation) coloured (cm2) and confidence interval for the mean (95%) for each of the 12 colours available to students, during the pictorial activity.
Sustainability 13 04999 g003
Table 1. Characteristics of the social environment of the schools participating in the study.
School ASchool B
Municipality, countryGetxo, SpainBilbao, Spain
Total population (number of inhabitants)77,088343,430
Total area of the municipality (km2)11.8941.60
Relative area of undeveloped land (%)21.6537.55
Green area per person (km2/inhabitant)6.604.95
Density (inhabitants/km2)6510.88461
Table 2. Information related to the green areas of the two educational centres involved in the study.
School ASchool B
Green areas inside the educational centre grounds (m2)1710.929.4
Green areas in the area surrounding the educational centre (m2)11.9220.0
Table 3. Distribution of students by level (age) and sex.
Preschool EducationPrimary Education
4–5 Years5–6 Years6–7 Years% Girls
School A23232450
School B26213550
Table 4. Relative frequency (%) of the categories of pictorial elements identified in the analysed sample set (n = 414).
Categories%Registered Pictorial Elements
Plants58.1Flowers, grass, trees, other types of plants.
Morphological elements of plants1.4Leaves, fruits.
Abiotic elements24.6Sun, clouds, rain, sky and rainbows.
Soil, earth, substrate.
Mountains, rivers.
Other living things4.1Vertebrate animals.
Fungi.
Elements unrelated to the plant world11.8Heart, house, car, road, garbage, smoke, letters, doll, watering can, church, monster, ball.
Table 5. Descriptive statistics of the frequencies of the plant and total number of pictorial elements categories broken down for each of the two educational centres.
School A (n = 70)School B (n = 82)
MedMeanSdMin-MaxMedMeanSdMin-Max
Plants2.01.971.971–91.01.511.240–4
Total3.03.442.91–131.02.112.050–10
Table 6. Descriptive statistics for each of the two educational centres for the total coloured area in the drawings as well as the coloured area corresponding to green, yellow and red.
School A (n = 70)School B (n = 82)
MedMeanSdMin-MaxMedMeanSdMin-Max
Total area43.459.260.20–265.77.229.648.40–275.2
Light green0.011.719.30–28.50.05.712.20–15.0
Yellow3.25.37.10–36.70.02.34.90–26.3
Red1.06.214.30–84.90.01.01.90–10.3
Publisher’s Note: MDPI stays neutral with regard to jurisdictional claims in published maps and institutional affiliations.

