1. Introduction
On 1 January 2020, the International Maritime Organization (IMO) required ships to lower their sulphur emissions from 3.5% to 0.5%. A lot of ship operators’ attention has now focused on alternative fuels and technologies to serve it as their solution. IMO regulations prompt the adoption of positive measures that cost ship operating companies an amount of money as they must choose alternative fuels and technologies. In other words, companies suffer economically when forced to switch to a more expensive fuel type [
1]. The proposed strategies are as follows.
Switch from high sulphur fuel oils (HSFO) to low sulphur fuel oils (LSFO).
Install exhaust gas cleaning systems (EGSC or scrubbers) and use heavy fuel oil (HFO).
Change the use of fuel altogether, such as liquefied natural gas (LNG) or other fuels.
A combination of weaker demand due to the coronavirus pandemic and a warm winter [
2] has led to a price war, resulting in oil prices falling over 70% from January to April in 2020. On 20 April 2020, the May contract for West Texas intermediate crude touched negative USD 40.32, triggering shock waves among global oil companies and related sectors. Oil price declines are a boon for shipping bunker cost, which is 50–60% of a ship’s total operating costs. Generally, low transportation costs would encourage the growth of shipping transportation demand. However, the rapid spread of coronavirus has forced countries to impose personal travel restrictions. These restrictions make it impossible to handle cargos at ports and the inactivity induced shipping lines. Moreover, several ports remain closed in many countries due to the cancellation of sailing. It is indicated that the loading and unloading of the world’s major ports have decreased more than 30% between January and June this year during the coronavirus pandemic. Carriers had announced blank sailings and the minimum number of vessels to manage capacity while potential and sustained outbreaks of coronavirus might cause a prolonged downturn in transportation demand. Meanwhile, the reduction of sailings also decreases ship fuel consumption and pollution emissions.
According to Ship&Bunker website, by the end of April 2020, the difference between the price of low-sulfur oil and heavy fuel oil fell from US$291.75/ton to US$94.25/ton, or down 67.7% compared to the beginning of the year. This has posed a huge question on the scrubber installation/switch to low-sulphur fuel for ship operators.
During this current coronavirus oil shock, the current paper focuses on the following steps.
Identify the risk of a cost difference between alternative fuels and technologies.
Assess the vulnerability of alternative fuels and technologies.
Determine the risk (i.e., the likelihood and consequences of specific types of risk on fuel cost).
Identify ways to reduce those risks.
Prioritize risk reduction measures.
In this study, we aim to minimize a shipping company’s expected total bunker costs based on its alternative fuels and technologies and risk attitude.
2. Methods
Alizadeh and Nomikos [
3] invest in the VaR to a particular amount of bunker cost, which is likely to be a lost due to the changes in the market over a certain period of time and given some probability. However, CVaR is used to measure the risk-aversion attitude in shipping lines’ pricing strategies that can significantly get the best effect to exceed VaR [
4]. Therefore, in this paper we adopt the CVaR model to measure the fuel costs of alternative fuel as they are more focus on price fluctuations and financial management. The following equations are used to estimate CvaR of fuel portfolio type cost.
2.1. Estimation of Fuel Portfolio Types’ Cost Distribution
Gu et al. [
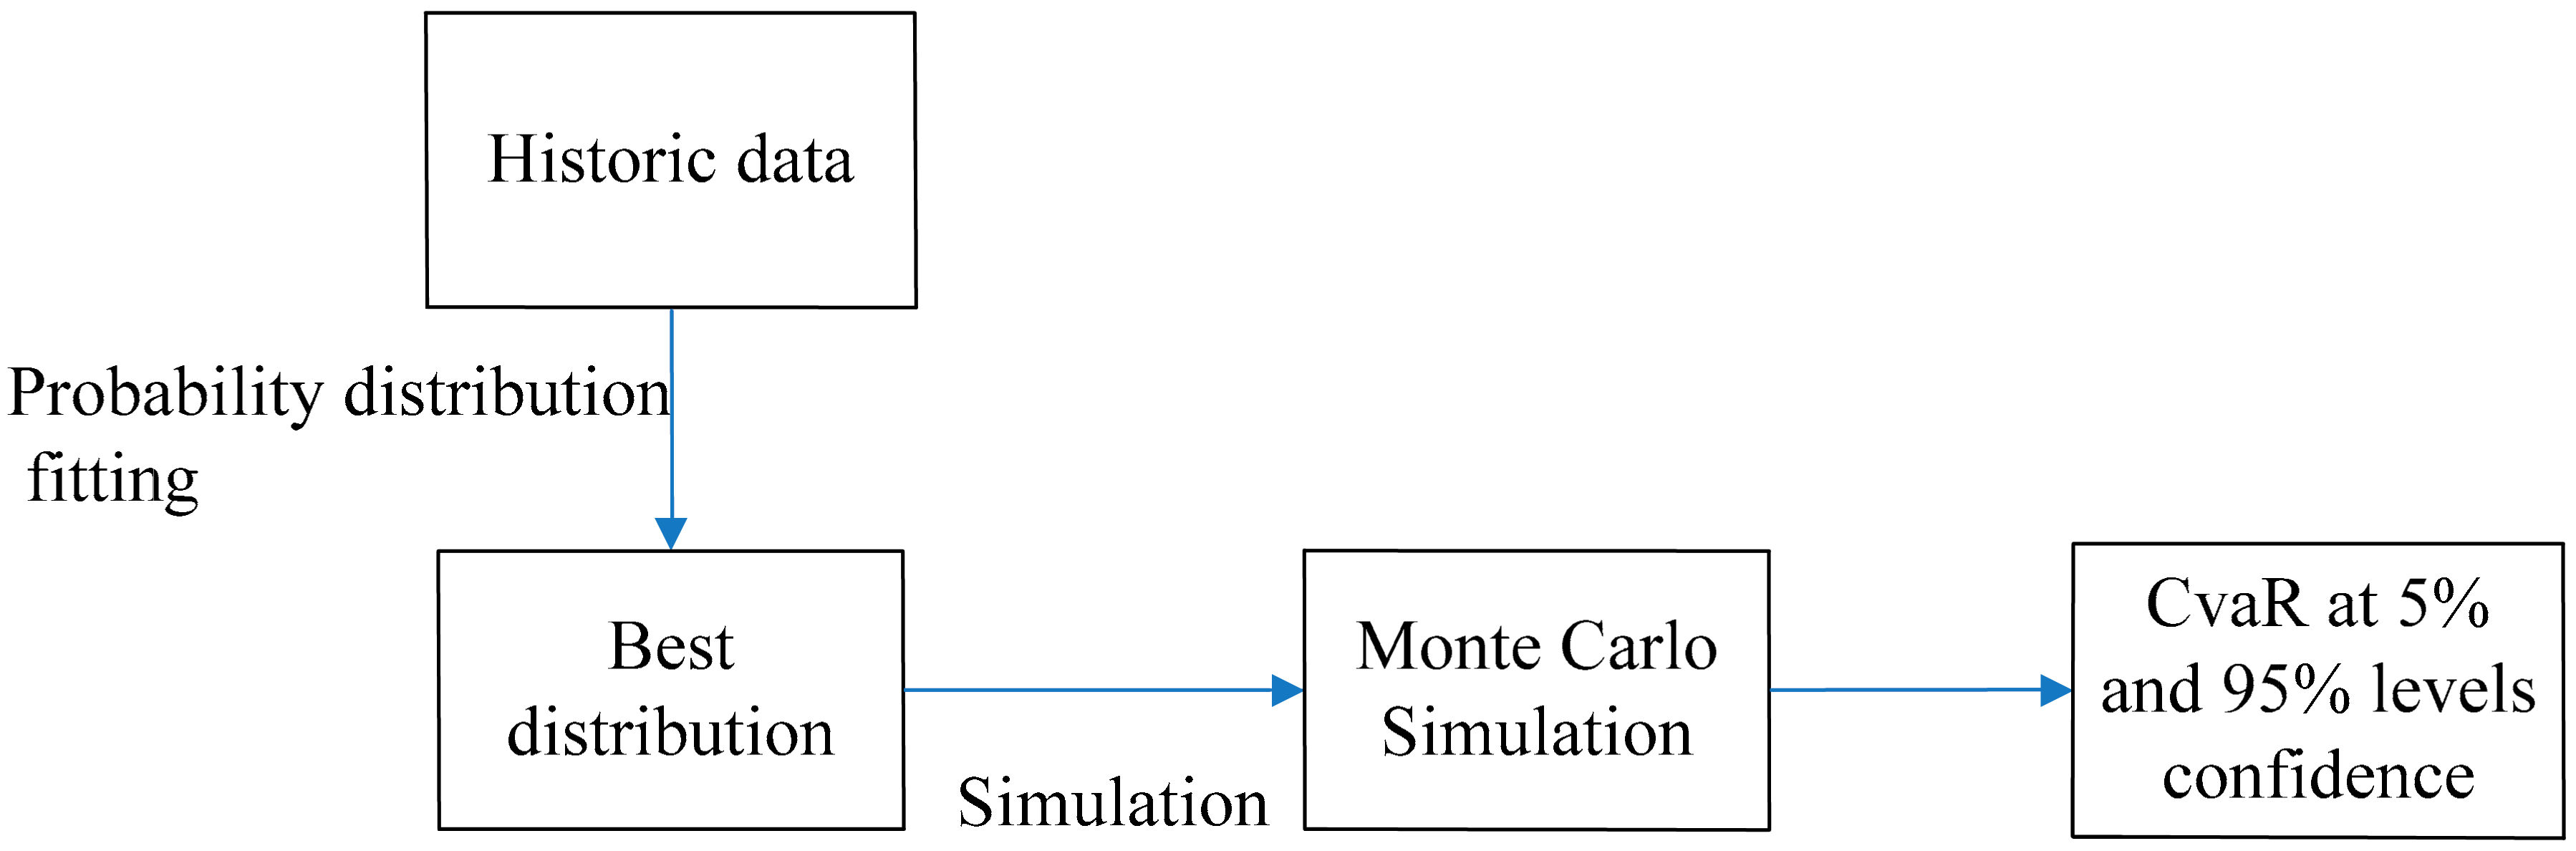
5] show that fuel cost has high volatility, and in order to control the risk of bunker cost, one can apply CVaR from the field of financial portfolio management. This study thus applies CvaR as an accurate fuel portfolio type of cost risk management to line shipping financials, which can be described into three steps process shown in
Figure 1. The first step is to analyze the cost data of fuel portfolio types and their degree of volatility by the coefficient of variation. The second step is to determine a specific distribution by a goodness of fit test on the historical data distribution. When the distribution and further details have been selected, the third step is to use Monte Carlo simulation and evaluate fuel portfolio type cost valuations that simulations worst-case, best-case in risk analysis. Additionally, the methods amount to a new distribution of fuel portfolio type cost for evaluating CVaR at an optimized confidence level. It is also a measure of risk based on the idea of VaR quantile [
6] and mean value [
7].
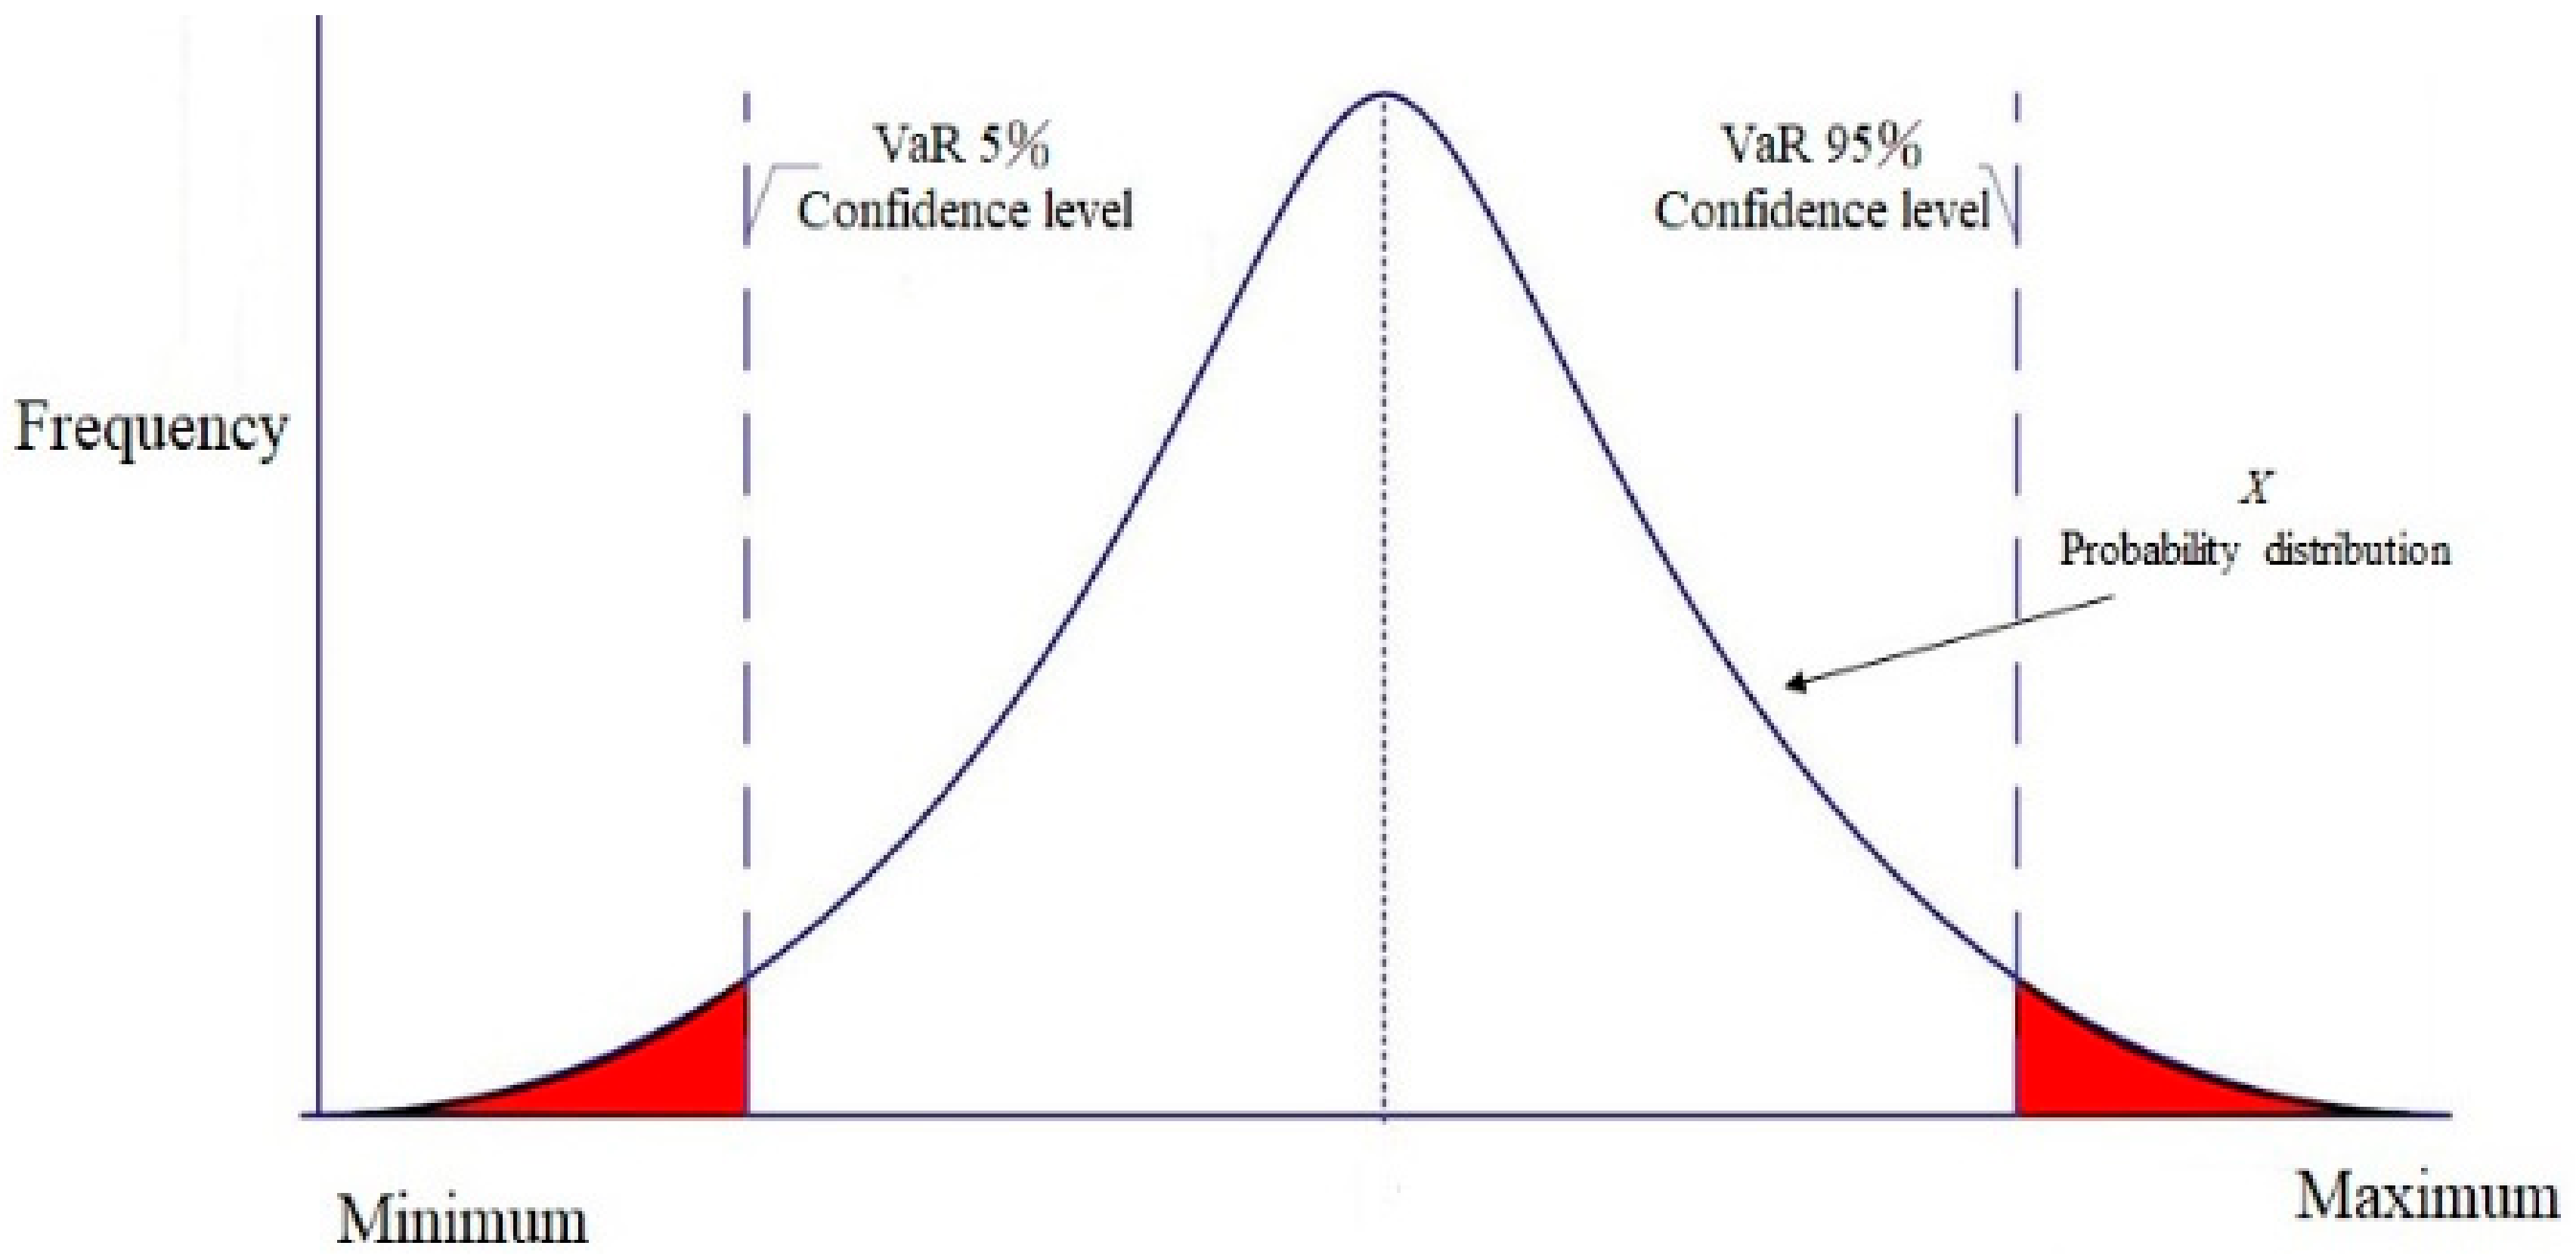
The cost fuel portfolio types exhibit a risk distribution. As illustrated in
Figure 2, the frequency distribution allows one to estimate a voyage fuel portfolio type cost CvaR, including its minimum and maximum. They might be expected to hold over a given period at the 5% and 95% levels of confidence (probability) [
8].
2.2. Trip Fuel Consumption Calculation
The different phase of trip fuel consumption for each ship can be calculated by ship engine type, fuel types, and time spent in the different navigation phases [
9]. Based on design ship speed and daily fuel consumption, trip fuel consumption can be calculated from a detailed knowledge of the installed main and auxiliary engine power, and load factor, as expressed in the following equation.
where:
FCTrip = fuel consumption over a complete trip (tonnes),
j = engine category (main, auxiliary),
n = fuel portfolio type (LSFO+ marine diesel oil (MGO), HFO with EGSC (capital cost (K) and maintain cost (MC) + MGO, MGO, LNG + MGO, HFO with EGSC (MC) + MGO)
p = different phase of trip (cruise at open sea (os), emission control area (seca), hoteling (h), maneuvering (m)).
Tp = different phase of trip time.
The different phase of trip time can be calculated as:
2.3. Estimating the Cost of Fuel for a Trip
To estimate the fuel cost of a trip, one must know the trip time, fuel consumption, and fuel price, as in following equation [
10].
where:
Fcost = cost of fuel portfolio type (USD)
FPt = current price of fuel at time t.
D = dummy variable, d = 0 it is not installation EGSC, d = 1 it is installation EGSC
EGSC = the expenses installation of EGSC in ship
K = capital cost (existing ship)
MC = maintain cost (newbuilding ship)
2.4. Fuel Cost Risk Assessment of Selected Alternative Fuels and Technologies
Fuel cost risk assessment is based on the CVaR. The volatility of fuel costs can be observed from the distribution of the volatility in expenses over time. CVaR can be calculated based on the calculation of VaR. According to Sarykalin et al. [
11], CVaR of x with confidence level α is the mean of the generalized α-tail distribution, as expressed in the following equation
where:
CVaR = conditional value at risk
P(x) dx = a probability distribution for the possible of fuel cost with value “x”
c = the cut-off point on the distribution where the analyst sets the VaR breakpoint
VaR = the agreed-upon VaR level.
3. Data and Descriptive Statistics
In this section we briefly describe the test case in
Section 1, while the scenario generation process is discussed in
Section 2.
3.1. Data Sources
Table 1 lists the data of New Panamax container route from East Asia to Europe and the overall data.
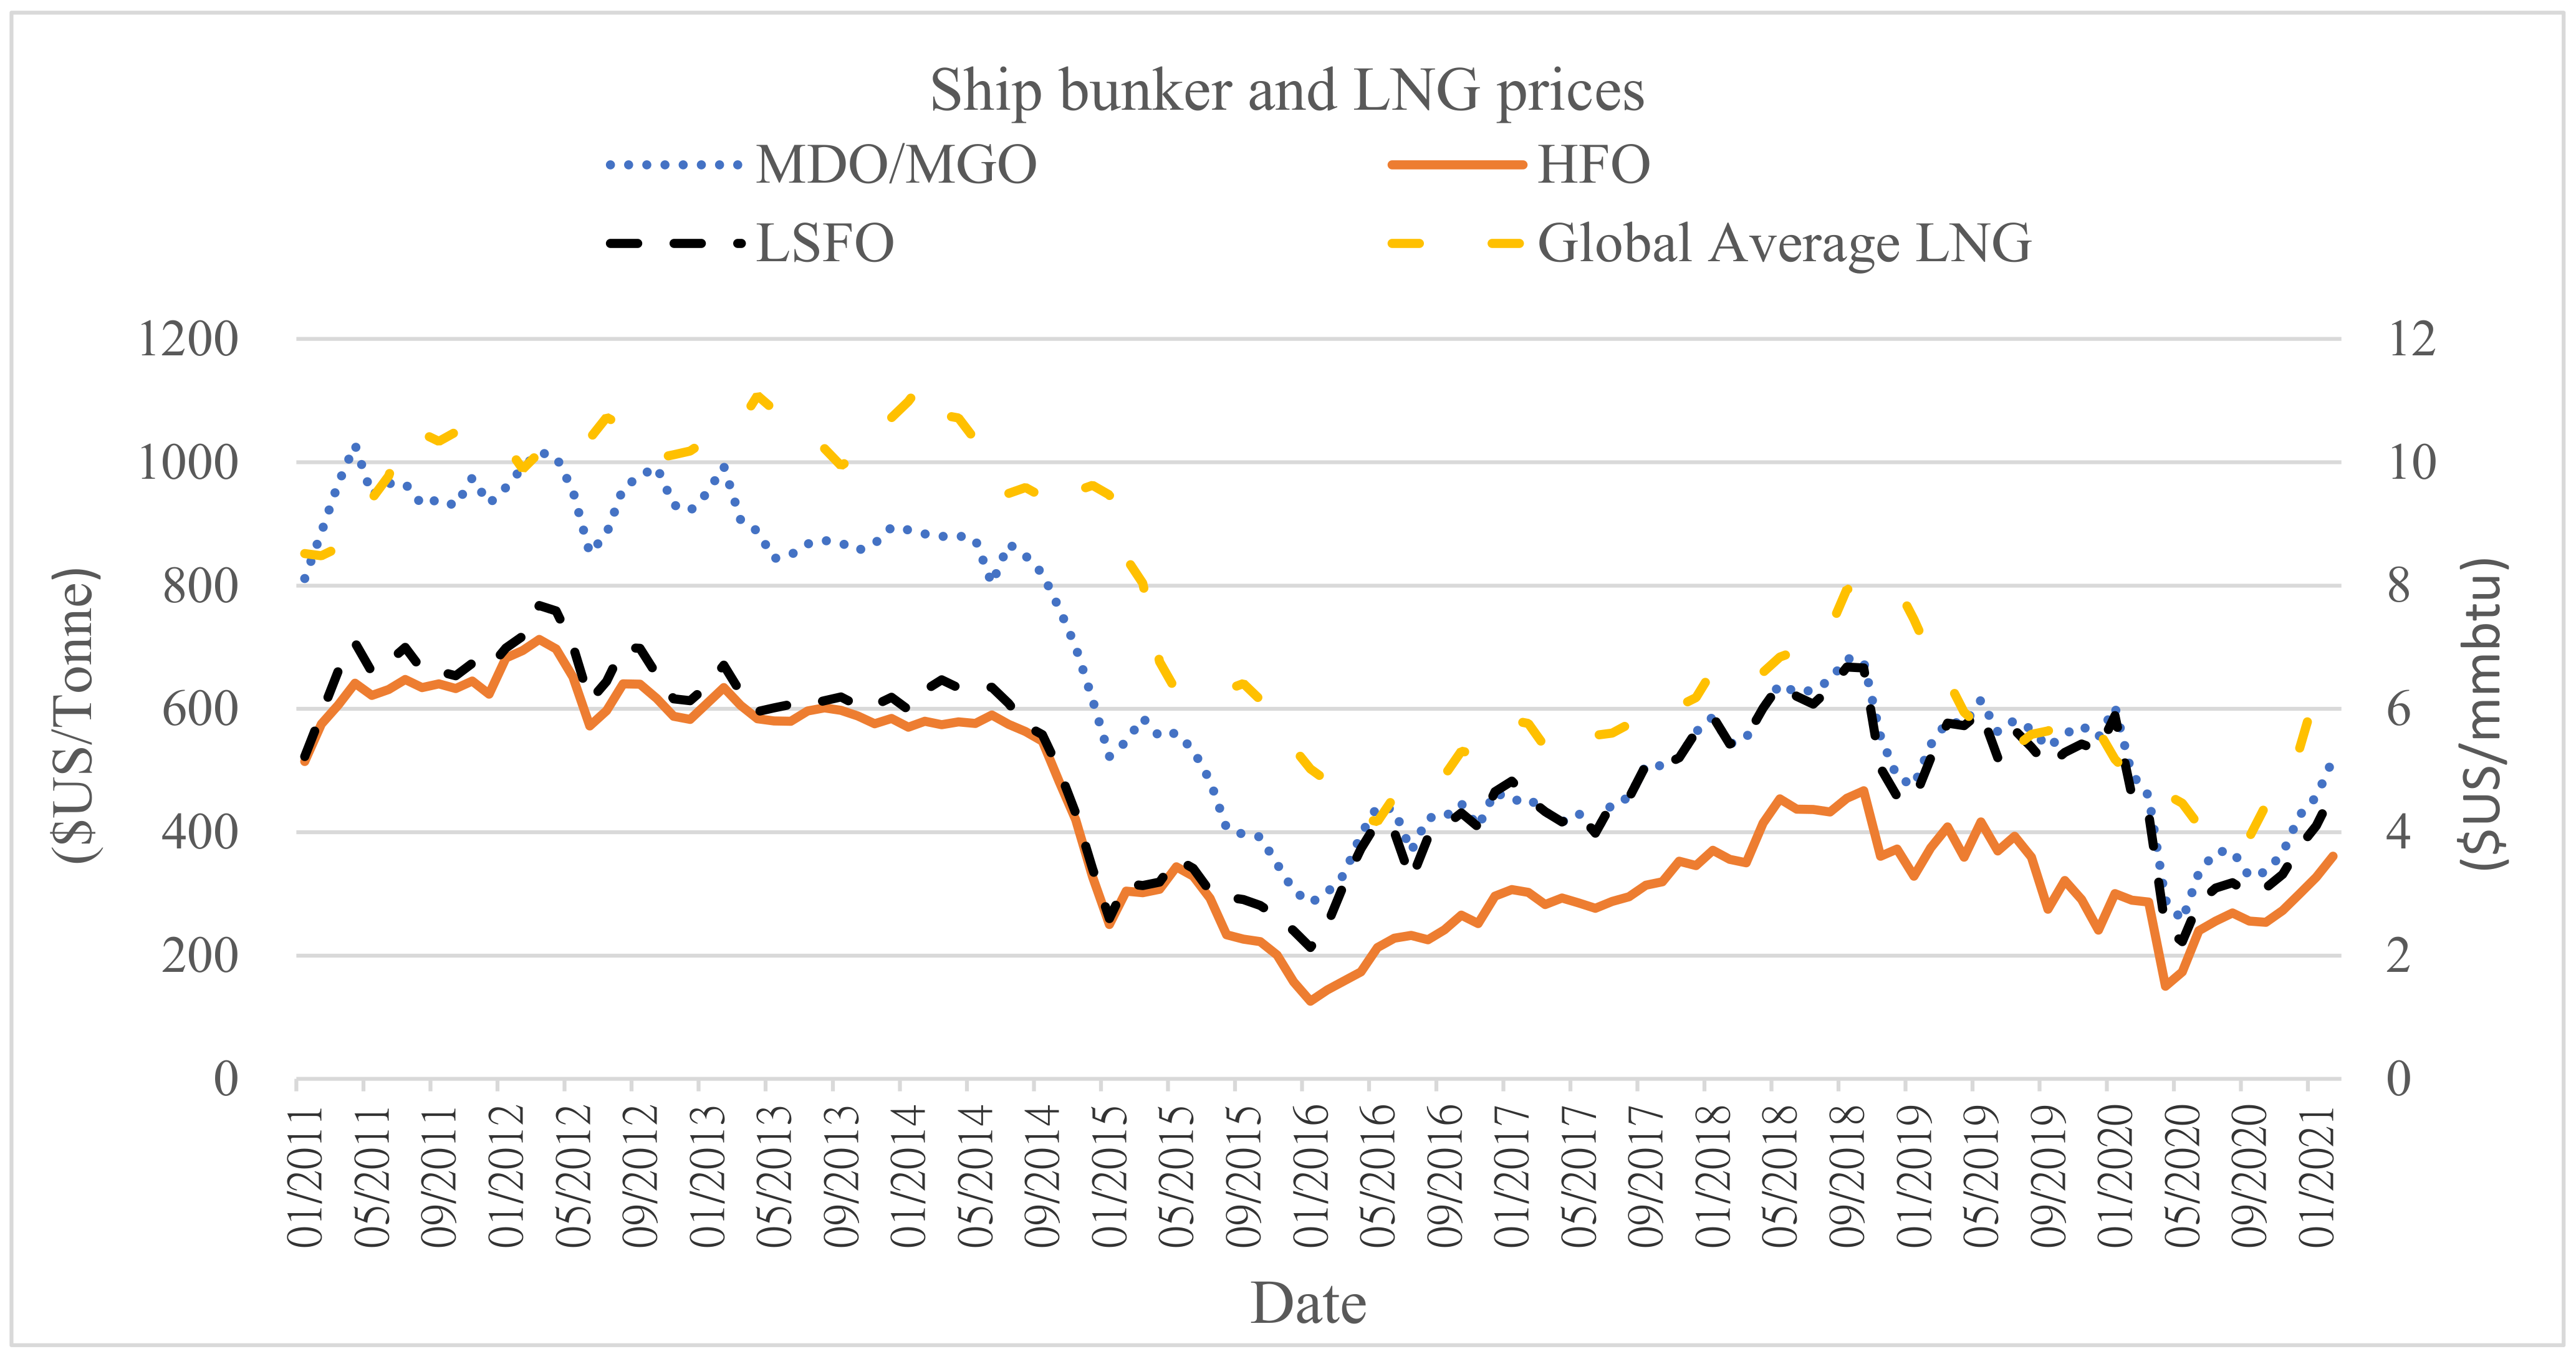
Figure 3 below shows the monthly price of ship bunker and LNG gas data between January 2011 and February 2021, which is based on fuel selection and indicated the cost of a one-way ship. The fuel costs are based on historical HFO, LSFO, MGO, and LNG prices. They depict the impact of fuel price changes on fuel costs.
3.2. Estimating the Shipping Bunker Cost for a Trip
We now measure the dispersion of fuel portfolio types’ cost data and their degree of volatility.
Table 2 summarizes and identifies the HFO + MGO + EGSC fuel portfolio types’ costs that have a high degree of volatility that is more than other fuel portfolio types’ cost via the coefficient of variation (CV).
Equation (3) uses the estimated fuel portfolio types’ cost in
Table 2. From the existing ships’ average fuel cost, we see that the average cost of HFO + MGO + EGSC (K&MC) (USD 2,254,037) per trip is cheaper than LSFO (USD 2,288,117) and MGO (USD 2,637,784). For a newly built ship, the average cost of LNG per trip (USD 967,867) is cheaper than HFO + MGO + EGSC (USD 2,064,037). These costs are only one component of fuel usage and do not include installation expenses, because the price of a newly built ship covers main engine equipment. Comparing the per trip fuel cost on fuel portfolio types can help one get a better handle on ship expenses and overall budget.
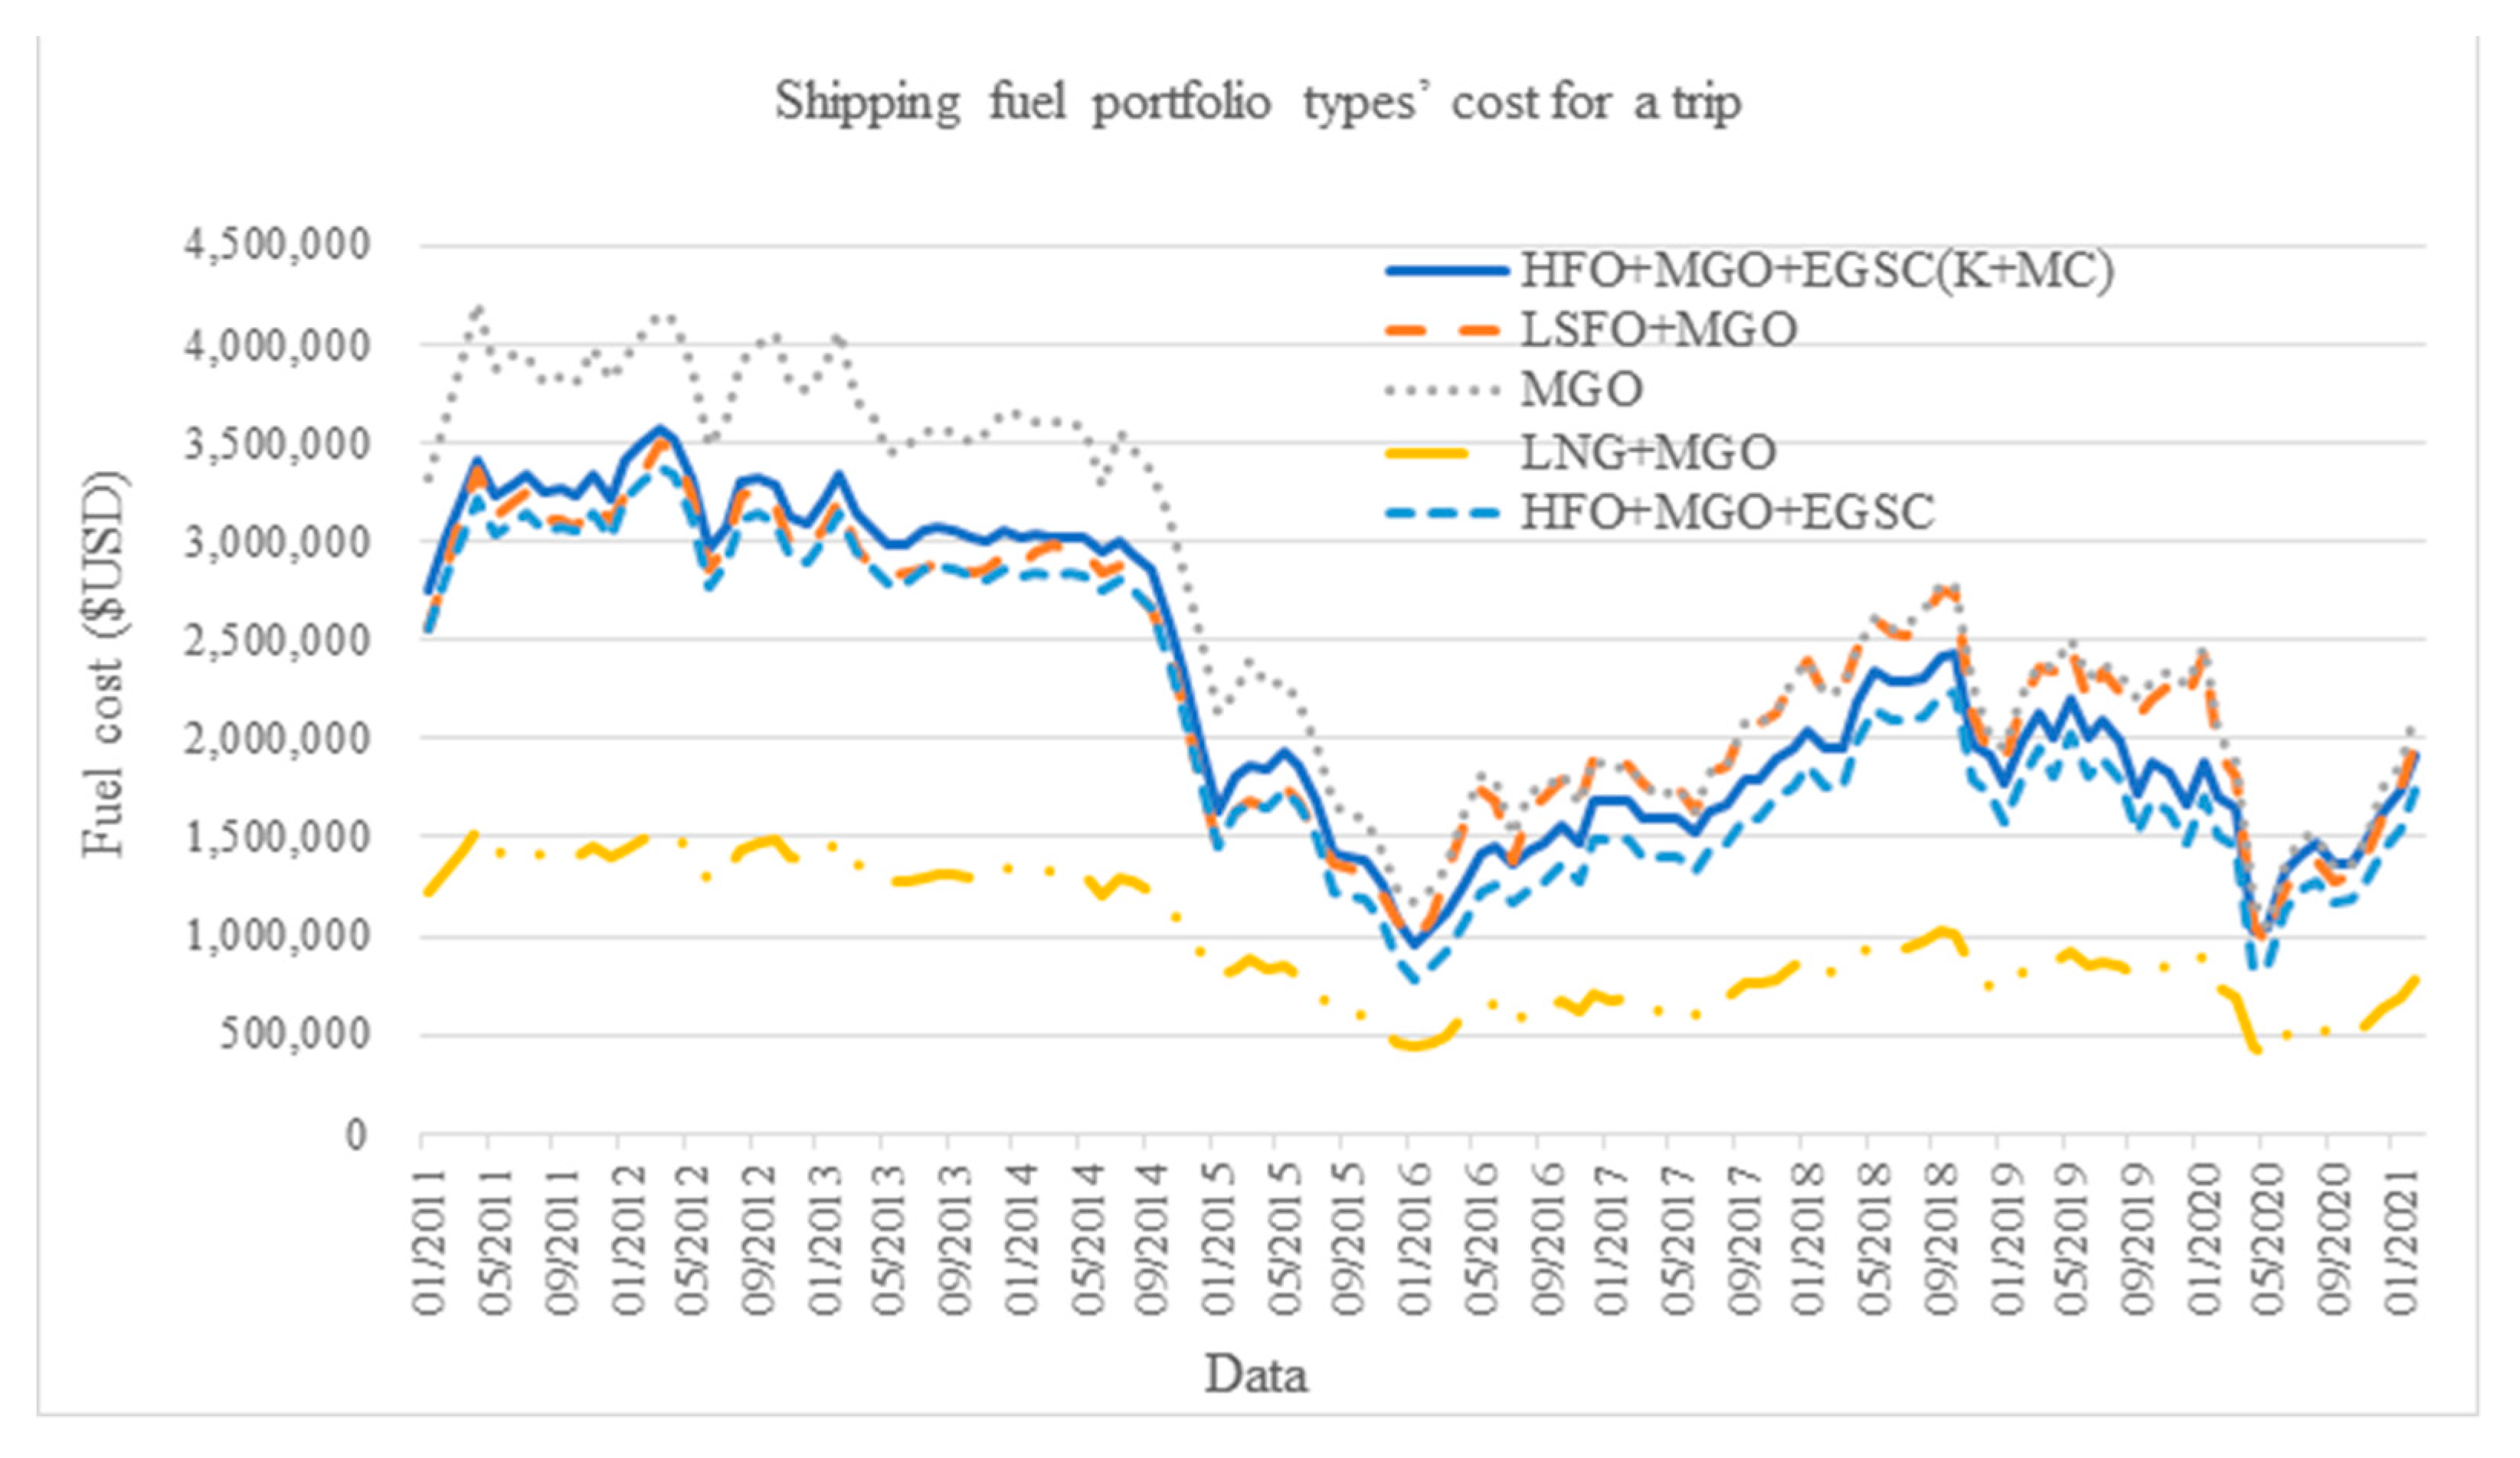
Figure 4 shows the historical fuel portfolio types’ cost. We see the highest cost in April 2011 and the lowest in April 2020. Thus, fuel costs are closely linked to fuel price and crude oil prices. For all shipping companies, the cost of fuel is the largest expenditure, and a sudden sharp rise in crude oil prices will severely impact profits. Choosing low-cost ship fuel will reduce operational risk.
3.3. Situational Analysis of Shipping Bunker Cost Risk
In order to choose the correct distribution for shipping bunker cost, we need to understand each of the possible distributions for fuel portfolio types’ cost. First, it is determined that a specific distribution by the historical data distribution goodness of fit test, Stephens [
13] propose three indicates has been employed to assess the most appropriate probability distribution. The first choice is Kolmogorov–Smirnov (K–S) test, which is performed to measure the fitness, the second choice is the Chi-squared test (X
2), and the third choice is Anderson–Darling test (A–D) which can gain the best tail distribution simulation.
Table 3 show the goodness of fit of a probability distribution to each cost of fuel portfolio series of data.
Since the fuel portfolio types’ cost critical values of K–S test statistic is less than the
p-value 0.95 critical values (0.12) [
13], Chi-squared test (X
2) tested statistic less than the
p-value 0.95 critical values (X
20.05,121 = 146.57) with 121 degrees of freedom and significance level 0.95, obtained from X
2 distribution threshold table for n = 121. A–D test statistic is greater than the
p-value 0.95 critical values (1.5) [
14] which rejected the null hypothesis in any distribution fits. The result shows the K–S and X
2 test fails to reject the null hypothesis for the beta distribution data set and goodness of fit more than the other distribution [
15]. Additionally, it was found that a close fit given by the beta distribution can help lead to a good prediction in all fuel portfolio types.
4. Empirical Results and Discuss
4.1. Simulation of CVaR of Fuel Portfolio Types’ Cost
The distributions of the Monte Carlo simulation of fuel portfolio types’ cost data are expressed graphically by using a histogram and the results of simulation for 1000 times as shown in
Figure 5,
Figure 6,
Figure 7,
Figure 8 and
Figure 9. Overall, fuel portfolio types’ cost are known as the beta family distribution and we found
Figure 5,
Figure 7,
Figure 8 and
Figure 9 proposed U-shaped and bimodal as a beta–arcsine distribution probability density; it represents uncertainty for a Bernoulli or a binomial distribution in Bayesian inference [
14].
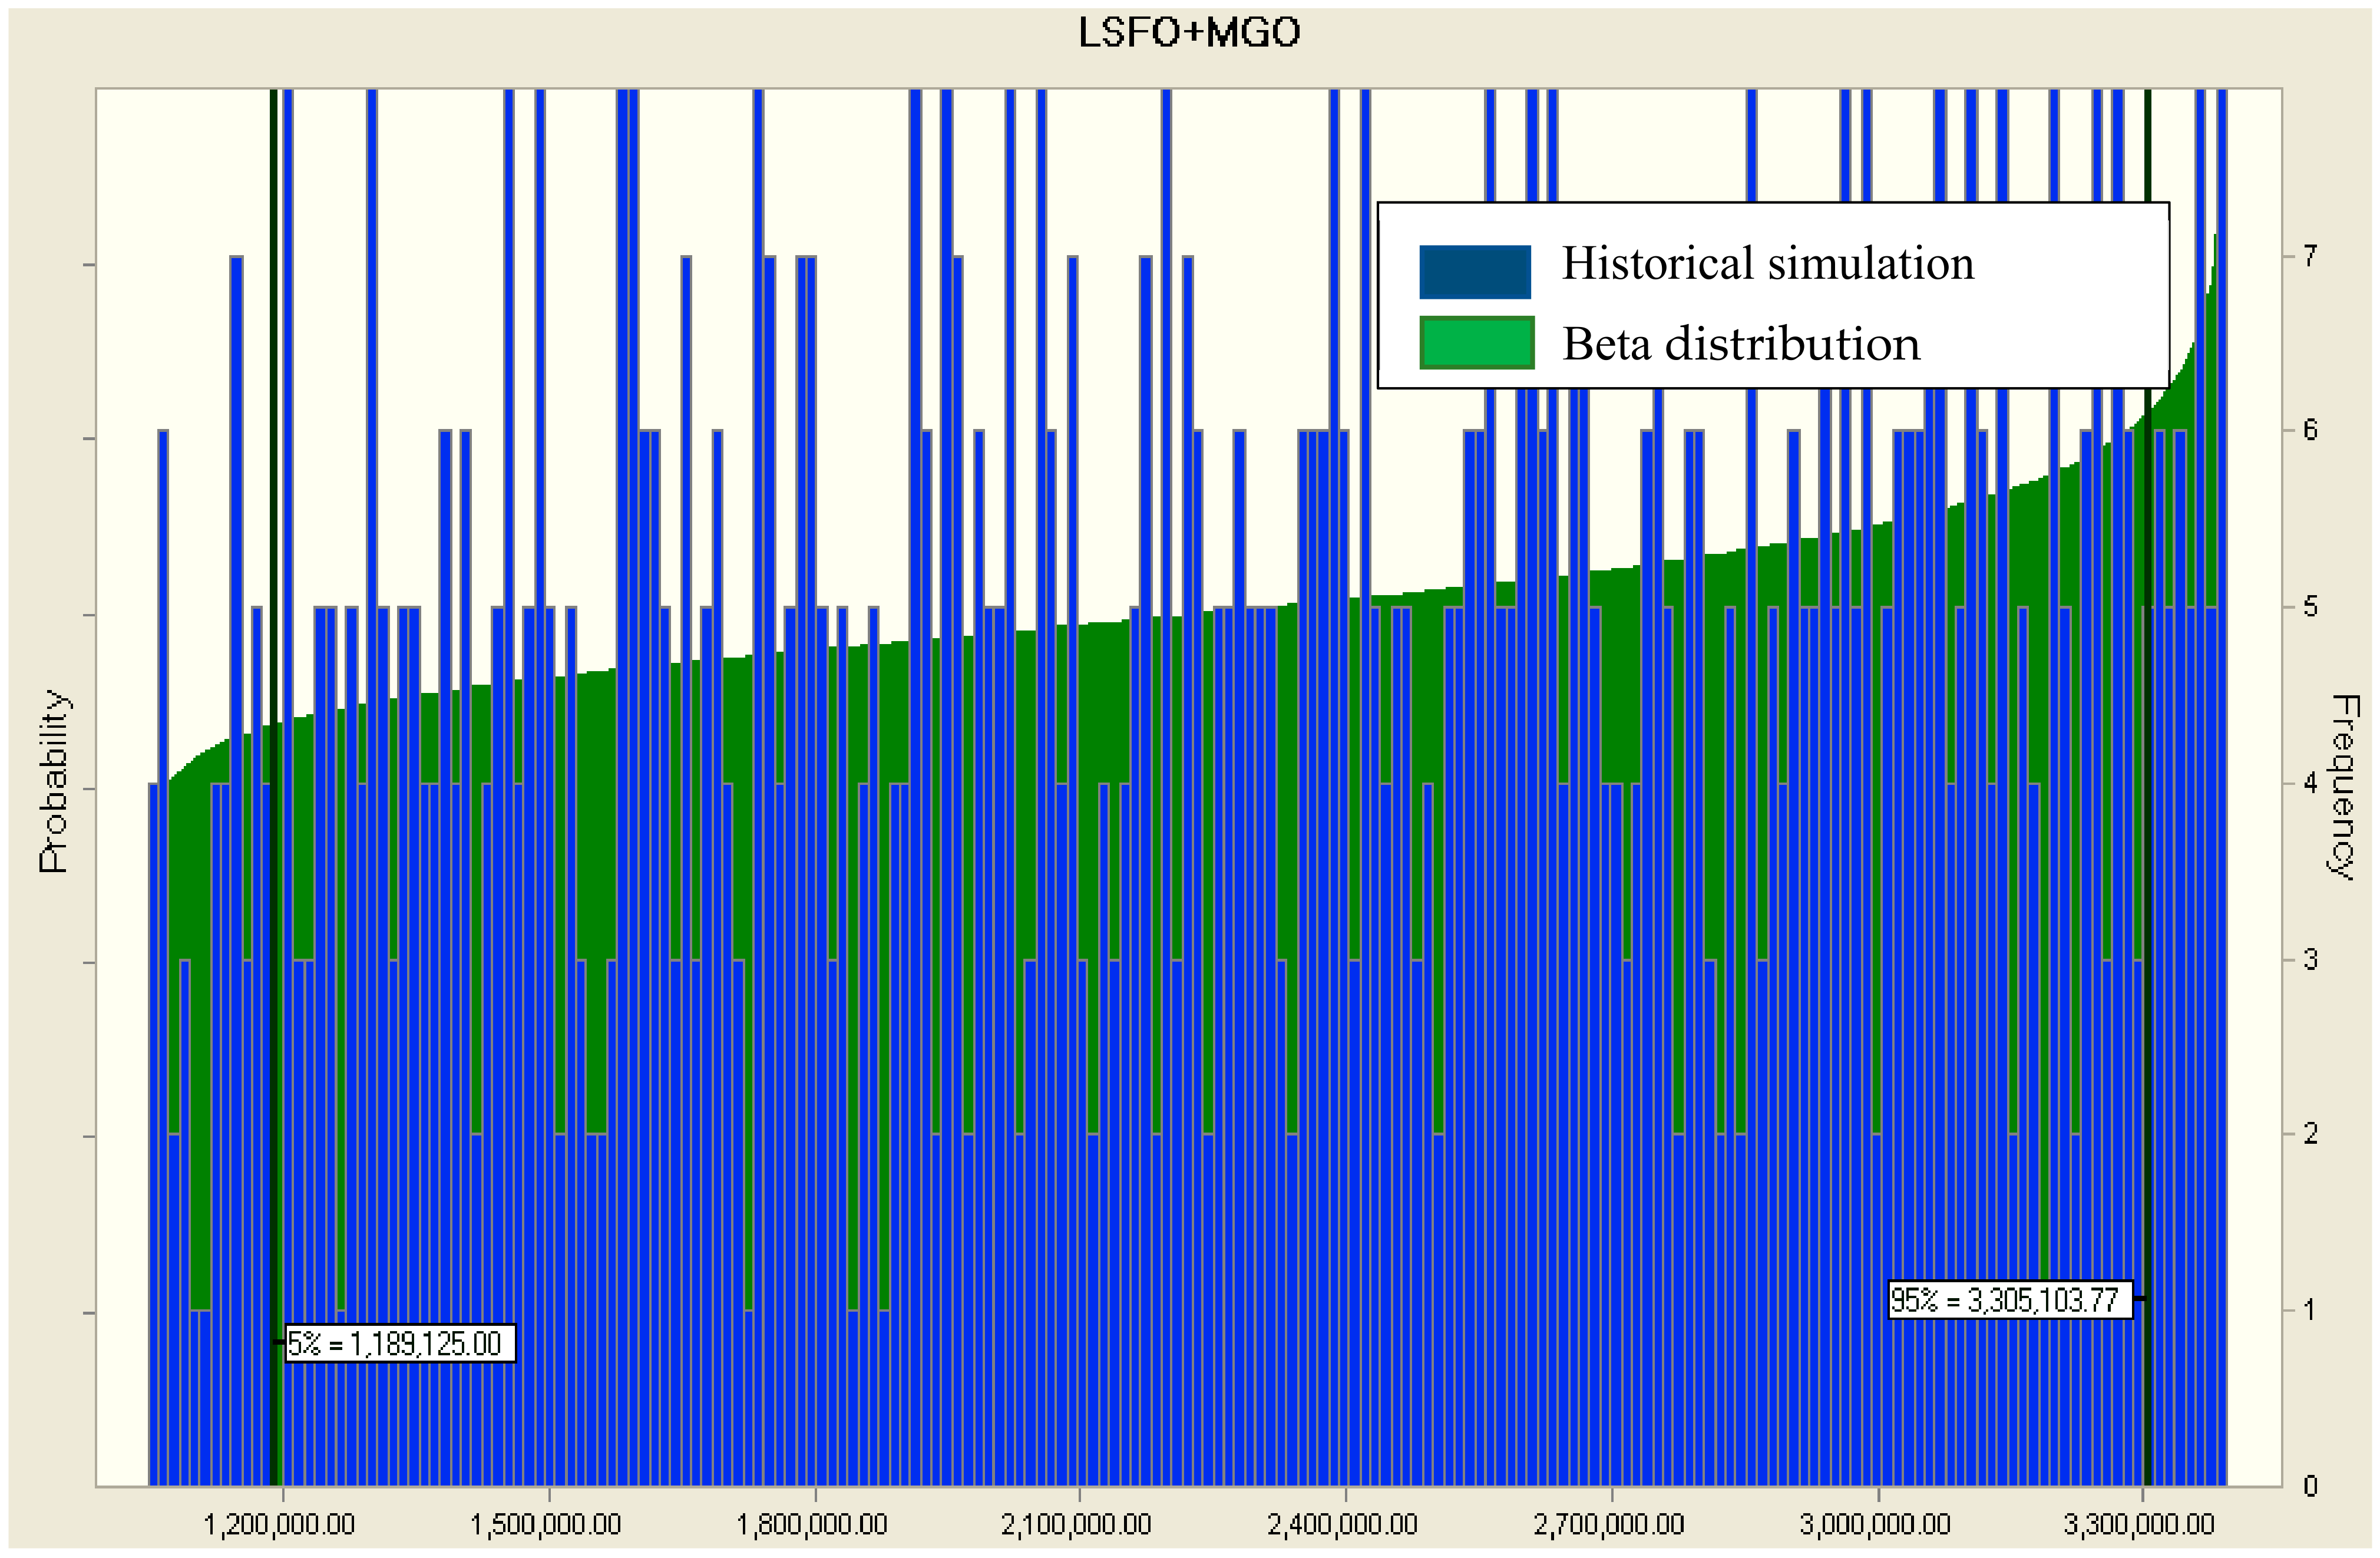
Figure 6 is LSFO + MGO fuel portfolio types’ costs beta distribution which was described to show a peak at the right tail only.
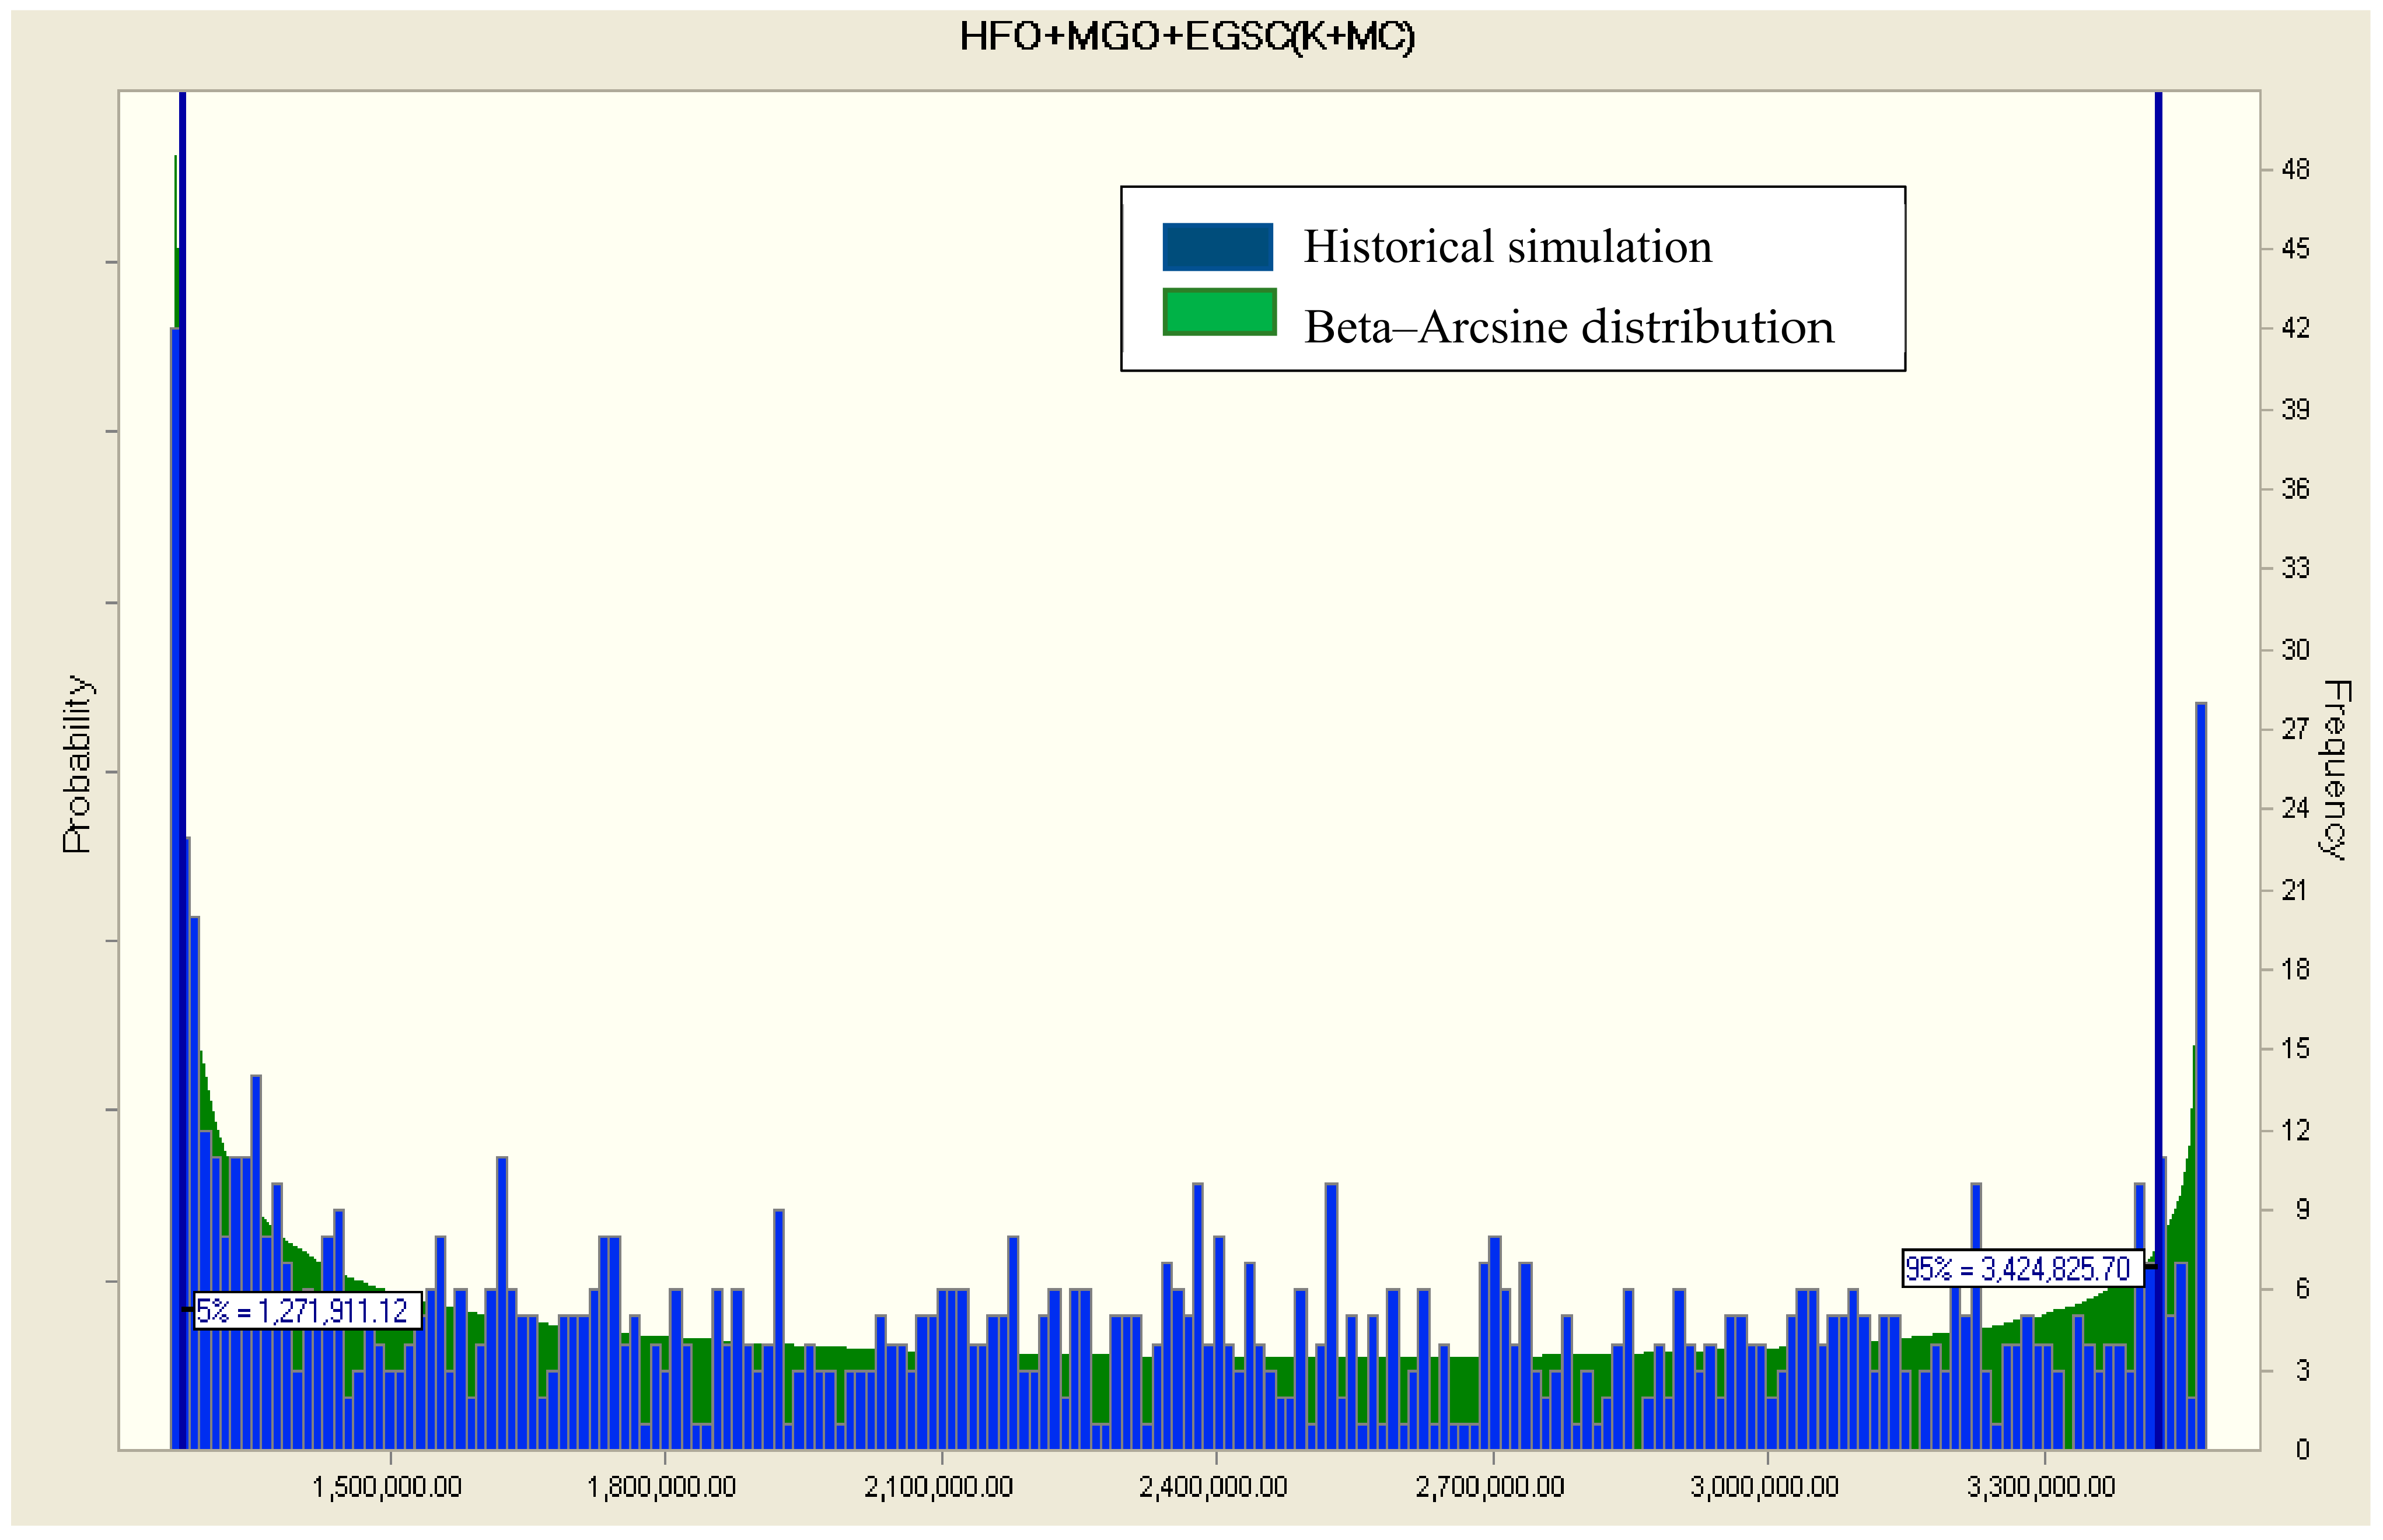
Figure 5 illustrates fuel portfolio types’ cost with high-frequency observations on both tails. The low cost at the 5% confidence level is USD 1,271,911, and the high cost at the 95% confidence level is USD 3,424,825. The fuel cost increase from 0.05% to 0.95% confidence level reaches about 2.69 times. Thus, as expected, Installation is a significant investment cost but passing the payback period, the use of HFO with scrubber fuel will cost down from USD 889,503 (0.05%) to USD 3,036,125 (0.95%) saving more expenses.
Figure 6 shows fuel portfolio types’ cost and their high-frequency observations on right tails. The low cost at the 5% confidence level is USD 1,302,603, and the high cost at the 95% confidence level is USD 3,323,054. The fuel cost increase from 0.05% to 0.95% confidence level reaches about 2.55 times. In the past few years, the price of LSFO about 30 to 50% more expensive than HFO. Thus, it costs more to switch from HFO to LSFO.
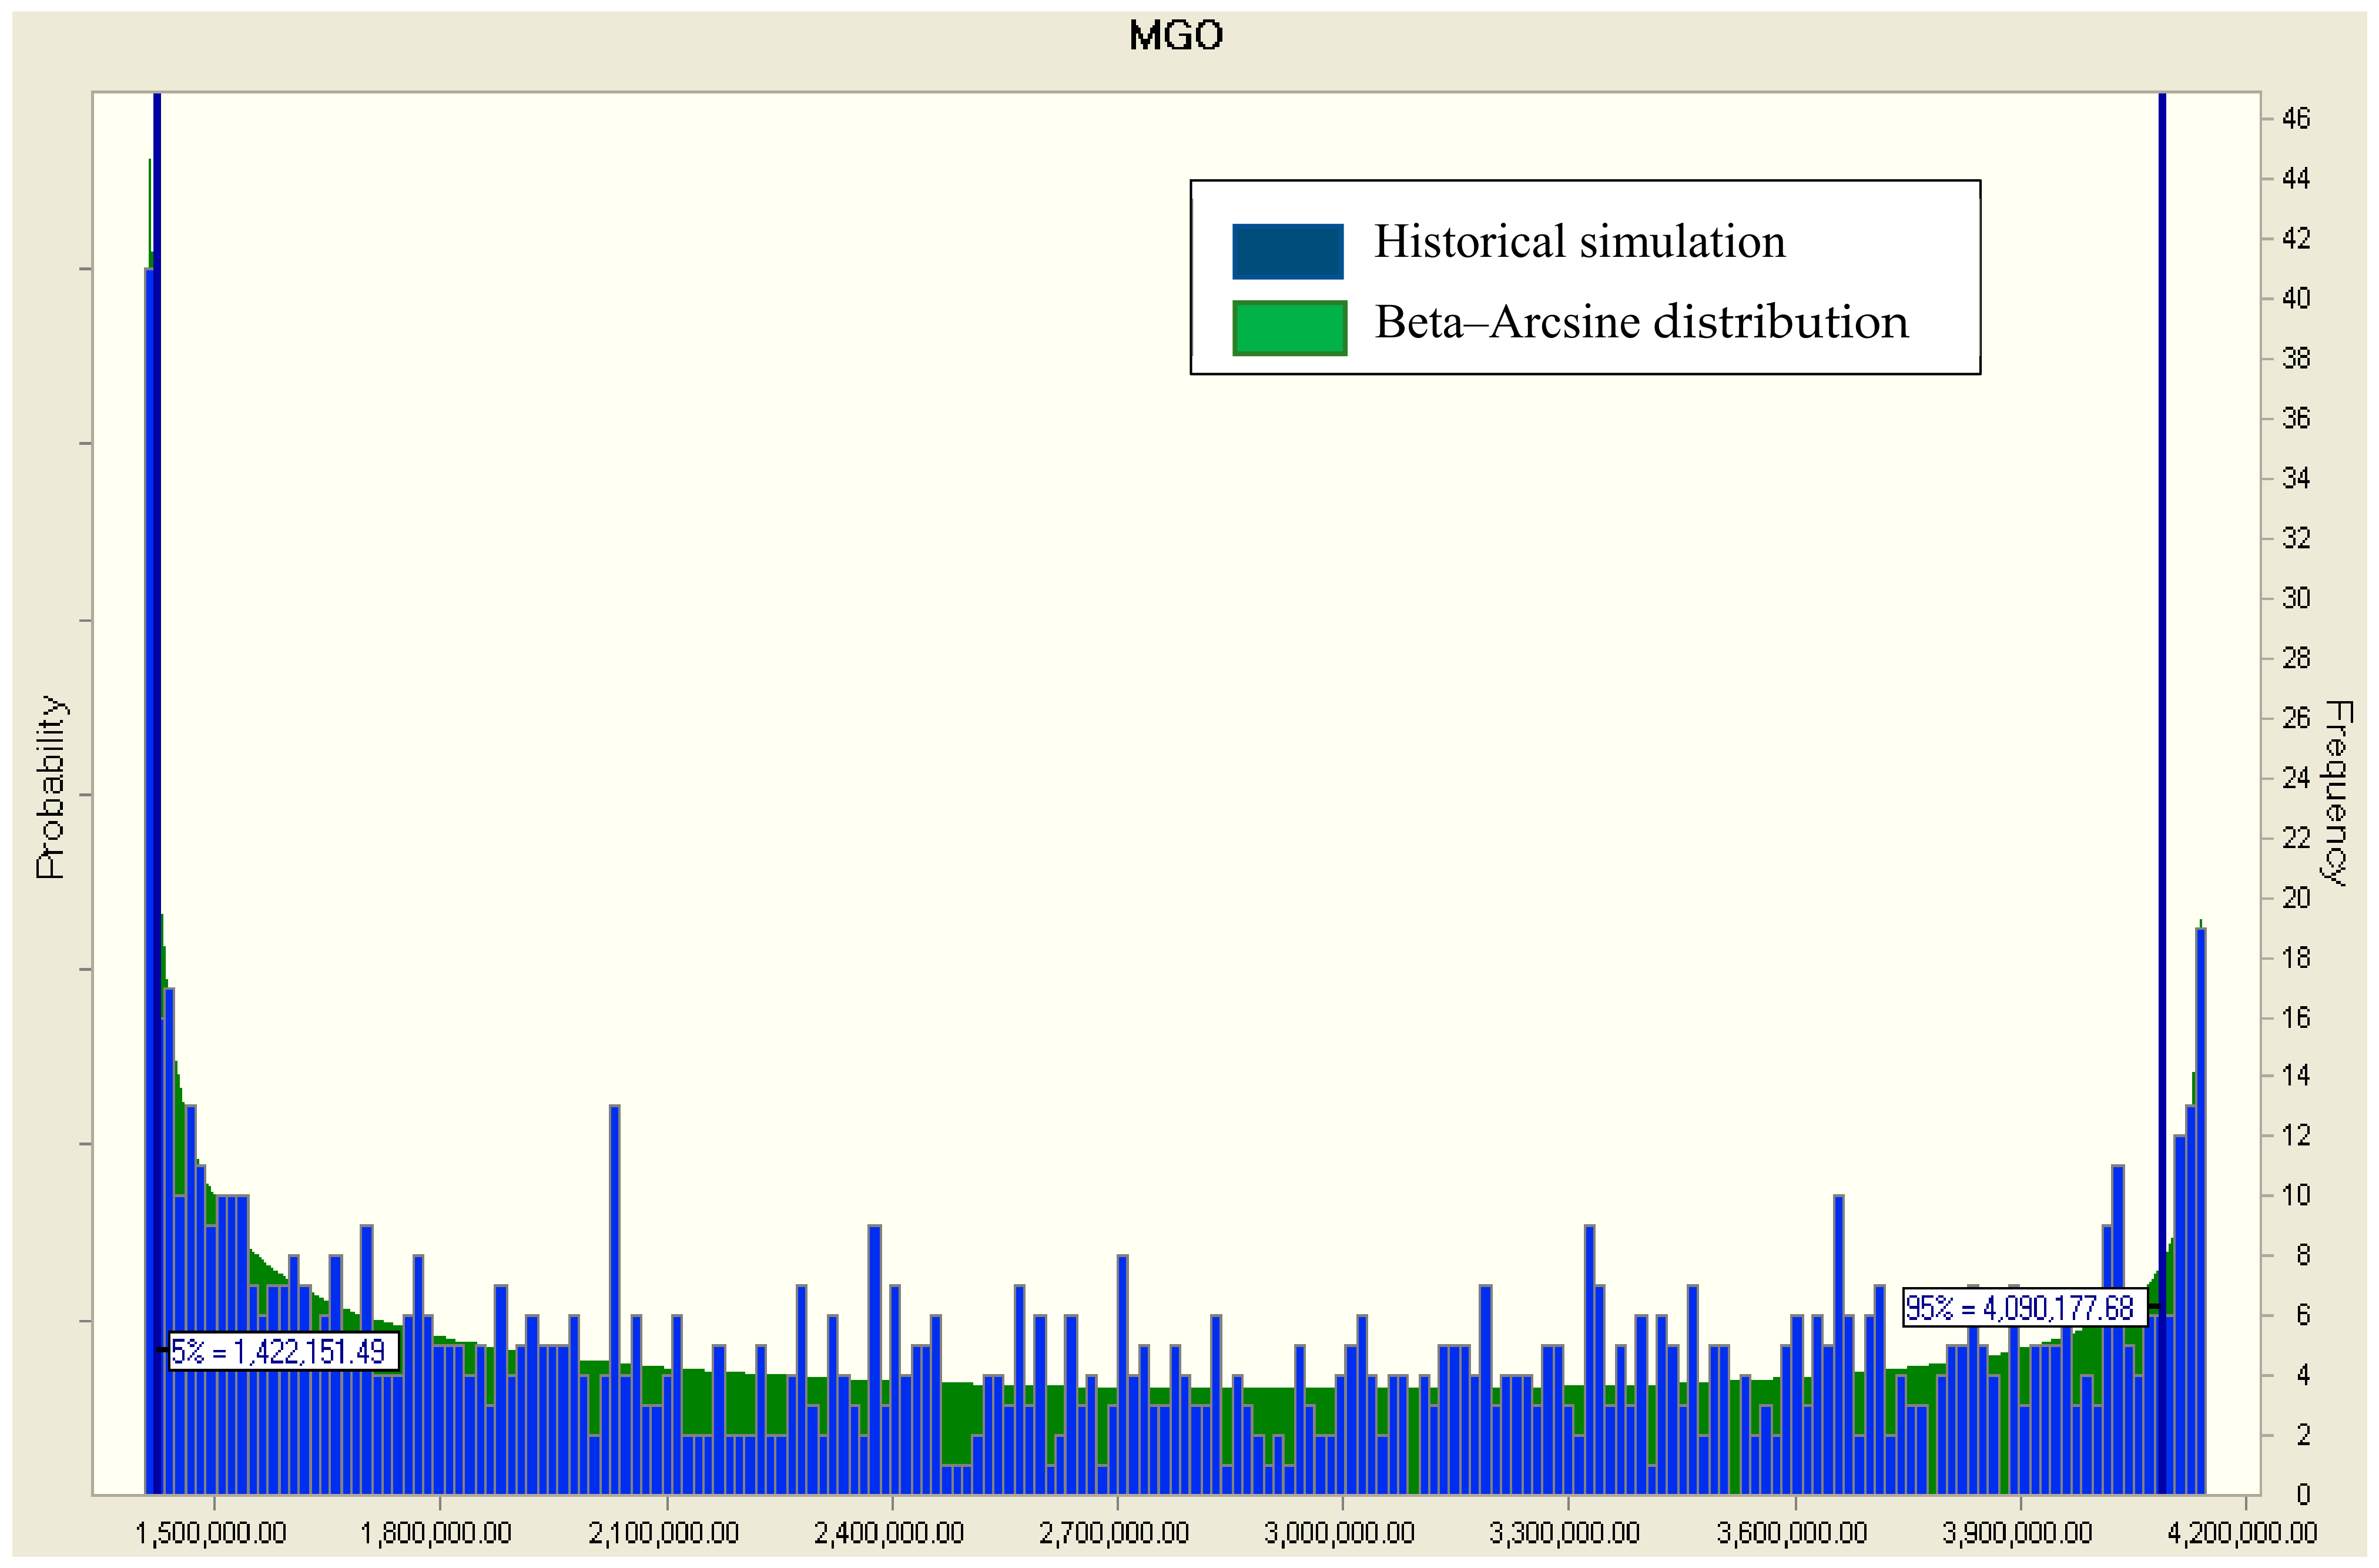
Figure 7 presents MGO fuel portfolio types’ cost and their high-frequency observations on both tails. The low cost at the 5% confidence level is USD 1,506,065, and the high cost at the 95% confidence level is USD 4,091,971. The fuel cost increase from 0.05% to 0.95% confidence level reaches about 2.71 times. MGO price is expensive relative to its fuel cost higher than using other fuels.
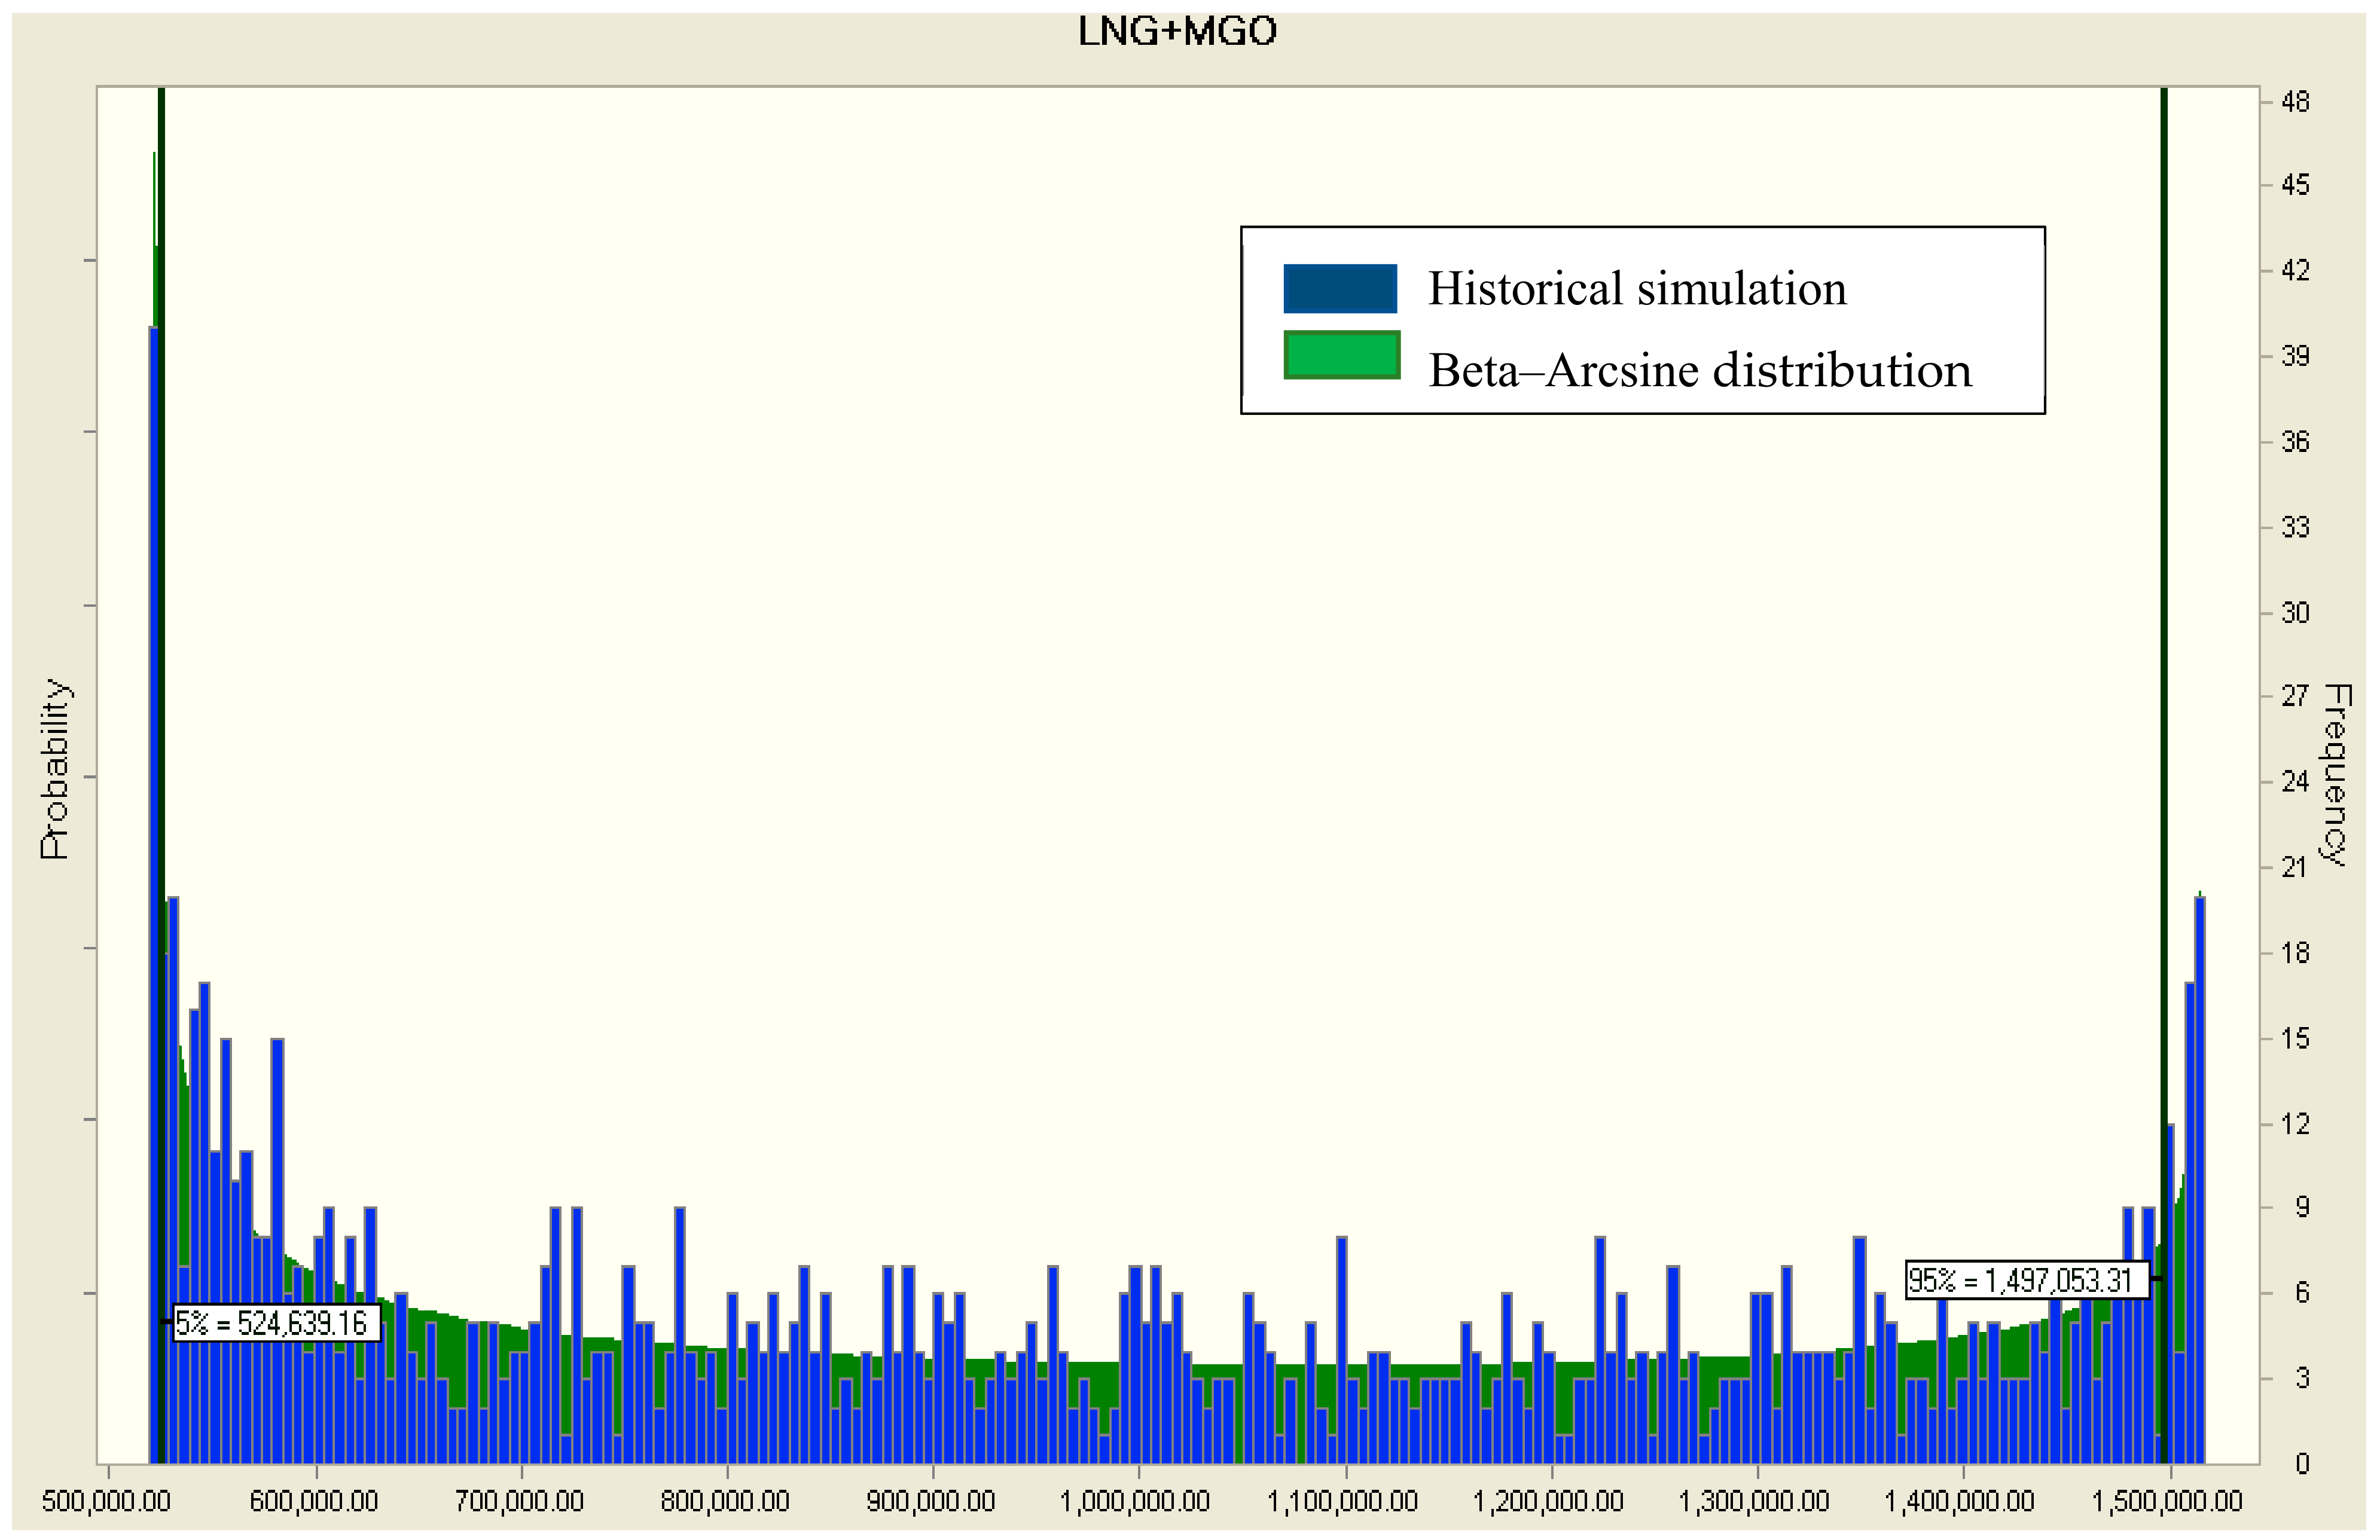
Figure 8 illustrates LNG portfolio types’ cost and their high-frequency observations on both tails. The low cost at the 5% confidence level is USD 555,726, and the high cost at the 95% confidence level is USD 1,503,463. The fuel cost increase from 0.05% to 0.95% confidence level reaches about 2.71 times. LNG is expected to be less costly than all marine fuel, but ship-owners always interested in new buildings ship only, the reason is saving relatively high investment costs for the power system.
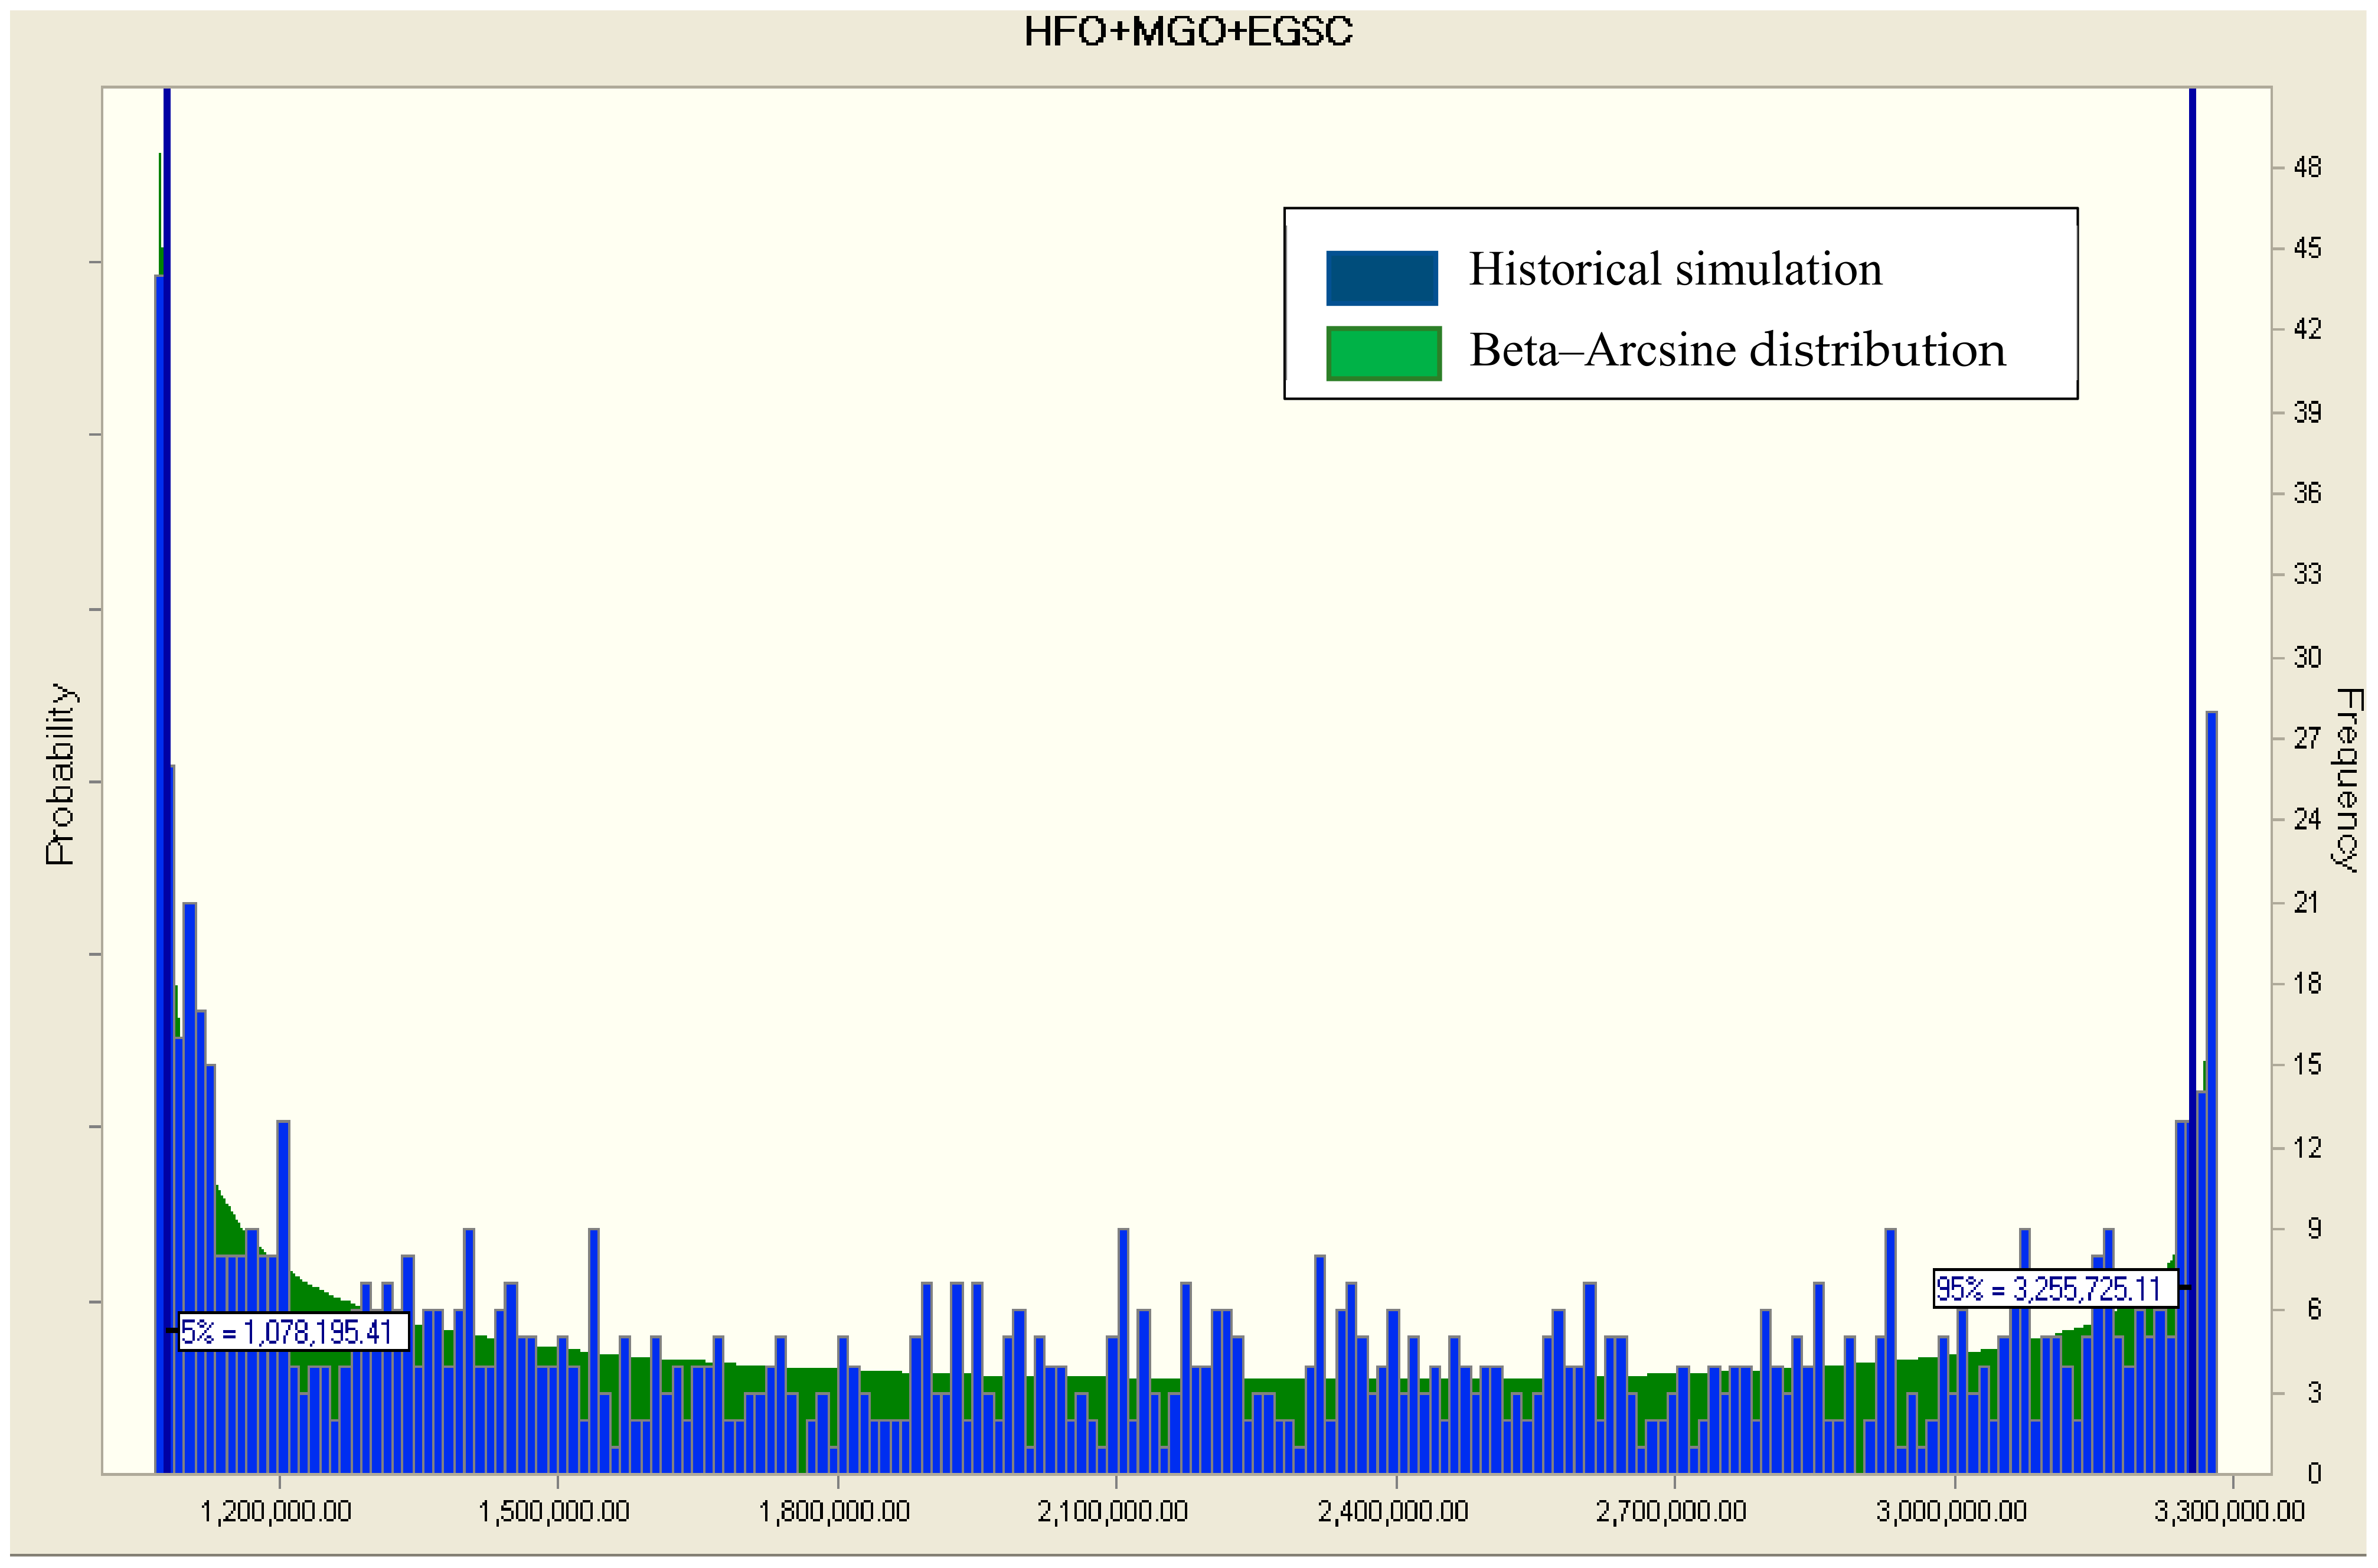
Figure 9 shows HFO + MGO + EGSC portfolio types’ cost and the high-frequency observations on both tails. The low cost at the 5% confidence level is USD 1,086,639, and the high cost at the 95% confidence level is USD 3,240,719. The fuel cost increase from 0.05% to 0.95% confidence level reaches about 2.98 times. Scrubber capital requirement is not installed in newbuilding ship. Thus, compare the fuel cost of installed scrubber in the existing ship and used scrubber with HFO in newbuilding ship, which is found newbuilding ship fuel cost could down about 5 to 15% than the existing ship.
4.2. Summarizes and Discussion
Table 4 summarizes the CVaR of fuel portfolio types’ cost at the 5% and 95% probability levels to measure possible costs of different portfolio types. For an existing ship, we find CVaR at 5% HFO + EGSC (K&MC) is the lowest fuel cost and CVaR at 95% MGO is the highest fuel cost. It means a change in fuel cost to MGO has high risk and HFO with installed EGSC has low risk. However, in terms of the variance of fuel cost, LSFO has the lowest fluctuation in fuel cost.
For a newly built ship with CVaR at 5% and 95%, LNG has the lowest fuel cost versus HFO + EGSC. It means shipowners should choose LNG fuel to reduce fuel cost and lower risk.
4.3. Risk Management Strategies in Bunker Cost
Our CVaR analysis indicates that bunker price volatility significantly increases bunker cost in the shipping, and it could reduce the risk through risk management strategy. The reliability practices on the risk management strategies in shipping are listed as follows:
(1) Suitable alternative fuel selection
A selection that costs the lowest and is the most efficient and eco-friendly fuel choice. For instance, the newbuilding LNG fueled ships have not only economic benefits but also practical and environmental advantages, simply by having current ships replace fuel to LSFO or HFO with EGSC. In addition, there are which fuels may be more beneficial for a shipping company in terms of many criteria, such as fleet size, ship type and bunking port limited in a variety of routes.
(2) Hedging bunker cost using alternatives
The variety of fuel prices have seriously affected the profitability of the shipping business. Alizadeh and Nomikos [
16] suggested the strategy of hedging bunker cost, they claim to choose the OTC bunker derivatives products, such as forward bunker agreements, bunker swaps and alternatives on bunker prices to hedging bunker cost.
(3) Passing the bunker surcharges on to customers
Ocean carriers pass some of that operational cost burden onto their customers such as Bunker Adjustment Factor (BAF), Emergency Bunker Surcharges (EBS) or Low Sulphur Fuel Surcharge (LSF), but when long-term ocean freight rates decline on poor economic will limit the carriers’ ability to reduce their loss of fuel costs.
5. Conclusions
Coronavirus oil shock and IMO low sulphur fuel limitation make the management of shipping bunker complex and crucial. It involves decision-making in both existing ships and newbuilding ships. That is why these two types of grades levels are discussed separately in this paper.
1. Risk management of fuel portfolio types’ cost for existing ships
More than 5.9% of the total number of container ships or 11.8% of total fleet capacity fitted with scrubbers by January 2020 when IMO’s global 0.5% fuel sulphur cap comes into effect [
3]. Ship operators are vigorously pursuing scrubber installation, but they also face a risk in which there is no guarantee that they will not be targeted by IMO again in the foreseeable future. Thus, strategies overcoming the negative impact of regulatory uncertainties should focus on reducing the negative impact or likelihood of threats. One can consider changing to low-sulfur oil or scrapping and dismantling ships to reduce and eliminate threats to existing ships.
2. Risk management of fuel portfolio types’ cost for newly built ship
As suggested by Hansson et al. [
17], LNG is best in terms of fuel price and available infrastructure, because it is cheap, clean fuel. However, the problem is that the necessary equipment and heavy-weight metal tanks for storing LNG may add more volume to the LNG-powered vessels than it could carry. The possible solution is to build a carbon-fiber tank that is up to 90% lighter than metal tanks, so that a long-term natural gas supply contract could be executed to stabilize fuel cost as the expected refueling cost could be minimized by the shipping company [
18].
The fact is that the price of oil should recover to near pre-coronavirus levels in the future as economies recover. Even as oil prices are battered down to 18-year lows, one energy fund thinks USD 100 a barrel is still achievable in the future [
19]. Ship operators will still face high-fuel prices and high expenditures from fuel costs. Therefore, alternative fuels and technologies must focus on long-term plans that entail higher expected return with lower risk compared to high sulphur fuel oils. For risk management, we suggest that operators install scrubbers to clean the exhaust gas and use HFO for existing ships. For newly built ships, operators can change the use of fuel into LNG, which could help save on capital expenses.
Author Contributions
Conceptualization, T.-C.H. and C.-M.W.; Literature review and information search, T.-C.H. and C.-M.W.; Draft writing, T.-C.H. and C.-M.W.; Reviewing and editing: T.-C.H. and C.-M.W., Administration, T.-C.H. All authors have read and agreed to the published version of the manuscript.
Funding
This research received no external funding.
Informed Consent Statement
Informed consent was obtained from all subjects involved in the study.
Data Availability Statement
The data presented in this study are available on request from the corresponding author. The data are not publicly available as it contains information that could compromise the privacy of research participants.
Acknowledgments
We would like to thank three anonymous (unknown) reviewers and the editor for their comments.
Conflicts of Interest
The authors declare no conflict of interest.
References
- Kalli, J.; Repka, S.; Alhosalo, M. Estimating Costs and Benefits of Sulphur Content Limits in Ship Fuel. Int. J. Sustain. Transp. 2015, 9, 468–477. [Google Scholar] [CrossRef]
- S&P Global. Coronavirus Impact Masking Post-IMO 2020 Risks for Marine Fuels. 24 February 2020. Available online: https://www.spglobal.com/platts/en/market-insights/latest-news/oil/022420-coronavirus-Impact-masking-post-imo-2020-risks-for-marine-fuels (accessed on 1 May 2020).
- Alpha Liner. Weekly Newsletter. Volume 2019. Issue 50. Available online: https://files.constantcontact.com/8e1f5de2401/f102b5a0-9019-44b2-bbb3-97a6cf5bdc1f.pdf (accessed on 1 May 2020).
- Zheng, W.; Li, B.; Song, D.P. Effects of risk-aversion on competing shipping lines’ pricing strategies with uncertain demands. Transp. Res. Part B 2017, 104, 337–356. [Google Scholar] [CrossRef]
- Gu, Y.; Wallace, S.W.; Wang, X. The Impact of Bunker Risk Management on CO2 Emissions in Maritime Transportation under ECA Regulation. Available online: https://openaccess.nhh.no/nhh-xmlui/bitstream/handle/11250/2421290/1716.pdf?sequence=1&isAllowed=y (accessed on 1 May 2020).
- Madadi, A.; Kurz, M.E.; Mason, S.J.; Taaffe, K.M. A Metaheuristic Approach to Supply Chain Network Design Using CVaR. In Proceedings of the IIE Annual Conference Proceedings, Norcross, GA, USA, 1–9 November 2012; pp. 1–9. [Google Scholar]
- Sun, R.; Ma, T.; Liu, S.; Sathye, M. Improved Covariance Matrix Estimation for Portfolio Risk Measurement: A Review. J. Risk Financ. Manag. 2019, 12, 48. [Google Scholar] [CrossRef]
- Han, T.C.; Chou, C.C.; Wang, C.M. Cash flow at risk and risk management in bulk shipping company: Case of Capesize bulk carrier. J. Eng. Marit. Environ. 2016, 230, 13–21. [Google Scholar] [CrossRef]
- Carlo, T. Emission estimate methodology for maritime navigation. In Proceedings of the US EPA 19th International Emissions Inventory Conference, San Antonio, TX, USA, 27–30 September 2010. [Google Scholar]
- Stopford, M. Maritime Economics 3e; Routledge: London, UK, 2009; p. 233. [Google Scholar]
- Sergey, S.; Gaia, S.; Stan, U. Value-at-Risk vs. Conditional Value-at-Risk in Risk Management and Optimization. In Proceedings of the INFORMS Annual Meeting, Washington, DC, USA, 5–12 October 2008. [Google Scholar]
- Supply Chain Digest Global Supply Chain News: Maersk Triple Ecost Advantages are too great to Ignore. 2013. Available online: http://www.scdigest.com/ontarget/13-09-12-1.php?cid=7401&ctype=content (accessed on 20 September 2014).
- Stephens, M.A. Goodness-of-fit for the extreme value distribution. Biometrika 1977, 64, 583–588. [Google Scholar] [CrossRef]
- James, R.E.; David, L. Introduction to Simulation and Risk Analysis; Prentice Hall: Olson Upper Saddle River, NJ, USA, 1998. [Google Scholar]
- U.S.D. of Commerce. NIST/SEMATECH e-Handbook of Statistical Methods. 2012. Available online: https://www.itl.nist.gov/div898/handbook/ (accessed on 20 September 2014).
- Alizadeh, A.H.; Nomikos, N.K. Shipping Derivatives and Risk Management; Palgrave, Macmillan: New York, NY, USA, 2009. [Google Scholar]
- Hansson, J.; Grahn, M.; Månsson, S. Assessment of the possibilities for Selected Alternative Fuels for the Maritime Sector. In Proceedings of the Conference Proceedings, Shipping in Changing Climates (SCC), London, UK, 4–5 September 2017. [Google Scholar]
- Pedrielli, G.; Lee, L.H.; Ng, S.H. Optimal bunkering contract in a buyer seller supply chain under price and consumption uncertainty. Transp. Res. Part E 2015, 77, 77–94. [Google Scholar] [CrossRef]
- Bloomberg. Energy Hedge Fund That Shorted Oil Sees Chance for $100 a Barre. 17 April 2020. Available online: https://www.bloombergquint.com/markets/energy-hedge-fund-that-shorted-oil-sees-chance-for-100-again (accessed on 1 May 2020).
| Publisher’s Note: MDPI stays neutral with regard to jurisdictional claims in published maps and institutional affiliations. |
© 2021 by the authors. Licensee MDPI, Basel, Switzerland. This article is an open access article distributed under the terms and conditions of the Creative Commons Attribution (CC BY) license (https://creativecommons.org/licenses/by/4.0/).


