
Long-Term Sustainable Investment for Retirement

 ,
, 
 and
and
Abstract
1. Introduction
2. Related Literature
3. Statistical Testing
3.1. Methodology and Data
3.2. Results
4. Historical Backtesting
4.1. Aim
4.2. Model Assumptions and Data
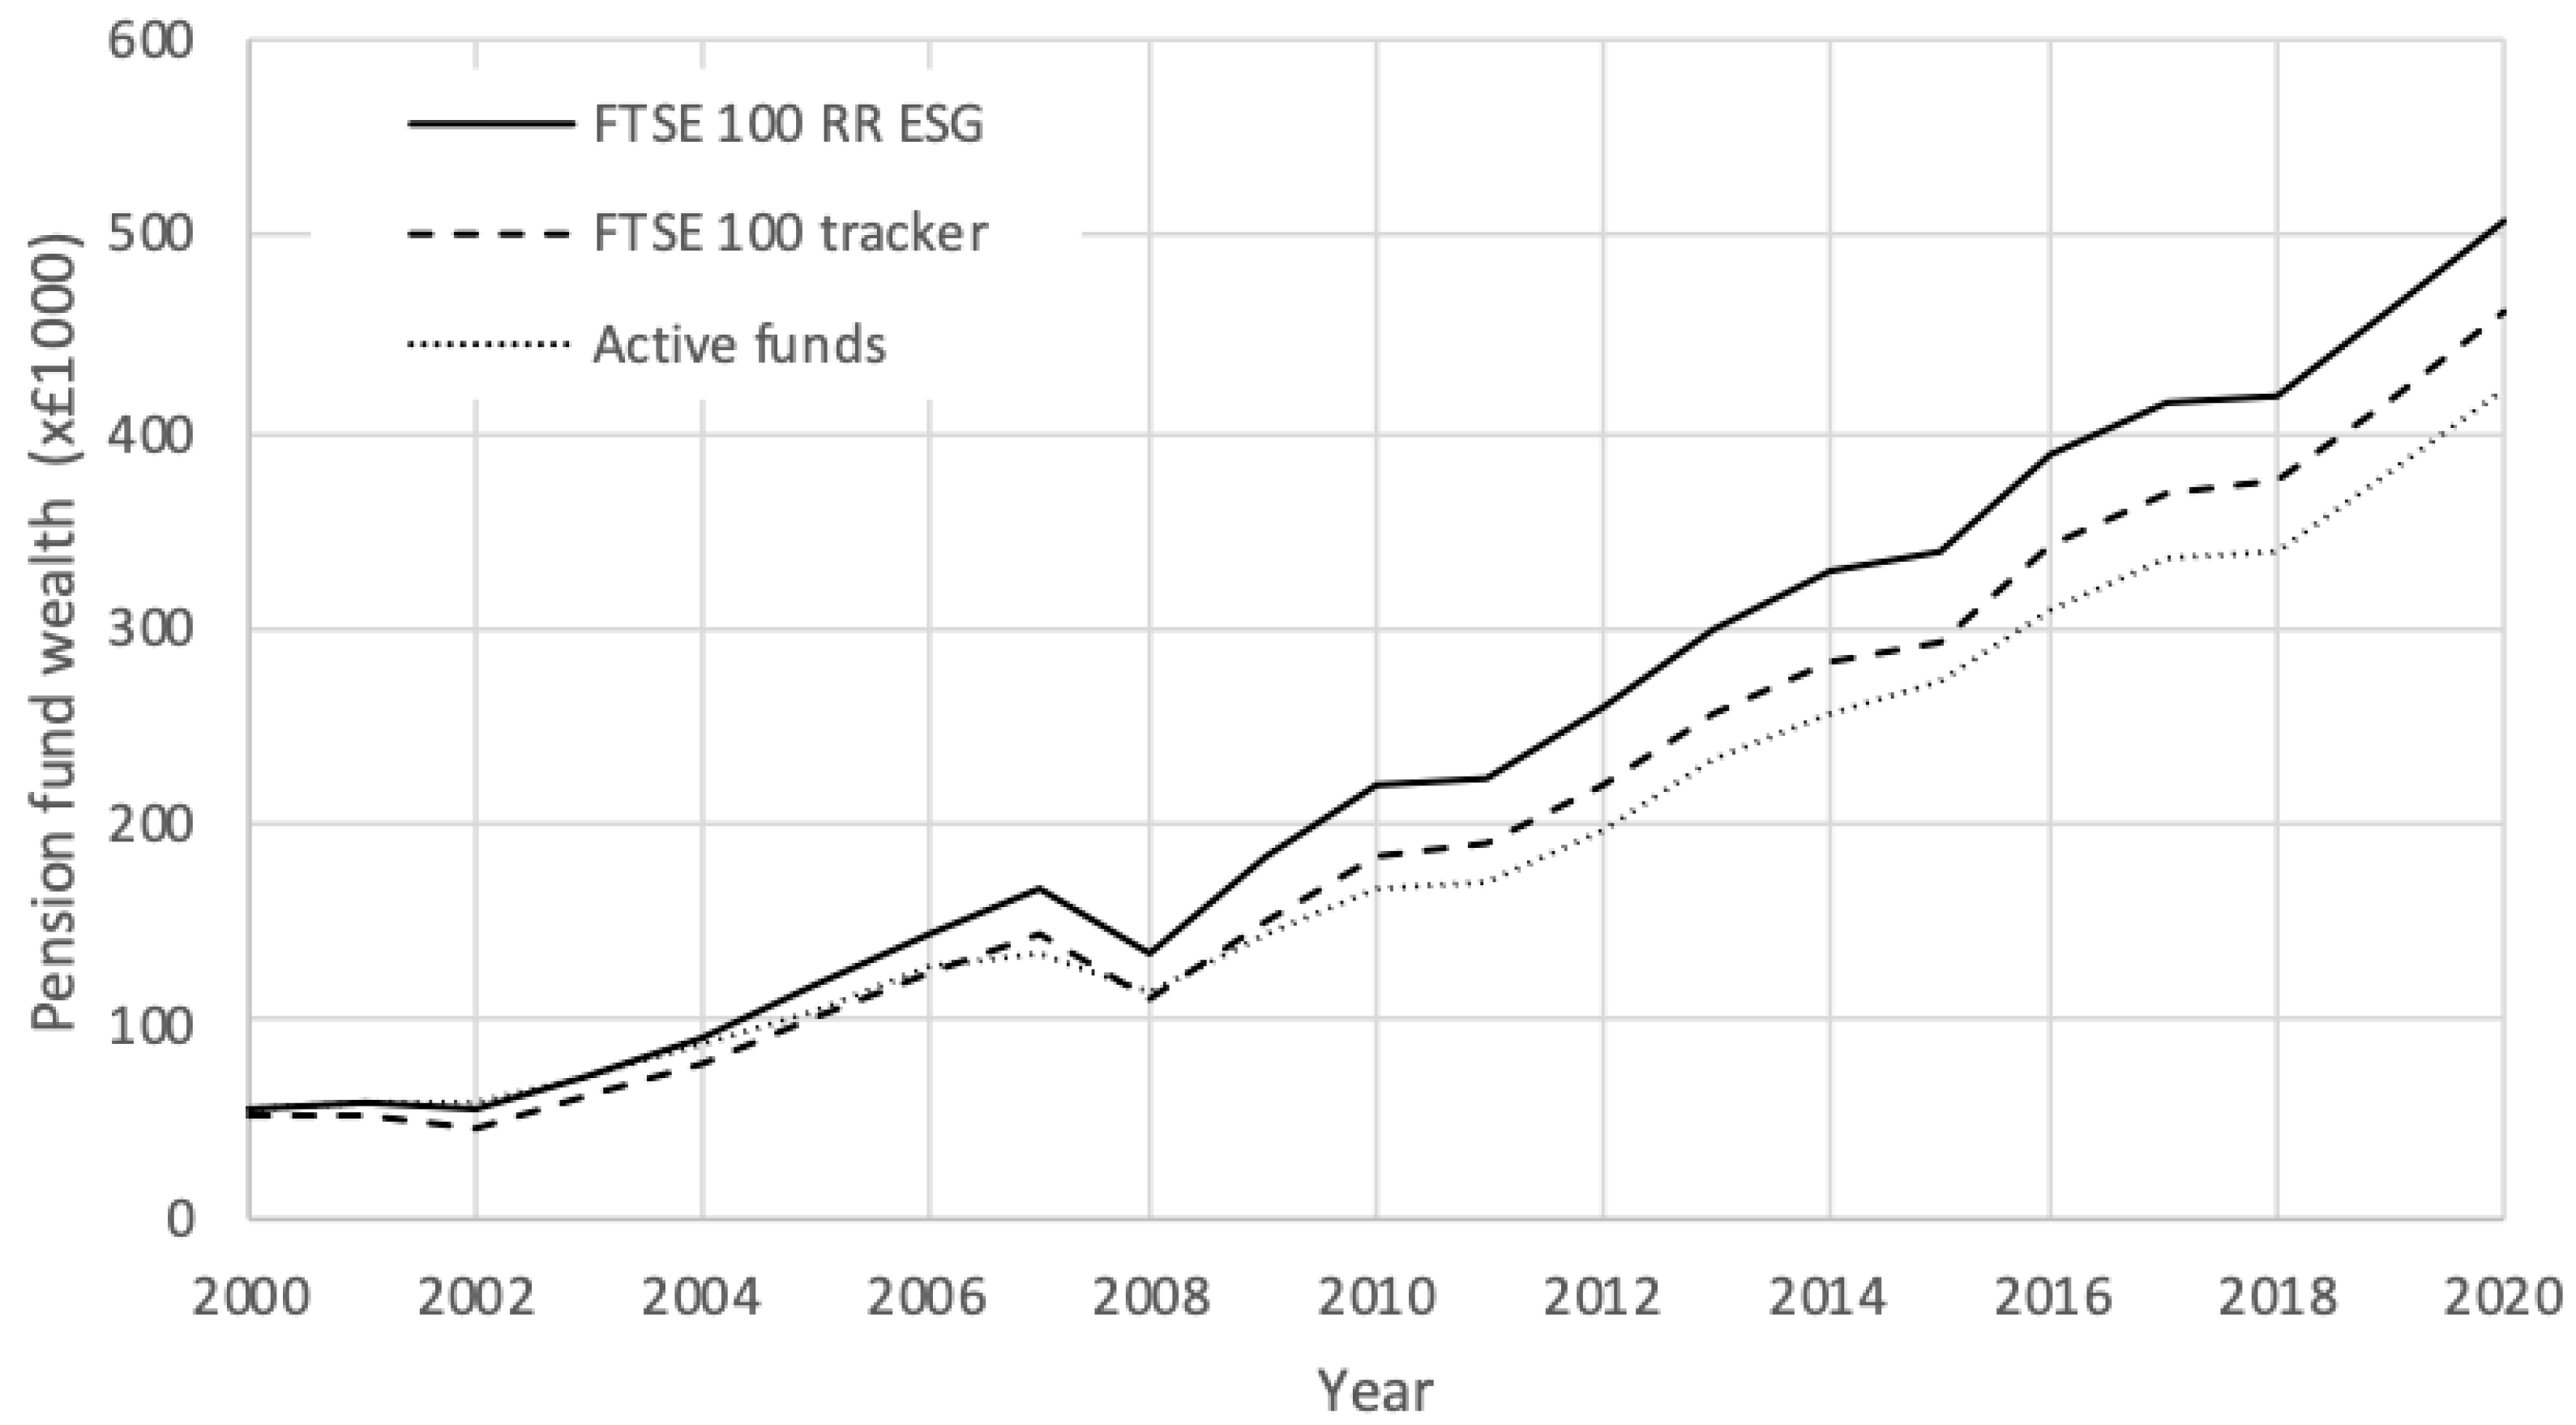
- “FTSE 100 tracker” involving an equity index tracker fund;
- “Active funds” involving actively managed sustainable funds;
- “FTSE 100 RR ESG” involving an equity index tracker with ESG overlay using the RepRisk ESG score.
- Data from the FTSE Russell company on the constituents of the FTSE 100 index, and their market capitalization, between 2000 and 2020. This is verified against the Datastream database.
- Total return data on individual stocks in the FTSE 100 between 2000 and 2020, from the Morningstar database and checked against the Datastream database.
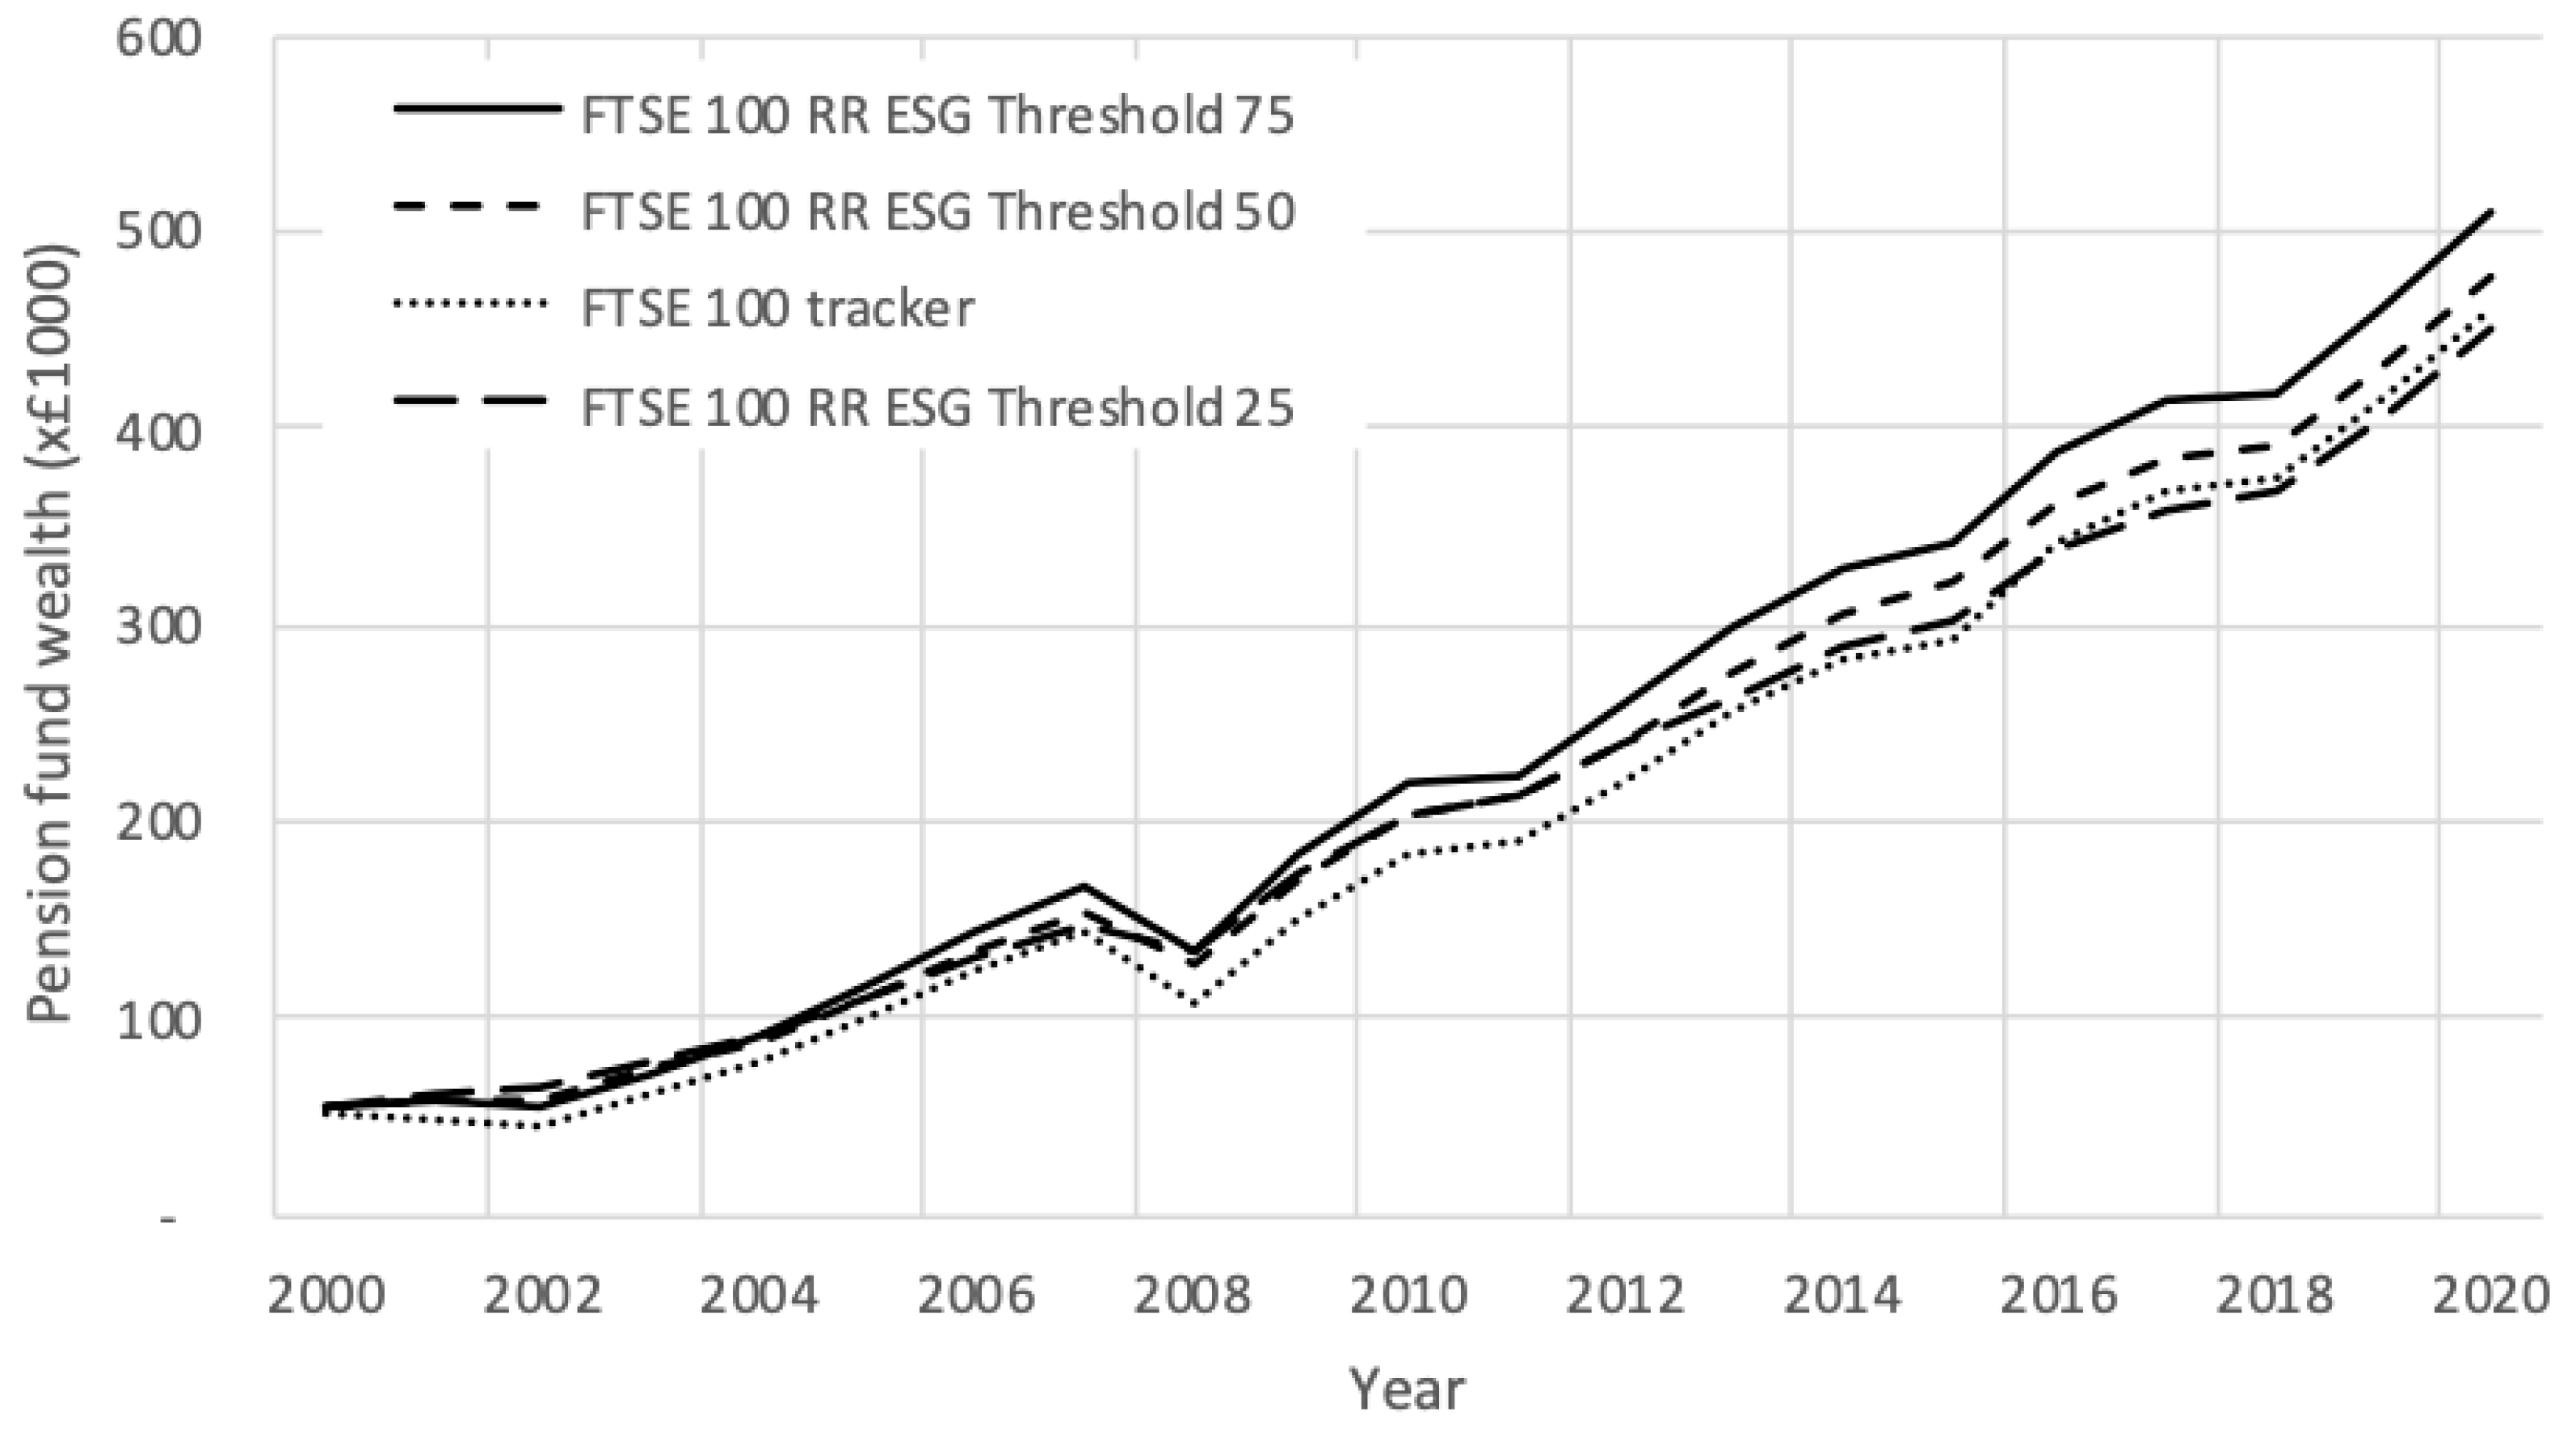
- Data on the RepRisk ESG score made available by RepRisk AG. This score is available for all companies in the FTSE 100. It ranges from 0 to 100: the lower the value, the more ESG-compliant the company is perceived to be. Stocks with an ESG score above 75 are screened out every year, but re-introduced if their score is at or below 75 the following year. Screening out stocks with an ESG score above 75, therefore, means that stocks which are the least sustainable are divested. The RepRisk ESG score starts from 2007, so we use the average scores in the period 2007–2020 for the pre-2007 period.
- Net returns on funds. On all funds and ETFs, we use the overall charge figure (OCF) quoted in the Key Investor Information Document (KIID) of the fund or ETF and as listed on the Morningstar database. The net return can be calculated from the total return using the OCF.
- Dealing charges. The charges levied by Hargreaves Lansdown in October 2020 are replicated in our study. Hargreaves Landsdown is one of the UK’s most popular provider of self-invested personal pension plans (SIPPs). A dealing charge of £11.95 is applied as a flat charge for every trade of stocks or ETFs irrespective of the amount or value of the trade. New money is available every year, through labor income, and the portfolio is rebalanced every year, so the dealing charge is payable on every stock or ETF that is traded. (We use total returns on stocks, i.e., returns inclusive of capital appreciation and dividend income, but we assume that dividends are reinvested annually although they are usually paid semi-annually. This means that there is no dealing charge mid-year for the reinvestment of dividends). There is no dealing charge related to the purchase or redemption of shares in open-end funds. Further, we assume zero entry and exit fees for these funds, as these are usually defrayed by the platform provider. (Large investment platforms in the U.S. and the UK typically negotiate bulk discounts with fund managers since they direct a large amount of wealth to these funds. Note that this means that there is no dealing charge in the “Active funds” strategy, irrespective of the number of funds in the investor’s portfolio).
- Platform management fee. Hargreaves Landsdown charges annual account (management) charges on self-invested personal pension plans as follows. First, on the value of all stocks, ETFs and bonds in the pension plan, it charges 0.45% p.a. on this value, capped at £200. Second, on the value invested in funds, it charges 0.45% p.a. on the first £250,000, then 0.25% p.a. on the next £750,000. We use the same charging structure in our model.
4.3. Results
5. Discussion of Results
5.1. Statistical Analysis
5.2. Portfolio Rebalancing Frequency and Full Annuitization
5.3. Market Downturns
5.4. Large-Cap Dominance and ESG Screening
5.5. Charges in the ESG-Screened Index-Tracking Strategy
6. Conclusions
Author Contributions
Funding
Data Availability Statement
Acknowledgments
Conflicts of Interest
Appendix A. Tables

| ESG Funds | Conventional Funds | ||||
|---|---|---|---|---|---|
| Fund | Fund Name | Inception Date | Fund | Fund Name | Inception Date |
| (1A) | Aberdeen Focused U.S. Equity Instl | June 2004 | (1B) | ICON Long/Short S | May 2004 |
| (2A) | Aberdeen U.S. Multi-Cap Equity C | March 2001 | (2B) | Nuveen Mid Cap Growth Opps R3 | December 2000 |
| (3A) | Aberdeen U.S. Small Cap Equity R | December 2003 | (3B) | Gabelli Growth A | December 2003 |
| (4A) | Alger Responsible Investing C | September 2008 | (4B) | BNY Mellon Large Cap Growth C | September 2008 |
| (5A) | AllianzGI Focused Growth P | July 2008 | (5B) | Emerald Growth Institutional | October 2008 |
| (6A) | American Century NT Disciplined Gr Inv | March 2015 | (6B) | Frontier MFG Global Plus Institutional | March 2015 |
| (7A) | American Century NT Heritage G | May 2006 | (7B) | American Century Focused Dynamic Gr Adv | May 2006 |
| (8A) | BMO Large-Cap Growth I | January 2008 | (8B) | Voya SmallCap Opportunities W | December 2007 |
| (9A) | Boston Common ESG Impact U.S. Equity | April 2012 | (9B) | Logan Capital Large Cap Grth Instl | June 2012 |
| (10A) | Brown Advisory Growth Equity Inv | June 1999 | (10B) | Wells Fargo Premier Large Co Gr Inst | June 1999 |
| (11A) | City National Rochdale U.S. Cor Eq Instl | December 2012 | (11B) | Columbia Acorn USA Adv | November 2012 |
| (12A) | ClearBridge Aggressive Growth R | December 2006 | (12B) | Voya Large Cap Growth Port A | December 2006 |
| (13A) | ClearBridge Mid Cap Growth A2 | December 2013 | (13B) | Segall Bryant & Hamill Small Cap Gr Ret | December 2013 |
| (14A) | ClearBridge Select FI | November 2012 | (14B) | Columbia Small Cap Growth I Adv | November 2012 |
| (15A) | ClearBridge Sustainability Leaders A | November 2015 | (15B) | Dana Small Cap Equity Institutional | November 2015 |
| (16A) | Columbia Large Cap Growth Opp A | December 1997 | (16B) | Lord Abbett Developing Growth I | December 1997 |
| (17A) | Driehaus Micro Cap Growth | November 2013 | (17B) | AB Core Opportunities Z | October 2013 |
| (18A) | DWS Capital Growth Institutional | August 2002 | (18B) | Wells Fargo Opportunity Admin | August 2002 |
| (19A) | DWS Large Cap Focus Growth C | December 2000 | (19B) | MassMutual Premier Disciplined Gr Svc | December 2000 |
| (20A) | Eventide Gilead N | July 2008 | (20B) | Invesco Mid Cap Growth R | July 2008 |
| (21A) | Green Century Equity Individual Investor | September 1995 | (21B) | LKCM Equity Instl | January 1996 |
| (22A) | Hartford Growth Opportunities HLS IB | May 2002 | (22B) | JHancock U.S. Global Leaders Growth B | May 2002 |
| (23A) | Hartford MidCap HLS IA | July 1997 | (23B) | Great-West T. Rowe Price Mid Cp Gr Inv | July 1997 |
| (24A) | Hartford Small Company A | July 1996 | (24B) | Thrivent Small Cap Stock A | July 1996 |
| (25A) | Highland Socially Responsible Equity A | December 1996 | (25B) | AMG Managers Cadence Mid Cap N | January 1997 |
| (26A) | Invesco Summit R5 | October 2008 | (26B) | Invesco Small Cap Growth Y | October 2008 |
| (27A) | Jensen Quality Growth I | July 2003 | (27B) | American Century Growth R | August 2003 |
| (28A) | JPMorgan Intrepid Growth A | February 2005 | (28B) | AB Growth I | March 2005 |
| (29A) | JPMorgan Tax Aware Equity A | March 2011 | (29B) | PGIM Jennison 20/20 Focus R6 | March 2011 |
| (30A) | MainStay Large Cap Growth B | April 2005 | (30B) | Invesco American Franchise A | June 2005 |
| (31A) | MFS Blended Research Growth Eq A | September 2015 | (31B) | Leland Thomson Reuters Vntr Cptl Idx C | September 2015 |
| (32A) | MFS New Discovery A | January 1997 | (32B) | Hennessy Focus Investor | January 1997 |
| (33A) | Morgan Stanley Inst Advantage IS | September 2013 | (33B) | Nationwide Geneva Mid Cap Gr R6 | September 2013 |
| (34A) | Morgan Stanley Inst Discovery A | January 1997 | (34B) | Wells Fargo Omega Growth Admin | January 1997 |
| (35A) | Nuveen Winslow Large-Cap Growth ESG A | May 2009 | (35B) | Voya Russell Mid Cap Growth Idx Port I | May 2009 |
| (36A) | Praxis Growth Index A | May 2007 | (36B) | Victory RS Growth Y | May 2007 |
| (37A) | Quaker Impact Growth I | July 2000 | (37B) | Victory RS Small Cap Equity C | August 2000 |
| (38A) | RBC Small Cap Core A | April 2004 | (38B) | RMB C | April 2004 |
| (39A) | RBC SMID Cap Growth A | June 1994 | (39B) | Sit Small Cap Growth | July 1994 |
| (40A) | Tarkio | June 2011 | (40B) | JHancock Fundamental All Cap Core A | June 2011 |
| (41A) | Timothy Plan Aggressive Growth A | October 2000 | (41B) | Sparrow Growth No-Load | November 2000 |
| (42A) | Timothy Plan Large/Mid Cap Growth C | February 2004 | (42B) | Rydex S&P 500 Pure Growth C | February 2004 |
| (43A) | Trillium ESG Small/Mid Cap Inst | August 2015 | (43B) | Goldman Sachs Flexible Cap R6 | July 2015 |
| (44A) | Zevenbergen Genea Institutional | August 2015 | (44B) | Loomis Sayles Small/Mid Cap Growth Instl | June 2015 |
| ESG Funds | Conventional Funds | ||||
|---|---|---|---|---|---|
| Fund | Fund Name | Inception Date | Fund | Fund Name | Inception Date |
| (1A) | AAF-Hermes European Equities A € | April 2013 | (1B) | DPAM Capital B Equities EMU Index P Cap | March 2013 |
| (2A) | AIS Mandarine Active I | September 2005 | (2B) | HSBC GIF Euroland Growth M1D | July 2005 |
| (3A) | ALM Actions Zone Euro ISR IC | May 2002 | (3B) | BGF Euro-Markets C2 | July 2002 |
| (4A) | ASR Euro Aandelen Fonds | July 2010 | (4B) | LAM-EURO-SMALL CAPS-UNIVERSAL | June 2010 |
| (5A) | Aviva Actions Euro ISR A/I | May 1998 | (5B) | C+F Euro Equities Acc | June 1998 |
| (6A) | AXAWF Fram Human Capital A Cap EUR | October 2007 | (6B) | DPAM Capital B Equities EMU Index F Cap | December 2007 |
| (7A) | Belfius Equities Europe S&M Caps C Cap | September 1998 | (7B) | Vendôme Sélection Euro PC | November 1998 |
| (8A) | BL-Equities Europe A EUR | December 2011 | (8B) | BGF European Special Situations X2 | December 2011 |
| (9A) | BL-European Smaller Companies A EUR | November 2012 | (9B) | Quaero Capital Argonaut B-EUR | December 2012 |
| (10A) | BNP Paribas Euro Valeurs Durables C C | April 1998 | (10B) | SG Actions Euro Small Cap IC | May 1998 |
| (11A) | BNPP Multigestion ISR Actions Euro C | April 2015 | (11B) | Indosuez Euro Expansion G | March 2015 |
| (12A) | Candriam Business Equities EMU C Dis EUR | November 1997 | (12B) | Bankia Euro Top Ideas Universal FI | August 1997 |
| (13A) | CB European Quality Fund A | June 2000 | (13B) | Invesco Pan European Sm Cp Eq E EUR Acc | August 2000 |
| (14A) | Covéa Actions Croissance C | June 1998 | (14B) | UniEuropa Mid&Small Caps | September 1998 |
| (15A) | Echiquier Positive Impact Europe A | March 2010 | (15B) | Allianz Best Styles Euroland Eq A EUR | May 2010 |
| (16A) | Epargne Ethique Actions C | January 2000 | (16B) | New Millennium Euro Equities A | November 1999 |
| (17A) | Expert Euro ISR I | September 2013 | (17B) | BPI GIF BPI Euro Large Caps I | August 2013 |
| (18A) | Federal Optimal Plus ESG I | May 2006 | (18B) | IVI Umbrella IVI European EUR | February 2006 |
| (19A) | Fédéris Pro Actions ISR Euro MH A/I | May 2013 | (19B) | RAM (Lux) Sys European Equities IP EUR | May 2013 |
| (20A) | Fidelity Sustainable Euroz Eq A-Acc-EUR | December 2005 | (20B) | LBPAM Actions Midcap E A/I | March 2006 |
| (21A) | Hermes European Alpha Equity F EUR Acc | November 2012 | (21B) | BNP Paribas Best Sélection Euro C A/I | January 2013 |
| (22A) | HGA Actions ISR | January 2014 | (22B) | Ostrum Actions Small&Mid Cap Euro ID | December 2013 |
| (23A) | Impact ES Actions Europe I | July 2013 | (23B) | BNP Paribas Euro Equity C C | May 2013 |
| (24A) | Kempen (Lux) Sustainable Eurp Sm-Cp A | April 2015 | (24B) | JPM Euroland Dynamic A perf (dist) EUR | May 2015 |
| (25A) | Lazard Equity SRI C | June 2001 | (25B) | Esperia Fds SICAV Duemme Euro Eqs C Cap | September 2001 |
| (26A) | LFR Euro Développement Durable GP | March 2008 | (26B) | Eurizon Equity Euro LTE Z Acc | January 2008 |
| (27A) | LUX IM ESG Generali Invmts Euro Eqs DX | October 2014 | (27B) | HSBC Euro PME IC | December 2014 |
| (28A) | M&G Pan Eurp Sel Smllr Coms Euro A Acc | November 2001 | (28B) | Sextant PEA A | January 2002 |
| (29A) | Macif Croiss Dur et Solid Macif C | April 2002 | (29B) | CD Euro Capital C | June 2002 |
| (30A) | MAM Human Values C | July 1998 | (30B) | Eurovalor Bolsa Europea FI | June 1998 |
| (31A) | Mandarine Active G | December 2012 | (31B) | HANSAsmart Select E I | October 2012 |
| (32A) | Mirova Euro Sustainable Equity I/D EUR | July 2013 | (32B) | Allianz Europe Equity Gr Sel A EUR | May 2013 |
| (33A) | NN (L) European Sust Eq I Cap EUR | April 2014 | (33B) | HSBC GIF Euroland Eq Smlr Coms XC | March 2014 |
| (34A) | Nordea 1—European Sm&Mid Cp Eq AP EUR | March 2009 | (34B) | Lazard Small Caps Euro R A/I | June 2009 |
| (35A) | Oddo BHF Avenir Euro CI-EUR | December 1998 | (35B) | UniDynamicFonds: Europa -net- A | April 1999 |
| (36A) | Ofi RS European Growth Climate Chng I | March 1997 | (36B) | AXA Indice Euro C | January 1997 |
| (37A) | Pramerica Azionario Etico | September 2005 | (37B) | WSS-Europa T | September 2005 |
| (38A) | Promepar Actions Rendement I A/I | December 2012 | (38B) | Moorea Fd Selection Europe RE | January 2013 |
| (39A) | RAM (LUX)—Ethik Quant Strategiefds P | July 2013 | (39B) | Calamatta Cuschieri Euro Equity A | October 2013 |
| (40A) | R-co 4Change Human Values C EUR | February 2015 | (40B) | Diversification CALM Eurozone Eq €A Inc | May 2015 |
| (41A) | Roche-Brune Europe Actions I | February 2014 | (41B) | SG Actions Euro PME C | January 2014 |
| (42A) | Schroder ISF EURO Equity A1 Acc EUR | August 2001 | (42B) | Amundi Fds Euroland Equity F EUR C | October 2001 |
| (43A) | Seeyond Equity Factor Investing Euro IC | December 2014 | (43B) | CS (Lux) Eurozone Active Opps Eq UB EUR | February 2015 |
| ESG Funds | Conventional Funds | ||||
|---|---|---|---|---|---|
| Fund | Fund Name | Fund Size ($m) | Fund | Fund Name | Fund Size ($m) |
| (1A) | Aberdeen Focused U.S. Equity Instl | 21.26 | (1B) | ICON Long/Short S | 21.81 |
| (2A) | Aberdeen U.S. Multi-Cap Equity C | 411.96 | (2B) | Nuveen Mid Cap Growth Opps R3 | 388.18 |
| (3A) | Aberdeen U.S. Small Cap Equity R | 866.43 | (3B) | Gabelli Growth A | 814.79 |
| (4A) | Alger Responsible Investing C | 70.73 | (4B) | BNY Mellon Large Cap Growth C | 79.61 |
| (5A) | AllianzGI Focused Growth P | 1118.68 | (5B) | Emerald Growth Institutional | 1383.77 |
| (6A) | American Century NT Disciplined Gr Inv | 407.33 | (6B) | Frontier MFG Global Plus Institutional | 490.79 |
| (7A) | American Century NT Heritage G | 602.30 | (7B) | American Century Focused Dynamic Gr Adv | 607.69 |
| (8A) | BMO Large-Cap Growth I | 508.54 | (8B) | Voya SmallCap Opportunities W | 474.25 |
| (9A) | Boston Common ESG Impact U.S. Equity | 44.82 | (9B) | Logan Capital Large Cap Grth Instl | 41.38 |
| (10A) | Brown Advisory Growth Equity Inv | 2829.72 | (10B) | Wells Fargo Premier Large Co Gr Inst | 2936.27 |
| (11A) | City National Rochdale U.S. Cor Eq Instl | 356.55 | (11B) | Columbia Acorn USA Adv | 312.84 |
| (12A) | ClearBridge Aggressive Growth R | 7440.45 | (12B) | Voya Large Cap Growth Port A | 6227.79 |
| (13A) | ClearBridge Mid Cap Growth A2 | 95.34 | (13B) | Segall Bryant & Hamill Small Cap Gr Ret | 80.61 |
| (14A) | ClearBridge Select FI | 898.85 | (14B) | Columbia Small Cap Growth I Adv | 972.62 |
| (15A) | ClearBridge Sustainability Leaders A | 15.11 | (15B) | Dana Small Cap Equity Institutional | 15.40 |
| (16A) | Columbia Large Cap Growth Opp A | 1641.85 | (16B) | Lord Abbett Developing Growth I | 1979.71 |
| (17A) | Driehaus Micro Cap Growth | 282.41 | (17B) | AB Core Opportunities Z | 275.71 |
| (18A) | DWS Capital Growth Institutional | 1798.65 | (18B) | Wells Fargo Opportunity Admin | 1840.33 |
| (19A) | DWS Large Cap Focus Growth C | 289.46 | (19B) | MassMutual Premier Disciplined Gr Svc | 273.48 |
| (20A) | Eventide Gilead N | 2762.53 | (20B) | Invesco Mid Cap Growth R | 3230.18 |
| (21A) | Green Century Equity Individual Investor | 354.54 | (21B) | LKCM Equity Instl | 395.23 |
| (22A) | Hartford Growth Opportunities HLS IB | 1729.44 | (22B) | JHancock U.S. Global Leaders Growth B | 1776.42 |
| (23A) | Hartford MidCap HLS IA | 2160.72 | (23B) | Great-West T. Rowe Price Mid Cp Gr Inv | 2044.17 |
| (24A) | Hartford Small Company A | 676.93 | (24B) | Thrivent Small Cap Stock A | 711.91 |
| (25A) | Highland Socially Responsible Equity A | 80.30 | (25B) | AMG Managers Cadence Mid Cap N | 96.75 |
| (26A) | Invesco Summit R5 | 2791.18 | (26B) | Invesco Small Cap Growth Y | 2749.78 |
| (27A) | Jensen Quality Growth I | 8676.86 | (27B) | American Century Growth R | 8913.22 |
| (28A) | JPMorgan Intrepid Growth A | 1219.69 | (28B) | AB Growth I | 1292.56 |
| (29A) | JPMorgan Tax Aware Equity A | 1288.26 | (29B) | PGIM Jennison 20/20 Focus R6 | 1032.40 |
| (30A) | MainStay Large Cap Growth B | 12,929.89 | (30B) | Invesco American Franchise A | 12,278.41 |
| (31A) | MFS Blended Research Growth Eq A | 222.82 | (31B) | Leland Thomson Reuters Vntr Cptl Idx C | 186.16 |
| (32A) | MFS New Discovery A | 1731.46 | (32B) | Hennessy Focus Investor | 1761.43 |
| (33A) | Morgan Stanley Inst Advantage IS | 498.52 | (33B) | Nationwide Geneva Mid Cap Gr R6 | 610.06 |
| (34A) | Morgan Stanley Inst Discovery A | 963.12 | (34B) | Wells Fargo Omega Growth Admin | 907.48 |
| (35A) | Nuveen Winslow Large-Cap Growth ESG A | 762.75 | (35B) | Voya Russell Mid Cap Growth Idx Port I | 629.19 |
| (36A) | Praxis Growth Index A | 350.87 | (36B) | Victory RS Growth Y | 278.04 |
| (37A) | Quaker Impact Growth I | 65.67 | (37B) | Victory RS Small Cap Equity C | 73.35 |
| (38A) | RBC Small Cap Core A | 141.64 | (38B) | RMB C | 115.58 |
| (39A) | RBC SMID Cap Growth A | 105.43 | (39B) | Sit Small Cap Growth | 106.61 |
| (40A) | Tarkio | 110.16 | (40B) | JHancock Fundamental All Cap Core A | 93.93 |
| (41A) | Timothy Plan Aggressive Growth A | 26.81 | (41B) | Sparrow Growth No-Load | 26.71 |
| (42A) | Timothy Plan Large/Mid Cap Growth C | 98.85 | (42B) | Rydex S&P 500 Pure Growth C | 85.05 |
| (43A) | Trillium ESG Small/Mid Cap Inst | 22.08 | (43B) | Goldman Sachs Flexible Cap R6 | 21.68 |
| (44A) | Zevenbergen Genea Institutional | 44.26 | (44B) | Loomis Sayles Small/Mid Cap Growth Instl | 44.63 |
| ESG Funds | Conventional Funds | ||||
|---|---|---|---|---|---|
| Fund | Fund Name | Fund Size (€m) | Fund | Fund Name | Fund Size (€m) |
| (1A) | AAF-Hermes European Equities A € | 250.58 | (1B) | DPAM Capital B Equities EMU Index P Cap | 217.06 |
| (2A) | AIS Mandarine Active I | 234.91 | (2B) | HSBC GIF Euroland Growth M1D | 235.96 |
| (3A) | ALM Actions Zone Euro ISR IC | 2095.22 | (3B) | BGF Euro-Markets C2 | 1904.47 |
| (4A) | ASR Euro Aandelen Fonds | 20.98 | (4B) | LAM-EURO-SMALL CAPS-UNIVERSAL | 18.71 |
| (5A) | Aviva Actions Euro ISR A/I | 249.50 | (5B) | C+F Euro Equities Acc | 281.73 |
| (6A) | AXAWF Fram Human Capital A Cap EUR | 235.51 | (6B) | DPAM Capital B Equities EMU Index F Cap | 217.06 |
| (7A) | Belfius Equities Europe S&M Caps C Cap | 214.53 | (7B) | Vendôme Sélection Euro PC | 210.52 |
| (8A) | BL-Equities Europe A EUR | 1389.90 | (8B) | BGF European Special Situations X2 | 1328.85 |
| (9A) | BL-European Smaller Companies A EUR | 213.11 | (9B) | Quaero Capital Argonaut B-EUR | 232.79 |
| (10A) | BNP Paribas Euro Valeurs Durables C C | 73.58 | (10B) | SG Actions Euro Small Cap IC | 87.27 |
| (11A) | BNPP Multigestion ISR Actions Euro C | 116.01 | (11B) | Indosuez Euro Expansion G | 130.22 |
| (12A) | Candriam Business Equities EMU C Dis EUR | 102.50 | (12B) | Bankia Euro Top Ideas Universal FI | 92.63 |
| (13A) | CB European Quality Fund A | 82.81 | (13B) | Invesco Pan European Sm Cp Eq E EUR Acc | 77.64 |
| (14A) | Covéa Actions Croissance C | 249.10 | (14B) | UniEuropa Mid&Small Caps | 259.80 |
| (15A) | Echiquier Positive Impact Europe A | 177.28 | (15B) | Allianz Best Styles Euroland Eq A EUR | 190.87 |
| (16A) | Epargne Ethique Actions C | 36.11 | (16B) | New Millennium Euro Equities A | 33.02 |
| (17A) | Expert Euro ISR I | 11.96 | (17B) | BPI GIF BPI Euro Large Caps I | 12.94 |
| (18A) | Federal Optimal Plus ESG I | 487.30 | (18B) | IVI Umbrella IVI European EUR | 496.25 |
| (19A) | Fédéris Pro Actions ISR Euro MH A/I | 351.81 | (19B) | RAM (Lux) Sys European Equities IP EUR | 357.70 |
| (20A) | Fidelity Sustainable Euroz Eq A-Acc-EUR | 285.33 | (20B) | LBPAM Actions Midcap E A/I | 245.34 |
| (21A) | Hermes European Alpha Equity F EUR Acc | 155.91 | (21B) | BNP Paribas Best Sélection Euro C A/I | 131.54 |
| (22A) | HGA Actions ISR | 301.36 | (22B) | Ostrum Actions Small&Mid Cap Euro ID | 317.49 |
| (23A) | Impact ES Actions Europe I | 1735.73 | (23B) | BNP Paribas Euro Equity C C | 1596.13 |
| (24A) | Kempen (Lux) Sustainable Eurp Sm-Cp A | 250.98 | (24B) | JPM Euroland Dynamic A perf (dist) EUR | 249.58 |
| (25A) | Lazard Equity SRI C | 208.10 | (25B) | Esperia Fds SICAV Duemme Euro Eqs C Cap | 200.60 |
| (26A) | LFR Euro Développement Durable GP | 105.07 | (26B) | Eurizon Equity Euro LTE Z Acc | 122.63 |
| (27A) | LUX IM ESG Generali Invmts Euro Eqs DX | 118.11 | (27B) | HSBC Euro PME IC | 124.72 |
| (28A) | M&G Pan Eurp Sel Smllr Coms Euro A Acc | 209.47 | (28B) | Sextant PEA A | 224.25 |
| (29A) | Macif Croiss Dur et Solid Macif C | 30.29 | (29B) | CD Euro Capital C | 26.01 |
| (30A) | MAM Human Values C | 40.32 | (30B) | Eurovalor Bolsa Europea FI | 40.71 |
| (31A) | Mandarine Active G | 244.93 | (31B) | HANSAsmart Select E I | 258.79 |
| (32A) | Mirova Euro Sustainable Equity I/D EUR | 789.57 | (32B) | Allianz Europe Equity Gr Sel A EUR | 762.72 |
| (33A) | NN (L) European Sust Eq I Cap EUR | 430.81 | (33B) | HSBC GIF Euroland Eq Smlr Coms XC | 427.88 |
| (34A) | Nordea 1—European Sm&Mid Cp Eq AP EUR | 601.52 | (34B) | Lazard Small Caps Euro R A/I | 600.95 |
| (35A) | Oddo BHF Avenir Euro CI-EUR | 556.01 | (35B) | UniDynamicFonds: Europa -net- A | 497.52 |
| (36A) | Ofi RS European Growth Climate Chng I | 195.80 | (36B) | AXA Indice Euro C | 206.53 |
| (37A) | Pramerica Azionario Etico | 25.97 | (37B) | WSS-Europa T | 25.25 |
| (38A) | Promepar Actions Rendement I A/I | 67.15 | (38B) | Moorea Fd Selection Europe RE | 58.62 |
| (39A) | RAM (LUX)—Ethik Quant Strategiefds P | 7.98 | (39B) | Calamatta Cuschieri Euro Equity A | 6.62 |
| (40A) | R-co 4Change Human Values C EUR | 7.15 | (40B) | Diversification CALM Eurozone Eq €A Inc | 9.16 |
| (41A) | Roche-Brune Europe Actions I | 58.86 | (41B) | SG Actions Euro PME C | 56.61 |
| (42A) | Schroder ISF EURO Equity A1 Acc EUR | 3385.38 | (42B) | Amundi Fds Euroland Equity F EUR C | 3065.46 |
| (43A) | Seeyond Equity Factor Investing Euro IC | 24.56 | (43B) | CS (Lux) Eurozone Active Opps Eq UB EUR | 25.29 |
| US funds | European Funds | ||||||
|---|---|---|---|---|---|---|---|
| Pair Id | n | KS | Wilcoxon | Pair Id | n | KS | Wilcoxon |
| 1 | 187 | 0.0001 | 0.1636 | 1 | 81 | 0.2478 | 0.9212 |
| 2 | 226 | 0.6228 | 0.9271 | 2 | 172 | 0.9726 | 0.2773 |
| 3 | 193 | 0.6902 | 0.7771 | 3 | 210 | 0.9980 | 0.8153 |
| 4 | 136 | 0.9271 | 0.1483 | 4 | 115 | 0.9436 | 0.5200 |
| 5 | 135 | 0.6604 | 0.3996 | 5 | 253 | 0.4735 | 0.0165 |
| 6 | 58 | 0.9155 | 0.7864 | 6 | 145 | 0.6047 | 0.6371 |
| 7 | 164 | 0.7723 | 0.2241 | 7 | 253 | 0.4079 | 0.0929 |
| 8 | 144 | 0.7948 | 0.9245 | 8 | 97 | 0.3484 | 0.8011 |
| 9 | 91 | 0.2325 | 0.0062 | 9 | 85 | 0.4773 | 0.2620 |
| 10 | 247 | 0.8836 | 0.2292 | 10 | 253 | 0.4079 | 0.0074 |
| 11 | 85 | 0.1991 | 0.0161 | 11 | 57 | 0.9824 | 0.2870 |
| 12 | 157 | 0.4707 | 0.4012 | 12 | 253 | 0.7655 | 0.9849 |
| 13 | 73 | 0.3807 | 0.5825 | 13 | 233 | 0.3003 | 0.9938 |
| 14 | 86 | 0.8537 | 0.0352 | 14 | 253 | 0.1382 | 0.5451 |
| 15 | 50 | 0.3959 | 0.0239 | 15 | 116 | 0.2198 | 0.1439 |
| 16 | 265 | 0.2272 | 0.6241 | 16 | 239 | 0.8713 | 0.0582 |
| 17 | 74 | 0.0247 | 0.4540 | 17 | 76 | 0.7973 | 0.2150 |
| 18 | 209 | 0.8136 | 0.7831 | 18 | 164 | 0.5886 | 0.0598 |
| 19 | 229 | 0.9944 | 0.4640 | 19 | 80 | 0.6953 | 0.0566 |
| 20 | 138 | 0.4765 | 0.0393 | 20 | 166 | 0.2832 | 0.4409 |
| 21 | 287 | 0.6250 | 0.9765 | 21 | 84 | 0.8438 | 0.8322 |
| 22 | 212 | 0.0824 | 0.0632 | 22 | 70 | 0.8787 | 0.0411 |
| 23 | 270 | 0.8610 | 0.0602 | 23 | 78 | 0.9766 | 0.1214 |
| 24 | 282 | 0.3054 | 0.3962 | 24 | 56 | 0.9807 | 0.8162 |
| 25 | 276 | 0.4634 | 0.6029 | 25 | 217 | 0.7572 | 0.0538 |
| 26 | 135 | 0.4623 | 0.5437 | 26 | 142 | 0.2040 | 0.2533 |
| 27 | 197 | 0.2620 | 0.4413 | 27 | 61 | 0.2760 | 0.1571 |
| 28 | 178 | 0.9415 | 0.4694 | 28 | 216 | 0.5153 | 0.1402 |
| 29 | 106 | 0.8394 | 0.1445 | 29 | 204 | 0.2299 | 0.2056 |
| 30 | 175 | 0.4574 | 0.8110 | 30 | 253 | 0.9384 | 0.8268 |
| 31 | 52 | 0.0264 | 0.1649 | 31 | 84 | 0.8438 | 0.4260 |
| 32 | 276 | 0.0489 | 0.2328 | 32 | 67 | 0.8617 | 0.8734 |
| 33 | 76 | 0.9039 | 0.0099 | 33 | 69 | 0.8733 | 0.8670 |
| 34 | 276 | 0.2477 | 0.7162 | 34 | 127 | 0.4232 | 0.9568 |
| 35 | 128 | 0.8296 | 0.4403 | 35 | 169 | 0.6994 | 0.0256 |
| 36 | 152 | 0.7307 | 0.0687 | 36 | 253 | 0.3481 | 0.7102 |
| 37 | 233 | 0.0187 | 0.9876 | 37 | 172 | 0.0107 | 0.3814 |
| 38 | 189 | 0.1938 | 0.8245 | 38 | 84 | 0.7238 | 0.4106 |
| 39 | 306 | 0.3530 | 0.4677 | 39 | 75 | 0.0162 | 0.2464 |
| 40 | 103 | 0.7167 | 0.8397 | 40 | 56 | 0.3361 | 0.0721 |
| 41 | 230 | 0.7877 | 0.6653 | 41 | 71 | 0.7621 | 0.0284 |
| 42 | 191 | 0.7682 | 0.0302 | 42 | 219 | 0.8974 | 0.5880 |
| 43 | 53 | 0.9724 | 0.4955 | 43 | 59 | 0.9854 | 0.2200 |
| 44 | 53 | 0.2048 | 0.0582 | ||||
| Fund Name | Inception Date | Closure Date | OCF |
|---|---|---|---|
| Scottish Widows Ethical A | 29 June 1987 | 2.50% | |
| BMO Responsible UK Income 1 Acc | 13 October 1987 | 1.50% | |
| Jupiter Ecology | 31 March 1988 | 1.50% | |
| Kames Ethical Equity GBP A Acc | 17 April 1989 | 1.50% | |
| Sovereign Ethical | 27 November 1989 | 30 October 2015 | |
| OMR Quilter Investors Ethical | 28 February 1992 | 0.76% | |
| Friends Provident Pkg Ethical | 26 November 1993 | 24 January 2001 | |
| Friends Provident Ord Ethical | 26 November 1993 | 24 January 2001 | |
| Capita Finl Berkeley Scly Resp | 03 January 1994 | 23 March 2004 | |
| Elas Ethical DP Life | 23 February 1994 | 26 July 2016 | |
| Elas Ethical DP Pension | 23 February 1994 | 26 July 2016 | |
| Halifax Ethical Fund A | 23 February 1994 | 11 April 2011 | |
| Janus Henderson UK Responsible A Inc | 15 May 1995 | 1.50% | |
| CIM UT. Mgrs Co-op | 19 May 1995 | 20 July 2001 | |
| AP/Premier Ethical EP Pen | 30 April 1996 | 1.10% | |
| F&C UK Ethical SC2 | 11 October 1996 | 13 July 2009 | |
| Merchant Inv Asr Ethical | 12 December 1997 | 27 May 2005 | |
| Old Mutual Ethical A | 16 April 1998 | 30 April 2010 | |
| Stan Life Ethical 1 Pen | 30 June 1998 | 0.63% | |
| SE Socially Responsible Eq Pen | 01 September 1998 | 1.50% | |
| Aegon UK Scly Resp A | 08 September 1998 | 31 January 2003 | |
| Aegon UK Scly Resp B | 08 September 1998 | 22 January 2003 | |
| Family Charities Ethical Tr Acc | 31 March 1999 | 1.50% | |
| Prudential Ethical A | 06 April 1999 | 07 June 2012 | |
| Aviva LT UK Ethical NU Pen | 10 May 1999 | 0.45% | |
| ASI Global Ethical Equity A Acc | 21 May 1999 | 1.45% | |
| L&G Ethical R | 05 July 1999 | 0.45% | |
| RLP Sustainable Leaders | 29 October 1999 | 1.00% | |
| Old Mutual Ethical | 03 December 1999 | 30 April 2010 | |
| Elas Ethical SP Pension | 08 March 2000 | 26 July 2016 | |
| Ethical AIM VCT | 29 March 2000 | 17 January 2008 | |
| CAF Scly Resp | 24 October 2000 | 31 October 2006 | |
| Standard 2 Ethical Pens. | 30 October 2000 | 27 June 2014 |
References
- GSIA. 2018 Global Sustainable Investment Review; Technical Report; Global Sustainable Investment Alliance: Brussels, Belgium, 2018. [Google Scholar]
- Eurosif. European SRI Study; Technical Report; European Sustainable Investment Forum: Brussels, Belgium, 2018. [Google Scholar]
- Cumbo, J. How Green Is Your Pension? Financial Times, 26 February 2021. [Google Scholar]
- Clark, G.; Monk, A. The Norwegian government pension fund: Ethics over efficiency. Rotman Int. J. Pension Manag. 2010, 3, 14–20. [Google Scholar] [CrossRef]
- OECD. Pension Fund Assets in the OECD Area Decline in 2018; Technical Report; OECD: Paris, France, 2019. [Google Scholar]
- Sparkes, R. Socially Responsible Investment: A Global Revolution; John Wiley & Sons: Hoboken, NJ, USA, 2002. [Google Scholar]
- Department for Work and Pensions. The Pension Protection Fund (Pensionable Service) and Occupational Pension Schemes (Investment and Disclosure) (Amendment and Modification) Regulations 2018; Technical Report SI 2018 No. 988; Department for Work and Pensions: London, UK, 2018.
- Webb, S.; Brown, S. Pensions and ESG: The Evolving Legal and Regulatory Landscape; Technical Report; Royal: London, UK, 2019. [Google Scholar]
- Mueller, S.A. The opportunity cost of discipleship: Ethical mutual funds and their returns. Sociol. Anal. 1991, 52, 111–124. [Google Scholar] [CrossRef]
- Luther, R.; Matatko, J.; Corner, D. The investment performance of UK “ethical” unit trusts. Account. Audit. Account. J. 1992, 5, 57–70. [Google Scholar] [CrossRef]
- Luther, R.; Matatko, J. The performance of ethical unit trusts: Choosing an appropriate benchmark. Br. Account. Rev. 1994, 26, 77–89. [Google Scholar] [CrossRef]
- Mallin, C.; Saadouni, B.; Briston, R. The financial performance of ethical investment funds. J. Bus. Financ. Account. 1995, 22, 483–496. [Google Scholar] [CrossRef]
- Gregory, A.; Matatko, J.; Luther, R. Ethical unit trust financial performance: Small company effects and fund size effects. J. Bus. Financ. Account. 1997, 24, 705–724. [Google Scholar] [CrossRef]
- Kreander, N.; Gray, R.H.; Power, D.M.; Sinclair, C.D. Evaluating the performance of ethical and non-ethical funds: A matched pair analysis. J. Bus. Financ. Account. 2005, 32, 1465–1493. [Google Scholar] [CrossRef]
- Bauer, R.; Koedijk, K.; Otten, R. International evidence on ethical mutual fund performance and investment style. J. Bank. Financ. 2005, 29, 1751–1767. [Google Scholar] [CrossRef]
- Bauer, R.; Derwall, J.; Otten, R. The ethical mutual fund performance debate: New evidence from Canada. J. Bus. Ethics 2007, 70, 111–124. [Google Scholar] [CrossRef]
- Fernandez-Izquierdo, A.; Matallin-Saez, J.C. Performance of ethical mutual funds in Spain: Sacrifice or premium? J. Bus. Ethics 2008, 81, 247–260. [Google Scholar] [CrossRef]
- Rahman, S.; Lee, C.F.; Xiao, Y. The investment performance, attributes, and investment behavior of ethical equity mutual funds in the US: An empirical investigation. Rev. Quant. Financ. Account. 2017, 49, 91–116. [Google Scholar] [CrossRef]
- Statman, M. Socially responsible mutual funds (corrected). Financ. Anal. J. 2000, 56, 30–39. [Google Scholar] [CrossRef]
- Jones, S.; Van der Laan, S.; Frost, G.; Loftus, J. The investment performance of socially responsible investment funds in Australia. J. Bus. Ethics 2008, 80, 181–203. [Google Scholar] [CrossRef]
- Cortez, M.C.; Silva, F.; Areal, N. The performance of European socially responsible funds. J. Bus. Ethics 2009, 87, 573–588. [Google Scholar] [CrossRef]
- Kempf, A.; Osthoff, P. The effect of socially responsible investing on portfolio performance. Eur. Financ. Manag. 2007, 13, 908–922. [Google Scholar] [CrossRef]
- Brzeszczyński, J.; McIntosh, G. Performance of portfolios composed of British SRI stocks. J. Bus. Ethics 2014, 120, 335–362. [Google Scholar] [CrossRef]
- Hill, R.P.; Ainscough, T.; Shank, T.; Manullang, D. Corporate social responsibility and socially responsible investing: A global perspective. J. Bus. Ethics 2007, 70, 165–174. [Google Scholar] [CrossRef]
- Capelle-Blancard, G.; Monjon, S. The performance of socially responsible funds: Does the screening process matter? Eur. Financ. Manag. 2014, 20, 494–520. [Google Scholar] [CrossRef]
- Nofsinger, J.; Varma, A. Socially responsible funds and market crises. J. Bank. Financ. 2014, 48, 180–193. [Google Scholar] [CrossRef]
- Wu, J.; Lodorfos, G.; Dean, A.; Gioulmpaxiotis, G. The market performance of socially responsible investment during periods of the economic cycle—Illustrated using the case of FTSE. Manag. Decis. Econ. 2017, 38, 238–251. [Google Scholar] [CrossRef]
- Arefeen, S.; Shimada, K. Performance and resilience of socially responsible investing (SRI) and conventional funds during different shocks in 2016: Evidence from Japan. Sustainability 2020, 12, 540. [Google Scholar] [CrossRef]
- Miralles-Quirós, M.; Miralles-Quirós, J.L. Improving diversification opportunities for socially responsible investors. J. Bus. Ethics 2017, 140, 339–351. [Google Scholar] [CrossRef]
- Climent, F.; Soriano, P. Green and good? The investment performance of US environmental mutual funds. J. Bus. Ethics 2011, 103, 275–287. [Google Scholar] [CrossRef]
- Munoz, F.; Vargas, M.; Marco, I. Environmental mutual funds: Financial performance and managerial abilities. J. Bus. Ethics 2014, 124, 551–569. [Google Scholar] [CrossRef]
- Fernandez, M.S.; Abu-Alkheil, A.; Khartabiel, G.M. Do German green mutual funds perform better than their peers? Bus. Econ. Res. J. 2019, 10, 297–312. [Google Scholar] [CrossRef]
- Chiappini, H.; Vento, G.; De Palma, L. The Impact of COVID-19 Lockdowns on Sustainable Indexes. Sustainability 2021, 13, 1846. [Google Scholar] [CrossRef]
- Derwall, J.; Guenster, N.; Bauer, R.; Koedijk, K. The eco-efficiency premium puzzle. Financ. Anal. J. 2005, 61, 51–63. [Google Scholar] [CrossRef]
- Friede, G.; Busch, T.; Bassen, A. ESG and financial performance: Aggregated evidence from more than 2000 empirical studies. J. Sustain. Financ. Invest. 2015, 5, 210–233. [Google Scholar] [CrossRef]
- Talan, G.; Sharma, G.D. Doing well by doing good: A systematic review and research agenda for sustainable investment. Sustainability 2019, 11, 353. [Google Scholar] [CrossRef]
- Limkriangkrai, M.; Koh, S.; Durand, R.B. Environmental, social, and governance (ESG) profiles, stock returns, and financial policy: Australian evidence. Int. Rev. Financ. 2017, 17, 461–471. [Google Scholar] [CrossRef]
- Aw, E.N.W.; LaPerla, S.J.; Sivin, G.Y. A morality tale of ESG: Assessing socially responsible investing. J. Wealth Manag. 2017, 19, 14–23. [Google Scholar] [CrossRef]
- Yue, X.G.; Han, Y.; Teresiene, D.; Merkyte, J.; Liu, W. Sustainable funds performance evaluation. Sustainability 2020, 12, 8034. [Google Scholar] [CrossRef]
- Humphrey, J.E.; Lee, D.D.; Shen, Y. Does it cost to be sustainable? J. Corp. Financ. 2012, 18, 626–639. [Google Scholar] [CrossRef]
- Badía, G.; Pina, V.; Torres, L. Financial performance of government bond portfolios based on environmental, social, and governance criteria. Sustainability 2019, 11, 2514. [Google Scholar] [CrossRef]
- Berg, F.; Koelbel, J.F.; Rigobon, R. Aggregate Confusion: The Divergence of ESG Ratings; MIT Sloan Working Paper 5822-19; MIT Sloan School of Management: Cambridge, MA, USA, 2019. [Google Scholar]
- Ferruz, L.; Munoz, F.; Vargas, M. Stock picking, market timing and style differences between socially responsible and conventional pension funds: Evidence from the United Kingdom. Bus. Ethics Eur. Rev. 2010, 19, 408–422. [Google Scholar] [CrossRef]
- Torre-Torres, O.V.D.l.; Galeana-Figueroa, E.; Álvarez-García, J. Efficiency of the public pensions funds on the socially responsible equities of Mexico. Sustainability 2019, 11, 178. [Google Scholar] [CrossRef]
- Sievanen, R.; Rita, H.; Scholtens, B. The drivers of responsible investment: The case of European pension funds. J. Bus. Ethics 2013, 117, 137–151. [Google Scholar] [CrossRef]
- Cox, P.; Schneider, M. Is corporate social performance a criterion in the overseas investment strategy of U.S. pension plans? An empirical examination. Bus. Soc. 2010, 49, 252–289. [Google Scholar] [CrossRef]
- Alda, M. Corporate sustainability and institutional shareholders: The pressure of social responsible pension funds on environmental firm practices. Bus. Strategy Environ. 2019, 28, 1060–1071. [Google Scholar] [CrossRef]
- Sethi, S. Investing in socially responsible companies is a must for public pension funds-because there is no better alternative. J. Bus. Ethics 2005, 56, 99–129. [Google Scholar] [CrossRef]
- Eldridge, K. Taking social and environmental factors into account in the investment decision-making process: What can fund managers do to meet clients’ needs? J. Pensions Manag. 2001, 6, 157–164. [Google Scholar] [CrossRef][Green Version]
- Heal, G. Corporate social responsibility: An economic and financial framework. Geneva Pap. Risk Insur. Issues Pract. 2005, 30, 387–409. [Google Scholar] [CrossRef]
- Berghe, L.; Louche, C. The link between corporate governance and corporate social responsibility in insurance. Geneva Pap. Risk Insur. Issues Pract. 2005, 30, 425–442. [Google Scholar] [CrossRef]
- Scholtens, B. Corporate social responsibility in the international insurance industry. Sustain. Dev. 2011, 19, 143–156. [Google Scholar] [CrossRef]
- Tseng, M.L.; Tan, P.A.; Jeng, S.Y.; Lin, C.W.R.; Negash, Y.T.; Darsono, S.N.A.C. Sustainable investment: Interrelated among corporate governance, economic performance and market risks using investor preference approach. Sustainability 2019, 11, 2108. [Google Scholar] [CrossRef]
- Cont, R. Empirical properties of asset returns: Stylized facts and statistical issues. Quant. Financ. 2001, 1, 223–236. [Google Scholar] [CrossRef]
- Adcock, C.; Eling, M.; Loperfido, N. Skewed distributions in finance and actuarial science: A review. Eur. J. Financ. 2015, 21, 1253–1281. [Google Scholar] [CrossRef]
- ONS. Earnings and Working Hours; Technical Report; Office for National Statistics: London, UK, 2020.
- Bodie, Z.; Kane, A.; Marcus, A.J. Investments; Eleventh International Edition; McGraw-Hill Education: New York, NY, USA, 2018. [Google Scholar]
- Blake, D. Pension Finance; John Wiley & Sons: Chichester, UK; Hoboken, NJ, USA, 2006. [Google Scholar]
- Daga, A.; Schlanger, T.; Westaway, P. Vanguard’s Approach to Target Retirement Funds in the UK; Technical Report; Vanguard: London, UK, 2016. [Google Scholar]
- Brown, S.J.; Goetzmann, W.; Ibbotson, R.G.; Ross, S.A. Survivorship bias in performance studies. Rev. Financ. Stud. 1992, 5, 553–580. [Google Scholar] [CrossRef]
- Vanguard. What Is Survivorship Bias and Why Does It Matter? Technical Report; Vanguard: London, UK, 2015. [Google Scholar]


| US | Europe | |
|---|---|---|
| Mean monthly return | 54.5% (0.125) | 53.5% (0.245) |
| Mean annualized return | 54.5% (0.112) | 53.5% (0.993) |
| Sharpe ratio | 52.3% (0.951) | 53.5% (0.149) |
| Treynor ratio | 56.8% (0.891) | 55.8% (0.931) |
| Information ratio | 54.5% (0.601) | 58.1% (0.264) |
| Jensen’s alpha | 61.4% (0.791) | 58.1% (0.162) |
| Portfolio | Pension Plan Wealth (£) | |||||||
|---|---|---|---|---|---|---|---|---|
| Year | Earning Index | Salary (£) | Pension Saving (£) | Equity (%) | Bond (%) | FTSE 100 Tracker | Active | FTSE 100 RR ESG |
| 2000 | 4.50 | 50,000.00 | 57,500.00 | 100 | 0 | 51,511.23 | 56,412.59 | 55,943.49 |
| 2001 | 5.00 | 52,500.00 | 7875.00 | 100 | 0 | 50,128.08 | 59,239.56 | 58,515.32 |
| 2002 | 4.80 | 55,020.00 | 8253.00 | 100 | 0 | 44,484.34 | 58,740.07 | 54,684.71 |
| 2003 | 4.80 | 57,660.96 | 8649.14 | 100 | 0 | 61,402.88 | 72,559.84 | 72,851.69 |
| 2004 | 4.30 | 60,140.38 | 9021.06 | 100 | 0 | 76,752.82 | 86,297.81 | 90,228.17 |
| 2005 | 5.90 | 63,688.66 | 9553.30 | 100 | 0 | 102,063.37 | 103,934.32 | 119,139.56 |
| 2006 | 4.10 | 66,299.90 | 9944.98 | 100 | 0 | 125,857.94 | 125,915.96 | 144,377.97 |
| 2007 | 4.30 | 69,150.79 | 10,372.62 | 100 | 0 | 143,623.08 | 134,706.06 | 165,790.90 |
| 2008 | 4.10 | 71,985.98 | 10,797.90 | 100 | 0 | 109,623.68 | 114,962.02 | 132,986.59 |
| 2009 | 3.80 | 74,721.44 | 11,208.22 | 100 | 0 | 151,701.11 | 143,507.38 | 183,674.36 |
| 2010 | 2.00 | 76,215.87 | 11,432.38 | 100 | 0 | 183,646.33 | 168,131.46 | 219,587.95 |
| 2011 | 2.30 | 77,968.84 | 11,695.33 | 90 | 10 | 190,890.12 | 171,057.28 | 223,640.59 |
| 2012 | 2.40 | 79,840.09 | 11,976.01 | 80 | 20 | 219,577.85 | 195,964.86 | 258,319.38 |
| 2013 | 2.00 | 81,436.89 | 12,215.53 | 70 | 30 | 256,708.16 | 231,666.24 | 298,336.80 |
| 2014 | 2.10 | 83,147.07 | 12,472.06 | 60 | 40 | 282,394.88 | 256,565.91 | 327,605.84 |
| 2015 | 2.60 | 85,308.89 | 12,796.33 | 50 | 50 | 292,000.21 | 272,187.08 | 340,369.43 |
| 2016 | 2.80 | 87,697.54 | 13,154.63 | 40 | 60 | 342,550.26 | 307,893.14 | 387,167.78 |
| 2017 | 2.90 | 90,240.77 | 13,536.12 | 30 | 70 | 369,673.36 | 335,077.02 | 414,271.78 |
| 2018 | 3.10 | 93,038.23 | 13,955.73 | 20 | 80 | 374,630.08 | 338,990.44 | 418,336.86 |
| 2019 | 3.40 | 96,201.53 | 14,430.23 | 10 | 90 | 415,129.83 | 380,266.68 | 460,847.02 |
| 2020 | 3.20 | 99,279.98 | 14,892.00 | 0 | 100 | 460,345.66 | 423,006.88 | 508,233.72 |
| At Retirement | FTSE 100 Tracker | Active Funds | FTSE 100 RR ESG |
|---|---|---|---|
| Pension plan wealth | £460,345.66 | £423,006.88 | £508,233.72 |
| Retirement income | £22,078.18 | £20,287.41 | £24,374.89 |
| Replacement ratio | 22.24% | 20.43% | 24.55% |
| Decline in Pension Plan Wealth (%) | ||||
|---|---|---|---|---|
| Event | Decline in FTSE 100 (%) | FTSE 100 Tracker | Active Funds | FTSE 100 RR ESG |
| 2001–2002 Dot.com crash | 22.17 | 11.26 | 0.84 | 6.55 |
| 2007–2008 Financial crisis | 28.33 | 23.67 | 14.66 | 19.79 |
| RepRisk ESG Threshold | |||
|---|---|---|---|
| Year | 25 | 50 | 75 |
| 2010 | 12 | 3 | 0 |
| 2011 | 16 | 3 | 2 |
| 2012 | 16 | 6 | 2 |
| 2013 | 18 | 7 | 2 |
| 2014 | 21 | 9 | 4 |
| 2015 | 24 | 10 | 5 |
| 2016 | 19 | 9 | 4 |
| 2017 | 22 | 8 | 2 |
| 2018 | 25 | 8 | 2 |
| 2019 | 21 | 7 | 1 |
| RepRisk ESG Threshold | |||
|---|---|---|---|
| Year | 25 | 50 | 75 |
| 2010 | BP, RDSA, HSBC | BP, RDSA, RBS | |
| 2011 | RDSA, HSBC, VOD | RDSA, HSBC, BP | RDSA, BP |
| 2012 | RDSA, HSBC, BP | RDSA, HSBC, BP | RDSA, BP |
| 2013 | RDSA, HSBC, BP | RDSA, HSBC, BP | RDSA, HSBC |
| 2014 | RDSA, HSBC, BP | RDSA, HSBC, BP | RDSA, HSBC, BARC |
| 2015 | RDSA, HSBC, BP | RDSA, HSBC, BP | RDSA, HSBC, BP |
| 2016 | RDSA, HSBC, BAT | RDSA, HSBC, GSK | RDSA, HSBC, BP |
| 2017 | RDSA, HSBC, BAT | RDSA, HSBC, BP | RDSA, HSBC |
| 2018 | RDSA, HSBC, BAT | RDSA, HSBC, BP | RDSA, HSBC |
| 2019 | RDSA, HSBC, BP | RDSA, HSBC, BP | RDSA |
| At Retirement | FTSE 100 Tracker | FTSE 100 RR ESG | FTSE 100 RR ESG ETF |
|---|---|---|---|
| Pension plan wealth | £460,345.66 | £508,233.72 | £530,104.03 |
| Retirement income | £22,078.18 | £24,374.89 | £25,423.79 |
| Replacement ratio | 22.24% | 24.55% | 25.61% |
Publisher’s Note: MDPI stays neutral with regard to jurisdictional claims in published maps and institutional affiliations. |
© 2021 by the authors. Licensee MDPI, Basel, Switzerland. This article is an open access article distributed under the terms and conditions of the Creative Commons Attribution (CC BY) license (https://creativecommons.org/licenses/by/4.0/).
Share and Cite
Owadally, I.; Mwizere, J.-R.; Kalidas, N.; Murugesu, K.; Kashif, M. Long-Term Sustainable Investment for Retirement. Sustainability 2021, 13, 5000. https://doi.org/10.3390/su13095000
Owadally I, Mwizere J-R, Kalidas N, Murugesu K, Kashif M. Long-Term Sustainable Investment for Retirement. Sustainability. 2021; 13(9):5000. https://doi.org/10.3390/su13095000
Chicago/Turabian StyleOwadally, Iqbal, Jean-René Mwizere, Neema Kalidas, Kalyanie Murugesu, and Muhammad Kashif. 2021. "Long-Term Sustainable Investment for Retirement" Sustainability 13, no. 9: 5000. https://doi.org/10.3390/su13095000
APA StyleOwadally, I., Mwizere, J.-R., Kalidas, N., Murugesu, K., & Kashif, M. (2021). Long-Term Sustainable Investment for Retirement. Sustainability, 13(9), 5000. https://doi.org/10.3390/su13095000