2. Background
This section covers the research focus of the current paper. In the first part, the main building blocks for engineering a SCADA system are introduced. Afterwards, drawbacks of these systems are underlined. The section ends with the foundation of the research scope and frames the area for analyzing the state of the art in the field.
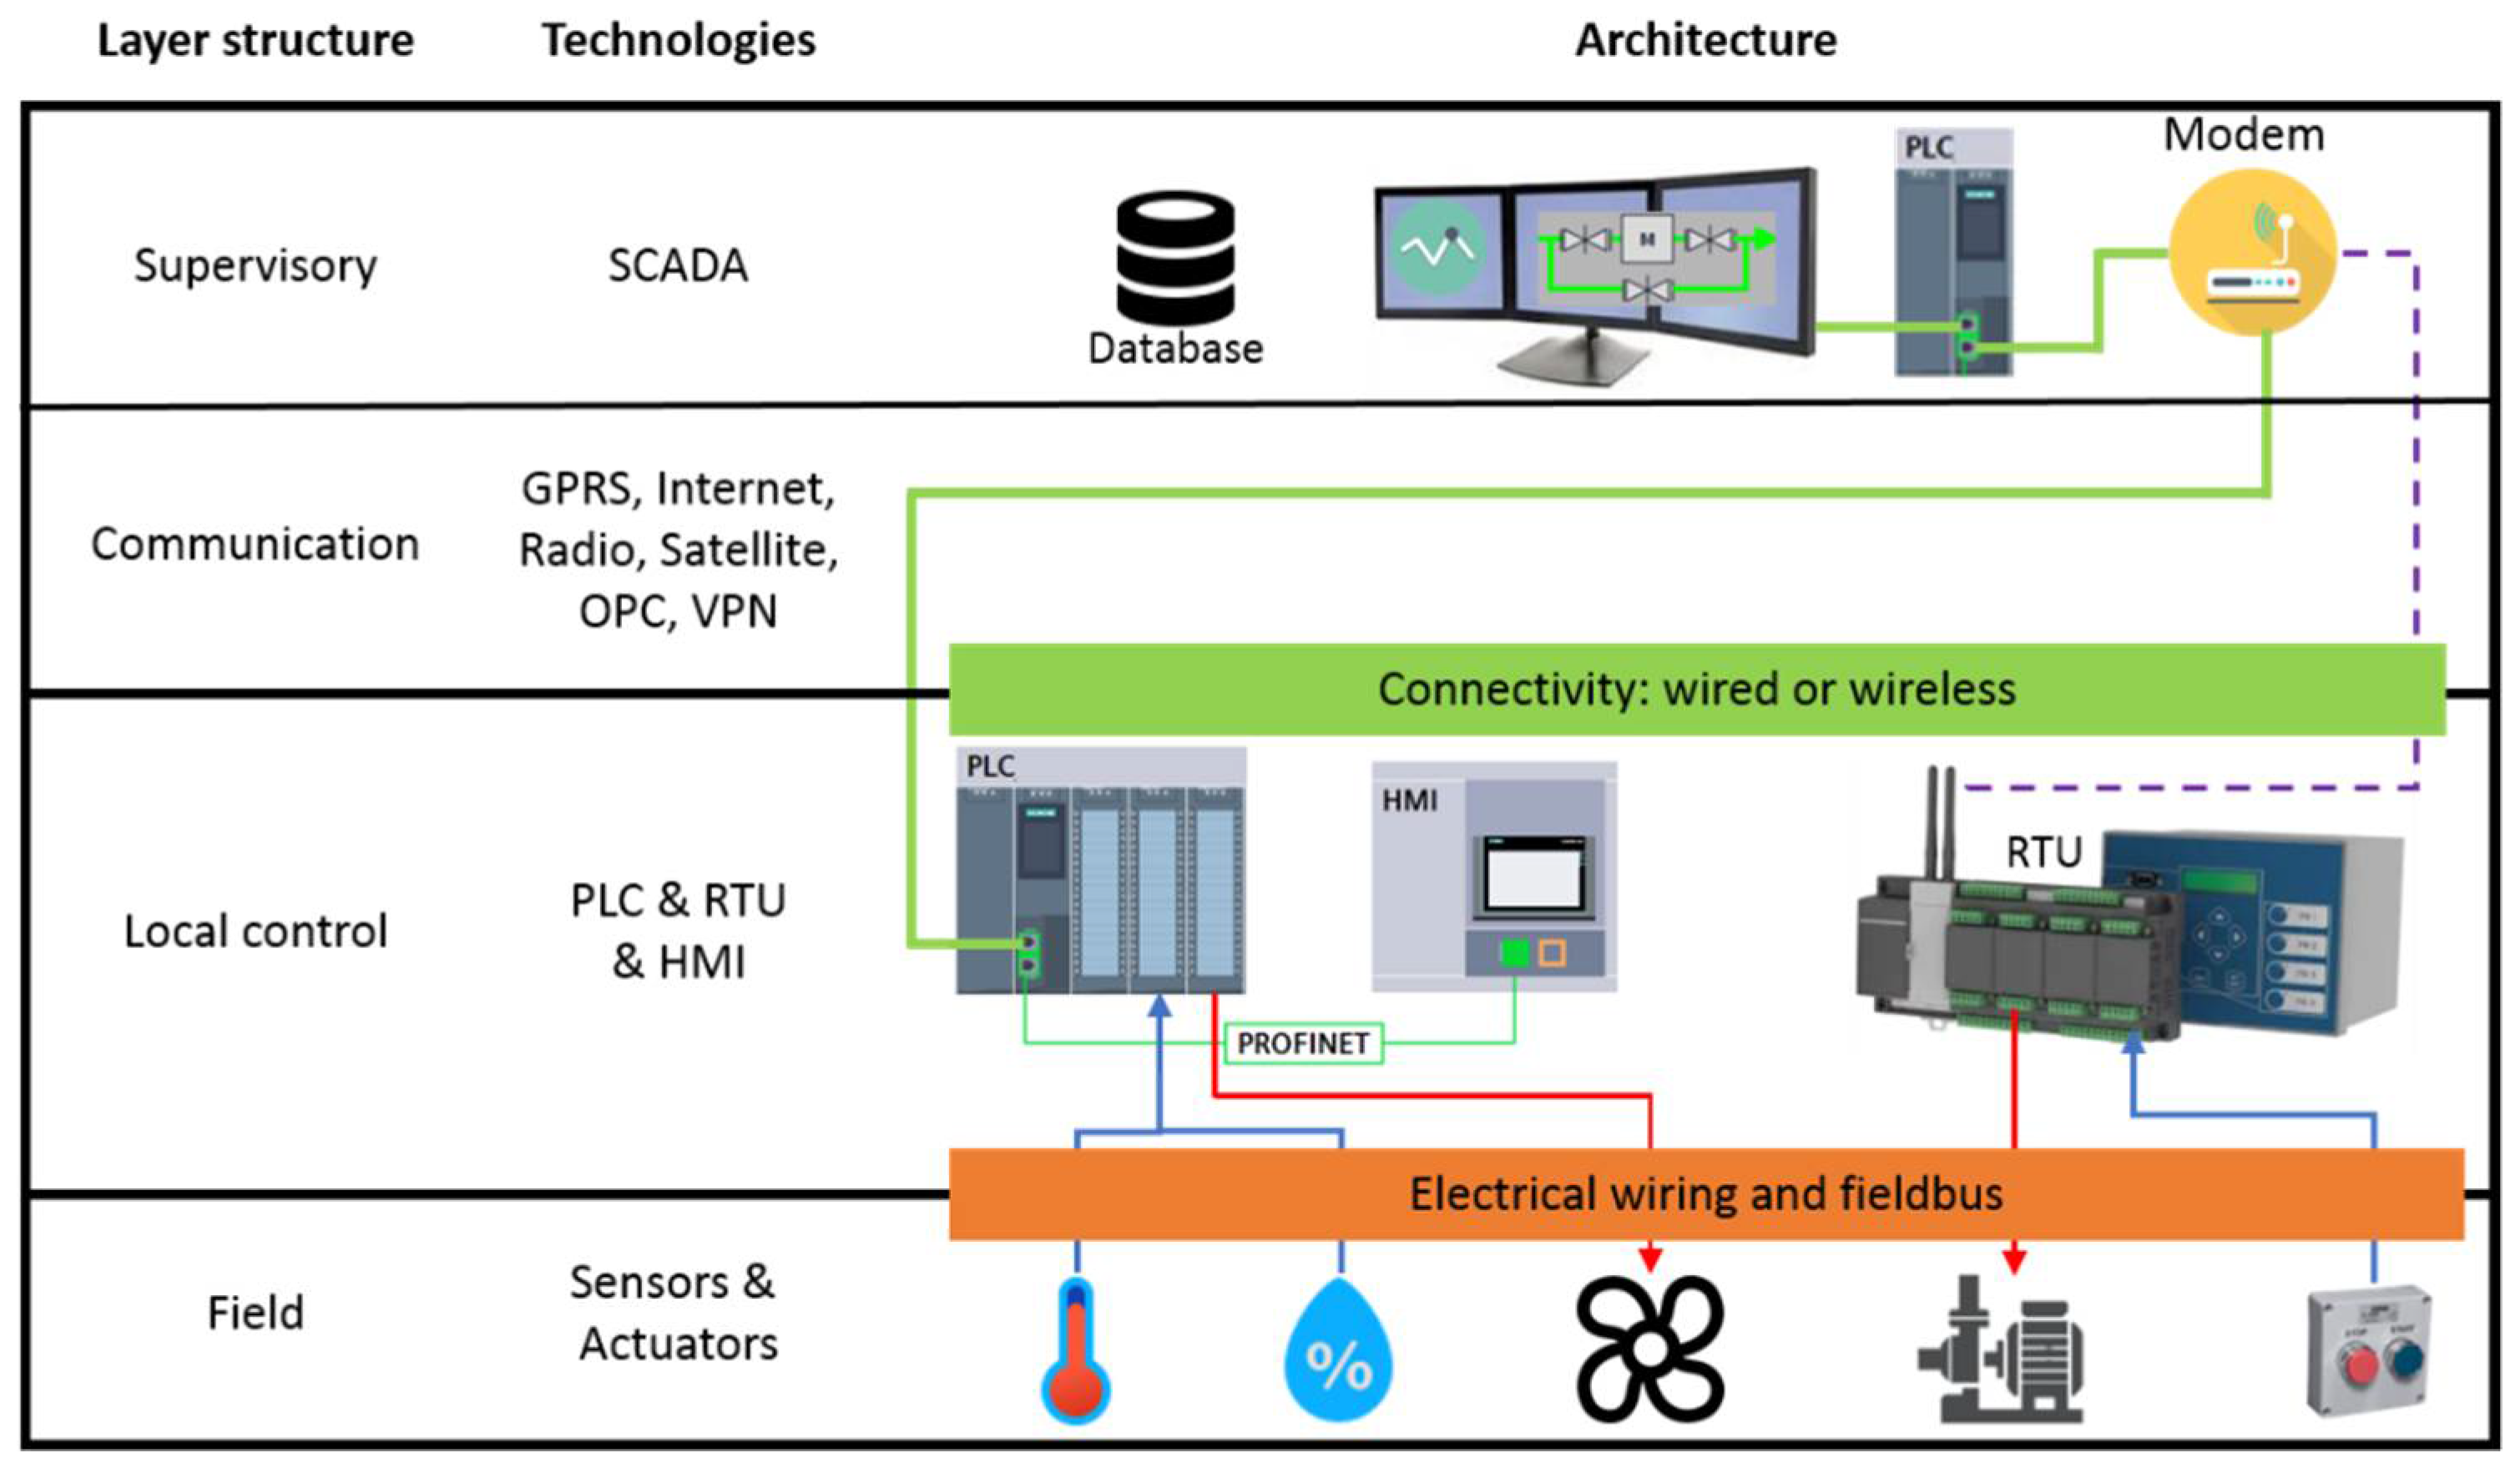
From a conceptual perspective, we must see a SCADA system as a bridge between at least one remote operation unit (e.g., sensor, actuator) located in the field and a data visualization and management unit. Through the SCADA system, automation logic is realized, and data are exchanged between the field and the supervisory unit [
9,
10]. Therefore, the major engineering blocks of a SCADA system are data generation and management, connectivity, and commissioning [
11]. Thus, the control center includes design and development of SCADA application and human-process interface (HPI) to visualize processed data that are received from remote automation systems. Connectivity between SCADA application and remote automation systems involves setup and configuration of the communication hardware and services, identification and hiring services from communication providers that can ensure the network coverage, static IPs, and VPN gates for secured communication. Commissioning puts the whole system into operation, tests and validates data and functionalities, etc. This job requires a great number of skilled human resources and represents one of the major challenges in SCADA system engineering.
Considering the plethora of components, modules, and technologies (e.g., communication) required to setup a SCADA system, different parts of a SCADA architecture are usually developed and engineered by different vendors or subcontractors. This process comes up with a series of drawbacks, such as [
7,
12,
13]:
Lack of homogeneity to the level of SCADA applications and automation solutions are a very usual situation in the case of WWT plants, with challenges in terms of intervention, maintenance, and servicing, as well as in terms of integration and data interoperability.
High level of heterogeneity for data representation, variable naming, data processing, equipment control, signaling, and visualization, with challenges and subsequent complications in terms of data modelling for analytics, aggregated preventive maintenance, and agility in scaling-up monitoring and control of WWT plants.
Difficulties to receive support or even missing assistance in the case of software, hardware, or operating systems that become technologically obsolete, but still functional in the WWT plant, with subsequent blockages for renewing or updating SCADA system applications that run on the top.
High costs for engineering, commissioning, and lifecycle operation of SCADA applications, because of the system’s heterogeneous character and necessity to collaborate with more integrators.
Complications for upscaling and updating the system, even for executing small adjustments that frequently occur, because more vendors or integrators must be simultaneously involved.
Stricter compliance measures are imposed by regulatory bodies on the water industry to increase the reliance of data delivered from the treatment processes. This requires different approaches in the development of SCADA systems and automation units. To increase the quality of life and safety of citizens, WWT installations must be distributed in as many places as possible within the waste-water network of a city. Instead of having a big plant, the smarter, more resilient, and safer way is to have a grid of remote controllable WWT units. This also facilities agility in operation, control of waste-water sources, as well as flexibility in operation, including updating and upscaling. For a smart city, this generic architecture is desirable [
14,
15]. However, integrating current solutions of SCADA systems in a smart city network of WWT would be very labor intensive, time consuming, and costly [
16,
17]. Moreover, due to the large variety of technologies that might be implemented, as well as due to various standards and various control strategies, data management and processing in a grid of WWT installations might be also technically difficult [
1,
18].
Due to advancements in computing and remote communication technologies, such as cloud computing, big data management and IoT, consideration of these new technologies as part of a grid of WWT installations could provide several advantages, including better serviceability, higher resilience, and better lifecycle orientation [
19,
20], as well as considerable mitigation of current drawbacks of SCADA systems [
21,
22].
Therefore, the goal of this paper is to introduce a methodology that systematically manages a lifecycle oriented, multi-criteria design process of a SCADA system for a grid of smart WWT installations that embeds cloud computing and data analytics [
20,
22] instead of classical remote operating systems, to facilitate the inclusion of artificial intelligence models for preventive maintenance and decision making over the system’s lifecycle. In terms of the system’s optimal design, a set of criteria that covers all lifecycle phases are considered: efficiency in operation, enhanced options for data matching, redundancy for higher safety standards, longer life, initial cost reduction with engineering and commissioning, as well as cost reduction over lifecycle operation.
Hence, the remainder of the paper is organized as follows. In
Section 3, related work on SCADA system architectures for WWT installations is investigated using databases of publications and combinations of keywords for searching and filtering. Results are used to formulate the gap and to indicate the novelty brought by this research. In
Section 4, the research methodology is presented into details. Because multiple optimization criteria are involved and because some of them are in conflict each other, an evolutionary design algorithm that integrates systematic problem-solving techniques is proposed. It looks for the effective path for investigating architectural construction and technology selection such as to best satisfy each optimization criterion. Because the algorithm deals with system optimization—not parameter optimization—at this stage of the design we must operate with qualitative optimization, not with a quantitative one.
Section 5 illustrates the application of the methodology to design a disruptive SCADA system. Disruption must be understood according to its definition, in the sense of defining a solution that can replace traditional SCADA systems in a smart grid of WWT installations, at least for the category of low-end beneficiaries, such as villages, small districts, isolated resorts, small towns, as well as local WWT installations of industrial facilities, but also with capacity to be integrated in large WWT plants. The paper ends with a section of discussions around the results of the case study and a section of conclusions that indicates advantages and limitations of the proposed solution, a comparative analysis with traditional SCADA systems, findings from this research and highlights on future researches in relation to this topic.
4. Methodology
Lifecycle design of a SCADA system falls into the paradigm called the “curse of dimensionality” [
29]. We must consider a long list of performance characteristics, that is: secured communication, modularity, interoperability, agility, upgradeability, resilience, scalability, flexibility in operation, efficiency, low cost, homogeneity, integrability, serviceability, easy configuration, redundancy for safety, preventability, architectural reliability, necessary functionality, connectivity, and easy commissioning. Some people might say that several other characteristics cloud be included as well (e.g., replaceability, usability).
This large list of complicated characteristics puts engineers in front of a hard decision. Shall they consider the whole package of design criteria? In the ideal case, this should be the desirable decision, but it comes with a large amount of work for planning and analysis, and with a big number of plausible combinations. This is a big dilemma in engineering in general, not necessarily in this situation.
At this stage of design, optimization cannot use traditional methods such as swarm algorithms, genetic algorithms, or other quantitative optimization tools, because the space of investigation is not a numerical one, either discrete or continuous. As it is shown in the list above, at this stage of design we operate with high level concepts for describing performance. Thus, the key question is: How to reduce the list of characteristics without affecting accuracy of end results? To answer at this question, we use the TRIZ contradiction matrix described in [
28]. For simplifying its application, we use a software tool, indigenously developed [
30]. Results are illustrated in
Figure 2.
The generic directions of intervention from
Figure 2 are further explained. The first direction suggests that the higher the number of software units that will replace hardware units in the architecture of a SCADA system, the better it is for achieving the goal. Additionally, it tells us that we must look for simple and inexpensive solutions to fulfill some functions in the architecture so that replacement and adaptation is not affected as much. The second direction of intervention indicates the presence of an agile “mediator” in the SCADA architecture. Mediation usually happens in conjunction with data exchange between heterogeneous units from the system. For example, how to transfer data from a sensor and an email, or from sensors to an online platform that indicates to city’s community the quality of treatment of the waste-water? The last generic direction of intervention highlights the necessity to increase the level of transparency. In other words, it indicates unveiling hidden information about the performance characteristics that ultimately can give us the option to put aside some of these characteristics in the optimization process, and to use them only as checking metrics in conjunction with the proposed solution. If the first two generic indications fall into the category of searching or developing software technologies for solving as many as possible aspects in the SCADA system, the third one encourages us to apply some operations on the list of key characteristics for unveiling aspects that can prioritize them and quantify their impact for giving us the possibility to reduce the list applied for solution optimization. For the first two situations, the problem can be solved with the current technological developments. Thus, at the field level, instead of using simple sensors, we must consider cyber-physical units (CPS), meaning smart sensors, smart actuators, and other smart devices. For example, a smart sensor is a combination of a simple sensor with a microcontroller, which is programable with a high-level programming language (e.g., C) [
31]. To ensure flexibility at low costs, a software “broker” that handles heterogeneous devices shall be in place. An investigation reveals that we already have such technologies on the market; they are reliable, and some of them are for free. Such as, for example, the case of node-RED platform from IBM used to wire IoT brokers, hardware devices, and online services [
32,
33,
34]. Thus, combining the concept of smart units at the field level with a cheap and agile software intermediator (e.g., node-RED), we can quickly and easily design a distributed control SCADA architecture. A distributed control system fits with the goal of designing smart grids of WWT installations. A distributed control system is even better because it facilitates the integration of high cybersecurity paradigms, such as blockchain [
35,
36] and distributed ledger technologies (DLT) [
37] at the edge level (very low level) of the SCADA system [
38]. This represents a big step forward for SCADA monitoring and control of WWT units in terms of security.
Just with these simple interventions induced by the first two vectors from
Figure 2, we are in the desirable position to eliminate from the design demarche most of the performance characteristics displayed in the initial list; that is, modularity, interoperability, agility, upgradeability, homogeneity, resilience, scalability, integrability, serviceability, easy configuration, efficiency, connectivity, flexibility in operation, and secure communication. They will be used only in the verification stage of the proposed design. The performance characteristic “necessary functionality” is not essentially an element that requires design optimization, meaning it falls into the category of “must requirements”, which must be 100% fulfilled. Preventability, one of the performance characteristics from the list, is also not a matter of design optimization. With the capacity to integrate cloud computing in the SCADA system due to smart intermediators such as node-RED, we have the space opened for introducing machine learning algorithms. Due to integrating smart sensors and smart actuators in the SCADA architecture, the collection of relevant data about the operation of system’s units is facilitated. Thus, the core interventions in the architecture with the inclusion of CPSs and smart brokers give us the opportunity to perform data analytics for preventive maintenance directly in the cloud. Therefore, we can reduce the list of elements that frames the optimization space at: low cost of the initial investment, redundancy for safety, architectural reliability, and easy commissioning. At this level of complexity, the problem is manageable from the perspective of optimal design. We stress again the aspect that, at this stage of the design, we discuss the qualitative optimization.
The last vector of intervention from
Figure 2 suggests the inclusion of “additives” to increase the level of transparency. In this respect, we consider the integration of the AIDA method and the CSDT method in our methodology for planning the design roadmap and visualizing the hidden aspects [
39,
40].
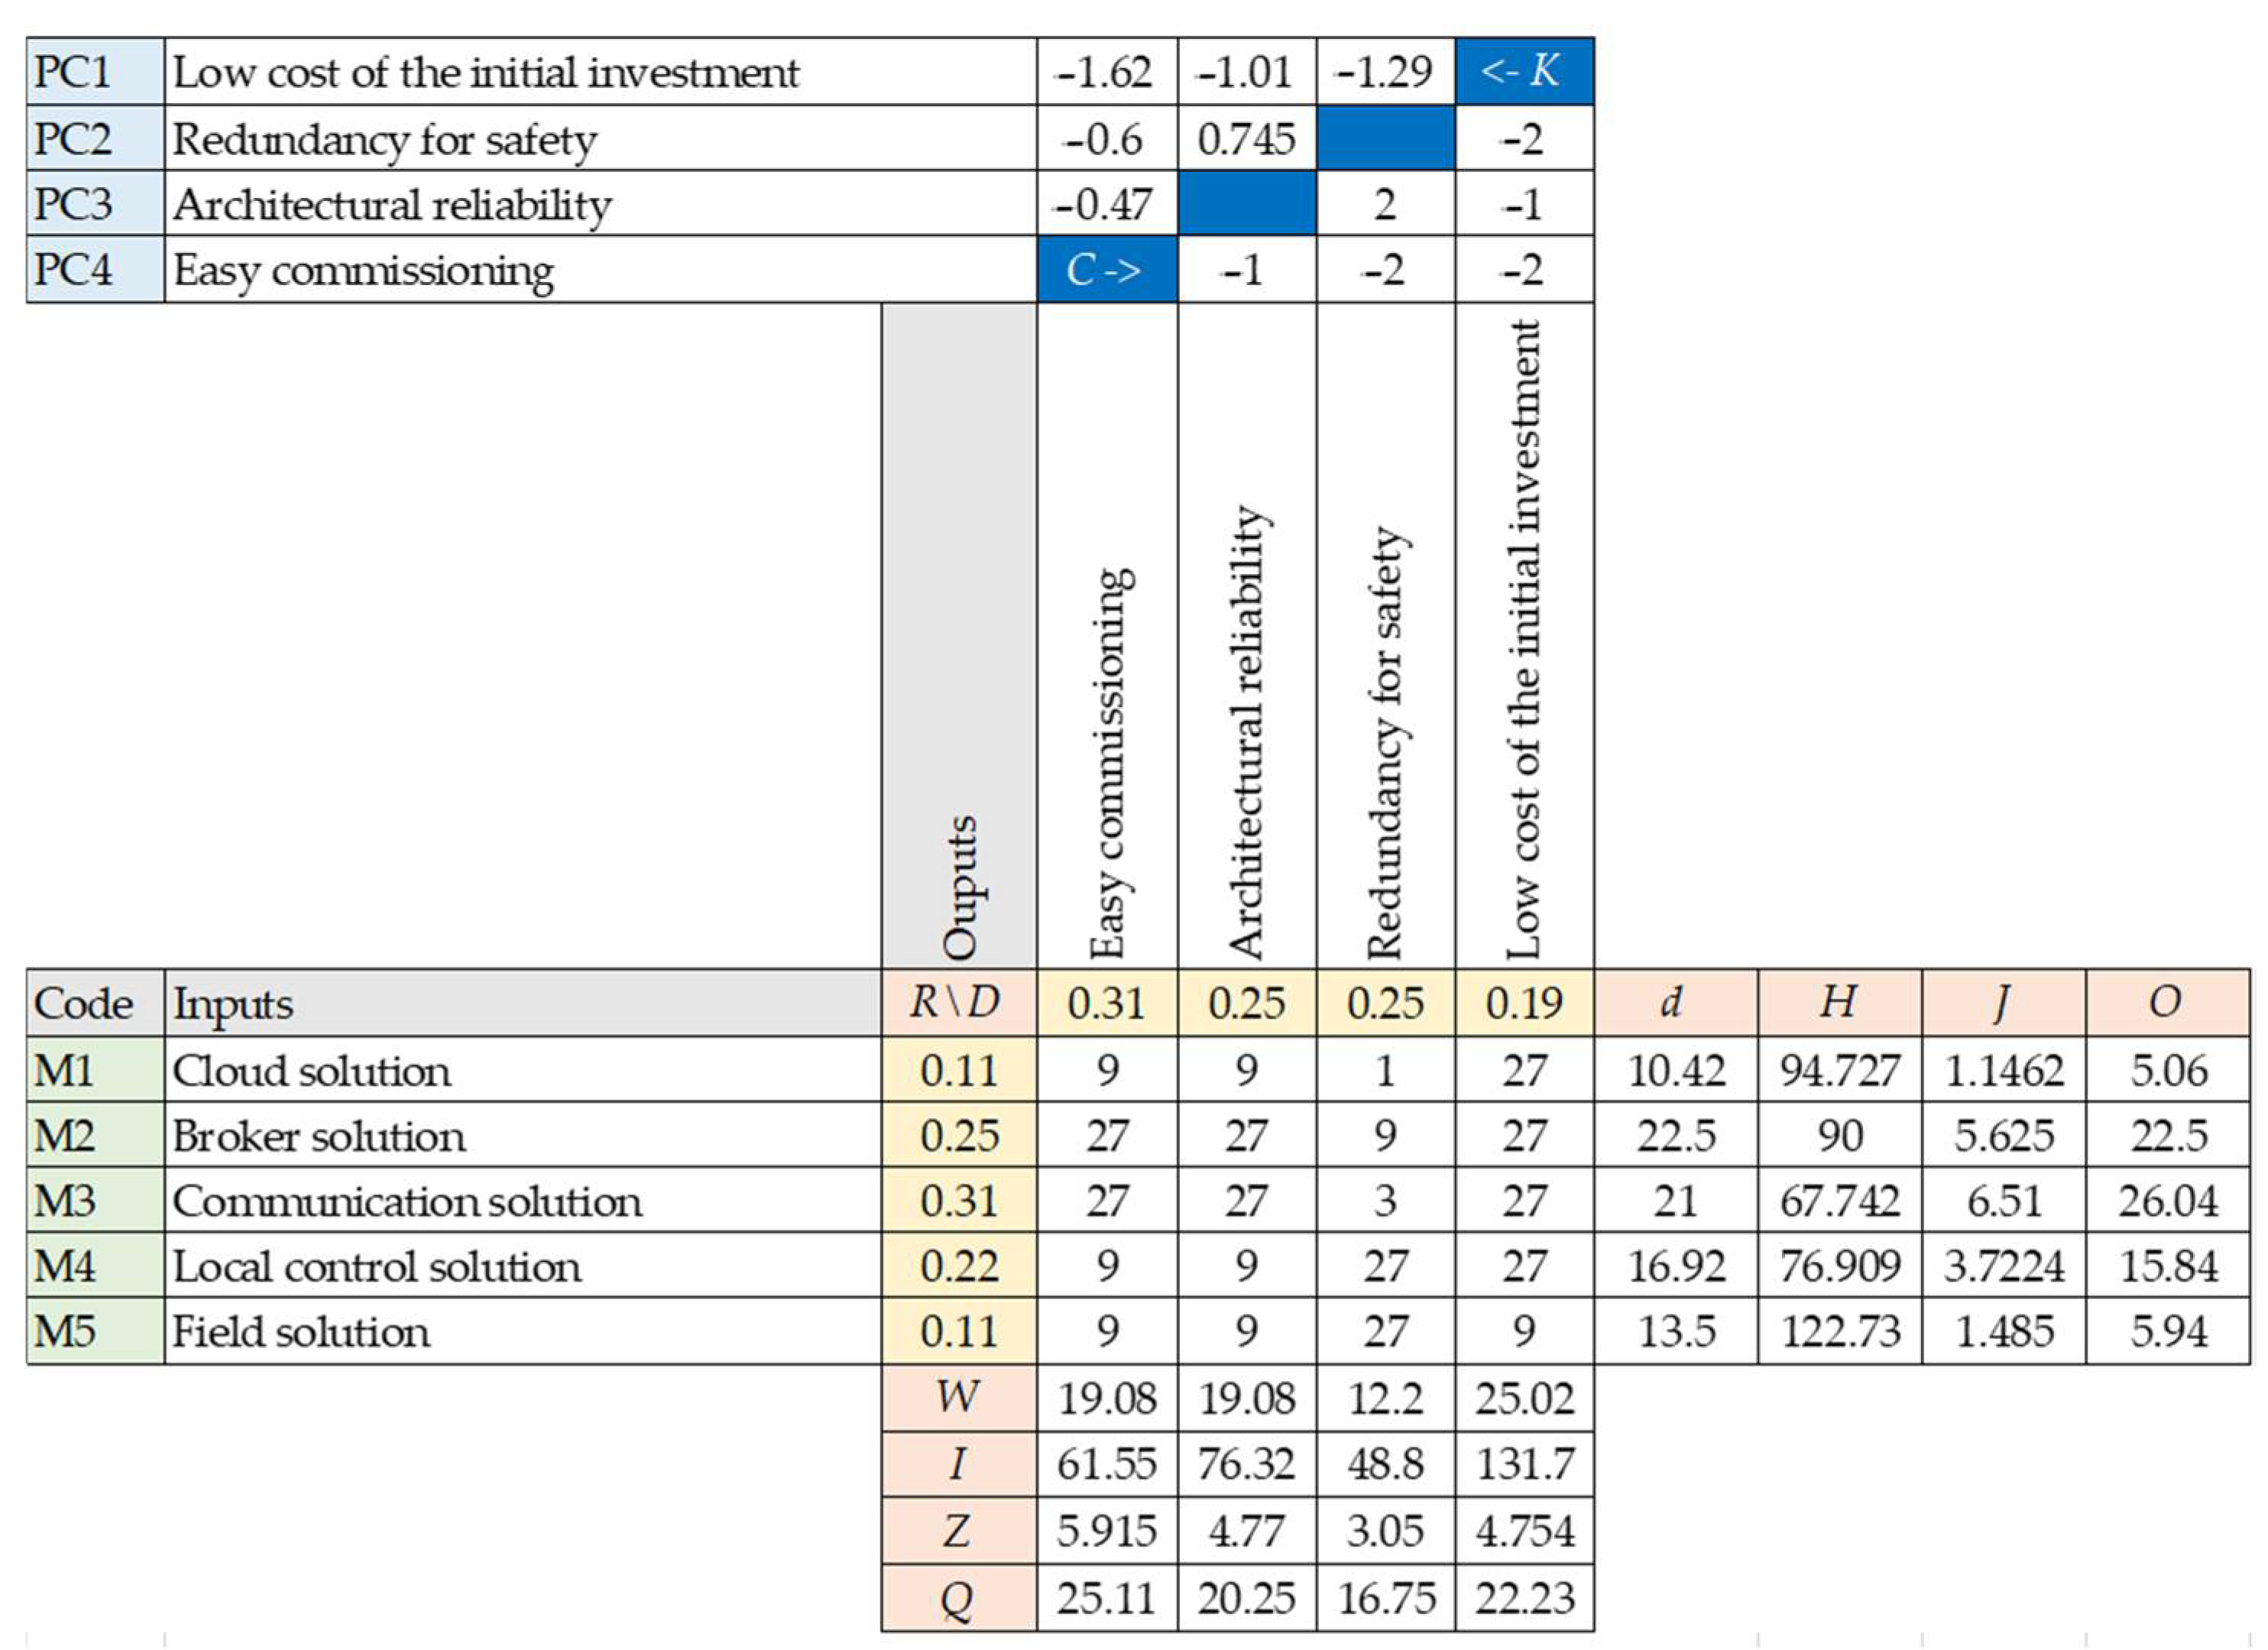
Figure 3 shows the CSDT planning matrix for the SCADA system. In the planning matrix we consider the following list of generic
inputs [cloud solution; broker solution; communication solution; local control solution; field solution]. Each
input has a relative importance rank (
R), given by engineers to meet the short list of performance characteristics (
outputs); that is [low cost of the initial investment; redundancy for safety; architectural reliability; easy commissioning]. We gave the ranks for the generic
inputs with the help of the AHP method [
41] by interrogating a focus group of 5 integrators of the SCADA systems. Results are illustrated in
Figure 3, column
R. Each
output has a relative difficulty rank (
D) from the perspective of achievement. They have been ranked following the same procedure as in the case of the
R coefficient. Results are shown in
Figure 3, in the raw
D. To quantify the relationship between
inputs and
outputs the following numerical scale is applied: 0 (no relationship); 1 (weak relationship); 3 (medium relationship); 9 (strong relationship); 27 (critical relationship) [
42]. Results are shown in
Figure 3, in the central matrix of the planning diagram.
The CSDT planning framework also considers several other coefficients. In our analysis the following CSDT coefficients are introduced (see
Figure 3): value weight (
W), technical index of priority (
I), relative technical effort (
Z), impact depreciation (
Q), technical depreciation (
O), input risk (
J), difficulty to satisfy inputs (
d), correlation index of priority (
K), and input index of priority (
H).
W indicates the maximum relative impact that each
output has within the set of
outputs to define the optimal design for the SCADA system.
I coefficient recommends the priority with which each
output should be tackled.
Z indicates the relative level of innovation for each
output.
Q gives a measure of the negative impact if
outputs are not well satisfied.
O is related to the implications on product competitiveness if
inputs are not well solved.
J is about the risks associated with poor design of
inputs. The coefficient
d shows the difficulty to satisfy an
input by the set of
outputs.
K recommends the priority with which the interdependencies between
outputs must be analyzed.
H recommends the priority with which
inputs must be satisfied.
Figure 3 also puts into evidence the correlations (
C) between
outputs, in the top-right matrix. We consider it superfluous to put all technicalities of the CSDT algorithm here, because they consume a lot of space and do not bring added value to the scope of this research. To find out more details about the calculation of the above-mentioned coefficients, reference [
40] should be consulted.
Information from
Figure 3 shows that “Low cost of the initial investment” has the highest impact on the SCADA system (
W = 25.02), followed by “Easy commissioning” and “Architectural reliability” (
W = 19.08). At the end of the list is “Redundancy for safety” (
W = 12.2). This result is logical, even if at first glance it seems counter-intuitive. The capacity to design a reliable SCADA system at low cost places solution providers in the “blue ocean” and disruptive innovation strategy [
42], generating a highly competitive advantage.
Figure 3 highlights that the highest priority for best solving the SCADA system is on “Low cost of the initial investment” (
I = 131.7), followed by “Architectural reliability” (
I = 76.32), then “Easy commissioning” (
I = 61.55), and then “Redundancy for safety” (
I = 48.8). Thus, any effort to identify the cheapest concept for the SCADA system is desirable. Upon that concept, focus must be on defining a reliable architecture in terms of embedded technologies, and then on identifying the business model and operations which lead to an easy commissioning. Once this issue is clarified, the strategy for ensuring redundancy in critical points must be considered.
Results show that the highest level of innovation is required for achieving “Easy commissioning” (
Z = 5.915), followed by “Architectural reliability” (
Z = 4.77) and “Low cost of the initial investment” (
Z = 4.75). According to TRIZ-MC [
28], applied with [
30], to achieve an easy commissioning without affecting accuracy of the measuring system’s performances, we need to adhere to the strategy of making the system sectorial for easy aggregation and disaggregation. To ensure a high reliability without affecting the level of investment, TRIZ-MC [
28], applied with [
30], leads to the following indication: the need to replace as many as possible hardware units with software units and to increase the local quality (e.g., CPSs).
According to results from
Figure 3, the highest competitive problem of a SCADA system (if it is not properly solved) stands on “Easy commissioning” (
Q = 25.11), closely followed by “Low cost of the initial investment” (
Q = 22.23). Indeed, the two performance characteristics are strongly connected. The top module of the SCADA system in terms of difficulty to satisfy is the “Broker solution” (
d = 22.5). With the adoption of latest technology such as node-RED, this challenge can be overpassed.
Priorities to satisfy the generic modules are, according to
Figure 3, the following: ”Communication solution” (
H = 67.74) is on the first place, and “Field solution” (
H = 122.73) is on the last place. There is a logical reason to for this result. Risks about proper operation of the SCADA systems, as well as their competitiveness, mostly count on “Communication solution” (
J = 6.51;
O = 26.04) and “Broker solution” (
J = 5.63;
O = 22.5). Information provided by the indicators presented in the previous paragraphs are useful to formulate a strategy for designing the SCADA system. We see that the kernel of the design optimization problem is the cluster formed by {“Communication solution”, “Broker solution”} against {“Low cost”, “Easy commissioning”, “Architectural reliability”}.
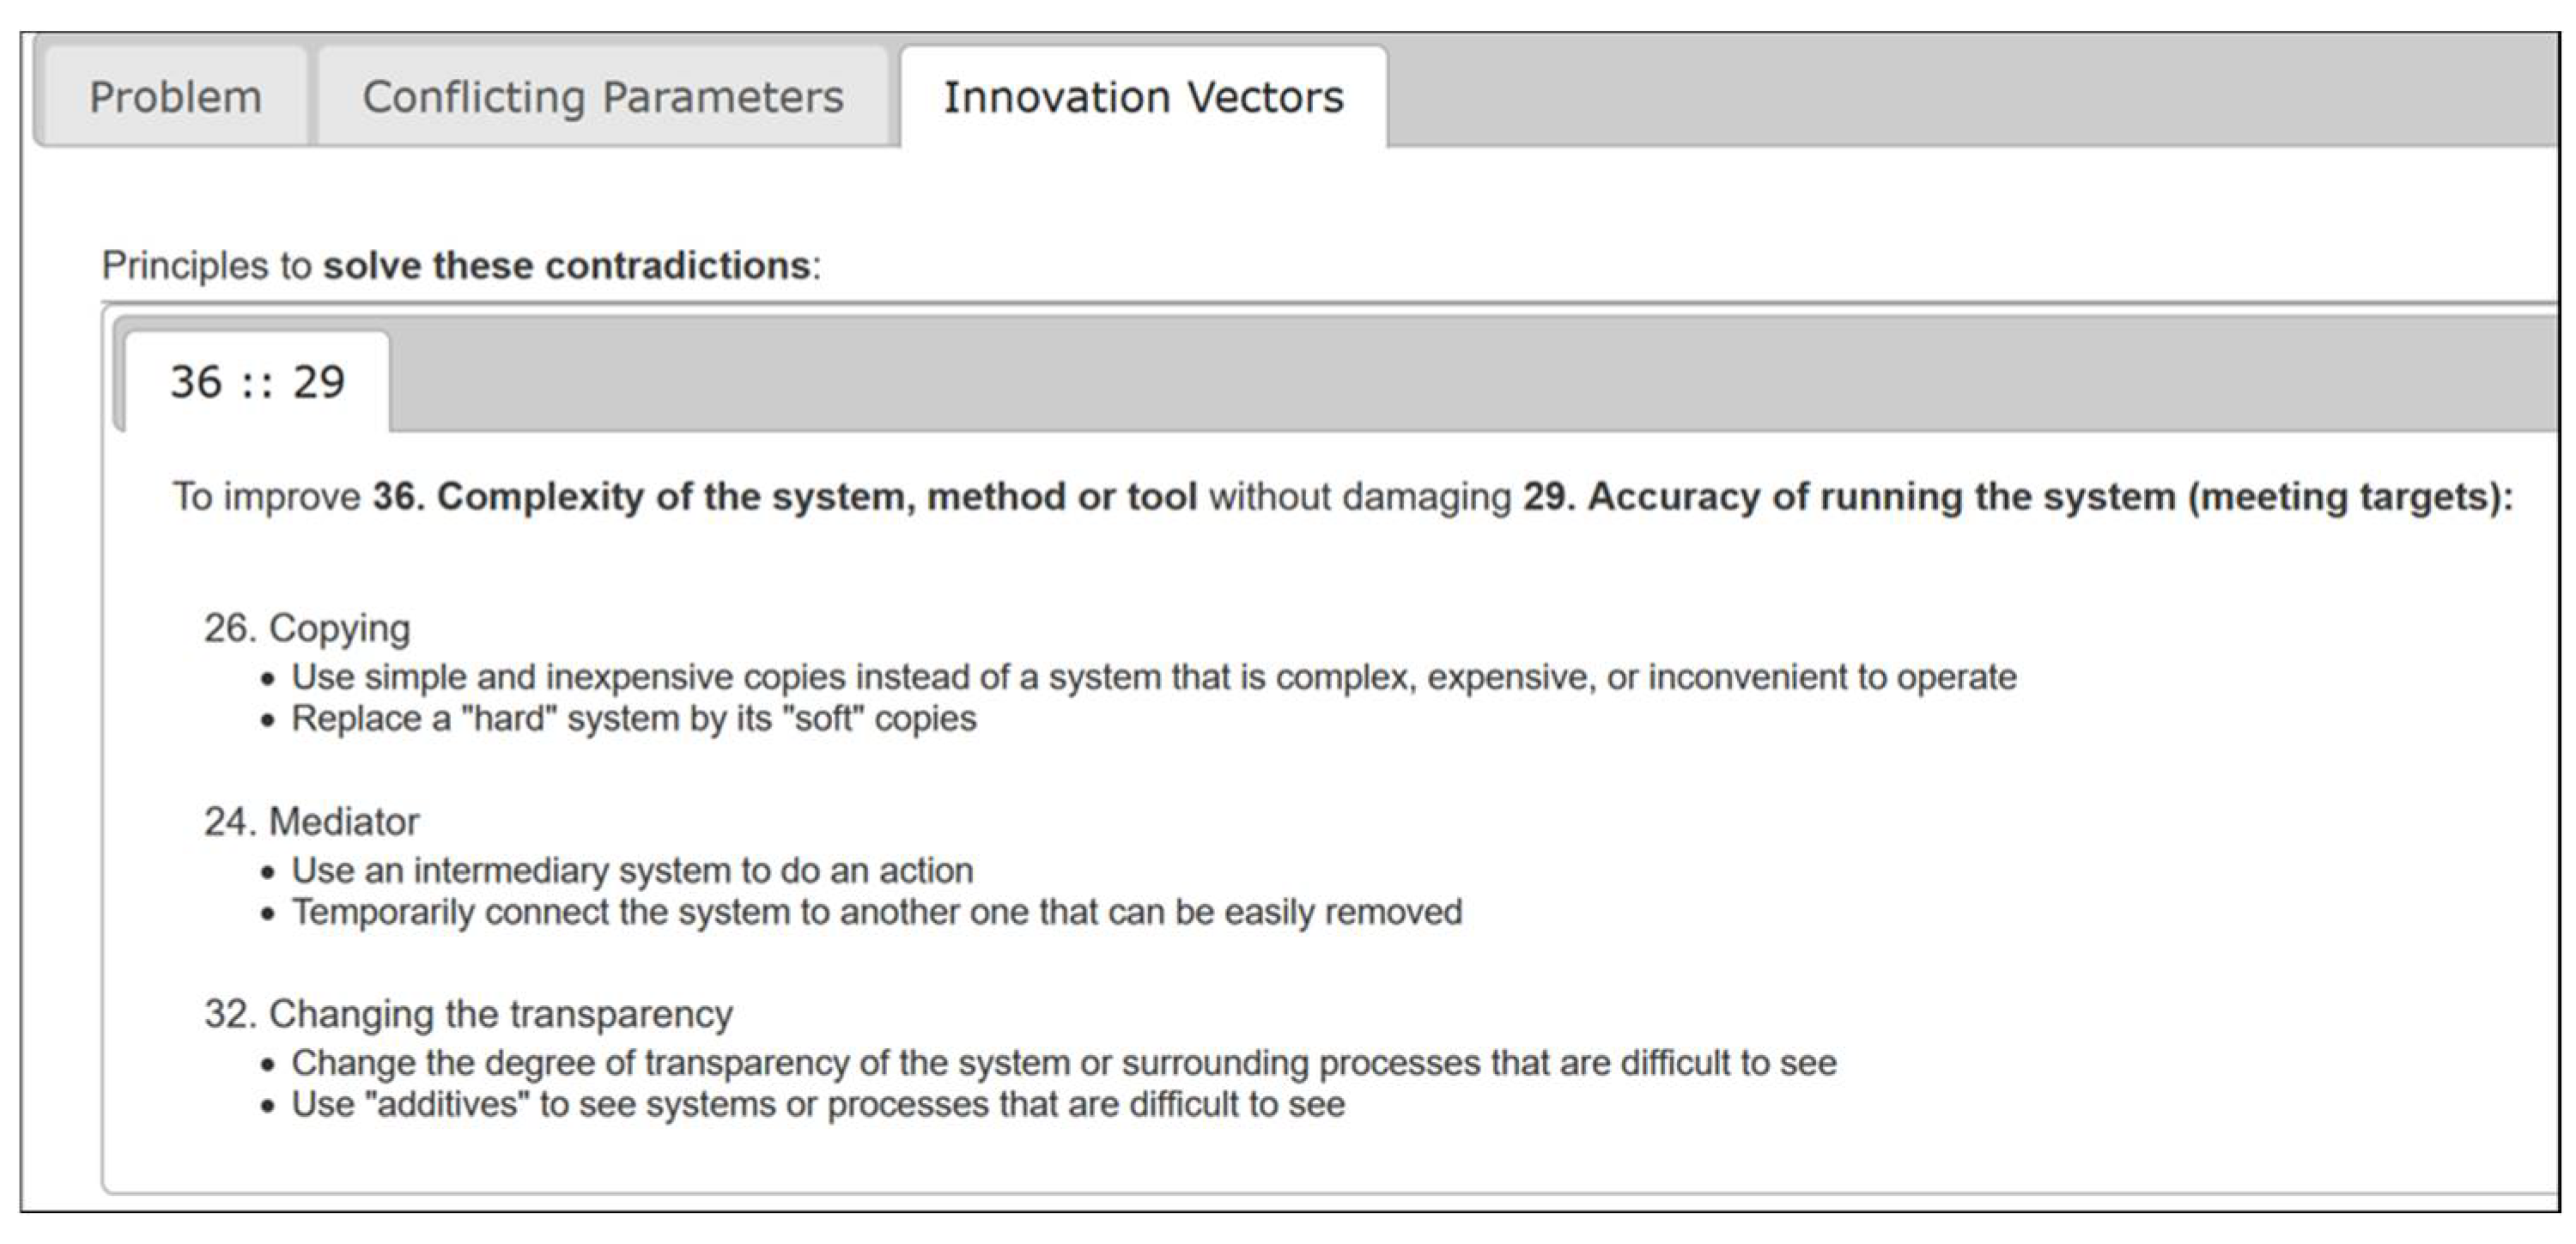
CSDT introduces a series of vectors of innovation for tackling the conflicts between various performance characteristics. They are generated by TRIZ-MC [
28], applied for solving contradictions between various performance characteristics. According to data in
Figure 3, the order of tackling contradictions, given by the indicator
K, is: (1) PC1 against PC4 (
K = −1.62); (2) PC1 against PC2 (
K = −1.29); (3) PC1 against PC3 (
K = −1.01); (4) PC2 against PC4 (
K = −0.6); (5) PC3 against PC4 (
K = −0.47) (note: the sign “−” indicates the negative correlation, or contradiction). We use the software tool available at [
30] to reveal the vectors of innovation. They are presented in
Table 2.
The large number of combinations that can be generated with the vectors from
Table 2 is not desirable from a practical point of view. Therefore, we consider the AIDA method [
39] to select the best combinations; that is, the best instance for each of the five clusters from
Table 2. To select the best vector for each decision area (column “Conflict” in
Table 2), the AIDA method operates with a list of constrains, compared to which every vector is analyzed. To relate with the SCADA system design, we have selected the following list of constrains [(c1) the possibility to make the whole commissioning by a single integrator; (c2) less or no sensitivity to various fields of technologies; (c3) easy to create connectivity between objects; (c4) easy to program].
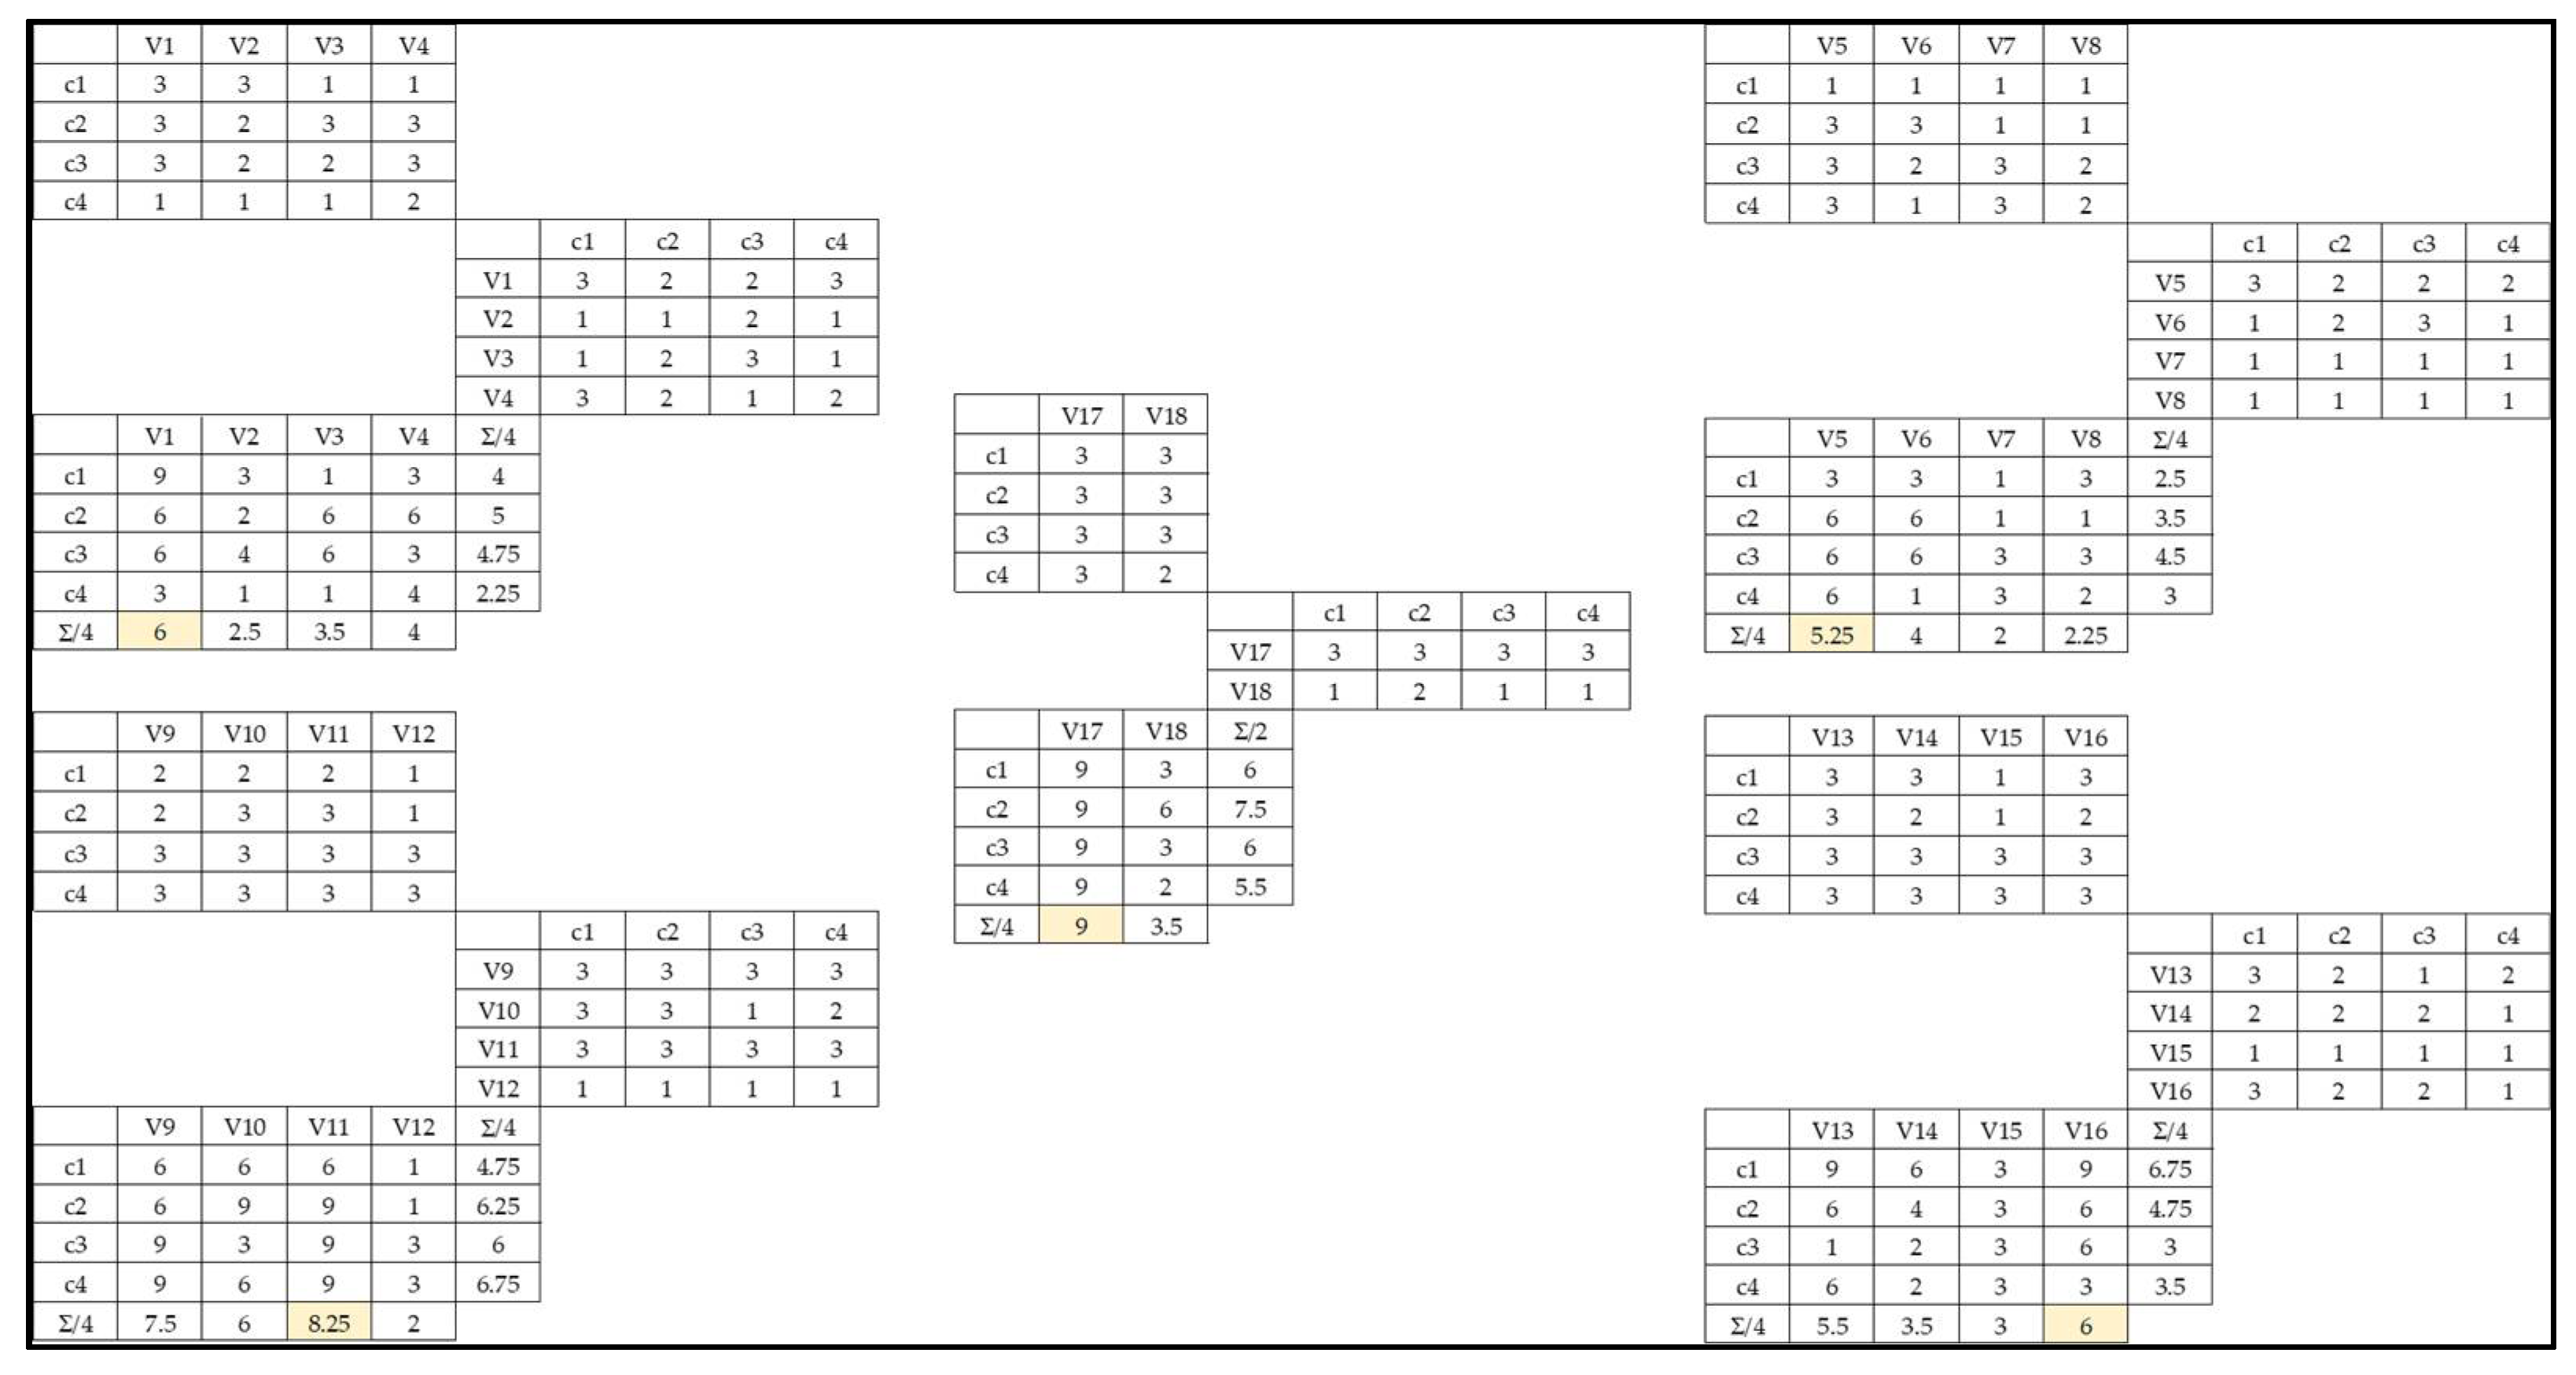
The application of the AIDA method for the list of vectors from
Table 2 is shown in
Figure 4. For each decision area, the AIDA method establishes the level of influence of each element from the row on each element from the column (1, 2, or 3). Then, the value from every box from matrix one is multiplied with the value from the corresponding box from matrix two and introduced in matrix three. The average of values on columns and rows is also introduced in matrix three. For example, in the case of vector V1 (see
Figure 4, top left corner), values in the third matrix along the V1 column are: 9 = 3 × 3; 6 = 3 × 2; 6 = 3 × 2; 3 = 1 × 3, and 6 = sum (9, 6, 6, 3)/4. For each decision area, the vector with the highest average value is selected from the list of candidate vectors from
Table 2 (see
Figure 4).
Table 3 shows the selected vectors of innovation for each decision area after the application of the AIDA method.
To manage the design process of the SCADA system, the CSDT method provides a management flow that takes information from the planning matrix (
Figure 3). The algorithm for defining the design flow is a bit laborious and can be consulted in [
40]. However, it is less important for the scope of this research. What matters here is the result; that is, the design flow. In principle, the design problem is divided into very elementary steps, following a certain rule to focus on different aspects of the design problem. In this way, a complex case (with many possible patterns of evolution) is brought to a level of analysis that is manageable by engineers.
To visualize the design flow, some conventions are used. They are further introduced: (1) symbol “<>” indicates a link between two subsequent steps from the flow; (2) the symbol “&” describes the request to analyze the correlation between two outputs; (3) the symbol “|” asks to apply a given vector of innovation (see
Table 3) to solve a negative correlation between two outputs; (4) the symbol “—” represents the process of conceptualizing, finding a partial or complete solution for a given input with respect to a given output or a pair of outputs. With these clarifications, in the next paragraph we introduce the evolutionary design flow for the SCADA system:
Flow 1: M3—(PC1&PC4)|V1 <> M4—(PC1&PC4)|V1 <> M2—(PC1&PC4)|V1 <> M1—(PC1&PC4)|V1 <> M5—(PC1&PC4)|V1
Flow 2: M3—(PC2&PC1)|V5 <> M4—(PC2&PC1)|V5 <> M2—(PC2&PC1)|V5 <> M1—(PC2&PC1)|V5 <> M5—(PC2&PC1)|V5
Flow 3: M3—(PC3&PC1)|V11 <> M4—(PC3&PC1)|V11<> M2—(PC3&PC1)|V11<> M1—(PC3&PC1)|V11<> M5—(PC3&PC1)|V11
Flow 4: M3—(PC4&PC2)|V16 <> M4—(PC4&PC2)|V16 <> M2—(PC4&PC2)|V16 <> M1—(PC4&PC2)|V16 <> M5—(PC4&PC2)|V16
Flow 5: M3—(PC4&PC3)|V17 <> M4—(PC4&PC3)|V17 <> M2—(PC4&PC3)|V17 <> M1—(PC4&PC3)|V17 <> M5—(PC4&PC3)|V17
Flow 6: M3—PC3 <> M3—PC2 <> M4—PC2 <> M4—PC3 <> M2—PC3 <> M2—PC2 <> M1—PC3 <> M1—PC2 <> M5—PC2 <> M5—PC3
The design flow comprises six sub-flows. The last sub-flow looks a bit different than the others because it treats the design with respect to two performance characteristics that are positive correlated; thus, there is no need to provoke a resolution of conflicts. The six sub-flows above presented can be tackled in more cycles (e.g., 2 or 3 cycles) if the results are not mature after the first cycle. As the flows show, the conceptualization (design) process of the SCADA system is divided into 35 elementary steps. At each increment, an elementary problem is analyzed. Thus, complexity is better administrated. As can be seen, the design process is an evolutionary one and provides a structured space for search and ideation. With this algorithm, the chances of omitting important aspects of design are significantly lowered. The whole methodological effort finally leads to the evolutionary design flow, which is effectively applied in practice to formulate a concrete solution for the SCADA system. The algorithm does not restrict the ideation space, but rather focuses ideation to the right directions. This issue is essential for avoiding trial-and-errors models, which are time consuming and usually lead to solutions that embed many compromises. Following the flow of the algorithm, some steps can be simply solved by searching onto the market for existing technologies that satisfy the request; but other steps indicate the need for new developments. This makes a leap forward to current practices of integrators that mostly count on integration of current technologies, with no focus on research and development that, in many cases, leads to suboptimal solutions with a lot of drawbacks, including the setup costs and lifecycle costs.
5. Case Study and Results
Our ambition through this case study is to propose a solution that overcomes some of the identified drawbacks of actual implementations of SCADA systems (see Section “Background”). Moreover, the ambition is also to define the SCADA system with an eye on the set of performance characteristics that describes the lifecycle perspective of the system. These performance characteristics are nominated in the first paragraph of the Section “Methodology”. They will be used as checklist for the proposed solution, knowing that by applying the lines of evolution indicated in
Figure 2, we propose a methodology for qualitative optimal design that escapes from the trap of the “curse of dimensionality”. The design flow introduced in the end part of the Section “Methodology” is further applied to design a disruptive, lifecycle-oriented solution for the SCADA system. As it will be seen, the solution proposed at the end of this process embeds cloud computing and data analytics, with significant advantages in terms of applying machine learning algorithms for preventive maintenance and for providing very valuable information about lifecycle behavior of the SCADA system that enables the improvement of future designs.
It is superfluous to present in the paper each of the 35 steps of the design flow, because this is not the focal point of the research. It is more important to indicate the generic results that came out of traversing the design flow, and rather as exemplification to illustrate some steps.
5.1. Main Outcomes from the Application of the Design Flow
The first step of the evolutionary algorithm from the methodology is: “M3—(PC1&PC4)|V1”, which is translated as: define “communication solution” to minimize “initial investment costs” and to maximize “easy commissioning”, considering in the resolution of this job the guiding vector “replace hard parts of the system with reconfigurable modules”. A reconfigurable module is a module that embeds the following properties: scalability, convertibility, modularity, flexibility, and integrability. The current solutions of communication include many intermediary hardware modules at the level of communication network (e.g., radio, GPRS, satellite, VPN, Internet). A solution to reduce complications with these technologies is to replace them with IoT and cloud computing. IoT is modular, flexible, integrable, convertible, and scalable; thus reconfigurable. By adopting this type of communication, costs with integrators are drastically reduced. Commissioning is sharply simplified, because most of the work with setting up and programming the control logic can be done without locating specialized personnel in the field.
The second step of the evolutionary algorithm is: “M4—(PC1&PC4)|V1”, which means: define “local control solution” to minimize “initial investment costs” and to maximize “easy commissioning”, considering in the resolution of this job the guiding vector “replace hard parts of the system with reconfigurable modules”. Searching on the internet with the keywords that describe reconfigurability (see the above paragraph) on control units, we have identified several researches and technologies in the paradigm “master-slave”, with reconfigurable master unit, and with CPSs (e.g., smart sensors, smart actuators, etc.). A special attention was assigned to industrial technologies that respect these properties, for the main reason of high reliability in intensive industrial tasks. Among these technologies we have identified the presence of modular PLCs units that can be easily configured for distributed local networks and can be linked with no effort to IoT-based communication solutions.
We followed the next steps of the evolutionary algorithm in the same manner as the first two presented above. It does not make much sense to put all these steps here, because this process does not reflect the focus of the paper. However, four more steps from the algorithm have been selected for presentation to highlight the way we addressed the other four key vectors of innovation. In this respect, for exemplification, we introduce here the steps: ”M2—(PC2&PC1)|V5”, “M1—(PC3&PC1)|V11”, “M5—(PC4&PC2)|V16”, “M2—(PC4&PC3)|V17”.
“M2—(PC2&PC1)|V5” is formulated as: define “broker solution” to increase “redundancy for safety” without affecting “costs of initial investment”, considering in the resolution of this issue the principle “each part to be placed under the most favorable conditions for operation”. In practice, redundancy is usually about doubling some elements in the system such that, in the case that one of them is down, the other one enters into action to compensate the temporary unavailability of the first one. Redundancy for safety on the broker’s side is defined by the architecture of the MQTT broker. Indication “each part to be placed under the most favorable conditions for operation” leads us to the idea of setting up a cluster environment for high availability of MQTT. Searching for existent technologies onto the market, we have identified that HiveMQ provides such facility without involving additional costs, just a special configuration of a cluster of brokers. In the cluster, a message only gets forwarded to other cluster nodes if a cluster node is interested in it. This permits to build a big cluster with a lot of nodes because it reduces the network traffic, and this prevents nodes from forwarding unnecessary messages. In addition, cluster subscriptions work dynamically. As soon as a client on a node subscribes to a topic it becomes known within the cluster. If one of the clients from the cluster publishes to this topic, the message will be delivered to its subscriber no matter to which cluster node it is connected. HiveMQ uses a message serialization mechanism to share publishes between cluster nodes, which significantly reduces the network traffic between nodes. When a cluster node where a client subscribes goes down, we need to have an advanced logic such as the client to connect to another node. To avoid the problem of reconnecting on the client side, the traditional solution is to have an advanced reconnect logic where the client connects to another cluster node, but the fallback IP could be hard-coded, and this is not desirable. Therefore, the innovation vector “each part to be placed under the most favorable conditions for operation” suggests the use of a “load balancer”, which permits the construction of a high availability environment without the need of implementing any advanced reconnecting logic on the client side. This approach can be easily used with devices that are already deployed in the field, with no need to change their already configured connection information. This solution avoids additional costs to configure and commission the SCADA system, as well as requiring less skills and dramatically reduces the implementation time.
The design step “M1—(PC3&PC1)|V11” looks like this: define the “cloud solution” such that to improve “architectural reliability” without increasing the “investment costs”, considering the guiding vector “replace hardware with software”. This indicates to operate “soft” interventions. To increase architectural reliability from the cloud perspective, we must avoid various potential failures in cloud computing systems. To reduce initial investment costs, the solution is to use the cloud services of a third party. Thus, reliability issues must be treated with the cloud provider. They are related with availability and resilience. Cloud platforms are intrinsically built to tolerate failures and provide features to help build reliable and highly available systems. High availability is usually accomplished with redundant deployments of the system, meaning that two or more identical application instances run simultaneously (or only one instance is active or primary at a time, and the second one on standby). To make the solution resilient, it is necessary to design the application that runs on the cloud as highly decoupled microservices (i.e., small services focused on performing a specific business function). This design enables a resilient behavior, meaning that when one service fails, the others can continue working. It also allows continuous delivery, with each service updated and deployed independently without interruptions.
In the case of the design step “M5—(PC4&PC2)|V16”, the challenge is to define “field solution” so that to have an “easy commissioning” without affecting “redundancy for safety”. To tackle the challenge, the core vector of innovation is “extract some functions or units and consider a way around”. Field solution is referring to the field devices, augmented with intelligence and communication capabilities. Redundancy for safety is not referring to doubling devices, which can be done for very critical aspects, as it is happening in aviation. In this case, redundancy for safety is looking for avoiding the breakdown of communication between field devices and the local control unit. To be aligned with “extract some functions or units and consider a way around”, the solution is to analyze both the communication protocol and connections, including contacts, etc. Operating with CPSs might generate a problem from this point of view, therefore we have investigated what possibilities exist to the level of PLCs for ensuring local fieldbus communication in a safe way. We have identified solutions to easily create redundancy in the local communication network, but this requires at least two PLCs as slaves and one as master. Usually, in a WWT installation or plant there are several PLCs installed for the local control; thus, this strategy is plausible. In terms of fieldbus communication, PROFIBUS supports the before mentioned strategy.
For the last design step exemplified in the paper, “M2—(PC4&PC3)|V17”, the goal is to define a “broker solution” such that to have a good “architectural reliability” without complicating “commissioning”. To tackle this job, the vector of innovation is “compensate possible low reliability with countermeasures in advance”. In a paragraph before we have already mentioned about the solution proposed for “broker”. It has a high reliability; however, a supra-control is very useful if it can be done without affecting the effort for commissioning. The solution aligned with the vector of innovation is the inclusion of a flow-based tool that connects hardware, services, etc. There are such tools available, easily programmable with visual objects, reliable, and some of them are for free (e.g., node-RED).
The final selected solution for the new SCADA architecture is illustrated in
Figure 5. It also visualizes the selected technologies we have decided to integrate within the validation workbench. Details on these aspects is provided in the following sections of the paper.
However, several other technologies for the IoT broker, API platform, local control units, and cloud computing exist on the market. This means that the proposed architecture can also be built with alternative technologies. For example, Allen Bradley can be a reliable alternative to Siemens PLCs and IoT gateway. Azure or AWS can anytime be an alternative to IBM cloud, but also any private cloud can replace the proposed one. For some reasons (e.g., latency), local private clouds are preferable. However, this comes with a high investment, therefore the wise approach is to share a private cloud resource with some other local enterprises, or to rent local cloud resources from providers located in the geographical proximity. The HiveMQ broker can be replaced with Waterstream or Kafka without affecting system’s performances. Flow, n8n.io, ioBroker, ThingsBoard.io, iot-dashboard, AWS IoT, and other platforms are a good alternative to node-RED for interfacing heterogeneous objects and services.
5.2. Validation Workbench
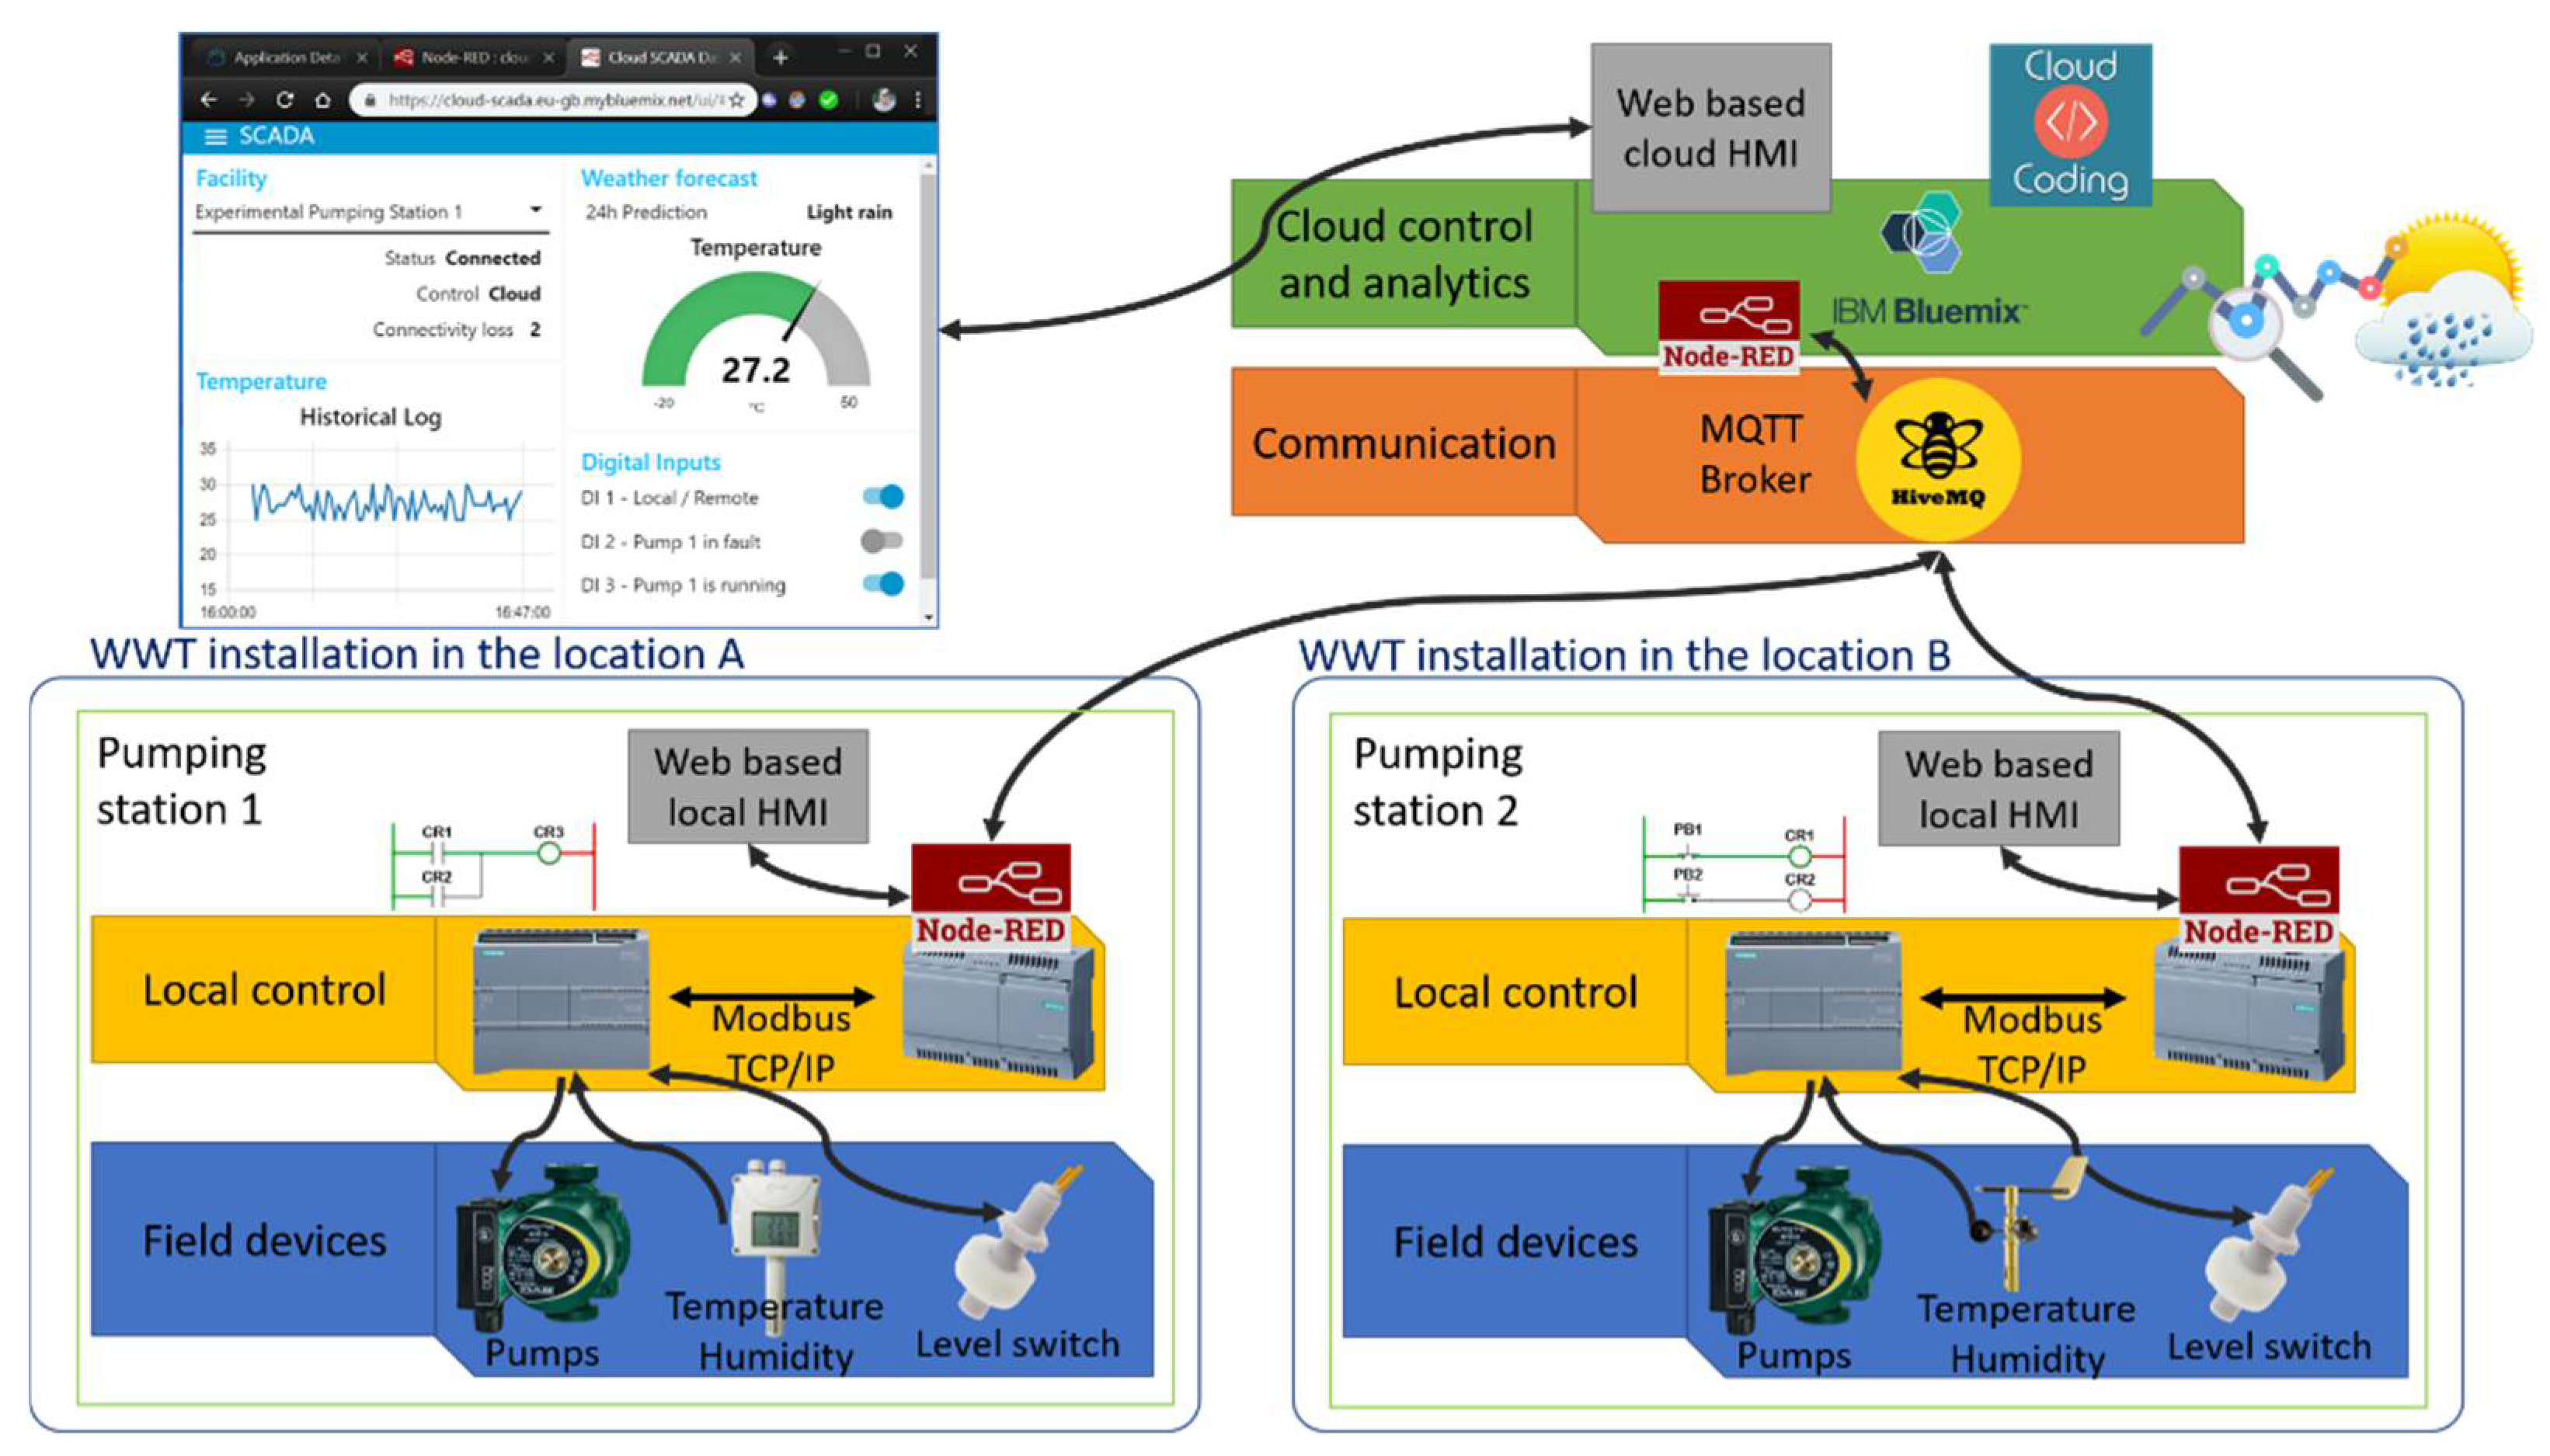
As a validator, the case study takes the generic outcomes from
Section 5.1 and applies them to an experimental workbench of a technological unit from WWT industry, namely, a pumping station. The pumping station has two pumps, and it is controlled by a programmable logic controller (PLC) [
43]. Two level switches are used to detect the water level in the tank. The PLC is included as part of the CPS concept, but with a clear advantage in terms of resilience and safety, meaning that, in the case of some accidents (outside the control capacity of the operator) the internet connectivity is down, the logic embedded in the PLC can run the station safely, until the connection is re-established. For communication, an industrial certified IoT gateway is used to exchange data between the pumping station control unit and the cloud service via a Message Queuing Telemetry Transport (MQTT) protocol broker [
44]. The architecture of the proposed experimental workbench for a WWT installation is presented in
Figure 6.
The complete pumping station control logic and data analytics runs in the cloud platform and the required actions are transferred to the pumping station at specific time intervals. In the case of connectivity-loss between the PLC and the cloud service, a local control logic that is implemented in the PLC takes over the control, as it was already mentioned in a previous paragraph. The local control logic is designed to provide a set of minimum requirements considering technological functionalities of the pumping station. When the connectivity with the cloud platform is re-established, control of the pumping station is turned back to the control logic that runs on the cloud platform.
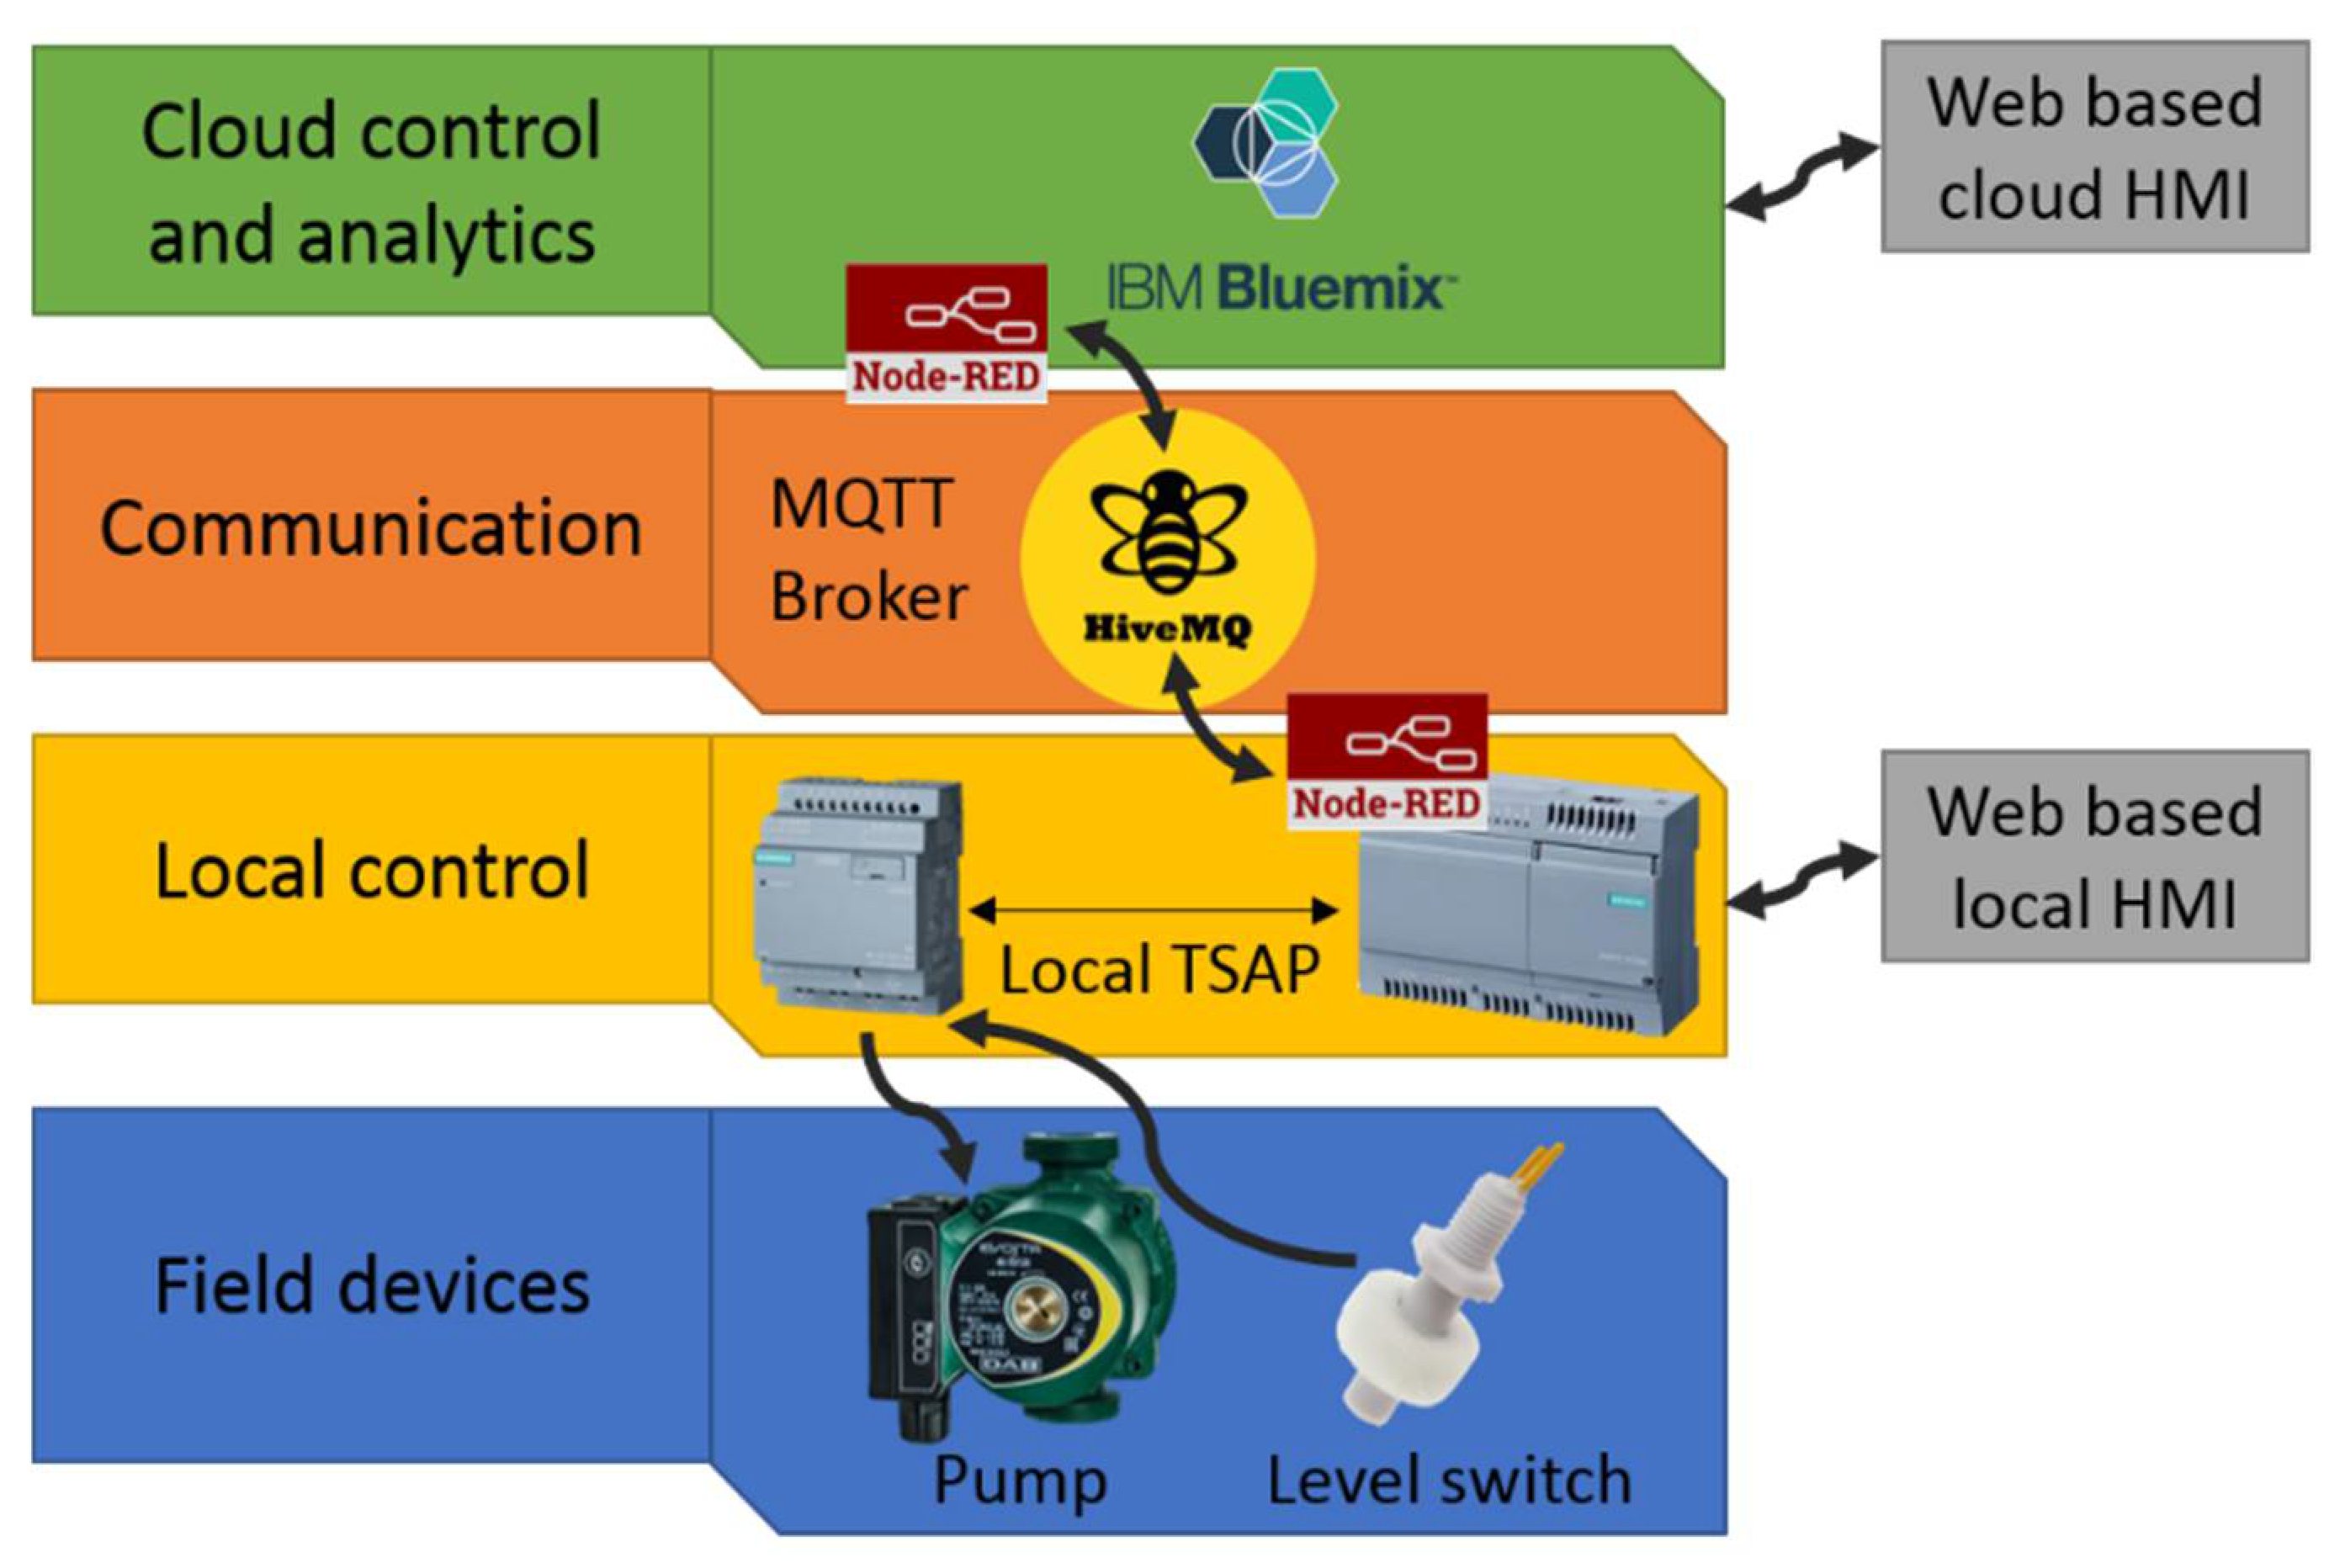
A local Transport Services Access Point (TSAP) is established between the local PLC and the IoT gateway. In the experimental workbench we have installed Siemens’s technology, which provides reliable and safe local communication and compatible interface units between PLC and web. The use of node-RED programming tool creates the possibility to easily design (i.e., using visual objects) both the environment for wiring together hardware devices, APIs, and online services, as well as to design with visual objects the local Human-Machine Interface (HMI) that is accessible from browser. This offers a huge advantage in terms of accessibility and flexibility for monitoring the WWT process. As an IoT broker, we have selected one of the most reliable solutions from the market, specifically the HiveMQ [
45]. A comparison of various MQTT technologies can be found at [
46]. Thus, alternatively to our choice, some other valuable technologies are already available. Our decision to select HiveMQ stands in the fact that this IoT broker is designed for cloud native deployments to make optimal use of cloud resources. MQTT for HiveMQ reduces network bandwidth required for moving data; thus, it leads to efficient IoT solutions that lower the total costs of operation over the lifecycle. Additionally, HiveMQ connects any device and backend system in a reliable and secure manner via the IoT standard protocol MQTT and ensures a quick send and receive of data from connected devices (a key safety aspect for WWT installations). HiveMQ is also architected for scalability and reliability and uses industrial standards to reduce the risk of losing data. The open API of this broker allows flexible integration of IoT data into enterprise systems and pre-built extensions for quick integration to other enterprise systems such as Kafka, SQL, and NoSQL databases. Finally, it has a multi-cloud strategy that allows the MQTT broker to be deployed on private, hybrid, and public clouds. This represents a big advantage in terms of agility, redundancy, and flexibility over lifecycle. For cloud computing, in this experimental workbench we opted for IBM Bluemix (now branded IBM Cloud) [
34,
47]. It offers a web-based cloud HMI; and with node-RED it can be easily connected to the IoT broker. Our option for this cloud technology was influenced by a series of advantages, such as the possibility to merge public, private, hybrid and multi-cloud, and inclusion of AI algorithms for fast and easy data analytics, without the need of advanced programming skills, but also because it is easy to use and is unified across multiple deployments and supports mission critical workloads.
There are several other advantages of the proposed SCADA control architecture compared to the traditional way of controlling technological functionalities related to the WWT industry. Some of the most important ones are further highlighted:
We can reduce the costs related to local control unit (e.g., work memory) since the control logic runs in cloud and only reduced functionalities are implemented in the PLC. Therefore, we do not need to consider high-performance control units for local control; simpler and cheaper models of PLCs are sufficient to fulfill the job.
Adding or removing functionalities in the cloud control logic is much easier and it can be done without being physically present in the field; thus, lowering the operational costs over lifecycle and initial investment costs. This ends with reduced commissioning and adjustments costs with solution integrators and control units.
Commissioning can be done remotely, without involvement of experienced personnel in the field. This is done by analyzing data received on the cloud platform and adjusting the control logic accordingly.
The architecture is highly reliable and scalable. Similar control functions and data processing algorithms can be used for geographically distributed technological units, providing repeatable control logic results. If adjustments are required after deployment, they can be easily done in the control logic developed on the cloud to redefine all technological functions of WWT installations without additional field actions.
There is no need to pay static IPs to communication technology providers in order to access the intelligent gateway; thus, reducing the lifecycle costs of the system.
The control logic that runs on the cloud computing engine can be correlated with other services. For example, meteorological information and alerts can trigger the process of emptying a pumping station to preserve bacteria concertation for technological process reactions within specific limits or to provide the required inlet capacity of the sewage system.
The know-how for controlling the technological process stays in the property of the utility company; thus, avoiding captivity to some integrators.
The subsequent sections provide a more detailed description of how the most important components of the local control units were configured and how they work.
5.2.1. Local Control Unit
The local control unit has a Logo8! PLC manufactured by Siemens (Munich, Germany), which controls the two pumps and reads the status at the level of switches. An IOT2040 IoT gateway manufactured by Siemens is used to read or write data to the PLC by means of a communication protocol and exchange data with the cloud control platform [
44].
When local control is selected or when the connectivity with the cloud computing platform is not available because the internet connection is down, the local control unit uses the local control logic that is designed so to provide the minimum technological requirements with respect to the operating and technological modes of the station. Three operating modes and two technological modes of the pumping station were implemented by software means and loaded into the local control unit.
The first operating mode uses one pump while the second pump is used just in case the first pump requires maintenance or is tripped due to overload or overcurrent. The second operating mode uses both pumps at the same time. The third operating mode periodically alternates the two pumps to balance the workload of the pumps. In the empty technological mode, the pumping station starts if the water in the tank reaches the second level switch and stops if the water reaches the first level switch. In the fill mode, the pumping station starts if the first level switch is reached and stops if the water reaches the second level switch.
These operating and technological modes were considered due to the multitude of uncertainties experienced by the authors in the field of WWT industry. Mainly, uncertainties are generated by technological design mistakes or major changes in water characteristics (e.g., water flow, water requirement).
Siemens IOT2040 is enhanced with a Yocto Linux distribution as the operating system [
44]. On top of the operating system the Node-RED programming and runtime environment, with specific functions or nodes, is installed [
32].
5.2.2. TSAP Connectivity
The IoT gateway uses a special developed library named
node-red-contrib-s7 to communicate with Siemens PLCs [
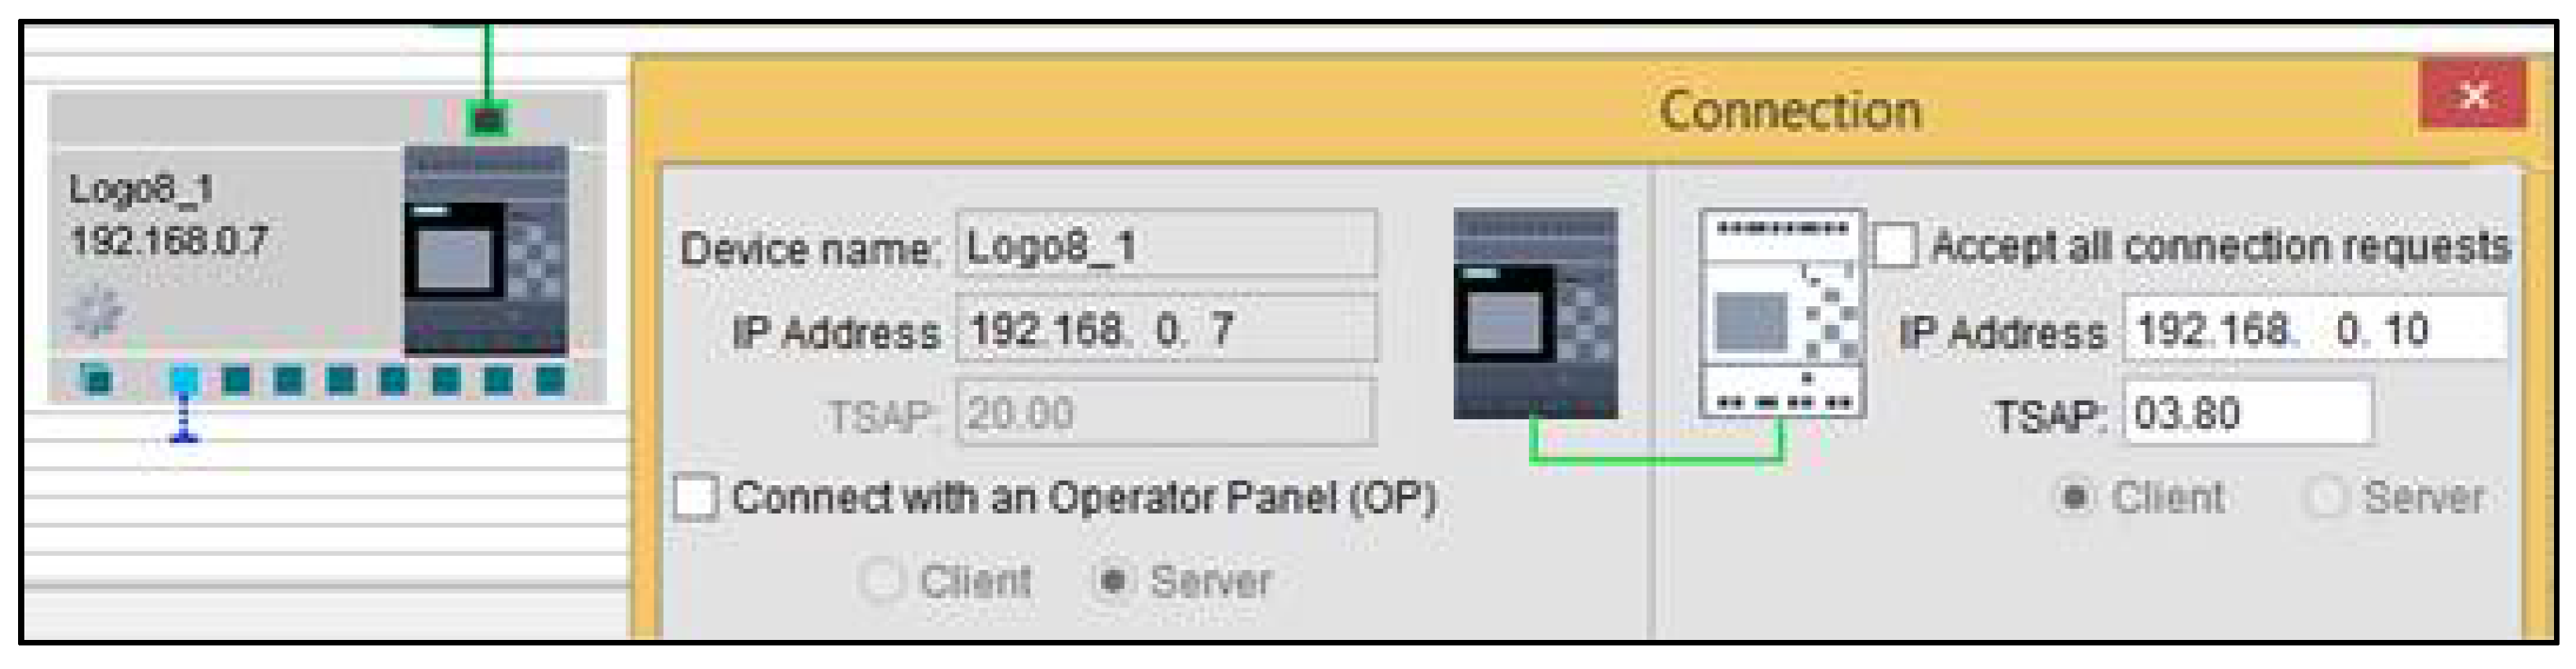
32]. A software method to connect to Logo8! PLCs considers the end-point communication protocol named Transport Service Access Point (TSAP) which defines the channel used for the communication and the number of the communication modules between the server and the client on top of local network (TCP/IP).
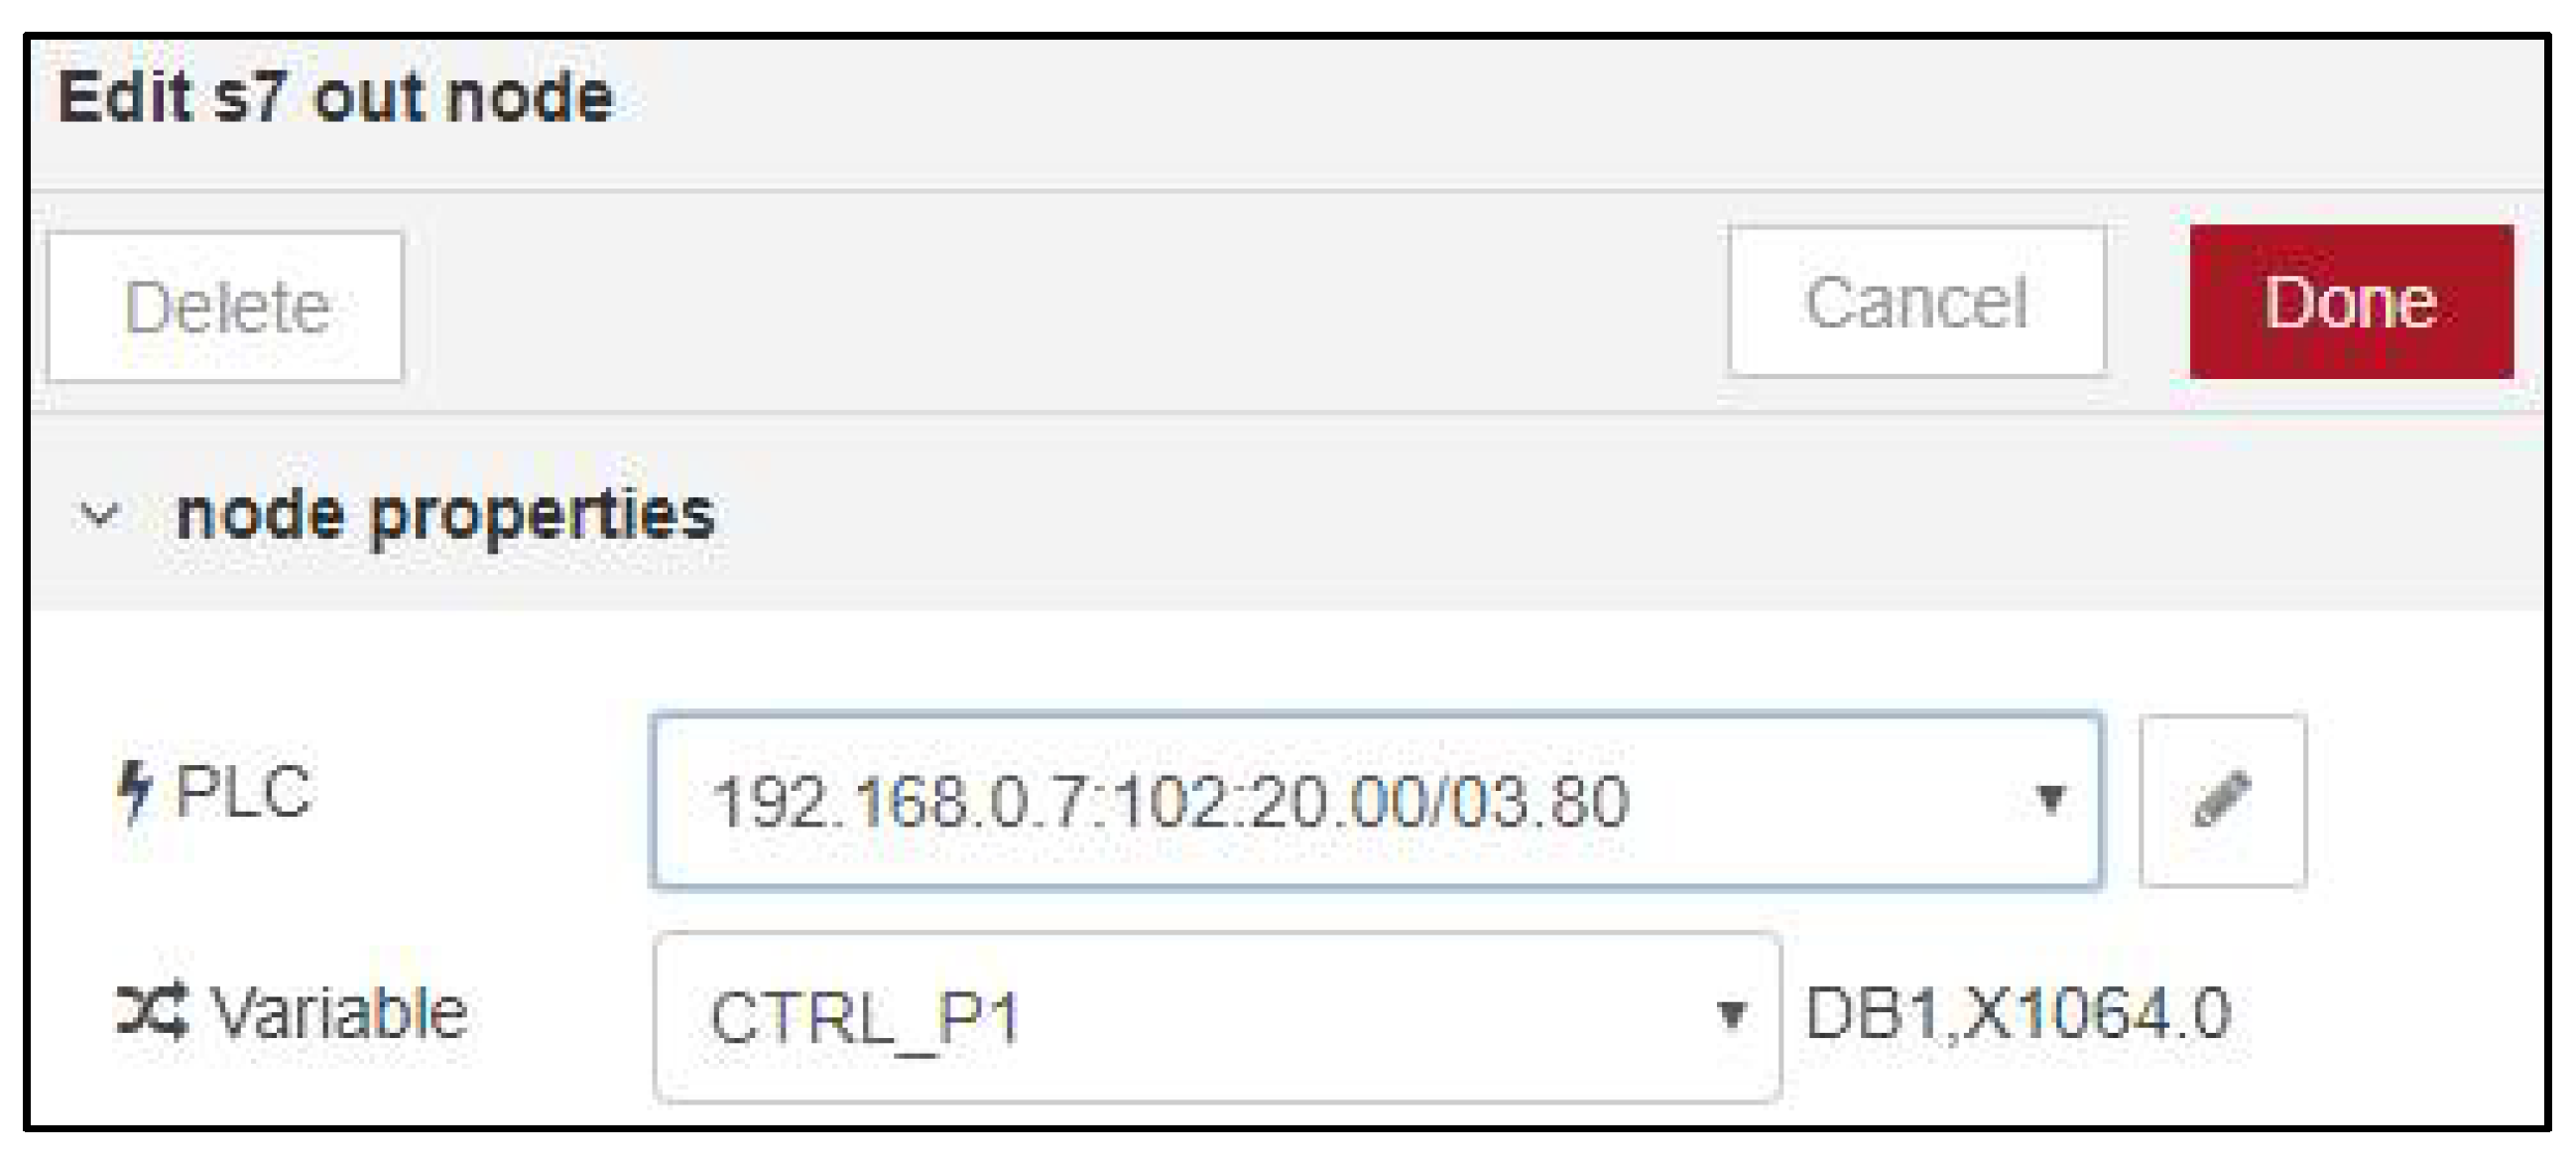
In this experimental workbench, the PLC is configured as a Server with its own IP address, and it can be accessed by a Client with the configured IP address using the channel with the number 20. Since the PLC comes with internal communication functionalities, the number of the communication module is 00. Therefore, the PLC TSAP is 20.00. Depending on the equipment that accesses the server, TSAP configuration must be changed accordingly. The TSAP for the client is configured to 03.80, as seen in
Figure 7.
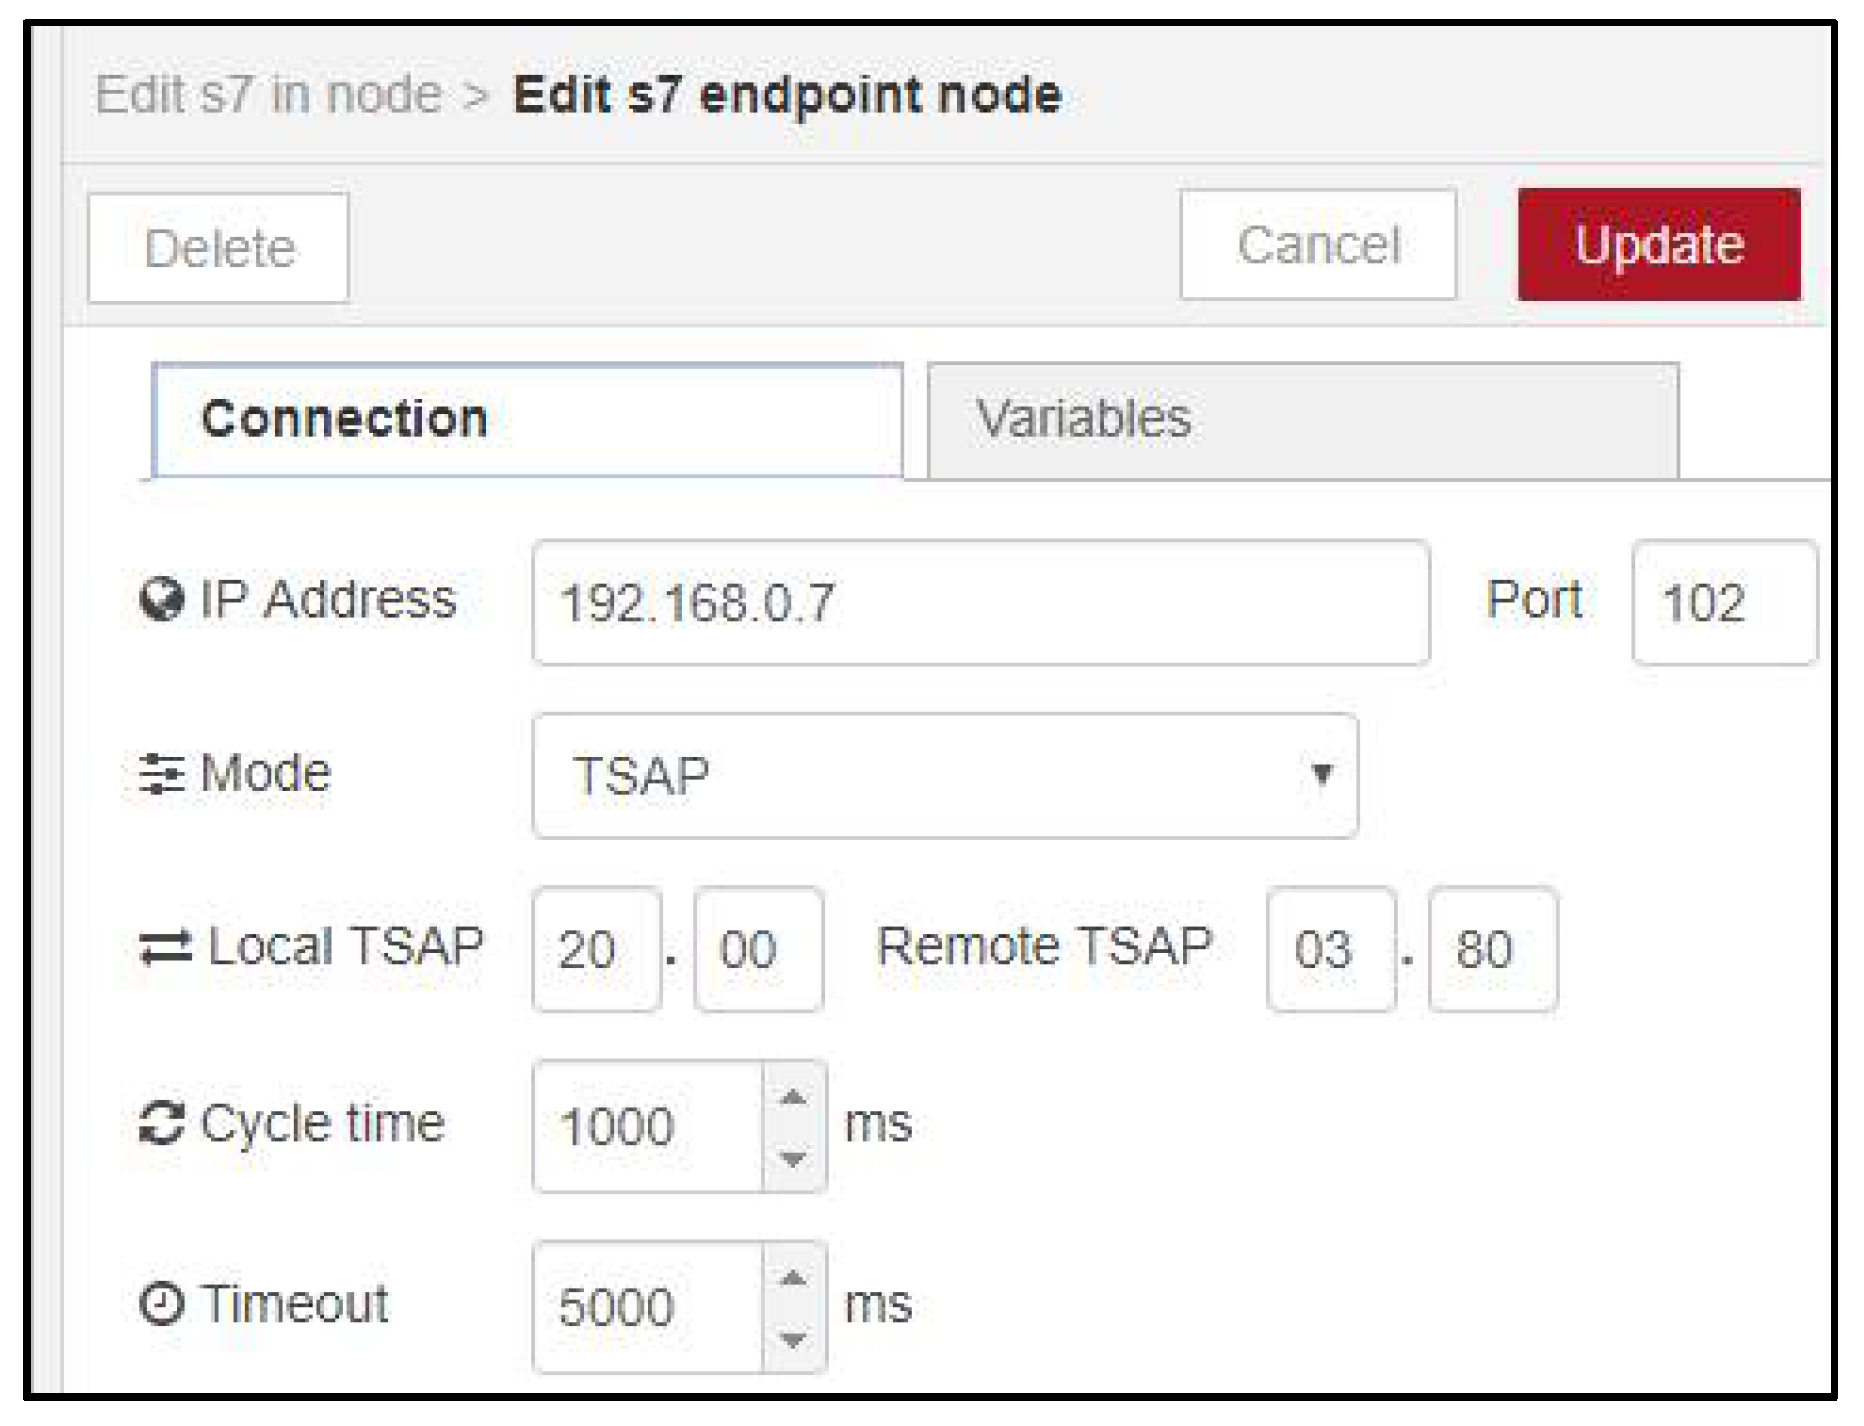
On the node-RED application side, which runs on the IOT2040 IoT gateway, the S7 in operation was configured as the TSAP configuration for PLC. Additionally, the IP of the PLC, the cycle time for reading data and connection timeout were configured, as it is seen in
Figure 8.
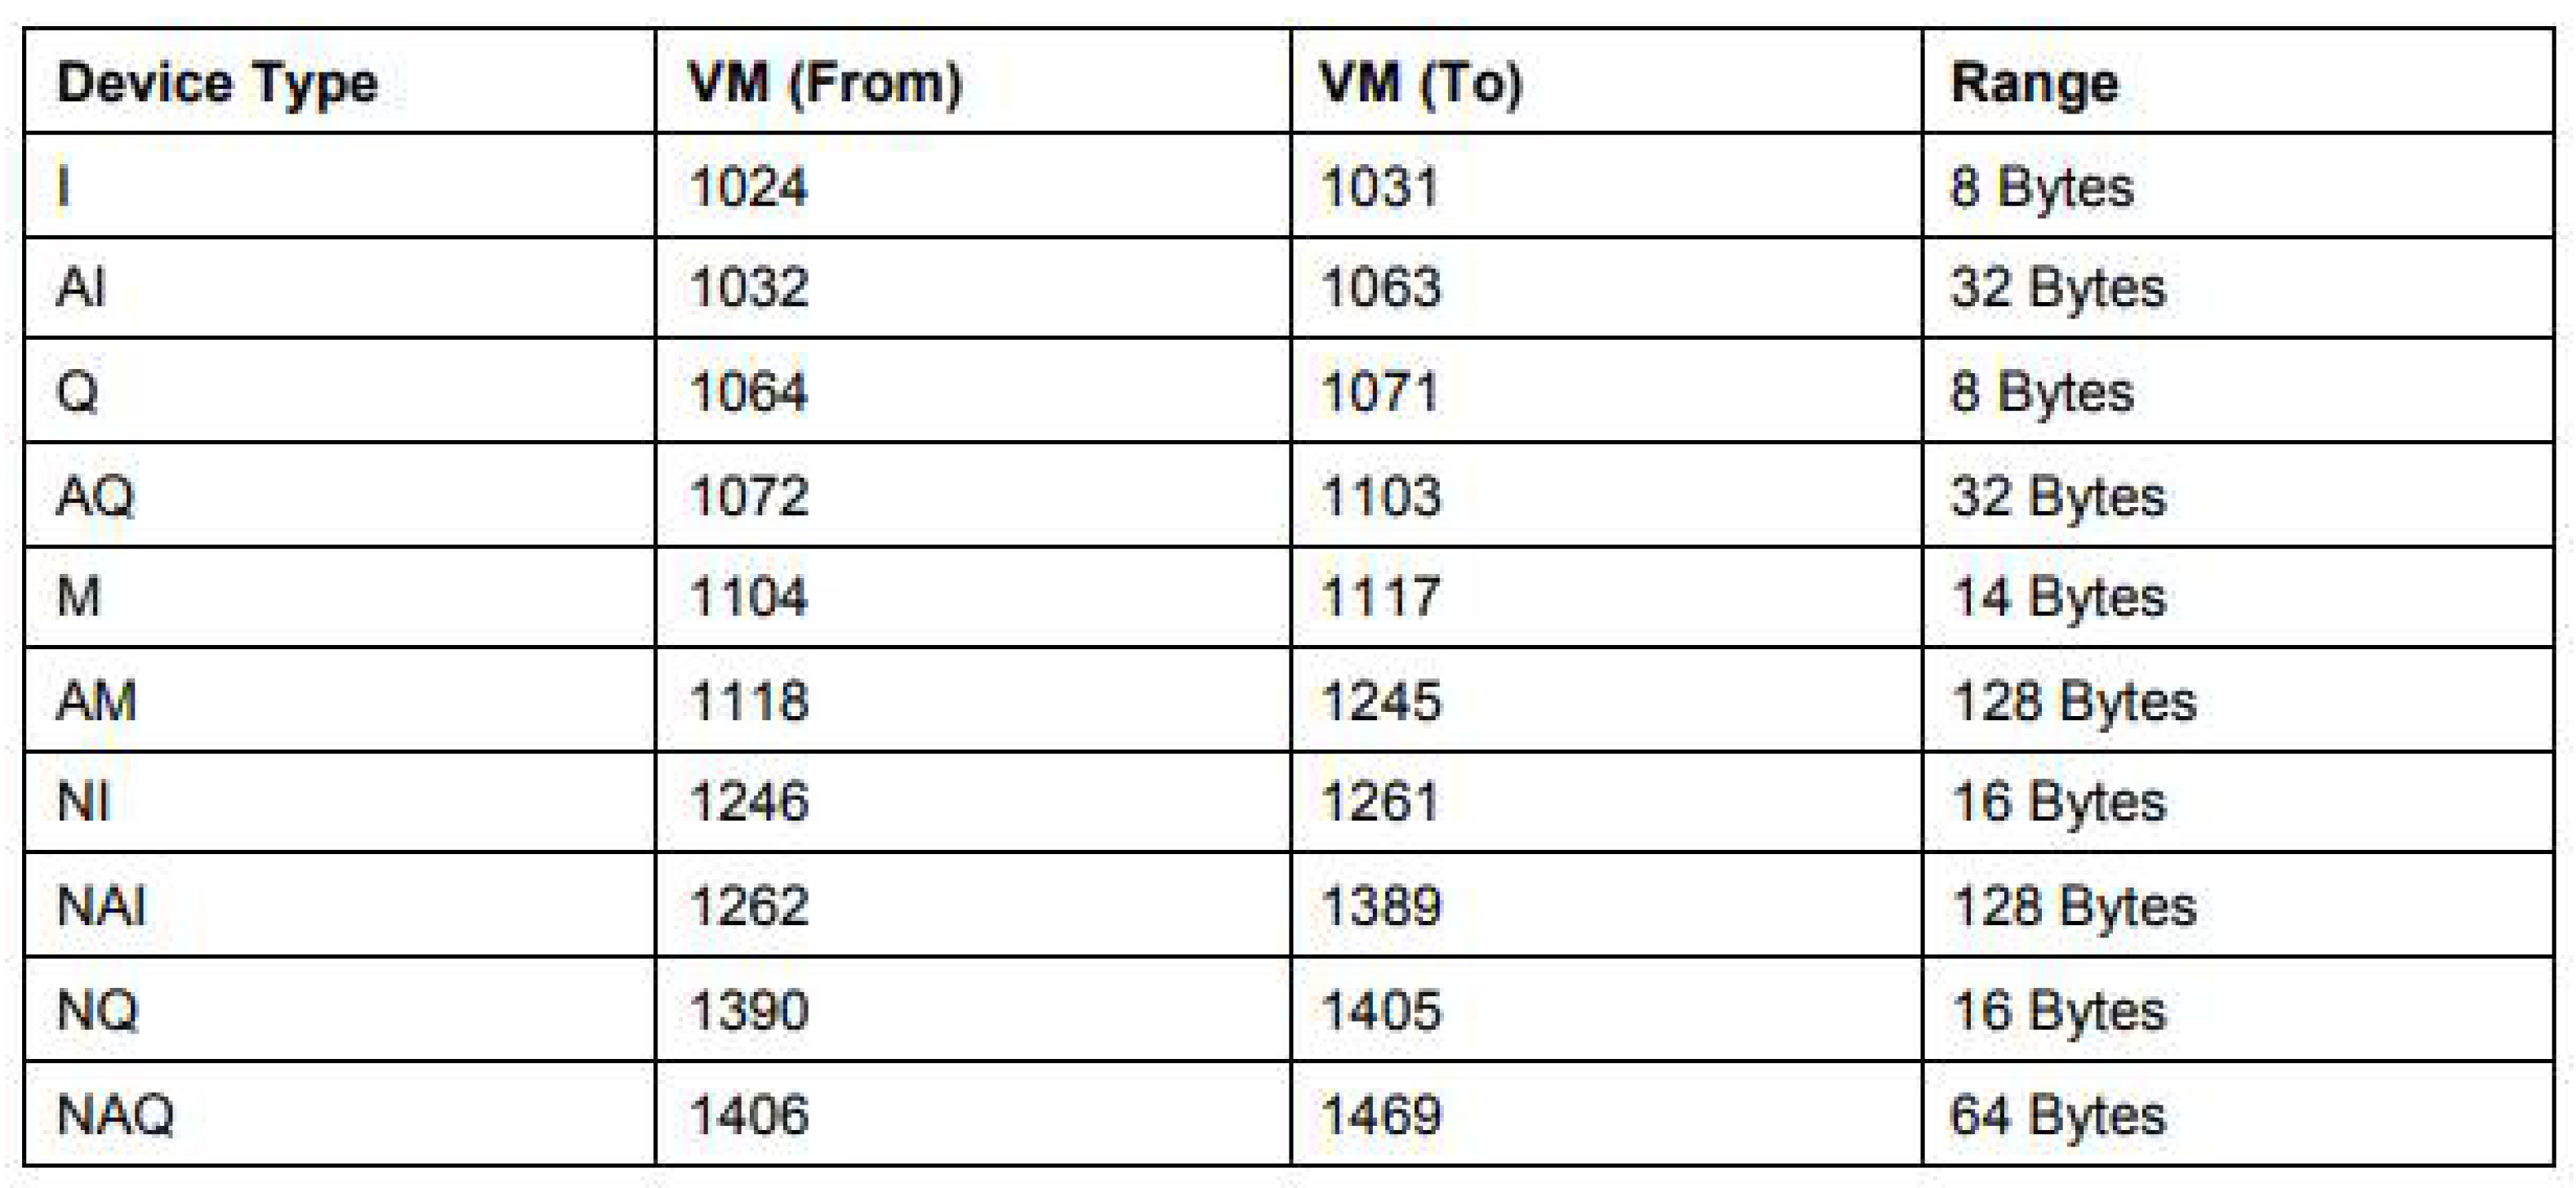
Writing or reading data, inputs, and outputs in Logo8! PLC is achieved by means of
s7 in and
s7 out node-RED functions [
32] with respect to mapping resources in the memory of the PLC and the variable memory table (see
Figure 9 and
Figure 10).
Therefore, the node-RED application that runs on the IOT2040 to read the first digital input of the PLC needs to access the memory zone
DB1,X1024.0. While writing the first digital output of the PLC, the memory zone that must be accessed is
DB1,X1064.0, as it is seen in
Figure 10.
5.2.3. User Interface
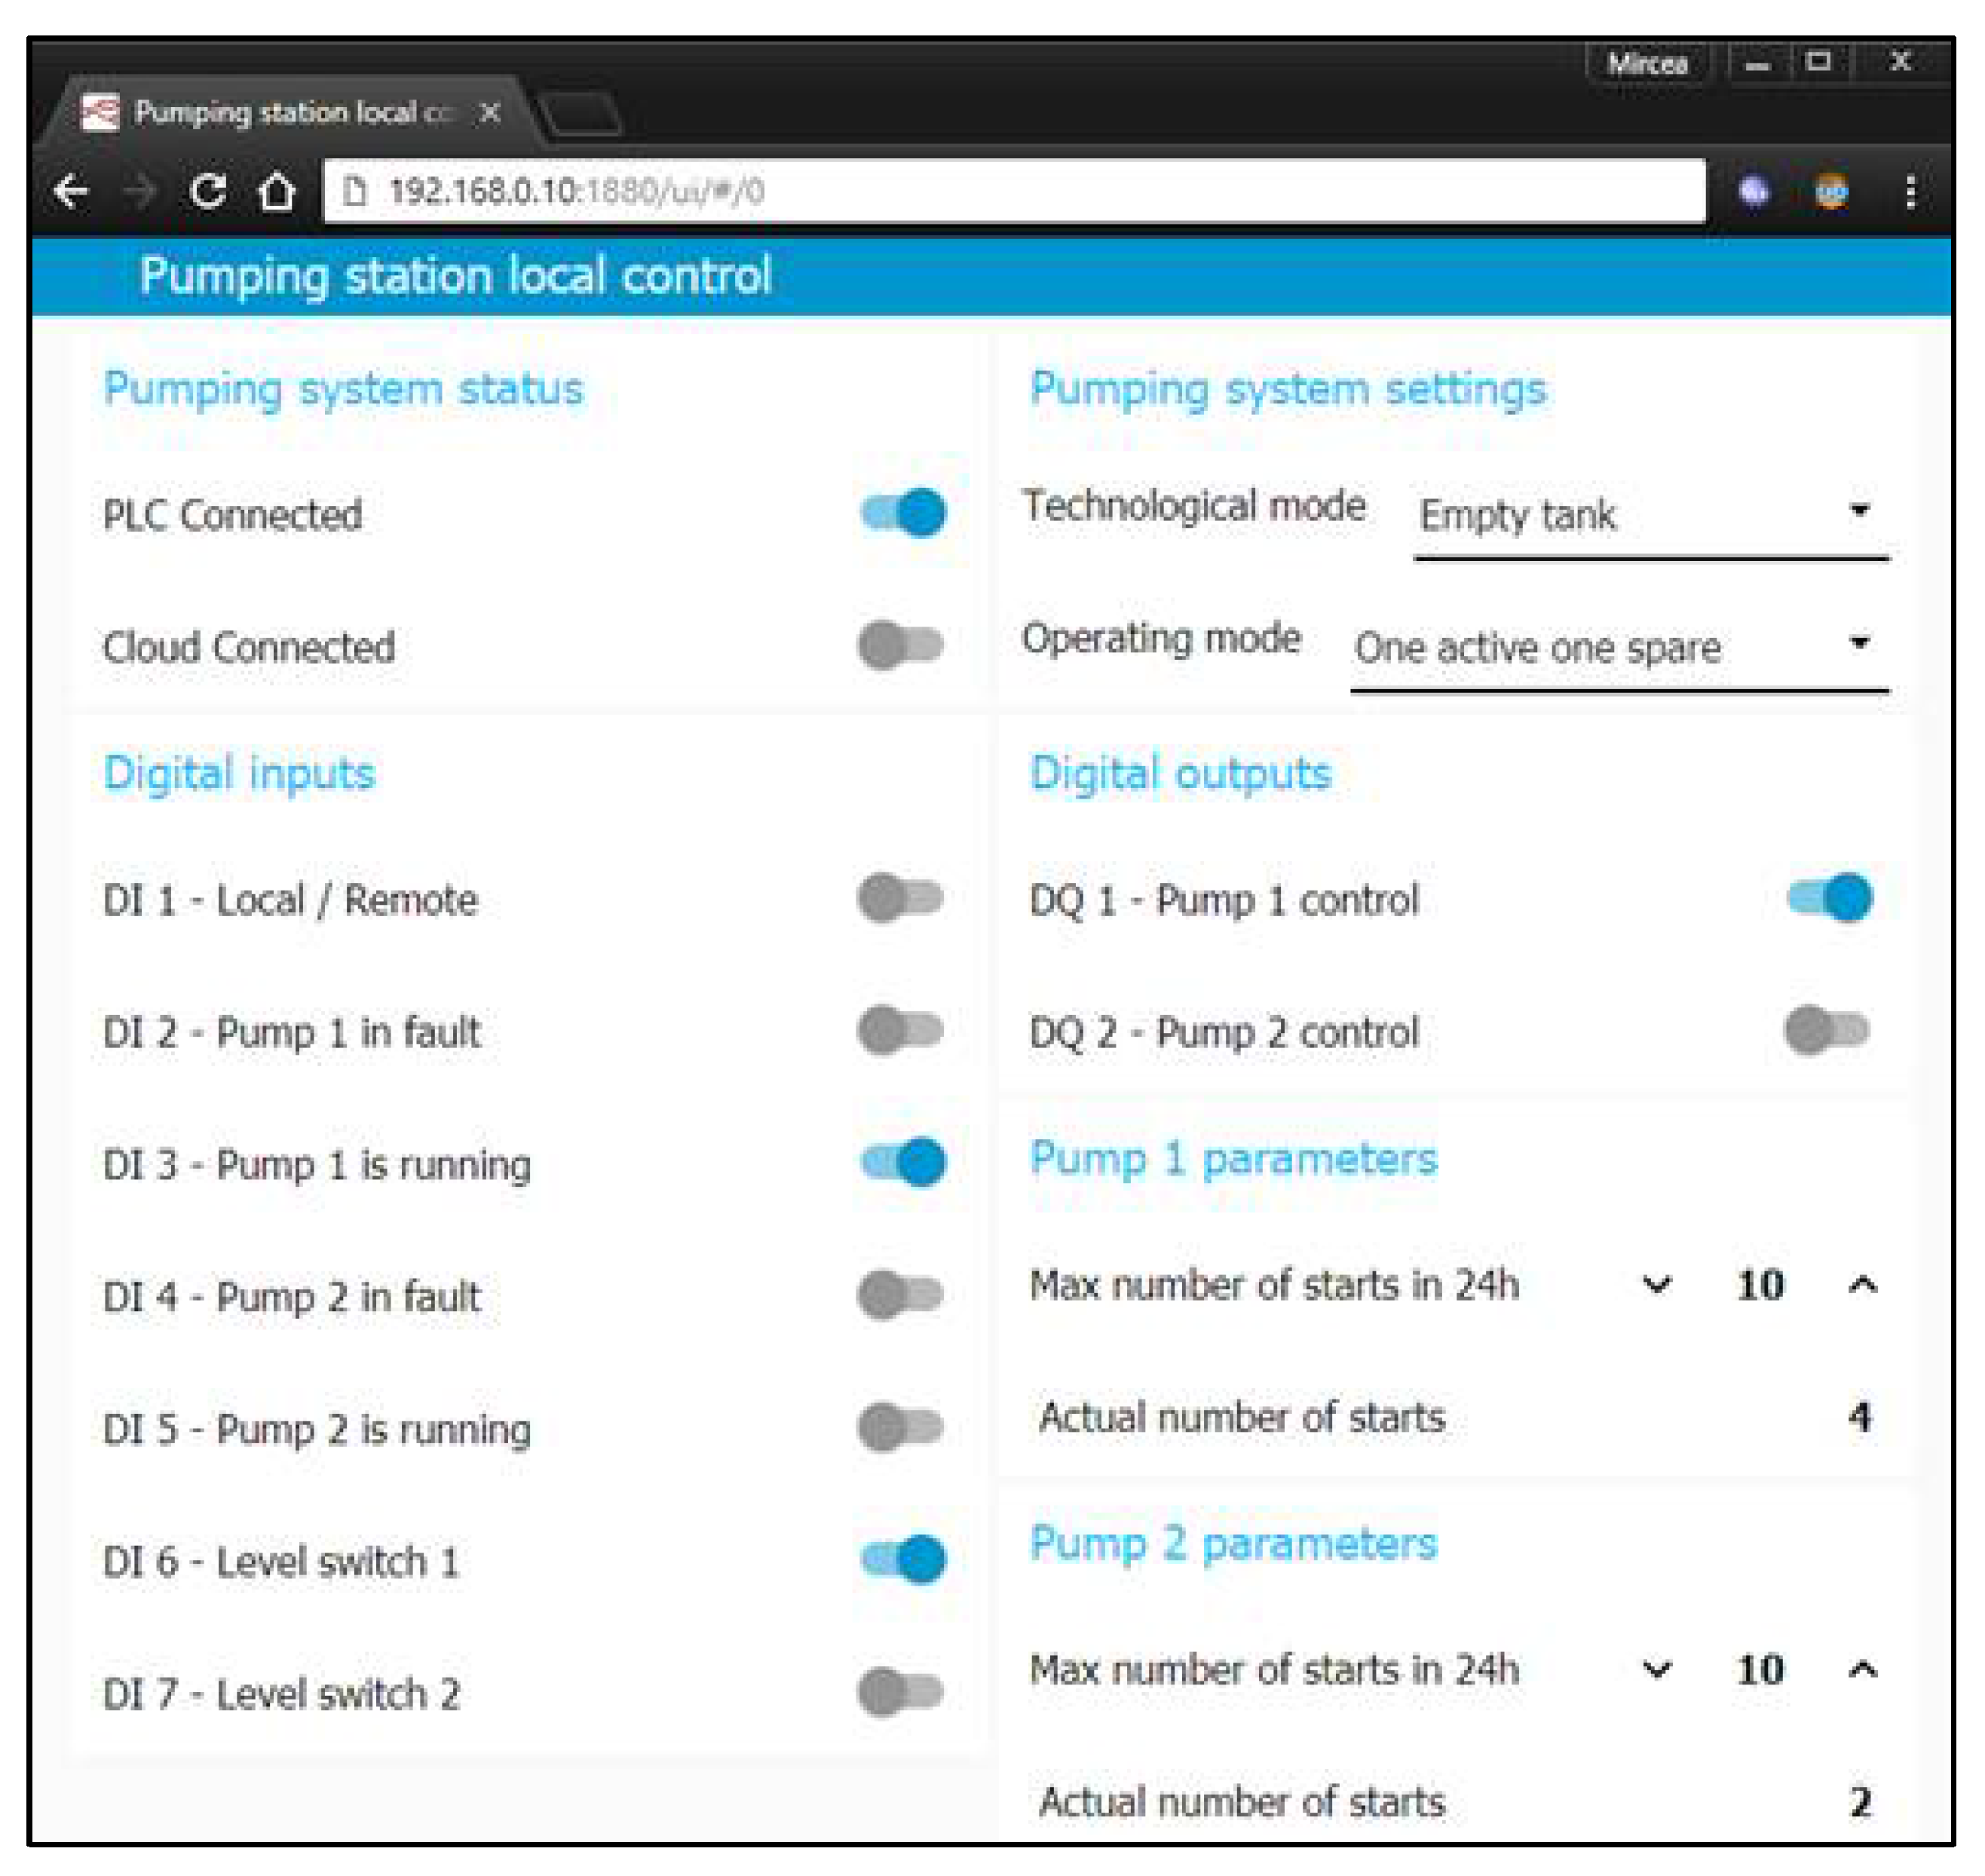
Figure 11 presents one example of the local user interface developed to monitor and control the functionality of the pumping station. Development of such a user interface requires specific dashboard functionalities to be installed in the node-RED environment. The
node-red-dashboard library is used to develop the user interface, presented in
Figure 11. The user interface is divided into several sections: pumping system status, pumping system settings, digital inputs, digital outputs, parameters of pump 1 and parameters of pump 2.
The pumping system’s status section provides information whether the IOT2040 was able to connect to the local PLC control unit and to the cloud platform. To provide this functionality, the IOT2040 gateway uses watchdog variables. The watchdog variables values are incremented every 5 s. If the sent value is not received back by the IOT2040 gateway within 5 s, the connectivity with the PLC or cloud platform is considered lost.
If the “local control mode” is selected or if there is no connection with the cloud platform, pumping system settings allow the local control user to change the technological mode and operating mode of the pumping station.
If the cloud platform is connected to the local user interface, it can monitor the settings selected by the application running in the cloud.
Digital inputs section provides information related to the status of digital inputs. In
Figure 11, it can be observed that the local switch selector is switched “on” for local control; thus, pump 1 runs (i.e., feedback is received from auxiliary contacts of the relay that drives the pump) and the water in the tank is above the first level switch.
The digital outputs section provides information related to the status of the digital outputs. As in
Figure 11, it can be observed that the PLC has activated digital output 1, which is connected to the relay coil that supplies with energy the first pump.
The parameter sections of pumps 1 and 2 provide information related to the maximum number of starts in 24 h, configured for each pump, and the actual number of starts. If the maximum number of starts of a pump is reached, the pump’s control is deactivated to protect that pump from too many starts. Usually, the maximum number of starts is mentioned by the manufacturer (i.e., in the pump datasheet).
User interface can be locally accessed by means of a PC or a mobile phone via a network cable or a Wi-Fi access point without the need of other proprietary software, just by introducing the IP address of the IOT2040, followed by the port and the path to the user interface page: 192.168.0.10:1880/ui/#/0. This is an important feature for flexibility, at no costs. All modern browsers must provide the required framework to access the web page that was created in the IOT2040 gateway. A user ID and password can be configured to provide security and allow the authorized staff to configure, monitor, and control the pumping station.
5.2.4. Data Exchange over MQTT
Using the TSAP communication protocol and the
s7 in and
s7 out node-RED functions, data are read or written from and to PLC by the IOT2040 gateway. To exchange data between the IOT2040 gateway and the cloud platform, the MQTT communication protocol is included in the SCADA architecture. On top of being an asynchronous communication protocol, MQTT has the advantage of having a lightweight data framework and does not require high computational resources [
35].
The MQTT uses a publish and subscribe mechanism with several qualities of data transfer checks. The node-RED programming environment comes with
MQTT in and
MQTT out functions already installed [
33]. These functions need to be configured to work with an MQTT broker. The HiveMQ MQTT broker is used by the IOT2040 gateway and cloud platform to publish or subscribe to specific topics.
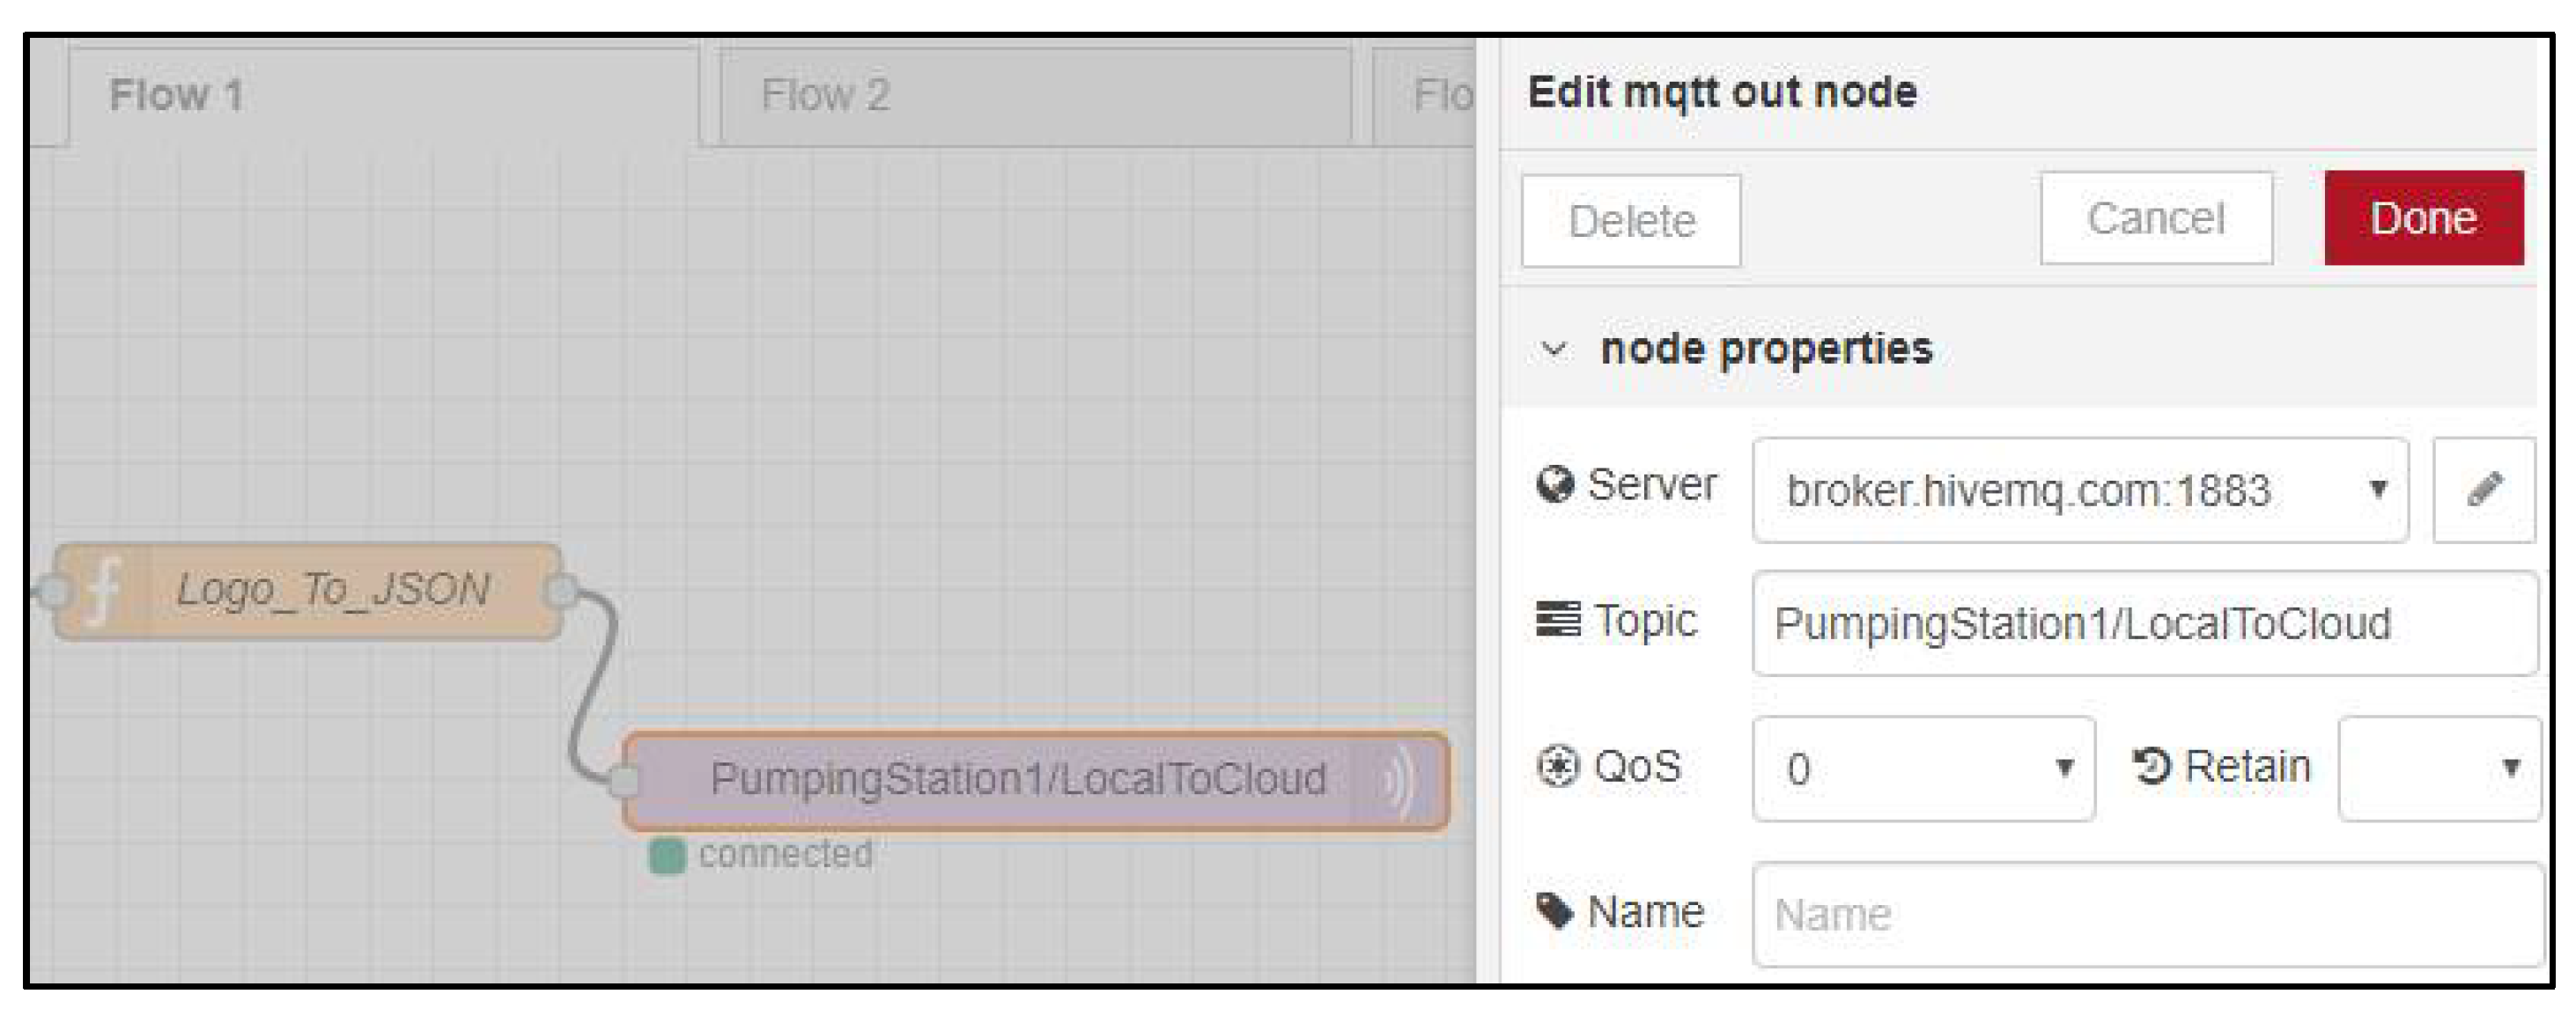
Figure 12 presents the configuration of
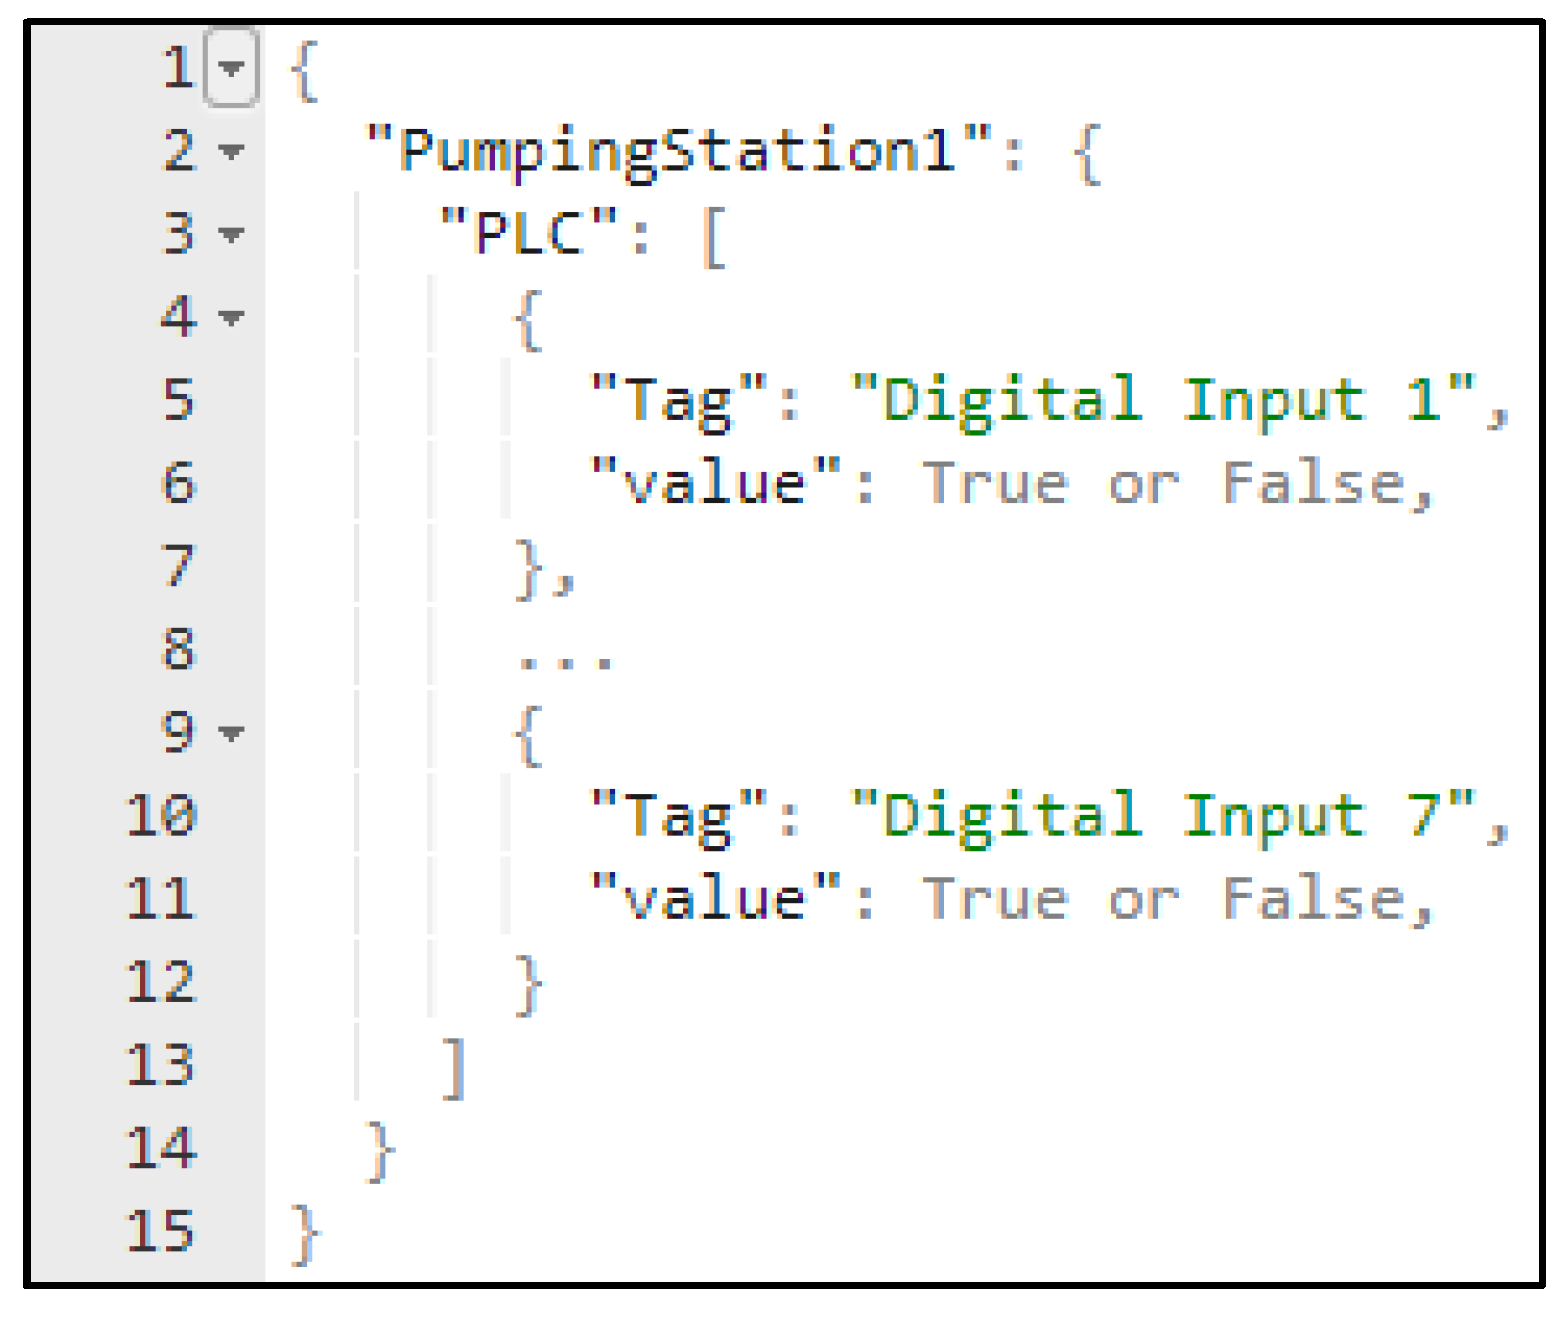
MQTT out function in the node-RED programming environment that runs on the IOT2040 gateway. The node-RED application that runs on the IOT2040 gateway publishes data under the topic
PumpingStation1/LocalToCloud with a JSON structure, where data representation is described (see
Figure 13).
Cloud platform application control logic has an MQTT node that is subscribed for the above-mentioned topic and receives from the MQTT broker the messages under subscribed topics. In a similar way, the cloud platform publishes data to the topic PumpingStation1/CloudToLocal and the IOT2040 modules read the data by subscribing to the topic and use the information accordingly.
5.2.5. Cloud Computing Platform
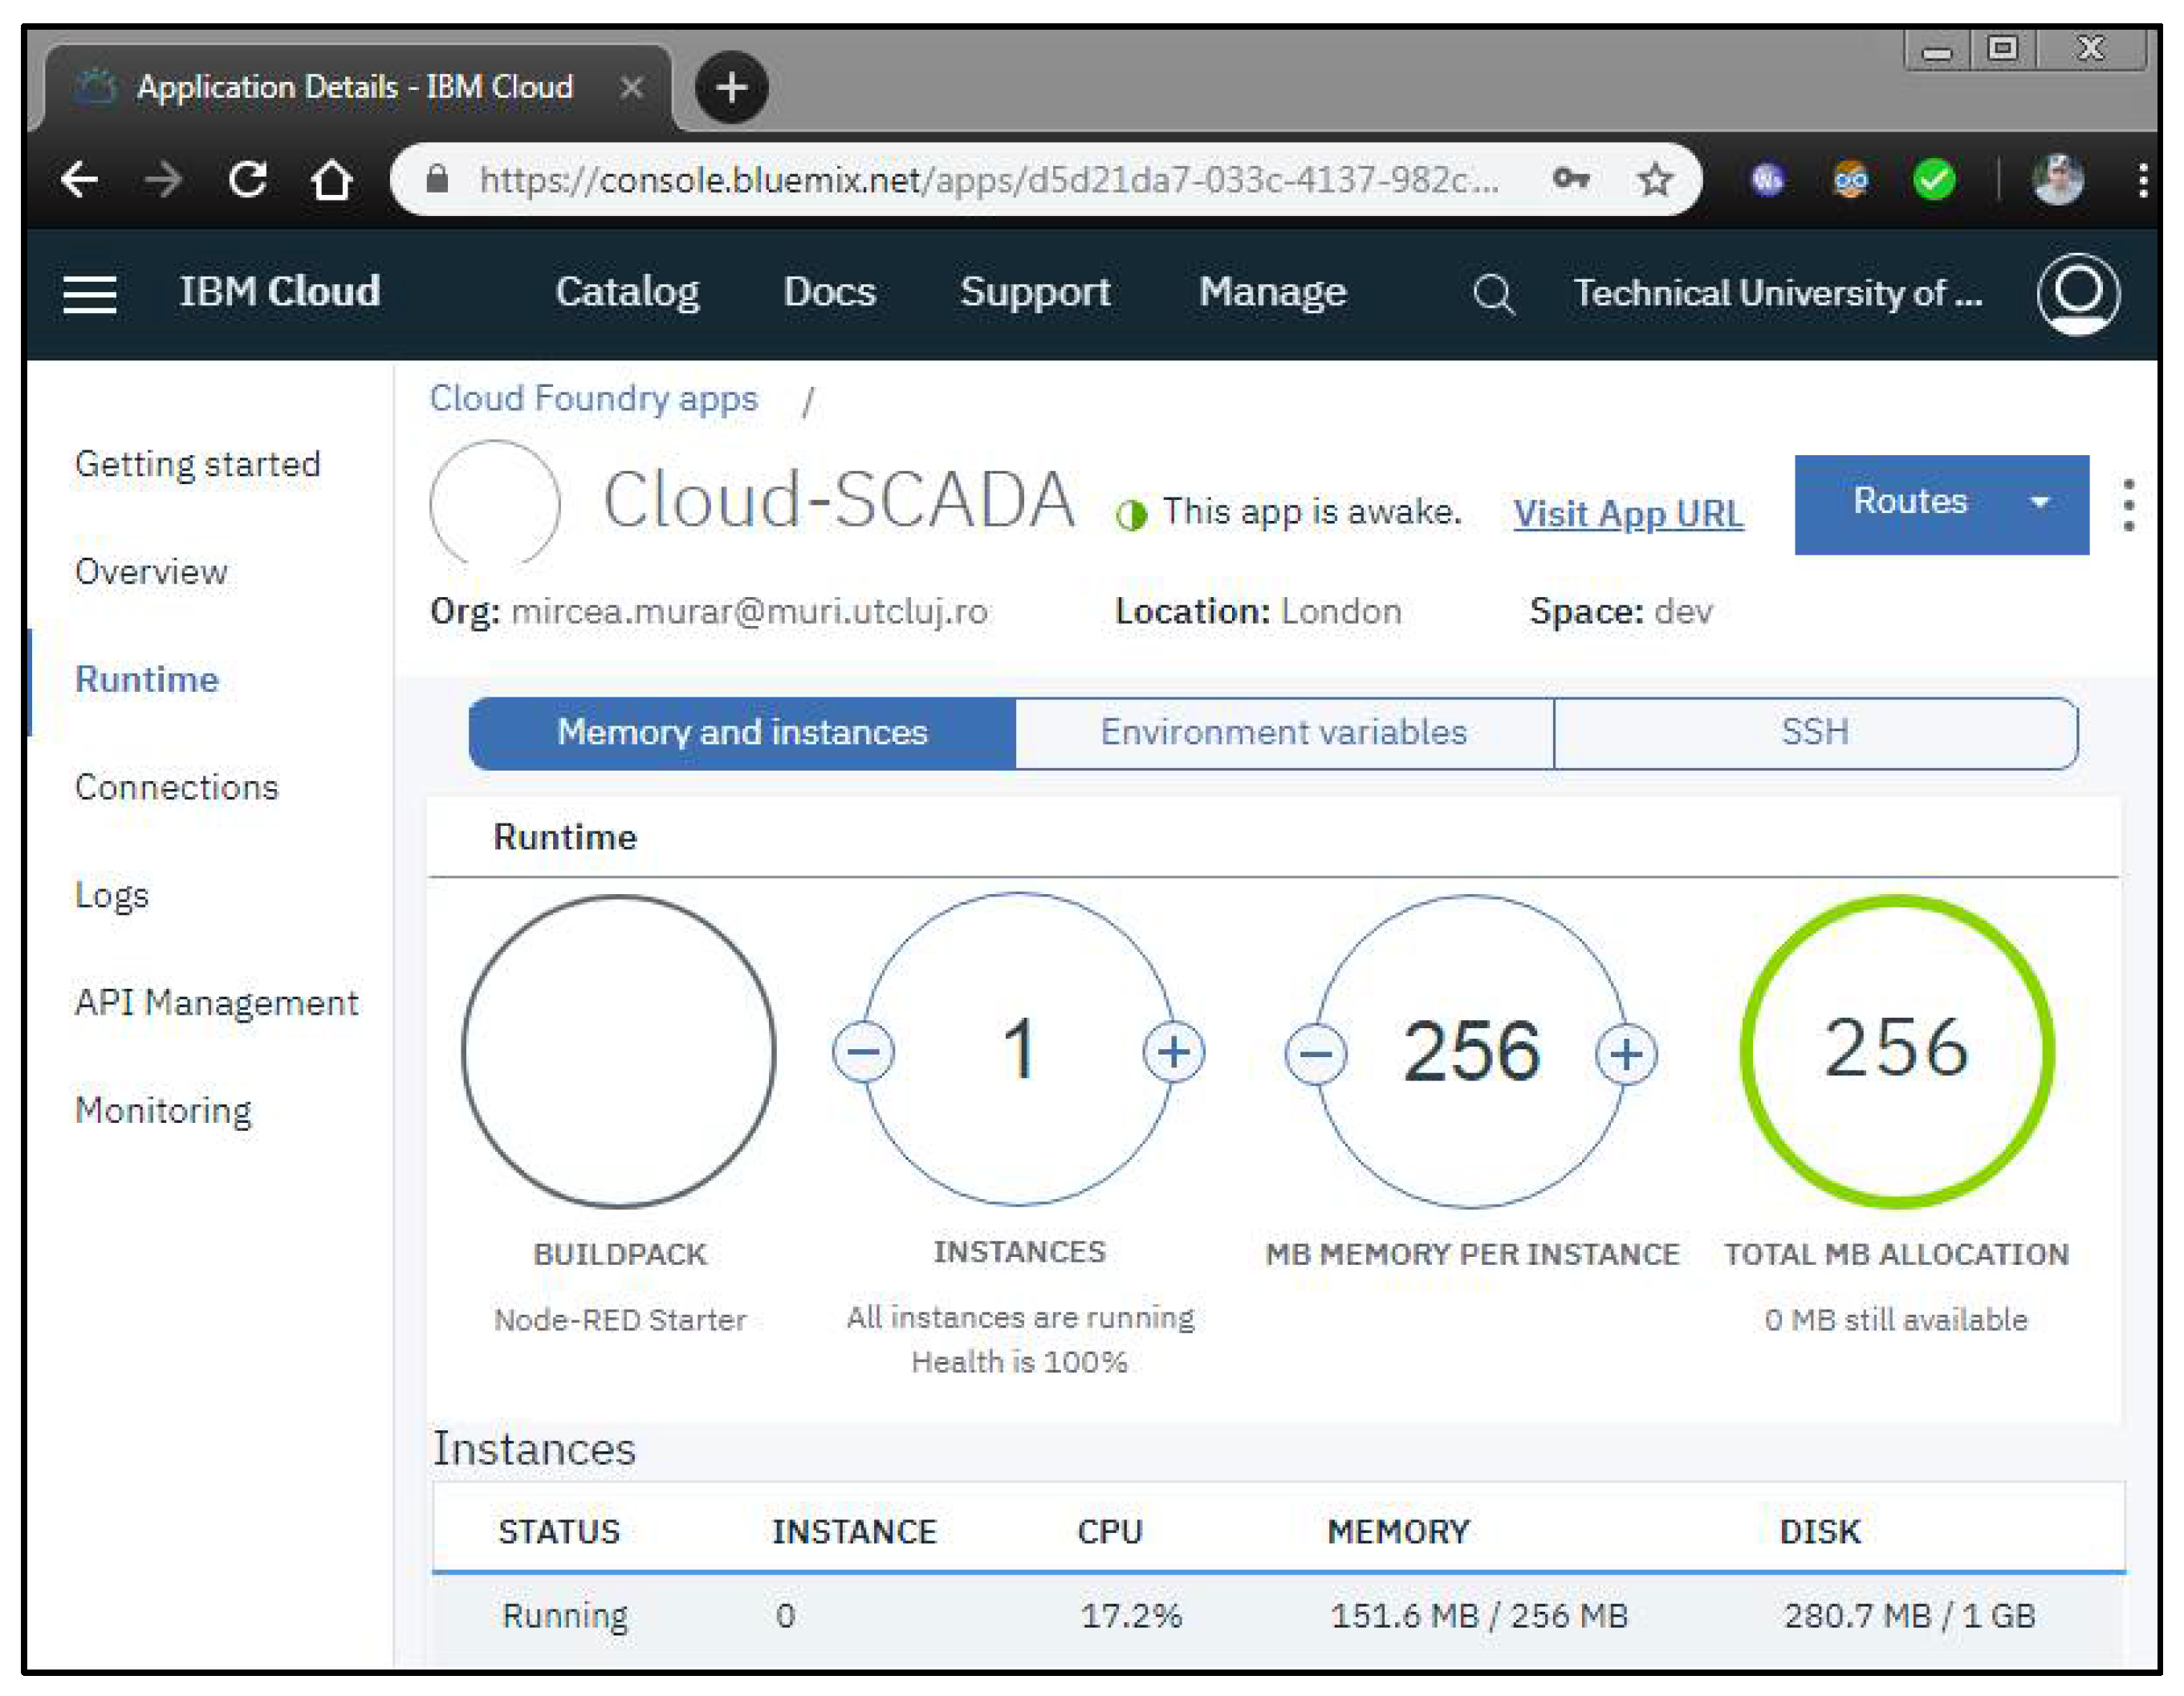
The IBM Bluemix (IBM Cloud) cloud computing platform was considered as the development and running environment of the remote monitoring and control application for the testbench. Registration for a lite account provides access to a specific runtime and storage memory in the cloud and free data exchange with real-world devices up to a bandwidth limit is ensured [
34]. For a real WWT plant, a professional account must be registered for an affordable annual fee; thus, being offered adequate resources in the cloud. The result of the configuration process is seen in
Figure 14.
Another instance of node-RED programming and visualization environment was installed and prepared for operation on top of the IBM Bluemix infrastructure along with specific functionalities required to exchange data with the node-RED application, which runs in the IOT2040 gateway of the testbench. The applications developed in the two instances of node-RED transfer data from PLC to the cloud platform and vice-versa by subscribing and publishing in specific topics of an MQTT broker.
Cloud control can be enabled or disabled from the local HMI. If the connectivity between the pumping station and the application that runs in the cloud is established, pumping station’s control is handled to the application logic which runs in the cloud. The node-RED application, which runs on the cloud platform, receives information from its local control counterpart application, which is further analyzed, and results are sent back to the control unit.
In a more advanced application, the HMI that runs in the cloud must have several sections, one for every remote-controlled automation system. Since the testbench has only one remote automation unit, the HMI that runs in the cloud is able to provide monitoring and controlling functions related to the pumping station. Therefore, the interface is similar to the one that runs locally on the IOT2040 gateway (see
Figure 5 and
Figure 11).
6. Discussion
Discussions from this section are grouped into two parts. The first part provides information upon the performed tests on the experimental workbench. The second part relates the results with the performance characteristics highlighted in the methodology.
Tests we have run on the proposed cloud-based SCADA system indicated a proper behavior. Non-critical time lags were observed after the HMI applications were put into operation on both local and cloud HMI. We assume that fine tuning and making other adjustments on the operating system settings, on IOT2040 and node-RED application, might fix this drawback. Data on the calibration process are not provided in this paper. In addition, we conclude that ensuring a high-speed internet connection and running the cloud application on a local cloud or on the company cloud computing platform would deliver better time response than the one observed on IBM Bluemix. This option depends on several variables, such as the existence of the local cloud, as well as the criticality of time lags from the perspective of the WWT installation’s operator.
We investigated here disruptive technologies, which are at their primary stages of evolution on the S-curve. Thus, we recommend this SCADA architecture for non-critical WWT installations, not for the premium ones. The single reason is the commonsense prudence until the long-term reliability of these disruptive technologies is not fully proven. Of course, this takes time, but we can conclude that cloud computing and IoT driven SCADA systems represent the future. So, we recommend not using yet this type of technologies on critical WWT processes (e.g., chemicals dosing [
48]) before testing them into non-critical areas, including other industrial processes than WWT, because it can provide a more efficient and cost-effective way of controlling and monitoring specific processes in many industries and provide novel and effective approaches to solve problems and adjust control logic [
49].
Another aspect to comment is the friendliness of the user interface. Operators of traditional SCADA systems are used with a specific graphics. On the web, these graphics are not as pleasant as on a desktop. However, with an additional effort these graphics can be achieved on web, too. However, this increases the initial cost, because it requires skilled people to program in JavaScript and HTML for releasing a professional HMI in both local and cloud applications, similar with the ones that ordinary operators are familiar with in the actual SCADA systems.
In addition, we conclude that cloud computing and IoT can provide lots of advantages since the applications that run on cloud computing platforms can be connected to other services in distributed networks over the Internet; thus, improving efficiency, flexibility, agility, and rapidity in interventions of the controlled process, while reducing the lifecycle costs. They also have good security features. Nevertheless, cybersecurity of IoT devices is at an early stage of development, therefore the use of these disruptive technologies for critical installations should consider this delicate aspect. More and more researches in this field are already reported, and new start-ups are working on it; thus, we expect that security performances will soon reach an acceptable level also on this type of data exchange technologies [
27]. One might accept that cybersecurity is a never-ending issue, hence this could be a direction for future researches related to WWT installations. However, the use of cloud computing facilitates the integration of machine learning and deep learning for AI-driven cybersecurity, which is a step forward in this technological field. Application of AI models for data analytics is another future area of investigation, especially from the perspective of producers of the constitutive technologies of a SCADA system to support their demarch on product-service innovation [
49]. Reliability, in terms of not losing data during transfer over long distances via Internet, is another area that necessitates future researches, because measurements we have performed at the level of currents in the network indicate that enforcement, buffering and other types of redundant or backup architectures might be useful in this respect.
A systematic analysis of the performances achieved by the proposed SCADA architecture with respect to the pool of objective functions related to a lifecycle orientation (introduced at the beginning in the section “Methodology”) is done in
Table 4.
Advantages with respect to the traditional SCADA systems have been already commented in
Section 5.2, as well as in several other places in the paper, therefore they will not be repeated in this section of the paper.


