Article

A Simulation Model for Forecasting COVID-19 Pandemic Spread: Analytical Results Based on the Current Saudi COVID-19 Data

1
Community College, University of Tabuk, Tabuk 71491, Saudi Arabia
2
Computer Science Department, Mutah University, Karak 61711, Jordan
3
CNRS-IRIT (RMESS), University of Toulouse, 31000 Toulouse, France
4
Communication and Information Technology Research Institute, King Abdulaziz City for Science and Technology (KACST), Riyadh 11442, Saudi Arabia
5
College of CIT, Taif University, P.O. Box 11099, Taif 21944, Saudi Arabia
6
Accounting Department, Faculty of Business Administration, University of Tabuk, Tabuk 71491, Saudi Arabia
7
Accounting Department, Mutah University, Karak 61711, Jordan
8
Department of Algorithms and Their Applications, Eötvös Loránd University, H-1053 Budapest, Hungary
9
Faculty of Computer and Information Systems, Islamic University of Madinah, Medina 42351, Saudi Arabia
*
Authors to whom correspondence should be addressed.
Sustainability 2021, 13(9), 4888; https://doi.org/10.3390/su13094888
Submission received: 9 March 2021 / Revised: 19 April 2021 / Accepted: 23 April 2021 / Published: 27 April 2021

Abstract

:
The coronavirus pandemic (COVID-19) spreads worldwide during the first half of 2020. As is the case for all countries, the Kingdom of Saudi Arabia (KSA), where the number of reported cases reached more than 392 K in the first week of April 2021, was heavily affected by this pandemic. In this study, we introduce a new simulation model to examine the pandemic evolution in two major cities in KSA, namely, Riyadh (the capital city) and Jeddah (the second-largest city). Consequently, this study estimates and predicts the number of cases infected with COVID-19 in the upcoming months. The major advantage of this model is that it is based on real data for KSA, which makes it more realistic. Furthermore, this paper examines the parameters used to understand better and more accurately predict the shape of the infection curve, particularly in KSA. The obtained results show the importance of several parameters in reducing the pandemic spread: the infection rate, the social distance, and the walking distance of individuals. Through this work, we try to raise the awareness of the public and officials about the seriousness of future pandemic waves. In addition, we analyze the current data of the infected cases in KSA using a novel Gaussian curve fitting method. The results show that the expected pandemic curve is flattening, which is recorded in real data of infection. We also propose a new method to predict the new cases. The experimental results on KSA’s updated cases reveal that the proposed method outperforms some current prediction techniques, and therefore, it is more efficient in fighting possible future pandemics.

1. Introduction

At the end of 2019, a new variant of coronavirus, called SARS-Cov2, started attacking humans and, at the end of January 2020, the interhuman transmission was confirmed [1,2,3]. SARS-Cov2 is characterized by its fast spread since after few months almost all countries were affected. The disease caused by SARS-Cov2 is called COVID-19.
According to the World Health Organization (WHO) [4], by 2 April 2021, COVID-19 has infected 130,418,399 people, caused 2,843,644 deaths, and resulted in 22,517,551 active cases all over the world. For the Kingdom of Saudi Arabia (KSA), the number of infected people reached 391,325, including 6684 deaths and 5768 active cases at the same date. The mortality rate of COVID-19 in KSA is the same as the international average mortality rate (2.2%). The low Saudi mortality rate can be explained by the several preventive decisions taken since the appearance of the first COVID-19 case in the country. The most affected cities in KSA are Riyadh, Mecca, Jeddah, Medina then Dammam [5].
To deal with COVID-19, the WHO recommended a set of infection control measures and strict preventive protocols such as the isolation of suspicious and infected cases for 14 days. These instituted preventive measures require behavioral changes to ensure compliance.
The infected people, including healthcare professionals, face generally social, physical, and mental disturbance. Moreover, several economic repercussions, such as the disruption of both demand and supply international economic chains, were recorded. On the other hand, the closures and confinements resulted in a decrease in productivity of all economic sectors, which reduced consumption and investment and consequently increased unemployment. Moreover, the uncertainty about the duration of the pandemic, its impact, and the efficiency of the vaccines induce the lack of confidence in the financial markets [6]. However, KSA benefits from previous experience with infectious diseases. Indeed, similar to west Asian countries, Saudi Arabia is one of the few countries that have experienced respiratory syndrome viruses during the last decade before the appearance of COVID-19. Indeed, in 2012, the Middle East Respiratory Syndrome coronavirus (MERS-CoV) emerged in the Arabian Peninsula, and 1864 people were infected before containing the pandemic [7]. After the detection of the MERS-CoV, different studies investigated the level of response of Saudi authorities and the attitude of the population. In [8], it was shown that most of the Saudi population in 2012 had poor knowledge about the MERS-CoV, whereas a better awareness level was recorded for the SARS-Cov2 in 2020 due to the efforts made and measures proposed by the Saudi Ministry of Health (SMOH).
On 23 March 2020, the Saudi authorities applied partial confinement to reduce the propagation of this virus. Afterward, three main cities (Riyadh, Mecca, and Medina), which recorded the highest number of infections, were closed and the access to these cities was restricted to emergency cases. Many severe prevention decisions were also made to slow down the spread of the virus in the KSA, including (i) educational institutes were closed and teaching was conducted online; (ii) mass gatherings were suspended; (iii) travel and tourism trips were canceled all over the country; and (iv) international flights were suspended and the border crossings were closed. At the beginning of 2021 and despite the availability of the vaccine, several issues related to the spread of the SARS-Cov2 virus, especially regarding its mode of transmission, its postsymptoms, and the identification of the infected individuals without symptoms, have not yet been understood [9]. Traditional spreading forecasting models, such as the susceptible-infected-recovered (SIR) and the susceptible-exposed-identified-recovered (SEIR), do not consider the exposition process. Hence, they can be inaccurate in simulating the COVID-19, which explains the high number of infected individuals given by the SEIR model, compared to that provided by the official records [10]. The SEIR model estimates 75,815 infected people on 25 January 2020 in China [11], against 688 official recorded real cases. In Wuhan, the SEIR number was 190,000 on 4 February 2020 [12], against 1967 official cases. Moreover, other factors, such as the precaution measures should be applied in a good forecasting model to give real results. The contributions of this study are summarized below:
  • Introducing a new simulation model to forecast the spreading behavior of the COVID-19 based on Saudi real data;
  • Developing a decision support interface for the public and officials to raise their awareness of COVID-19;
  • Proposing a suitable curve fitting function (Gaussian) to fit the current infected cases and predicting, later, the potential number of infected cases;
  • Suggesting a novel method for one-day prediction of the number of infected cases and comparing it with similar existing techniques.
The SMOH adopted different approaches, such as the suspension of social activities and confinement, to slow down the rapid increase of the number of infected people and the excessive demand for healthcare services such as medical equipment, PCR test kits, and hospital beds. The main used approaches and decisions made by the Saudi government to fight against COVID-19 are discussed and interpreted below:
-
Early closing of the borders was set on 15 March 2020, followed by a lockdown and confinement after few days;
-
All holy places in Mecca and Medina and all mosques in KSA were closed to avoid people gatherings. Afterward, there was a suspension of Taraweeh prayers during the month of Ramadan in 2020 (March 2020) and in 2021 (April 2021);
-
COVID-19 PCR tests are free, available on demand and can be obtained outside hospitals in mobile points all over the country to avoid bringing the infection to healthcare institutions;
-
The extensive use of numerical systems: different applications have been deployed and used to manage the COVID-19 crisis: Tawakalna to control the movement of people, Tabaud for contact tracing, Tataman and Sehhaty for PCR tests and vaccine, and Itamarna to organize the access to holy places. Disregarding the instructions proposed by the above-mentioned applications implies immediate infractions and penalties. For example, the ministry of interior announced that 12,855 violations of precautionary measures were seized in just one week in March 2020 [5];
-
The existence of advanced online educational systems even before the outbreak of COVID-19. These education systems ensure the continuation of the academic year without any disturbances;
-
The support and funding of scientific research in different fields related to COVID-19 issues. Medical, biological, technological, and human studies were funded by several institutes, such as the KACST, KAUST, and regional universities;
-
Several packages of financial aid were provided to citizens, residents, and the private sector to avoid economic recession and layoffs. Among these measures, the payment, for several consecutive months in 2020, of half the salary of workers in the private small- and medium-sized enterprises;
-
Providing free vaccine for all the population including Saudis, residents, and illegal residents. In fact, by 31 March 2021, about 4.7 million people and all healthcare professionals were vaccinated [5].
Indeed, the values proposed by mathematical simulators may be different from real numbers because of the set of the involved complex and dependent hypotheses and constraints. The main objective of this study is to approximate the spread of the COVID-19 in KSA and then to assess the efficiency of the preventive procedures taken by the Saudi authorities. This study also aims at increasing the awareness of officials and members of the public about the fast spread of the COVID-19. To achieve this purpose, the study suggests a new simulator developed from scratch based on the C# language. Afterward, different experimental tests, relying on several scenarios and parameters such as the walked distance and social distance, are conducted in order to interpret and evaluate the impact of the outbreak of the COVID-19 in KSA.
The research questions are detailed as follows:
-
What is the basis of the strategy used for fighting against COVID-19 in KSA?
-
What are the circumstances leading to successful control of the pandemic in Saudi Arabia?
-
How can the number of infections in the upcoming months in KSA be predicted accurately based on the evolution of the COVID-19 pandemic in KSA cities?
-
How are the parameters that may considerably reduce the number of infections and therefore affect death rates identified?
-
How can the suggested forecasting model be used to raise the awareness of the Saudi public and officials about the seriousness of the next waves of COVID-19 and other future possible health crises?
-
How can the suggested simulator be used by Saudi authorities to enhance the control of the pandemic spread and establish a protocol for the management of critical future pandemics?
-
How is the proposed prediction method used for general prediction purposes?
Indeed, after a good control of the pandemic in KSA and after the start of taking vaccines in early 2021, there was a period of relaxation and a return to normal life especially on the side of the people. This can lead to future waves of COVID-19. Hence, the proposed simulation model can be used as a warning call before the next waves of COVID-19 arrive. Hence, this study is very useful in raising the awareness of the Saudi people about the importance of the vaccination which is currently (April 2021) taking place at a low speed. The latter fact may increase the threats of new waves of the pandemic. The proposed model is based on a regression method for the prediction of infection cases, which is not mainly applied in KSA and worldwide. This model can also be used to model, predict, and understand other viruses before they turn into pandemics. The analysis and interpretation of simulation scenarios, the comparison of these scenarios with the real data, and the actions taken by the SMOH can also be used to establish an “action protocol” to fight against any next pandemic effectively, by specifying a roadmap of the actions to be taken on the medical, mediatic, social, economic, and financial level.

2. Literature Review

After the outbreak of the COVID-19, different research studies suggested contact tracing as well as predicting and monitoring the behavior and spread of the disease. This section presents these studies and discusses their contributions and limitations. Mathematical formulation is a powerful method applied to build and assess the performance of dynamic complex multiparameter models such as the spread of pandemics. In [13], the authors proposed a mathematical system to track the propagation of COVID-19 and evaluate the social behaviors and necessary measures that should be made in case of pandemics. However, the study in [13] did not use real data and experimental scenarios supporting the found results. In [14], the authors developed a tool to simulate the propagation of the COVID-19 in several Chinese cities. This tool was applied to model the public multilayer urban transport networks using the SEIR model containing four states for each person: “susceptible”, “exposed”, “infected”, and “resistant”. Despite its importance, this model was used only to study the transport network in China and cannot be employed in other countries such as KSA. In addition, it assumes the noninfection of recovered cases, which was proved to be medically incorrect according to the World Health Organization declarations. Moreover, in [15], a Kalman filter-based system was introduced to evaluate the degree of the COVID-19 spread in Wuhan for daily forecasts. Although the study suggested a Markovian network-based process for long-term predictions, it recommended a continuous application of strict closure measures to contain the pandemic. However, the epidemiological parameters of the current COVID-19 pandemic do not follow the exponential distribution of the Markovian model, which highlights the interest of non-Markovian models in predicting the spread of COVID-19. Authors in [16] presented a “mega-disks networks infection diseases control mapping” (MDNIDC-Mapping) that consists of a real-time graphical multidimensional tool used to forecast and monitor the spread of COVID-19. This simulator, based on the formulation of endogenous variables in several types of disks, was applied to calculate the number of infections in China and worldwide. Although the MDNIDC-Mapping is efficient, it does not involve real data and real assumptions in the simulation. Thus, the dimensions of the investigated disease were neglected in this tool. Several systems, relying on artificial intelligence (AI), were also utilized to resolve real-world complex problems [17,18,19,20,21]. In the case of fast-spreading epidemics such as COVID-19, deep learning (DL) and machine learning (ML) paradigms are interesting tools that allow taking the best urgent decisions. Unlike SEIR models, ML and DL systems can easily consider various and conflictual parameters (such as population density, travel mobility, and medical resources) as features to efficiently predict the spread of the virus. A composite Monte Carlo system was presented in [22] to forecast the COVIS-19. It uses fuzzy rules induction and DL to consider additional dimensions of insights and to help the decision maker (DM) use the decision rules. Nevertheless, the performance of the suggested model was not compared to that of other models proposed for the prediction of COVID-19 cases or other well-known diseases such as the SARS that appeared in 2003. The study in [23] utilized a DL process to automatically predict and identify the risks of infection of humans by new viruses. However, this process uses a large amount of real data, which makes it inappropriate to quickly stop very infectious diseases. A stochastic multiagent discrete-time model, applied in the Australian context, was suggested in [24] to forecast complex infection scenarios. This simulator relies on realistic assumptions involving the degree of international air traffic, the degree of respect of the social distance, and the educational institutions’ closure (school, universities, etc.). The study deduced that the latter assumption is not efficient if it is not simultaneously achieved with strict respect to social distancing. Moreover, concerning the period of controlling COVID-19, it affirmed that a period of three to four weeks is enough to stop the large infection if 90% of the population respect the social distance. Moreover, if this percentage is less than 70%, the pandemic will not be controlled without a vaccine. Another SEIR model was proposed in [25] to predict the propagation of the pandemic in several cities in China from February 2020 to April 2020. Then, the same model was applied to predict the spread of this virus in the USA and Italy during the second half of 2020. The comparison of the predicted data with the real one for the three countries shows that the former was more accurate for China due to the large difference in the number of cases in the studied countries. Another simulator, in which the mobility of people was considered, was introduced in [26] to predict the number of cases in Pakistan. Researchers came to the conclusion that the infection will highly increase to reach tens of thousands of cases in Pakistan despite the respect of the social distance, which was noticed after few months on the real recorded data. In [27], authors developed a susceptible, dead, infected, recovered (SDIR) system incorporating daily recovery and mortality rates of the confirmed cases in the simulations. The suggested model aims at predicting the COVID-19 spread in China after 21 days. Nonetheless, the authors reported that the model cannot accurately represent the dynamic evolution of the pandemic due to the unknown number of real infections. A modified SEIR model was suggested in [28] to forecast the propagation of the COVID-19 using data from the Chinese province of Hubei. The system detailed a clinical real data-based study which is more interesting than mathematical simulations. It also predicted that the pandemic will be soon stopped locally, which was not the case after few weeks in April 2020.
Several agent-based systems were presented in [29,30,31,32] to investigate different aspects of the COVID-19 epidemic, such as the spread of the virus, the economic effect of social distancing, and the hospital capacity needs during the epidemic crisis, etc. Despite their importance and contributions, the above-mentioned studies lack accuracy regarding the nonuse of clinical real data. Moreover, research works focusing on the Saudi context are rare. Hence, the main objective of this study is to solve the previous drawbacks and propose a forecast model for the pandemic situation in KSA. Indeed, the present study is different from our previous work proposed in [33] as far as the following aspects are concerned:
-
The study in [33] analyzed the data about the spread of the pandemic in KSA in the first 14 days, while the current study examines the current data after about 8 months from the appearance of COVID-19;
-
The methodology used in [33] included a linear regression since the data was climbing linearly at the beginning of the pandemic, while the current study involves a Gaussian curve fitting for data prediction since the data curve reached the peak and went down to become flattened;
-
The methodology applied in [33] utilized simple moving average, weighted moving average, and exponential smoothing during 36 days, while the current study employs the same technique for 206 days, proposes a new prediction method, and compares it with one of the well-known state-of-the-art prediction methods.
Table 1 gives an overview of the various simulation models used in previous studies.

3. Materials and Methods

In this study, a forecast model is proposed to simulate and predict the propagation of the COVID-19 in the Saudi context. Indeed, the degree of disease propagation within a community (a country or a city) highly depends on parameters such as the hygiene rate, the degree of respect of the healthcare rules, the degree of people’s movement, and the infection rate. Each parameter contributes to the evolving of the pandemic with a certain probability. The principal parameters affecting the spread rate are the focus of this research work. Each parameter incorporated in the simulator affects differently the simulation results. For example, if the hygiene rate is high in the population, there is less chance of infection. In this study, the infection rate is assumed to be inversely proportional to the hygiene rate.
The simulation parameters directly influence the degree of spread of the pandemic. Furthermore, some parameters affect more considerably the practice and behavior of each population, compared to other ones. Hence, the aim of this work is to identify the most important nonpharmaceutical metrics and parameters allowing the slow-down of the COVID-19 propagation in order to maintain control of the healthcare system. The simulator was established using the C# language and a graphical user interface was provided. The principal screen of the program is divided into three parts:
  • The output part shows the results and helps us carry out the statistical analysis after each simulation;
  • The control panel details and manages the different simulation parameters;
  • The canvas visually illustrates the simulation. The created community is identified as a set of points randomly initialized in several locations in the canvas. These points represent people walking uniformly and randomly in the four possible directions. Each direction has a probability p equal to 1/4. The situation of each point is recognized by its color: black, green, red, and blue, for dead, recovered, infected, and susceptible, respectively.
The control panel in the interface involves the following most important simulation parameters:
  • The “size of the community,” in which a 100 means that one hundred people are randomly located in the canvas;
  • The “period” of the simulations (in days);
  • The “initial number of infections” in the community;
  • The “infection rate” (probability of infection) reflects the degree of propagation of the pandemic among susceptible people. If a susceptible person is in closer contact with an infected subject within the indicated social distance, the probability of infection of the first person will be equal to this parameter;
  • The “hygiene rate” is the complement of the infection rate. If the former rate is set to p, the latter rate will be 1-p and vice versa. Indeed, hygiene refers to both cleaning of hands and applying all the preventive healthcare measures such as wearing masks. Since the community members do not follow the same hygienic procedures, an average rate was assumed to be the same for all the community;
  • The “recovery rate” is the probability of an infected person’s recovery;
  • The “death rate” is the probability of the death of infected people. This parameter is the complement of the recovery rate;
  • The “social distance” between people should be at least two meters according to the WHO recommendations [34]. In our experiments, its value was set to two, and it was assumed that the person becomes infected if the Euclidean distance between this person and an infected one is less than the social distance. In fact, this infected person was attained with a probability equal to the value of the infection rate., i.e., the simulation is based on infected individuals, who are within a 2 m diameter, if and only if one of them is infected using the infection rate;
  • The “delay” is the time separating two frames. It is used to visualize the components, especially small populations;
  • The “stride,” which represents the walking distance of individuals, is the distance of the person’s movement at each time frame in a specific direction. Two random numbers [−Stride, +Stride] define the range X–Y coordinates of each person. Hence, the stride reflects the movement restriction degree. The more the individuals move, the greater the chance that they will meet and more likely to be infected;
  • The “recovery period” is the time of healing of an infected person. In the performed experiments, it is equal to 14 days [35]. This period can be changed if used by practitioners in other applications;
  • The width and height define the dimensions of the community area measured in meters. Each pixel in the canvas area was set to one meter. Then, the dimension of the population was computed based on the real density of the population. In our experiments, the dimension of the population 500 × 500 m2 was used. In this population, the number of people per square kilometer was divided by four.
Different other parameters, such as the age distribution, the smoking rate, the health history of people, and the variation of movement’s speed, should be considered in order to enhance the accuracy of the predicted data. Nevertheless, there is little information about these parameters. In our study, random data relying on the density of the population in the two main Saudi cities, and real data of infected people obtained from the Saudi Ministry of health are both used by a regression analysis to provide short-time forecasting of the rate of infection.

4. Results and Discussion

The proposed simulator was used to evaluate the propagation of the COVID-19 pandemic in two major Saudi cities (Riyadh and Jeddah) and to calculate the number of recovered, susceptible, dead, and infected people relying on several realistic factors and scenarios. According to the WHO declarations [4], since the beginning of the COVID-19 pandemic, three major parameters affect the infection rate: social distance, walking distance per person, and wearing of masks. This statement was validated by different research studies: the studies in [36,37] identify the main epidemiological parameters influencing the transmission of the COVID-19. The study in [38] assesses the effect of social distance in reducing the spread of the COVID-19. The suggested simulations are based on the walking distance of individuals. An average of 4961 steps was taken by each person per day. The highest average step count was in Hong Kong (6880 steps per day), in China (6189), and in Ukraine (6107). The lowest average step count was observed in Malaysia (3963), KSA (3807), and Indonesia (3513) [39]. For the Saudi context, one step was estimated to 0.762 m. Thus, the average Saudi walked distance was near 2901 m per day. Our experiments allowed the infected and healthy people to randomly move according to the value of the “Stride” parameter, which has a default value set to 2.901. At the beginning of the pandemic, WHO recommended that the distance separating people should be at least one meter [40]. Later, this distance was extended to two meters [34]. Hence, our simulator considers that infection will occur (relying on the infection rate) if a reconciliation within two meters is achieved between a healthy person and an infected one. This parameter can be modified by the user of the simulator. As the virus may stay alive for days, the infection can be transmitted by visiting an infected point and not always by directly contacting an infected individual. The introduced model proposed different simulation scenarios of COVID-19 spread, based on the following assumptions:
  • Large stride, large movements of people, no quarantine;
  • Small stride, large movements of people, quarantine;
  • Medium movements of people, partial quarantine;
  • High infection rate, then low hygiene;
  • Low infection rate, then high hygiene.
Furthermore, the suggested simulator made it possible to visually imitate the COVID-19 propagation. It used real data to identify relevant deductions about the spread of COVID-19. The real density of the population was taken into account in the simulated city. Each run could be repeated thirty times and the value of the parameters and results were taken as the average of these 30 runs. Indeed, the suggested simulator is a multidimensional interactive real-time graphical simulator relying on real data as an input, which facilitates carrying out the experiments, collecting the obtained results, and injecting real data in the process of simulation to obtain more realistic predictions.

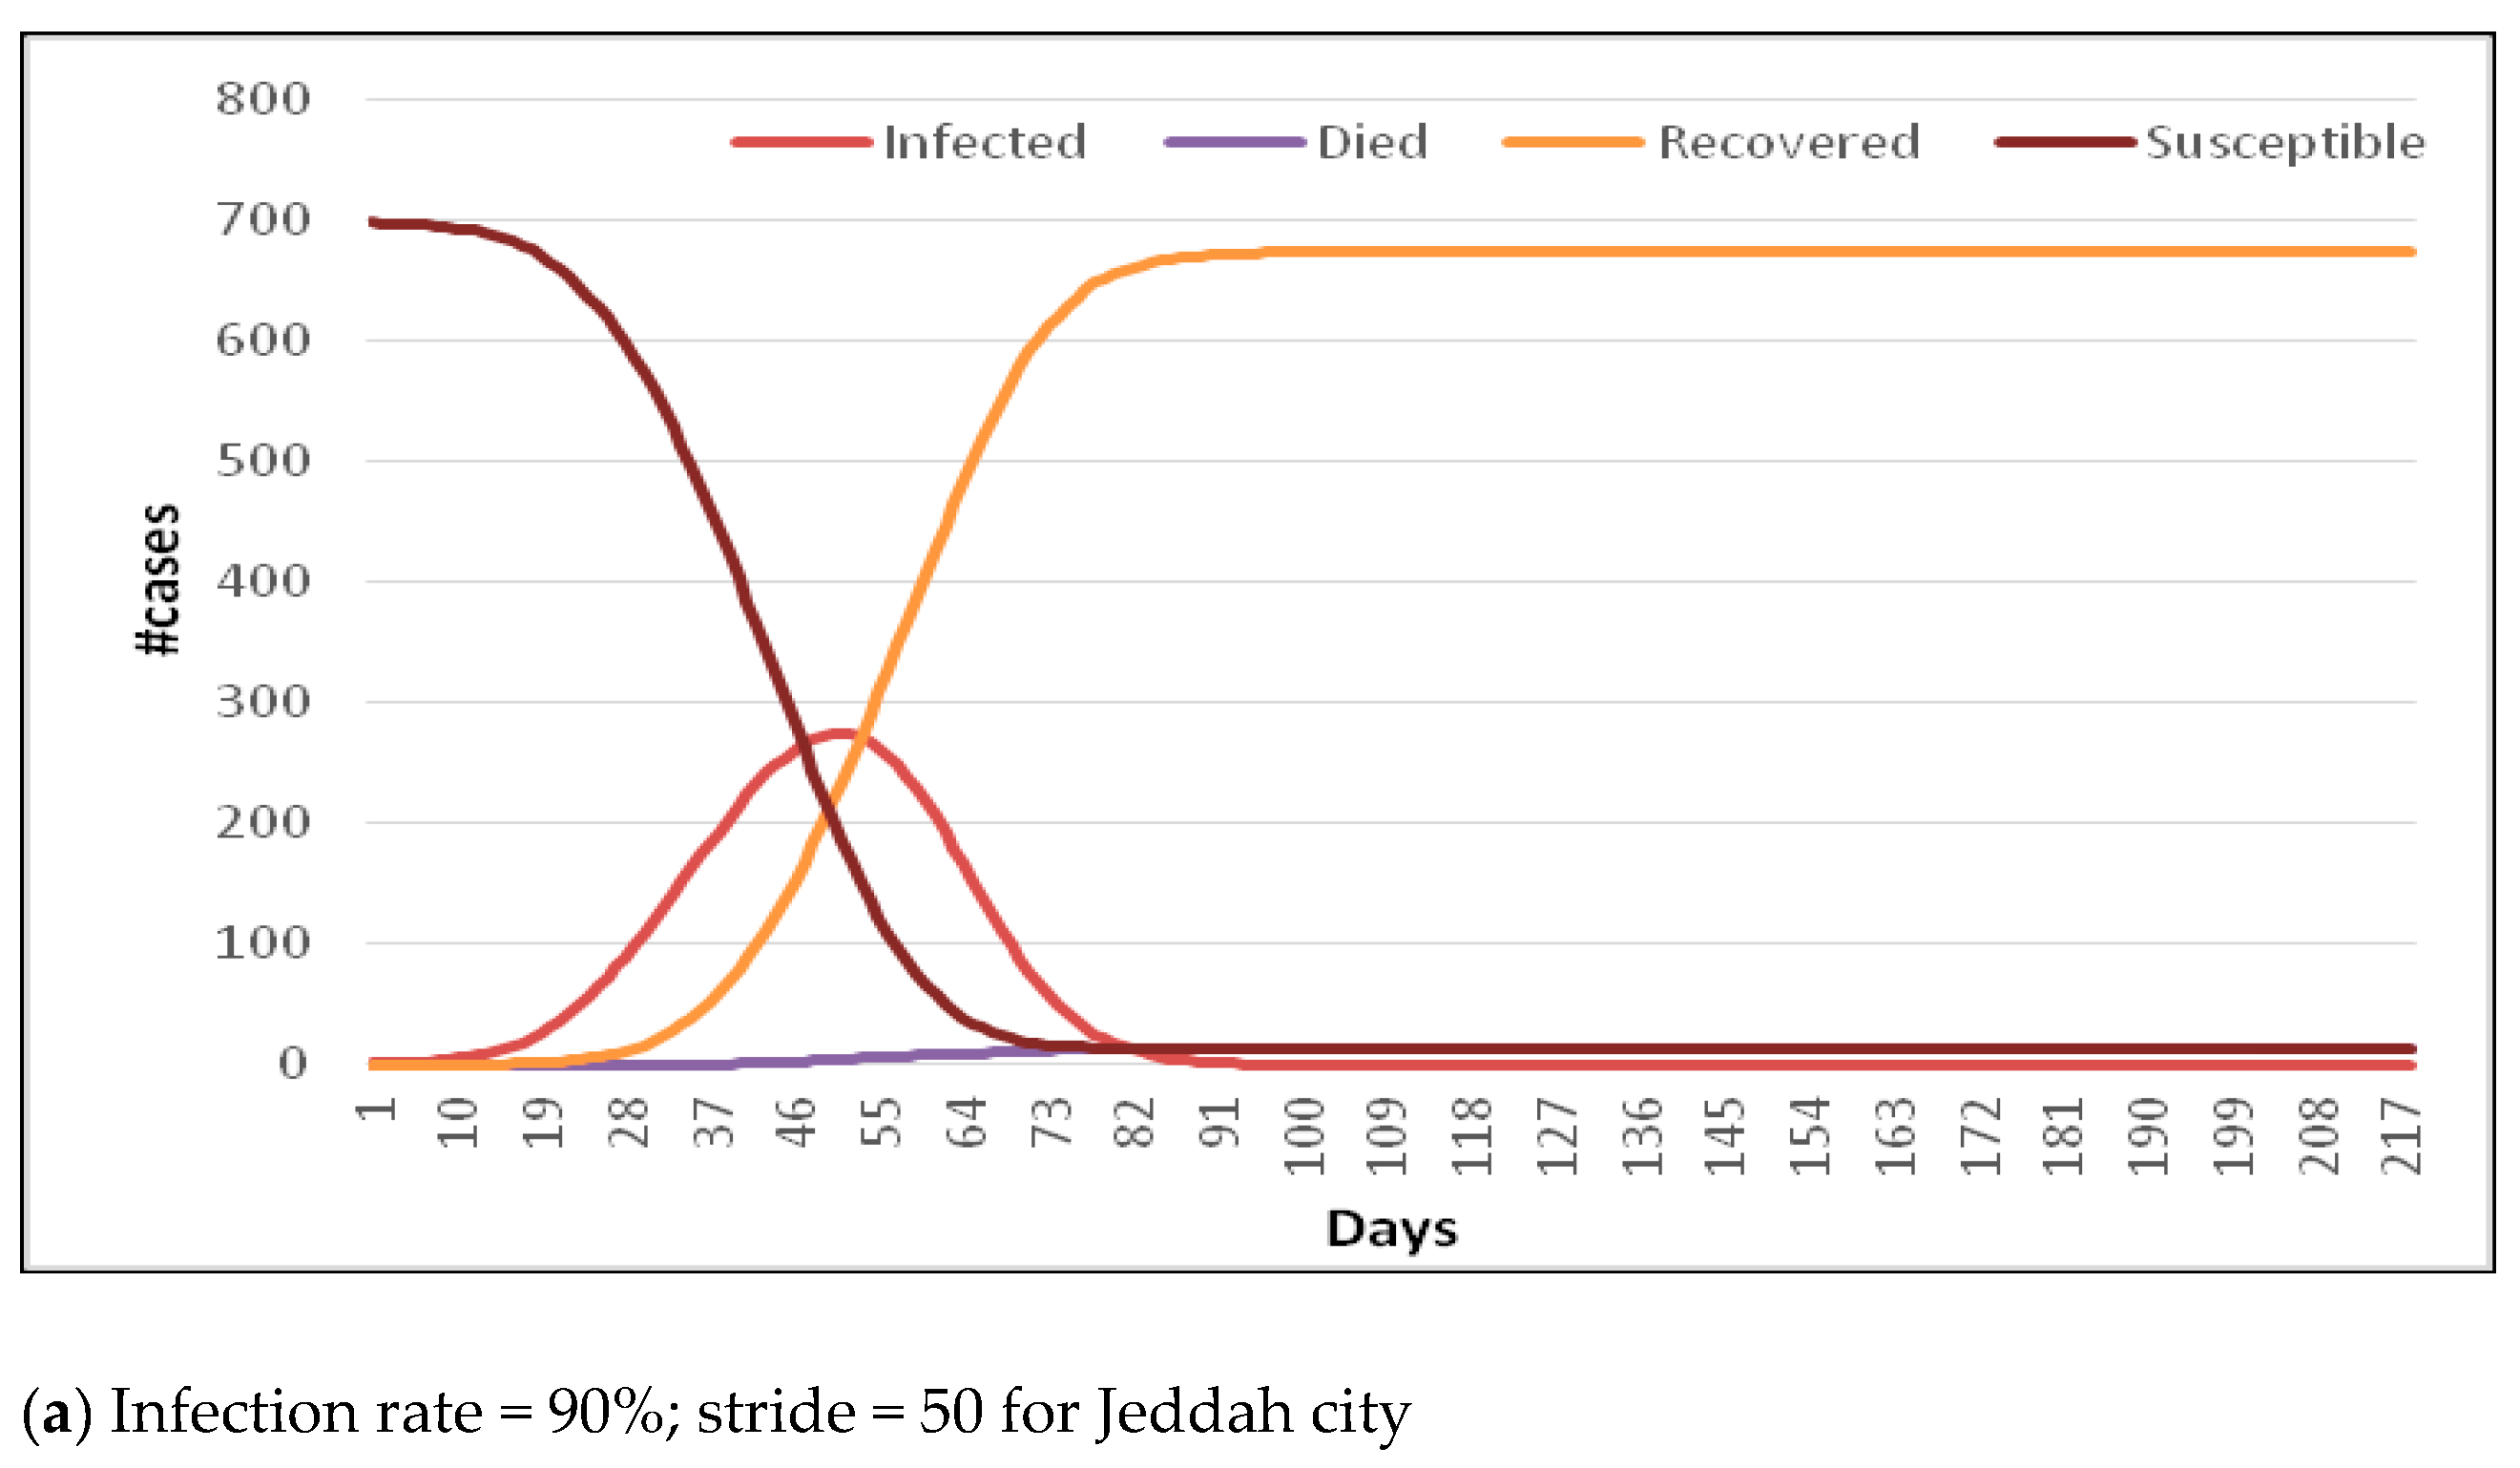
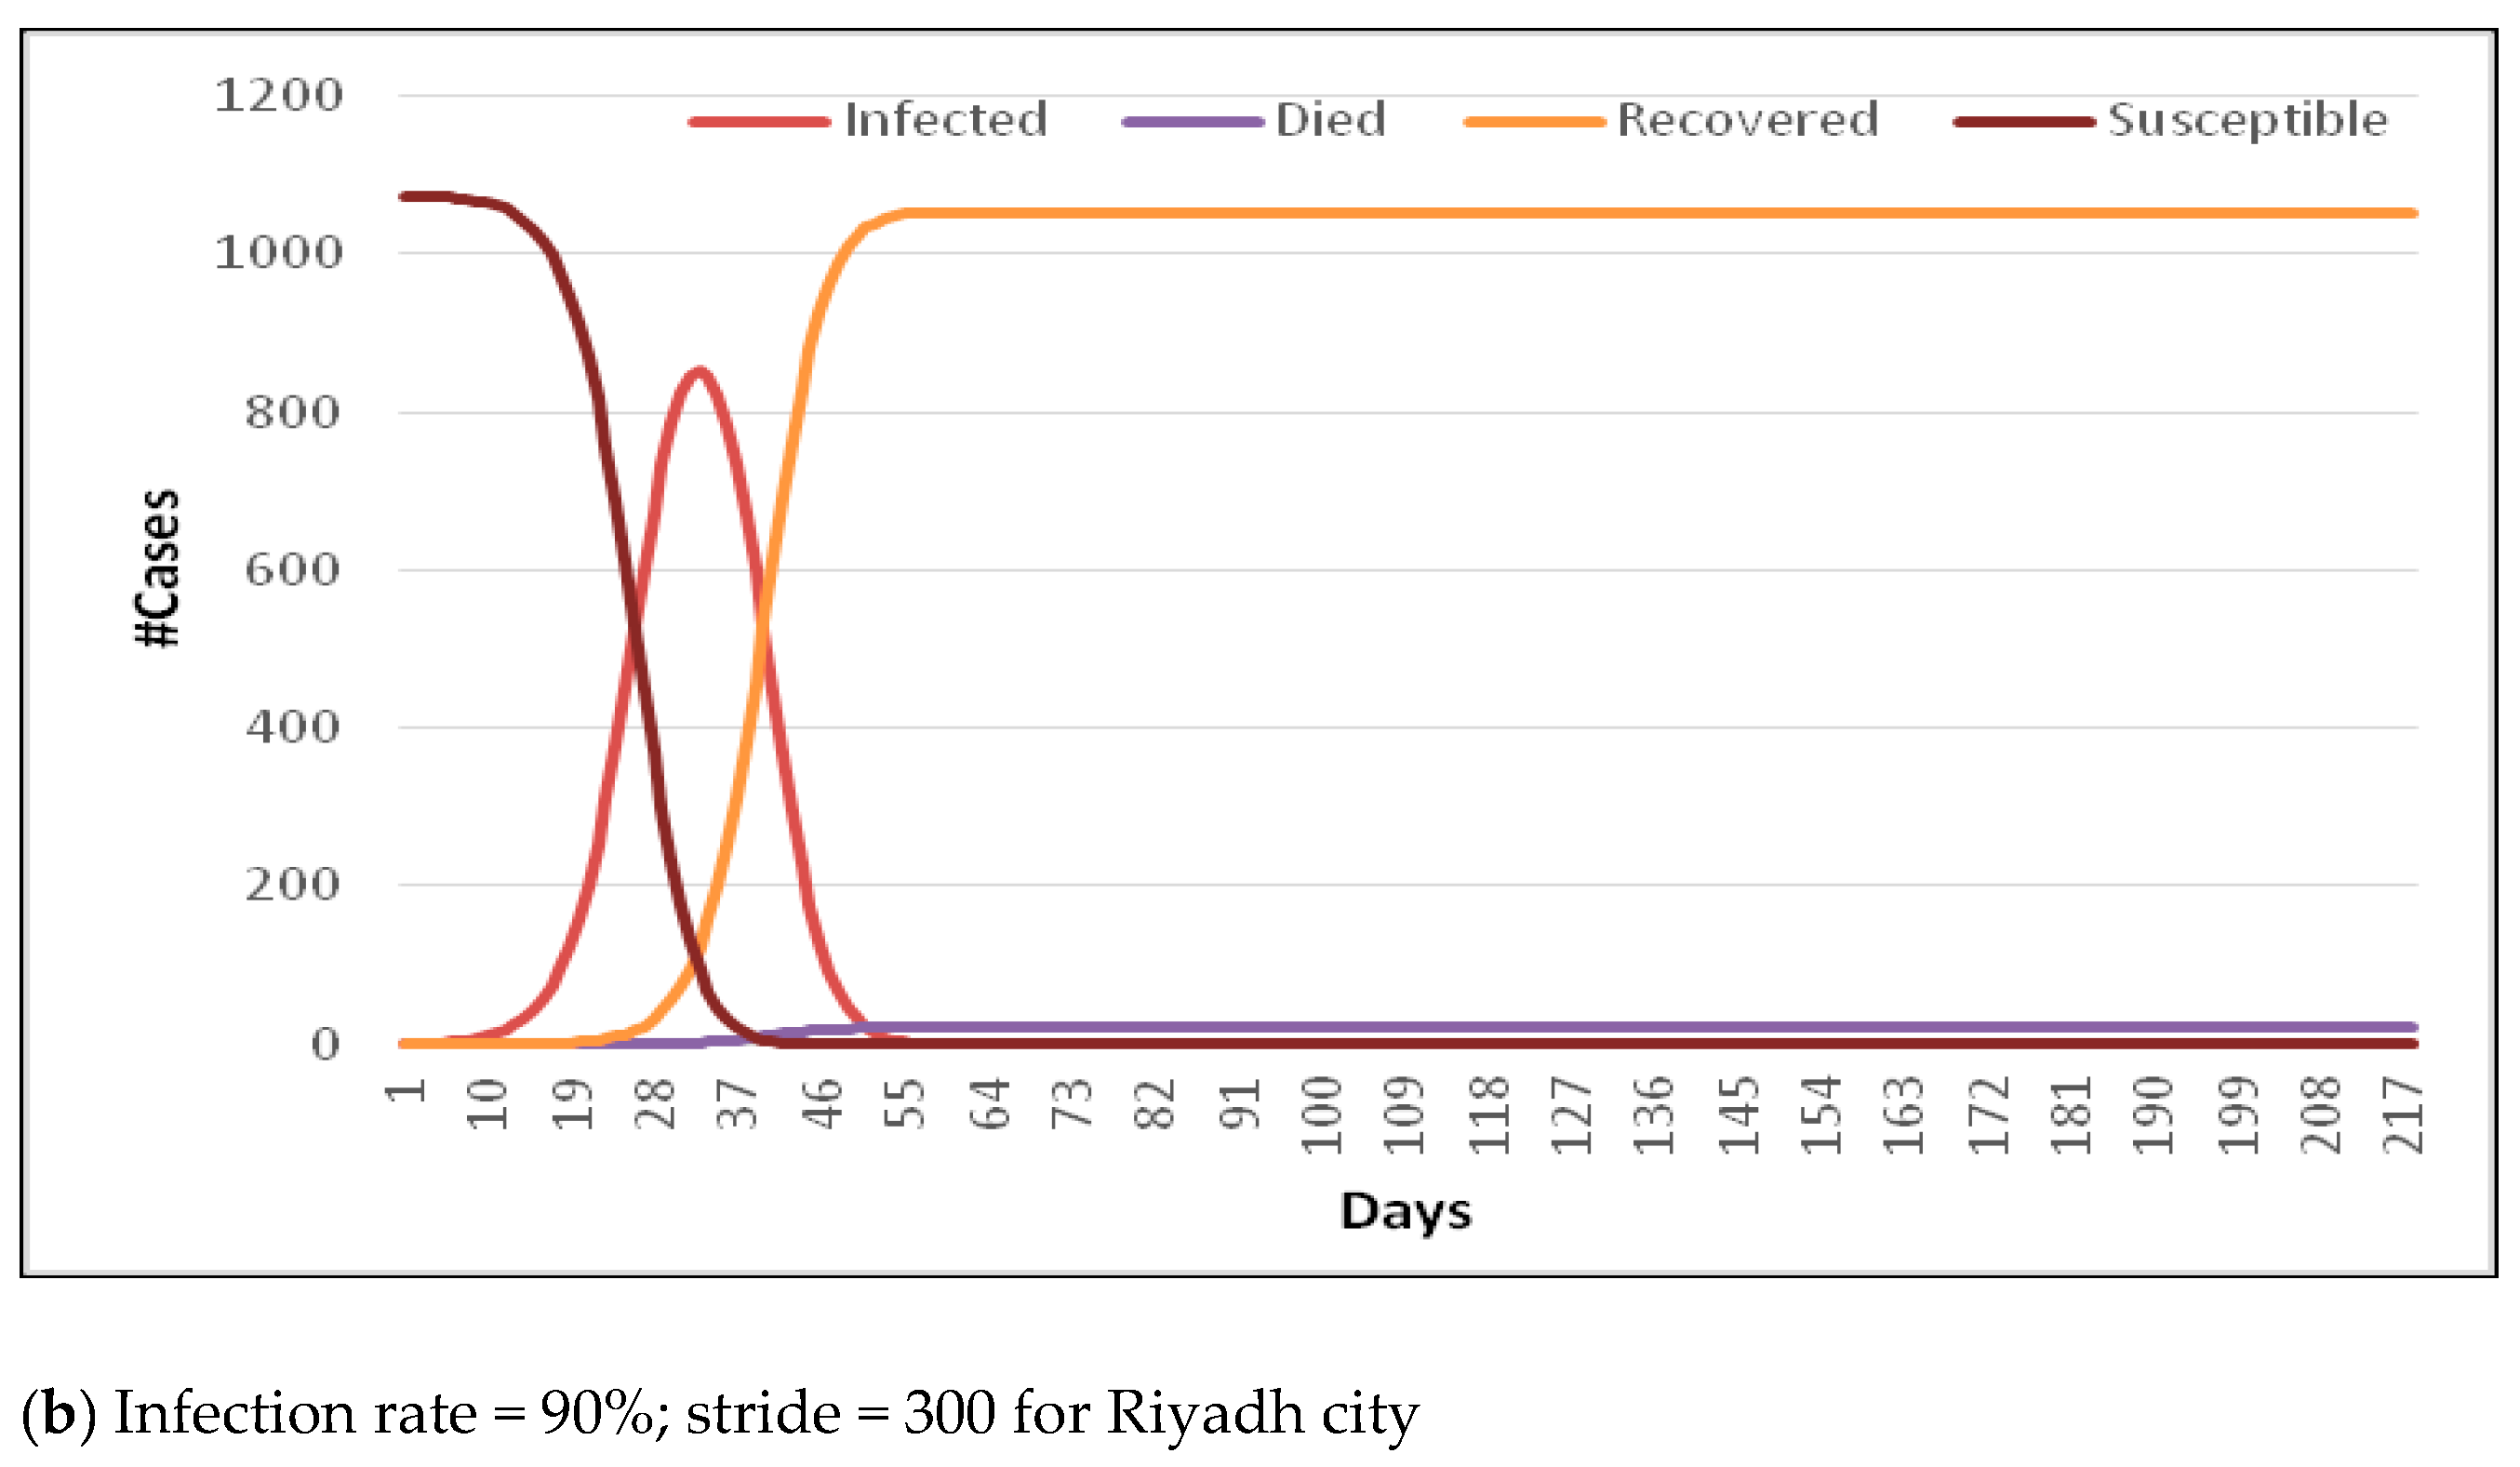
4.1. Scenarios of Simulation

Simulations used the data taken from the two main Saudi cities—Jeddah and Riyadh. To compute the needed area for each city, the density of the population was calculated. Then, it was scaled down to a 500 × 500 m2 area to facilitate the visualization of the results. The population of Riyadh city is 7.731 million people inhabiting a surface of 1798 square kilometers (km2). The density of the population is about 4300 people per km2. Thus, the area of the simulation was set to 500 × 500 m2. Thus, the population will be 4300/4 = 1075 people for an area of 500 × 500 m2. For Jeddah, since its area covers 1600 km2 and its population is 4.471 million people, the density of the population is 2794 people per km2. Therefore, the estimated population for the simulation is 2794/4 = 699 for an area of 500 × 500 m2. This tuning, based on a real situation, made the results of infection more significant. For each city, two scenarios were executed: high versus low movement and high versus low hygiene. The results were provided using the following two strategies:
-
Measuring the infection day by day with a normal random walk;
-
Measuring the infection during the previous three days with random walks in infected locations.
The factors used in the simulations are illustrated in Table 2.
The recovery rate was set to 95.89%, which represents the recovery rate in KSA in September 2020, according to [41]. The value of the parameter “infection rate” or infection probability used in our model was set to 90% because the rate of infection is very high according to [42].

4.1.1. Scenario 1: Assuming That the Locations from the Previous Day(s) Are Not Contaminated

In both cities (Jeddah and Riyadh), if there is an infected subject, with little movements of people (±10 m) and a small infection rate (10%), he/she will recover after 14 days without infecting any other person. This result is logical because of the reduced contact between people within the social distance. It is also in compliance with the official and medical advice regarding the minimum social distance and hygiene. Nevertheless, if the random movement and the infection rate are both high, contamination will increase dramatically.
In Figure 1a, using the indicated values of parameters, it can be observed that the virus infects 427 subjects out of 1075 at a maximum on day 54. However, if this number is scaled up to meet the size of the population in Riyadh, then hundreds of thousands of infected cases will be recorded by day 50. The curve of the infected cases indicates the high speed of the spread of the virus. Figure 1b indicates that if the stride (movement) increases in all directions from 50 m to 300 m, 456 people out of 1075 will be infected by day 49. This result was also expected since the rise in the number of movements may lead to a high number of infected people. These preliminary statistics were broadcasted on media to make the Saudi officials and public awareness of the dramatic situation caused by the pandemic. The simulation predicted that COVID-19 will come to end if the precautions are respected. Moreover, the area density influences the speed of the pandemic spread. Since the population of Jeddah is less than that of Riyadh, it was expected to be less infected by the pandemic, as demonstrated in Figure 2a.

4.1.2. Scenario 2: Assuming That the Locations from the Previous Three Days Are Contaminated

In this scenario, the locations were assumed to be visited by infected people during the last three days. Hence, any person moving to this position might be infected (with an “infection rate” probability). In these cases, with a low movement (below 10 m) and low infection rate (around 10%), the obtained findings are encouraging regarding the number of infections near zero. Nevertheless, with higher movement (±50 m) and higher infection levels (±300 m), a more dramatic situation will occur, and half of the population will be infected in a short time. For Jeddah, the results obtained in scenario 2 are much worse than those of scenario 1 because of the high number of infected locations in scenario 2. However, as shown in this scenario, the situation in Jeddah (Figure 3) is better than that in Riyadh (Figure 4) due to the lower population density in the first city.
In the above-discussed scenarios, the main application was presented, and the public awareness role of the proposed simulator was highlighted. The obtained results and statistics show that the suggested simulator is useful for the officials to make the right decisions to control the pandemic.

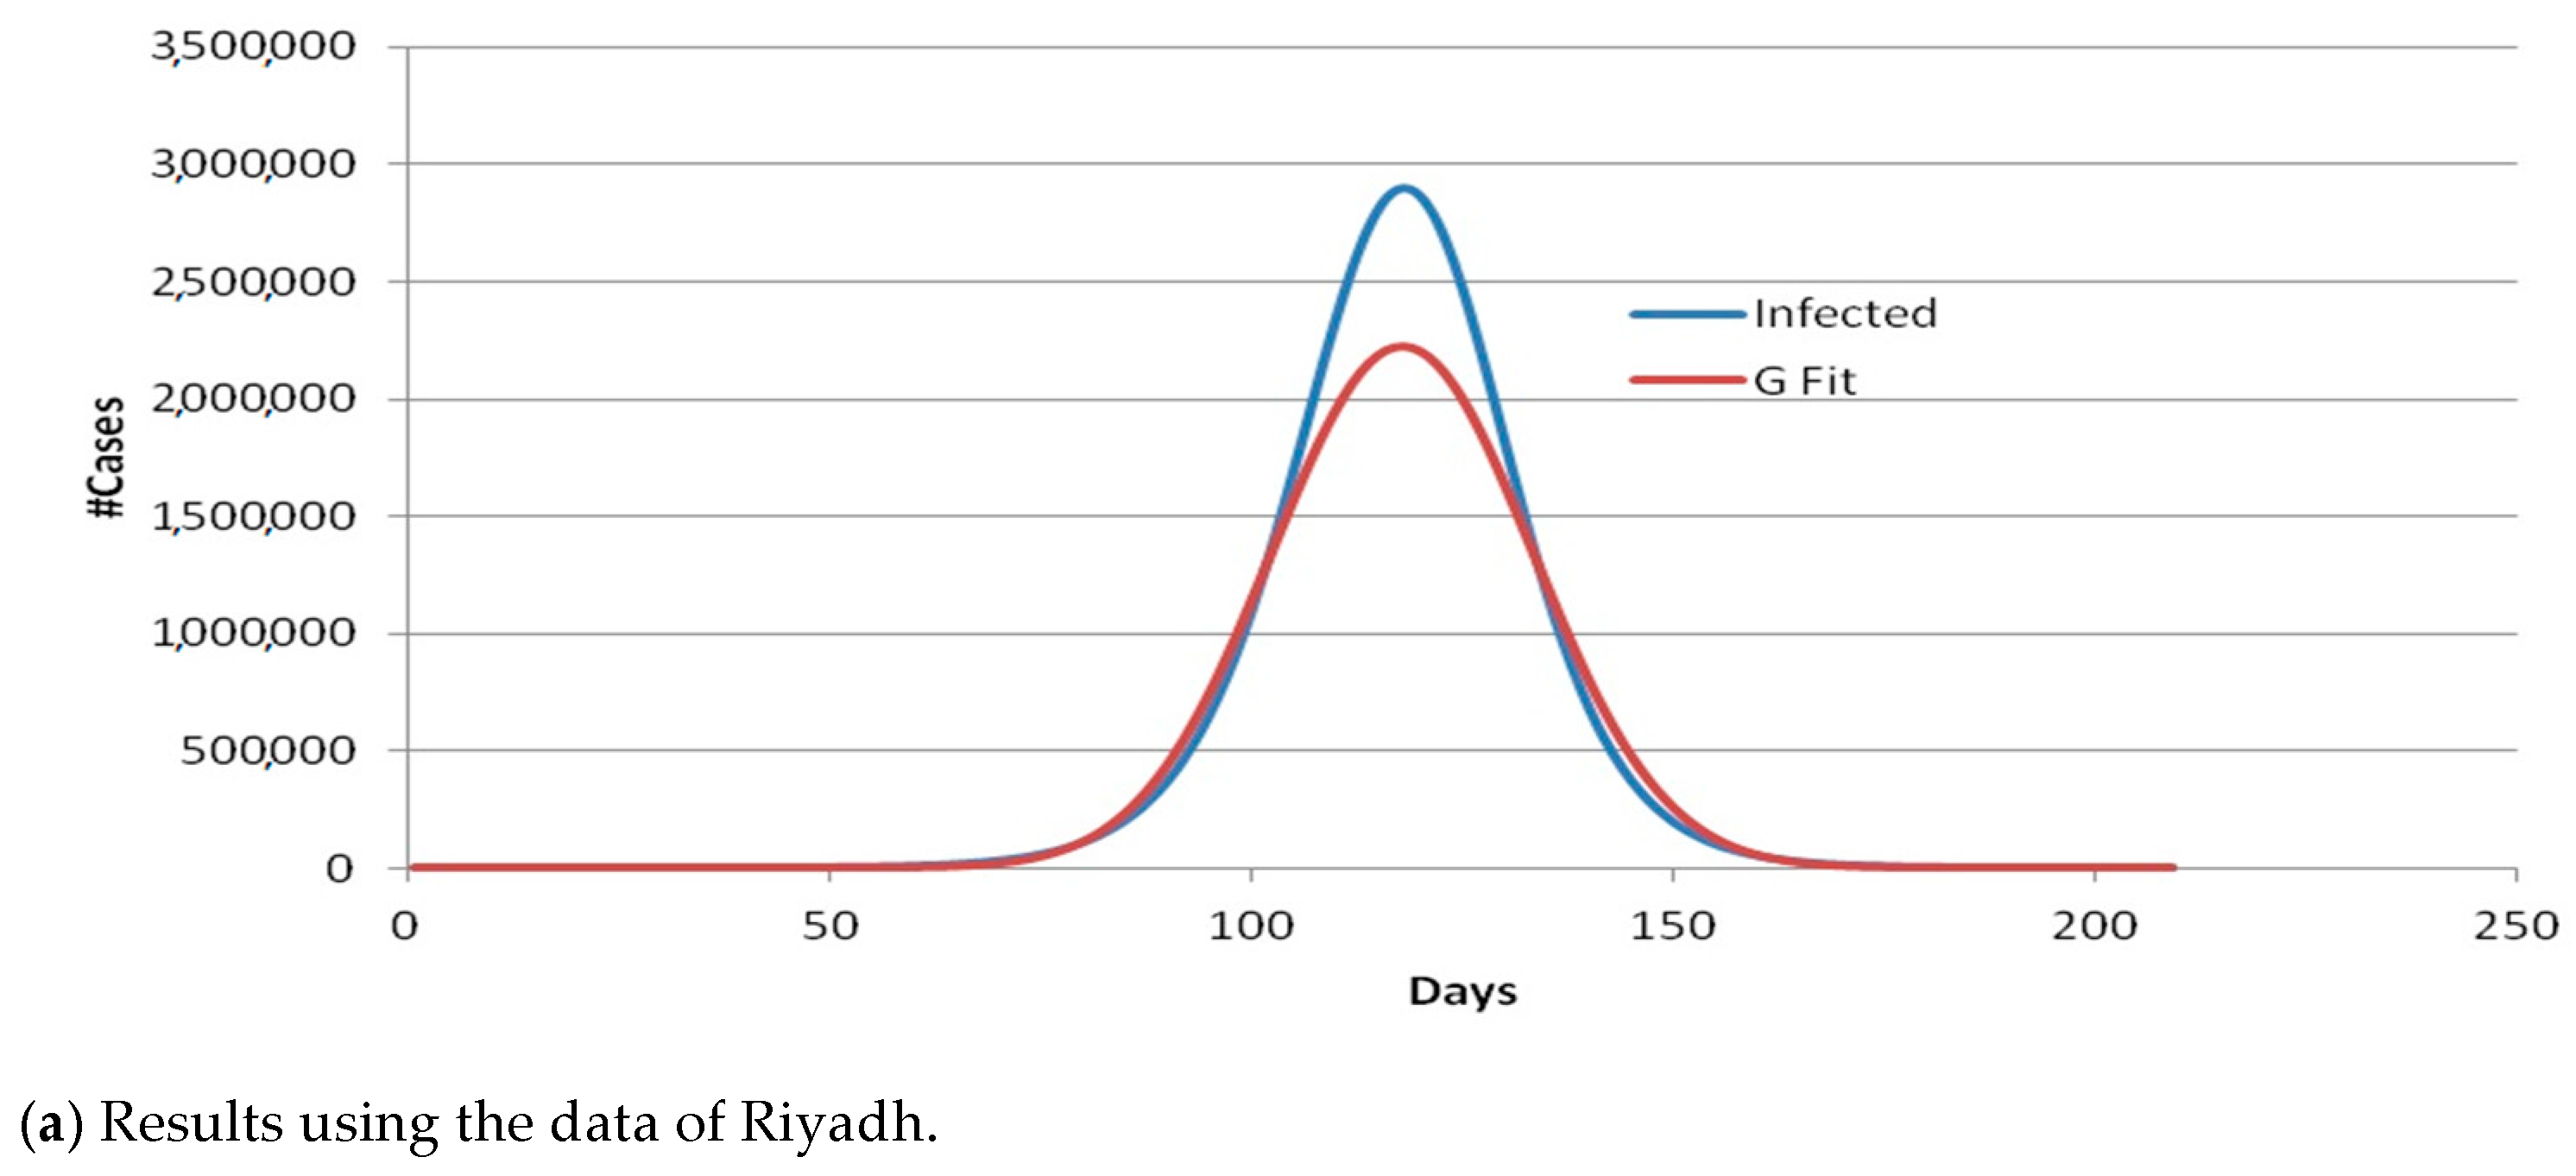
4.2. Regression Analysis of Data

To evaluate the performance of the suggested simulator better and further understand and deeply interpret the pandemic situation in KSA, real COVID-19 data about the infected cases were collected from the same two cities (Jeddah and Riyadh) during 209 days (from 13 March 2020 to 7 October 2020) together with the total number of cases in KSA for the same period. As shown in Figure 5, the infected cases almost follow a Gaussian distribution. Therefore, simple regression analysis such as linear, exponential, or polynomial regressions based on real data cannot be used for short-term forecasting [43,44]. Hence, we utilized Gaussian curve fitting (Gfit) to generate a mathematical function that can predict the real data of the infected people and to compare their results with those given by the simulator.
The Gaussian Function is represented as follows:
Y = A · e ( ( x B ) 2 2 C 2 )
where x is the day (input), C denotes the standard deviation, B represents the center of the peak position, and A corresponds to the curve height.
We used the Microsoft Excel Solver to fit the real data of infected cases in KSA obtained for 209 days (Riyadh and Jeddah) to three Gaussian functions. Subsequently, these data were employed for the short-term forecast. The best Gaussian function is the one that minimizes the difference between the actual data and the forecasted data. In fact, the Gaussian function that fits the data of the city of Riyadh is as follows:
Y = 1020 e ( ( x 87 ) 2 2 ( 19.7 ) 2 )
and for Jeddah, it is
Y = 405.9 e ( ( x 81 ) 2 2 ( 31 ) 2 )
while for KSA, it is
Y = 3470 e ( ( x 102 ) 2 2 ( 38 ) 2 )
By compensating for x in Equations (2)–(4) representing the day of forecasting, the forecast data were obtained on the right side of Table 3. The real dates of infection of infected people were collected from the Saudi Ministry of Health [45,46]. As shown in Figure 5 and revealed by the predicted results presented in Table 3, the three curves fit a specific Gaussian function with 0.89, 0.73, and 0.82 R square (R2) values, for KSA, Riyadh, and Jeddah, respectively. High R2 values and Gaussian curve with one peak demonstrate that the pandemic reached its peak and started to flatten its curves in two major cities (Riyadh and Jeddah) and in KSA in general. The predicted infected cases for the next 14 days for both Riyadh and Jeddah are all equal to zero, as revealed in Table 3, due to the best fit of the Gaussian curves for these cities since it approaches the x-axis, as can be seen in Figure 5.
The obtained results comply with those of the previous simulations in terms of the shape of the curves (See Figure 1, Figure 2, Figure 3, Figure 4 and Figure 5) since all of the simulated data and the real data of the infected cases follow a Gaussian distribution. However, previous findings cannot be compared with the GFit results because the used small population involves a small sample area (0.25 km2).
The whole population of 7.7315 million and 4.471 million inhabiting the area of 1798 km2 and 1600 km2 for Riyadh and Jeddah, respectively, was studied by scaling down on the simulator area. The height and width of the simulator are 40,000 m and 42,403 m for Jeddah and Riyadh, respectively. Since the examined data were obtained for 209 days, the simulator was executed for 209 days starting with three infected persons in Riyadh and one person in the case of Jeddah. Figure 6 illustrates the simulation results representing the number of infected cases in Riyadh and Jeddah. The parameters setting is as follows: stride = 2901 m, infection rate = 95%, and the number of infectious days is equal to three.
The simulation results were not expected to match the regression results since each method depends on several factors. In fact, the simulation results rely on a set of stochastic parameters, while the GFit methods are based only on the historical data. Moreover, a large number of COVID-19 infected people did not develop any symptoms or light symptoms, and therefore, they were not officially reported. In this work, we are interested in examining the trend of the curve of infected cases. Table 4 shows the R2 values for the GFit method on each of the reported and simulated data for both cities. The higher the value of R2 is, the more considerable the variation of the independent variable “day” varies. This observation can be explained by the change of the independent variable “number of infections” [47] since R2 is the correlation between the actual real cases and the predicted ones. As can be inferred from Table 4 and Figure 5 and Figure 6, the curve of the infected cases (both actual and simulated data) follows a Gaussian distribution and starts to flatten around day 150, showing better control of the pandemic in KSA, compared with the early stage of the pandemic spread and with the worldwide daily cases. It is noteworthy that the curve of the infected cases worldwide has not flattened yet, and it formed many peaks, particularly after alleviating the lockdown measures worldwide. Figure 7 illustrates the daily worldwide cases of COVID-19 from 1 January 2020 to 24 April 2021.

4.3. One-Day Prediction Results

The suggested simulator gave forecasting for a given number of days. For one-day prediction, we used a set of time series forecasting methods applied in [48]. These techniques include simple moving average (SMA) [49], weighted MA, and exponential-smoothing (ES) [50,51]. Pinball loss function (PLF) was utilized to assess the prediction results. PLF can be calculated as follows:
PLF ( y , z ) = { ( y z ) µ , y     z   ( z y ) ( 1 µ ) ,   z > y  
where µ = 0.95 is the target quantile, z denotes the predicted value, and y designates the real data.
Table 5 shows the one-day prediction results obtained using WMA and SMA with different periods starting from 1 day to 10 days moving average (simple or weighted). The prediction was performed based on the previous real infected cases for KSA, Jeddah, and Riyadh to predict the next-day infected cases, starting from day 1 to predict day 2, until we reach day 209. Then, the PLF was recorded for each predicted and actual number of cases per day along the time series, and the average PLF was calculated to evaluate the performance of each method. Table 6 illustrates the prediction results of the ES method using nine values of alpha (0.1 to 0.9).
The average values of PLF show that the forecasting results of ES and ES are almost the same. Both WMA and ES outperform the SMA strategy, while WMA is less efficient than ES.
ES, WMA, and SMA are parametric prediction methods that require specifying these parameters (period or alpha), as shown in Table 5 and Table 6. Therefore, a nonparametric technique that uses the whole history was applied, in the performed experiments, to predict one-day values (number of cases). It is similar to the WMA, while it differs from it in the weight and in the used time period. Here, there is no specific period of prediction since the method employs all available data (starting from the current day back to day one where it offered a higher weight (2) to the current value and reduced it by half as it went down in days). If the time series is long, the weight approaches may be decayed to zero due to the floating-point precision in the actual computers. To resolve this problem, the minimum weight was assigned to all remaining values in the time series. The suggested predictor was calculated as follows:
x d + 1 = w 1 x d + w 2 x d 1 + w 3 x d 2 + + w n x d n + 1 w 1 + w 2 + w 3 + + w n
where w 1 = 2 , w 2 = w 1 2 , w 3 = w 2 2 , , w n = w n 1 2 , and xd is the value of the time series at the day d, down to day 1 (d − n + 1). n is the number of days. n is set to 209 days in our experiments.
The results were compared with a recent prediction strategy proposed in the literature to identify the number of COVID-19 infected cases [52]. This predictor was computed as follows:
x d + 1 = x d ( 1 + G Δ )
and
G Δ = 1 m d = n m n 1 ( x d   x d 1 1 )
where n is the number of days equal to 209 and m designates the number of history days of prediction. Results indicate a good performance of prediction of infected cases if m is between 7 and 14 [52]. In our experiments, the data obtained in 7 days were used to predict the data that will be provided on the 8th day in the time series functions.
The prediction findings of our method were compared first to the results presented in [52] and then to the best findings providing by some traditional methods (ES, WMA, and SMA obtained from Table 5 and Table 6). Table 7 illustrates the average PLF obtained after applying the prediction methods.
It is concluded, from Table 7, that the prediction error provided by the suggested method is inferior to that obtained by other methods. The average PLF is smaller than that computed by other techniques as all data items were used in the time series to predict the number of infected cases. Hence, our method is efficient in predicting the COVID-19 infected cases and can be applied for forecasting purposes in other domains.

5. Discussion and Interpretations

Since the current Saudi data is different from that of the early days of the pandemic, we changed the methodology used in our previous work [33] to be compatible with the current data. The current data are following a Gaussian-like shape, while in the early days of the pandemic, the data were following a linear-like shape. Therefore, we used a Gaussian fit analysis of the collected real data. Additionally, this provides more realistic results as shown in the previous sections. Moreover, more data (209 days compared to 14 days) is more likely to provide more realistic prediction results, particularly, from a time series perspective, based on which we used a new prediction method (see Equation (6)), which is experimentally proved to be performing better than other simple time series analysis methods [33] and one of the recent state-of-the-art methods [52]. One of the advantages of this study is that it works on real data of the pandemic in a specific country. However, some similar works found in the literature were not handling real data. Other studies were conducted in some countries where it is difficult to generalize the focus of these studies to the KSA.
In this section, the reasons for the success of measures set in KSA, compared to other countries, are also assessed and analyzed: Indeed, almost the same measures were taken in neighboring countries such as UAE and Kuwait. Unfortunately, after few months, only the KSA kept low infection rates due to the continuous closure of the flight traffic. Moreover, compared with Iran, which did not close its religious holy places since the beginning, the KSA succeeded in avoiding a big peak in the number of infected cases. Another reason explaining that the same measures were efficient in KSA but inefficient in other countries is the absence of common public transport in KSA and the fast closure of Saudi schools just after the outbreak of COVID-19 in March 2020. Indeed, comparing the strategies followed by countries to fight COVID-19 could provide an insight on when and how containment methods should be introduced and which are the most effective containment techniques. In this regard, various approaches were used to assess the COVID-19 evolution, and several decisions were taken in different countries. The authors in [53] highlighted the experience of Taiwan in fighting COVID-19, and how this country has considered COVID-19 since its appearance as a health disaster that requires a global urgent preventive plan. This study also focused on the governmental and nongovernmental engagement and the partnership, providing good results regarding the fight of COVID-19. Moreover, the authors in [54] examined the measures taken in Nigeria to fight the spread of COVID-19. The study indicated that vitamin D improves the immunity in COVID-19 patients.
This paper highlighted the high concern about COVID-19 among the Saudi authorities. It illustrates the main efforts taken to reduce the probability of infection and the social and economic impact of the pandemic. Efficient measures and precautions were achieved by the SMOH. Moreover, the performed studies show the high level of awareness of residents of Saudi Arabia about the basic knowledge and necessary practices to fight against COVID-19. Indeed, the obligation to wear masks, other severe sanctions for non-wearers, the rapid closure of borders with the most affected countries, and the dynamic update of the list of these infected countries were the most effective measures taken to reduce the number of infected people and the spread of this pandemic in KSA. Moreover, the timing of taking the decisions was very relevant and directly influenced the total number of infected cases. The importance of this timing was clear, especially by comparing the time of the closure of religious places in KSA to the decision of closure taken in other nearby countries. Indeed, the action loses its effect totally and quickly (in a few days) if it is not made at the appropriate time. Regarding false taken measurements, it can be concluded that the total reliance on the awareness of people cannot be always the perfect solution to fight pandemics. Thus, the decisions and actions proposed by the Saudi authorities, covering a wide range of financial, medical, social, and educational fields, may be used to design a permanent protocol and an early response strategy to fight against future pandemics.

6. Conclusions

Since the appearance of the health crisis caused by COVID-19, the Saudi government has taken several preventive decisions. Statistics show that the most affected cities in KSA are Riyadh, Mecca, and Jeddah. In this paper, the circumstances leading to successful control of the pandemic in Saudi Arabia were illustrated and discussed. Afterward, the preventive and curative measures taken in KSA were compared to those applied in other countries. We also explained why these preventive measures were not efficiently applied to control the pandemic in other countries. Then, a prediction of the evolution of the pandemic in KSA was proposed.
The COVID-19 spread in KSA was investigated in this study through several practical scenarios. A new forecasting simulator was also created to assimilate the trend of COVID-19 spread using the data of Riyadh and Jeddah, the two main cities in KSA. The findings obtained in the different scenarios indicate that adjusting some parameters, such as the population movement (walking distance), social distance, and the infection rate may considerably reduce the number of infections, therefore affecting public lives. Thus, the suggested simulator plays an important role in making members of the public and officials more aware of the seriousness of the next waves of COVID-19 or even other future possible pandemics. Relying on the simulation outputs and the Gaussian fit analysis of the collected real data, it is obvious that the curve representing the number of infected cases is flattening and converging to a relatively very small value. This observation indicates that the KSA succeeded in controlling the pandemic spread, and there is a great awareness among the Saudi public and officials about the seriousness of the pandemic spread. Hence, it is recommended that officials in KSA should keep their control procedures and urge the citizens to maintain hygienic standards and social distance and reduce the movements. The suggested simulator can be used by the Saudi authorities to enhance the control of the pandemic spread and establish a protocol for the management of critical future crises. In addition, the proposed prediction method can be also used effectively to predict the number of infected cases and for general prediction purposes as well.
One possible limitation of this study is that the proposed methods need to be compared with all the methods found in the literature to prove their efficiency. In addition, the proposed methods need to be tested on data from other countries to show that the proposed methods can be generalized for other cases and not only the KSA case. Therefore, as future direction, we aim also to implement the simulation and prediction models discussed in the related works in order to further compare them to our proposed model to prove its efficiency in controlling next COVID-19 waves, in KSA and other regions in the world, and perhaps, possible future pandemics. In addition, we are waiting to reach a good level of vaccination in KSA to add a set of new parameters such as the vaccination rate and its relation with the vaccination acceptance by the population. In fact, comparing the results of our model considering these new parameters with the real data of vaccinated people in KSA after few months will prove the efficiency and robustness of our model on resolving other pandemics.

Author Contributions

Data curation, A.B.H., S.M. and G.A.; Formal analysis, A.B.H., S.M., M.A., K.A. and M.A.A.; Funding acquisition, A.B.H., M.A., K.S.A., O.C. and K.A.; Investigation, O.C., G.A., M.A., A.S.T., M.A.A. and H.A.; Methodology, A.B.H., S.M., K.A., O.C. and M.A.; Project ad-ministration, A.B.H., S.M.; Resources, M.A., A.S.T., M.A.A. and H.A.; Software, O.C., S.M., G.A.; Visualization, G.A., M.A.A.; Writing original draft, A.B.H., S.M., M.A.A., K.A., G.A., M.A. and A.S.T. All authors have read and agreed to the published version of the manuscript.

Funding

This research was funded by the University of Tabuk, KSA, under the project having Grant Number 56-1441.

Institutional Review Board Statement

Not applicable.

Informed Consent Statement

Not applicable.

Data Availability Statement

Code and data are downloadable from the following links: Real, regression, and prediction data: https://cloud.irit.fr/index.php/s/RifB6av2GQFRJc3. Accessed on 25 April 2021. Source-code (C#): https://cloud.irit.fr/index.php/s/0sJwOThy91Bm35D. Accessed on 25 April 2021.

Acknowledgments

Omar Cheikhrouhou thanks Taif university for its support under the project Taif University Researchers, supporting project number (TURSP-2020/55), Taif University, Taif, Saudi Arabia.

Conflicts of Interest

The authors declare no conflict of interest.

Ethics Statements

Ethics Statement approved.

References

  1. Li, Q.; Guan, X.; Wu, P.; Qun, L.; Xuhua, G.; Peng, W.; Xiaoye, W.; Lei, Z.; Yeqing, T.; Ruiqi, R.; et al. Early transmission dynamics in Wuhan, China, of Novel Coronavirus—Infected pneumonia. N. Engl. J. Med. 2020, 382, 1199–1207. [Google Scholar] [CrossRef]
  2. Koenig, K.L.; Bey, C.K.; McDonald, E.C. 2019-nCoV: The Identify-Isolate-Inform (3I) Tool Applied to a Novel Emerging Coronavirus. West. J. Emerg. Med. 2020, 21, 184–190. [Google Scholar] [CrossRef] [PubMed]
  3. Huang, C.; Wang, Y.; Li, X.; Ren, L.; Zhao, J.; Hu, Y.; Zhang, L.; Fan, G.; Xu, J.; Gu, X. Clinical features of patients infected with 2019 novel coronavirus in Wuhan, China. Lancet 2020, 395, 497–506. [Google Scholar] [CrossRef] [Green Version]
  4. WHO Coronavirus Disease (COVID-19) Dashboard. 2021. Available online: https://covid19.who.int (accessed on 3 April 2021).
  5. Official Statistics of the Saudi Ministry of Health. 2021. Available online: https://www.moh.gov.sa/en/ (accessed on 3 April 2021).
  6. Chudik, A.; Mohaddes, K.; Pesaran, M.H.; Raissi, M.; Rebucci, A.A. Counterfactual Economic Analysis of Covid-19 Using a Threshold Augmented Multi-Country Model; Cambridge Working Papers in Economics 2088; Faculty of Economics, University of Cambridge: Cambridge, UK, 2020. [Google Scholar]
  7. Althobaity, H.M.; Alharthi, R.A.; Altowairqi, M.H.; Alsufyani, Z.A.; Aloufi, N.S.; Altowairqi, A.E.; Alqahtani, A.S.; Alzahrani, A.K.; Abdel-Moneim, A.S. Knowledge and awareness of Middle East respiratory syndrome coronavirus among Saudi and Non-Saudi Arabian pilgrims. Int. J. Health Sci. 2020, 11, 20–25. [Google Scholar]
  8. AlMofada, S.K.; Alherbisch, R.J.; AlMuhraj, N.A.; Almeshary, B.N.; Alrabiah, B.; Al Saffan, A.; Baseer, M.A. Knowledge, Attitudes, and Practices Toward COVID-19 in a Saudi Arabian Population: A Cross-Sectional Study. Cureus 2020, 12, e8905. [Google Scholar] [CrossRef]
  9. Shi, Y.; Wang, Y.; Shao, C.; Huang, J.; Gan, J.; Huang, X.; Bucci, E.; Piacentini, M.; Ippolito, G.; Melino, G. COVID-19 infection: The perspectives on immune responses. Cell Death Differ. 2020, 27, 1451–1454. [Google Scholar] [CrossRef] [PubMed] [Green Version]
  10. Xiong, H.; Yan, H. Simulating the Infected Population and Spread Trend of 2019-nCov Under Different Policy by EIR Model. Ssrn Electron. J. 2020. [Google Scholar] [CrossRef]
  11. Wu, J.T.; Leung, K.; Leung, G.M. Nowcasting and forecasting the potential domestic and international spread of the 2019-nCoV outbreak originating in Wuhan, China: A modelling study. Lancet 2020, 395, 689–697. [Google Scholar] [CrossRef] [Green Version]
  12. Read, J.M.; Bridgen, J.R.; Cummings, D.A.; Ho, A.; Jewell, C.P. Novel coronavirus 2019-nCoV: Early estimation of epidemi-ological parameters and epidemic predictions. medRxiv 2020, 34, 126–139. [Google Scholar]
  13. Rhodes, T.; Lancaster, K.; Rosengarten, M. A model society: Maths, models and expertise in viral outbreaks. Crit. Public Health 2020, 30, 253–256. [Google Scholar] [CrossRef]
  14. Li, T. Simulating the Spread of Epidemics in China on the Multi-layer Transportation Network: Beyond the Coronavirus in Wuhan. arXiv 2020, arXiv:2002.12280. [Google Scholar]
  15. Yang, Q.; Yi, C.; Vajdi, A.; Cohnstaedt, L.W.; Wu, H.; Guo, X.; Scoglio, C.M. Short-term forecasts and long-term mitigation evaluations for the COVID-19 epidemic in Hubei Province, China. Infect. Dis. Model. 2020, 5, 563–574. [Google Scholar] [CrossRef] [PubMed]
  16. Estrada, M.A.R. The Monitoring of COVID-19 Infected Cases by Continent under the Application of MDNIDC-Mapping Simulator. Ssrn Electron. J. 2020. [Google Scholar] [CrossRef]
  17. Mnasri, S.; Nasri, N.; Val, T. The Deployment in the Wireless Sensor Networks: Methodologies, Recent Works and Applications. In Proceedings of the International Conference on Performance Evaluation and Modeling in Wired and Wireless Networks (PEMWN 2014), Sousse, Tunisia, 4–7 November 2014. [Google Scholar]
  18. Mnasri, S.; Abbès, F.; Zidi, K.; Ghedira, K. A multi-objective hybrid BCRC-NSGAII algorithm to solve the VRPTW. In Proceedings of the 13th International Conference on Hybrid Intelligent Systems (HIS 2013), Gammarth, Tunisia, 4–6 December 2013; pp. 60–65. [Google Scholar]
  19. Tarawneh, A.S.; Hassanat, A.B.; Celik, C.; Chetverikov, D.; Rahman, M.S.; Verma, C. Deep Face Image Retrieval: A Comparative Study with Dictionary Learning. In Proceedings of the 2019 10th International Conference on Information and Communication Systems (ICICS), Irbid, Jordan, 11–13 June 2019; pp. 185–192. [Google Scholar]
  20. Mnasri, S.; Zidi, K. A heuristic approach based on the multi-agents negotiation for the resolution of the DDBAP. In Proceedings of the 4th In-ternational Conference on Metaheuristic and Nature Inspired Computing, Sousse, Tunisia, 27–31 October 2012. [Google Scholar]
  21. Mnasri, S.; Nasri, N.; Van Den Bossche, A.; Val, T. A Comparative analysis with validation of NSGA-III and MOEA/D in re-solving the 3D indoor redeployment problem in DL-IoT. In Proceedings of the 2017 International Conference on Internet of Things, Embedded Systems and Communications (IINTEC), Gafsa, Tunisia, 20–22 October 2017; pp. 15–20. [Google Scholar]
  22. Fong, S.J.; Li, G.; Dey, N.; Crespo, R.G.; Herrera-Viedma, E. Composite Monte Carlo decision making under high uncertainty of novel coronavirus epidemic using hybridized deep learning and fuzzy rule induction. Appl. Soft Comput. 2020, 93, 106282. [Google Scholar] [CrossRef] [PubMed]
  23. Zhu, H.; Guo, Q.; Li, M.; Wang, C.; Fang, Z.; Wang, P.; Tan, J.; Wu, S.; Xiao, Y. Host and infectivity prediction of Wuhan 2019 novel coronavirus using deep learning algorithm. BioRxiv 2020. [Google Scholar] [CrossRef] [Green Version]
  24. Chang, S.L.; Harding, N.; Zachreson, C.; Cliff, O.M.; Prokopenko, M. Modelling transmission and control of the COVID-19 pandemic in Australia. Nat. Commun. 2020, 11, 1–13. [Google Scholar] [CrossRef] [PubMed]
  25. Zhang, Y.; Yu, X.; Sun, H.; Tick, G.R.; Wei, W.; Jin, B. COVID-19 infection and recovery in various countries: Modeling the dynamics and evaluating the non-pharmaceutical mitigation scenarios. arXiv 2020, arXiv:2003.13901. [Google Scholar]
  26. Zia, K.; Farooq, U. Covid-19 outbreak in pakistan: Model-driven impact analysis and guidelines. arXiv 2020, arXiv:2004.00056. [Google Scholar]
  27. Anastassopoulou, C.; Russo, L.; Tsakris, A.; Siettos, C. Data-based analysis, modelling and forecasting of the COVID-19 out-break. PLoS ONE 2020, 15, e0230405. [Google Scholar] [CrossRef] [Green Version]
  28. Li, R.; Lu, W.; Yang, X.; Feng, P.; Muqimova, O.; Chen, X.; Wei, G. Prediction of the Epidemic of COVID-19 Based on Quar-antined Surveillance in China. medRxiv 2020. [Google Scholar] [CrossRef]
  29. Silva, P.C.; Batista, P.V.; Lima, H.S.; Alves, M.A.; Guimarães, F.G.; Silva, R.C. COVID-ABS: An agent-based model of COVID-19 epidemic to simulate health and economic effects of social distancing in-terventions. Chaossolitons Fractals 2020, 139, 110088. [Google Scholar] [CrossRef]
  30. Ivanov, D. Predicting the impacts of epidemic outbreaks on global supply chains: A simulation-based analysis on the coronavirus outbreak (COVID-19/SARS-CoV-2) case. Transp. Res. Part. E Logist. Transp. Rev. 2020, 136, 101922. [Google Scholar] [CrossRef] [PubMed]
  31. Bartsch, S.M.; Ferguson, M.C.; McKinnell, J.A.; O’Shea, K.J.; Wedlock, P.T.; Siegmund, S.S.; Lee, B.Y. The Potential Health Care Costs and Resource Use Associated With COVID-19 In The United States: A simulation estimate of the direct medical costs and health care resource use associated with COVID-19 infections in the United States. Health Aff. 2020, 10, 1377. [Google Scholar] [CrossRef] [PubMed] [Green Version]
  32. Weissman, G.E.; Crane-Droesch, A.; Chivers, C.; Luong, T.; Hanish, A.; Levy, M.Z.; Lubken, J.; Becker, M.; Draugelis, M.E.; Anesi, G.L.; et al. Locally Informed Simulation to Predict Hospital Capacity Needs During the COVID-19 Pandemic. Ann. Intern. Med. 2020, 173, 21–28. [Google Scholar] [CrossRef] [PubMed] [Green Version]
  33. Aseeri, M.; Hassanat, A.B.; Mnasri, S.; Tarawneh, A.S.; Alhazmi, K.; Altarawneh, G.; Alrashidi, M.; Alharbi, H.; Almohammadi, K.; Chetverikov, D.; et al. Modelling-based Simulator for Forecasting the Spread of COVID-19: A Case Study of Saudi Arabia. Int. J. Comput. Sci. Netw. Secur. 2020, 20, 114–125. [Google Scholar]
  34. WHO. Management of Ill Travelers at Points of Entry–International Airports, Seaports and Ground Crossings—In the Context of COVID-19 Outbreak: Interim Guidance; Technical Report; World Health Organization: Geneva, Switzerland, 2021. [Google Scholar]
  35. Q&A on Coronaviruses (COVID-19). Available online: https://www.who.int/news-room/q-a-detail/q-a-coronaviruses (accessed on 12 January 2021).
  36. Ma, S.; Zhang, J.; Zeng, M.; Yun, Q.; Guo, W.; Zheng, Y.; Zhao, S.; Wang, M.H.; Yang, Z. Epidemiological Parameters of COVID-19: Case Series Study. J. Med. Internet Res. 2020, 22, e19994. [Google Scholar] [CrossRef]
  37. Lu, Q.-B.; Zhang, Y.; Liu, M.-J.; Zhang, H.-Y.; Jalali, N.; Zhang, A.-R.; Li, J.-C.; Zhao, H.; Song, Q.-Q.; Zhao, T.-S.; et al. Epidemiological parameters of COVID-19 and its implication for infectivity among patients in China, 1 January to 11 February 2020. Eurosurveillance 2020, 25, 2000250. [Google Scholar] [CrossRef]
  38. Sun, C.; Zhai, Z. The efficacy of social distance and ventilation effectiveness in preventing COVID-19 transmission. Sustain. Cities Soc. 2020, 62, 102390. [Google Scholar] [CrossRef]
  39. Althoff, T.; Sosič, R.; Hicks, J.L.; King, A.C.; Delp, S.L.; Leskovec, J. Large-scale physical activity data reveal worldwide activity inequality. Nat. Cell Biol. 2017, 547, 336–339. [Google Scholar] [CrossRef]
  40. WHO. COVID-2019 Situation Reports. Available online: https://www.who.int/emergencies/diseases/novel-coronavirus-2019/situation-reports/ (accessed on 12 January 2021).
  41. Alyami, M.H.; Naser, A.Y.; Orabi, M.A.A.; Alwafi, H.; Alyami, H.S. Epidemiology of COVID-19 in the Kingdom of Saudi Arabia: An Ecological Study. Front. Public Health 2020, 8. [Google Scholar] [CrossRef]
  42. World Health Organization. Coronavirus Disease (COVID-19): How Is It Transmitted? 9 July 2020. Available online: https://www.who.int/emergencies/diseases/novel-coronavirus-2019/question-and-answers-hub/q-a-detail/q-a-how-is-covid-19-transmitted (accessed on 23 April 2021).
  43. Song, K.-B.; Baek, Y.-S.; Hong, D.H.; Jang, G. Short-Term Load Forecasting for the Holidays Using Fuzzy Linear Regression Method. IEEE Trans. Power Syst. 2005, 20, 96–101. [Google Scholar] [CrossRef]
  44. Johannesen, N.J.; Kolhe, M.; Goodwin, M. Relative evaluation of regression tools for urban area electrical energy demand forecasting. J. Clean. Prod. 2019, 218, 555–564. [Google Scholar] [CrossRef]
  45. COVID 19 Dashboard: Saudi Arabia. Available online: https://covid19.moh.gov.sa/en/ (accessed on 10 January 2021).
  46. COVID 19 Interactive Dashboard. Available online: https://covid19.cdc.gov.sa/daily-updates/ (accessed on 6 January 2021).
  47. Brown, A.M. A step-by-step guide to non-linear regression analysis of experimental data using a Microsoft Excel spreadsheet. Comput. Methods Programs Biomed. 2001, 65, 191–200. [Google Scholar] [CrossRef]
  48. Al-tarawneh, G.A. Prediction of stock price using a hybrid technical analysis method. Sci. Int. Lahore 2019, 31, 391–396. [Google Scholar]
  49. Hooker, R.H. Correlation of the Marriage-Rate with Trade. J. R. Stat. Soc. 1901, 64, 485–492. [Google Scholar]
  50. Brown, R.G.; Meyer, R.F. The Fundamental Theorem of Exponential Smoothing. Oper. Res. 1961, 9, 673–685. [Google Scholar] [CrossRef]
  51. Nejah, N.; Sami, M.; Thierry, V. 3D node deployment strategies prediction in wireless sensors network. Int. J. Electron. 2020, 107, 808–838. [Google Scholar] [CrossRef]
  52. Perc, M.; Miksić, N.G.; Slavinec, M.; Stožer, A. Forecasting COVID-19. Front. Phys. 2020, 8. [Google Scholar] [CrossRef] [Green Version]
  53. Lo, A.; Huang, J.-J.; Chen, C.-C.; Chou, F.H.-C.; Shieh, V. From biological safety to social safety: How Taiwan’s community centered prevention program controlled the COVID-19 outbreak. J. Glob. Health 2020, 10. [Google Scholar] [CrossRef]
  54. Ayanshina, O.A.; Adeshakin, A.O.; Afolabi, L.O.; Adeshakin, F.O.; Alli-Balogun, G.O.; Yan, D.; Essien-Baidoo, S.; Wan, X. Seasonal variations in Nigeria: Understanding COVID-19 transmission dynamics and immune responses. J. Glob. Health Rep. 2020, 4, e2020084. [Google Scholar] [CrossRef]
Figure 1. The prediction of the infected, dead, and susceptible cases of COVID-19 using different strides for Riyadh city with 1 day of infection.
Sustainability 13 04888 g001
Figure 2. The prediction of the infected, dead, and susceptible cases of COVID-19 under different strides for Jeddah city with 1 day of infection.
Sustainability 13 04888 g002aSustainability 13 04888 g002b
Figure 3. The prediction of the infected, dead, and susceptible cases of COVID-19 under different strides for Jeddah city with 4 day of infection.
Sustainability 13 04888 g003aSustainability 13 04888 g003b
Figure 4. The prediction of the infected, dead, and susceptible cases of COVID-19 under different strides for Riyadh city with 4 day of infection.
Sustainability 13 04888 g004aSustainability 13 04888 g004b
Figure 5. The Gaussian curve fitting for the number of infected cases in KSA, Riyadh, and Jeddah.
Sustainability 13 04888 g005aSustainability 13 04888 g005b
Figure 6. Simulation results using the whole population of Riyadh and Jeddah, respectively.
Sustainability 13 04888 g006aSustainability 13 04888 g006b
Figure 7. COVID-19 daily cases worldwide; data obtained online from Johns Hopkins University. Website: https://coronavirus.jhu.edu/map.html, accessed on 24 April 2021.
Sustainability 13 04888 g007
Table 1. Summary of the related methods.
MethodDescriptionLimitations
[13]Mathematical model (formulation of the spread rate)No use of real data.
[14]Simulation systemLimited applicability (cannot be generalized to study other countries).
[15]Markovian-based methodNon-Markovian methods are better to describe the current stage of the pandemic as the parameters COVID19 do not follow the Markovian distribution yet.
[16]Simulation systemNo use of real data.
[22]Simulation systemNo sufficient comparisons to validate the efficiency of the system.
[25]Simulation system (SEIR)Limited applicability (cannot be generalized to study other countries).
[26]Simulation system (SDIR)Lack of accuracy in the absence of the real number of infected cases.
[33]A Simulation system, linear regression, and simple time series predictionAnalyzed the Saudi data in the early 14 days of the pandemic spread only, when infected cases were increasing linearly, while it is not the case of the current data. Moreover, this study used simple time series analysis.
Table 2. Used parameters relying on real assumptions and values.
PropertyValue
Size of the random populationRiyadh: 1075
Jeddah: 699
Initial number of infected people1
Number of days for prediction of infection209
Infection rate/probability90%
Recovery rate95.89%
Remaining period of virus1 day (scenario 1)
4 days (scenario 2)
Social distance radius2 m
Delay100 ms
Stride ± xy (walking distance)Variable, (50,300)
Recovery period14 days [35]
Area500 × 500
Number of repeated simulations30
Table 3. The 14-day prediction of COVID-19 cases in KSA, Riyadh, and Jeddah using GFit.
DayKSARiyadhJeddah
2106200
2115800
2125300
2134900
2144600
2154200
2163900
2173600
2183300
2193100
2202800
2212600
2222400
2232200
Table 4. R2 values obtained by applying each method.
Reported DataSimulation Data
RiyadhJeddahRiyadhJeddah
Curve fitting0.730.820.9840.999
Table 5. SMA and WMA average PLF for 209 days in Riyadh, Jeddah, and KSA.
Period SMA WMA
RiyadhJeddahKSARiyadhJeddahKSA
131.0021.0262.3231.0021.0262.32
230.4619.9371.0530.0919.7466.68
332.8318.9080.4631.0619.0472.46
435.8319.8491.5032.6919.1679.48
538.3119.89103.3034.4119.3187.00
641.4820.28112.8836.2419.4793.89
744.3320.59122.3138.1119.53100.77
847.1621.05131.2739.9719.72107.45
949.6821.68140.4741.7020.10113.64
1052.1522.29149.1143.2420.46119.61
Minimum30.4618.9062.3230.0919.0462.32
Table 6. ES average PLF for 209 days in Riyadh, Jeddah, and KSA.
Alpha ES
RiyadhJeddahKSA
0.164.1726.08202.54
0.244.0421.26128.82
0.337.5519.64101.48
0.434.4219.1886.51
0.532.4819.0877.27
0.631.1819.1970.99
0.730.5019.4766.68
0.830.2519.8363.98
0.930.4020.3562.55
Minimum30.2519.0862.55
Table 7. Comparison of the average PLF for 209 days in Riyadh, Jeddah, and KSA, obtained by each method.
MethodRiyadhJeddahKSA
SMA30.518.962.3
WMA30.119.062.3
ES30.319.162.6
Literature25.719.159.8
Proposed16.39.638.8
Publisher’s Note: MDPI stays neutral with regard to jurisdictional claims in published maps and institutional affiliations.

